Characterization of cancer-driving nucleotides (CDNs) across genes, cancer types, and patients
- State Key Laboratory of Biocontrol, School of Life Sciences, Sun Yat-sen University, China
- Center for Excellence in Animal Evolution and Genetics, The Chinese Academy of Sciences, China
- GMU-GIBH Joint School of Life Sciences, Guangzhou Medical University, China
- CAS Key Laboratory of Quantitative Engineering Biology, Shenzhen Institute of Synthetic Biology, Shenzhen Institute of Advanced Technology, Chinese Academy of Sciences, China
- Cancer Center, Clifford Hospital, Jinan University, China
- Cancer Research Institute, School of Basic Medical Sciences, Southern Medical University, China
- Department of Ecology and Evolution, University of Chicago, United States
Figures
Figure 1
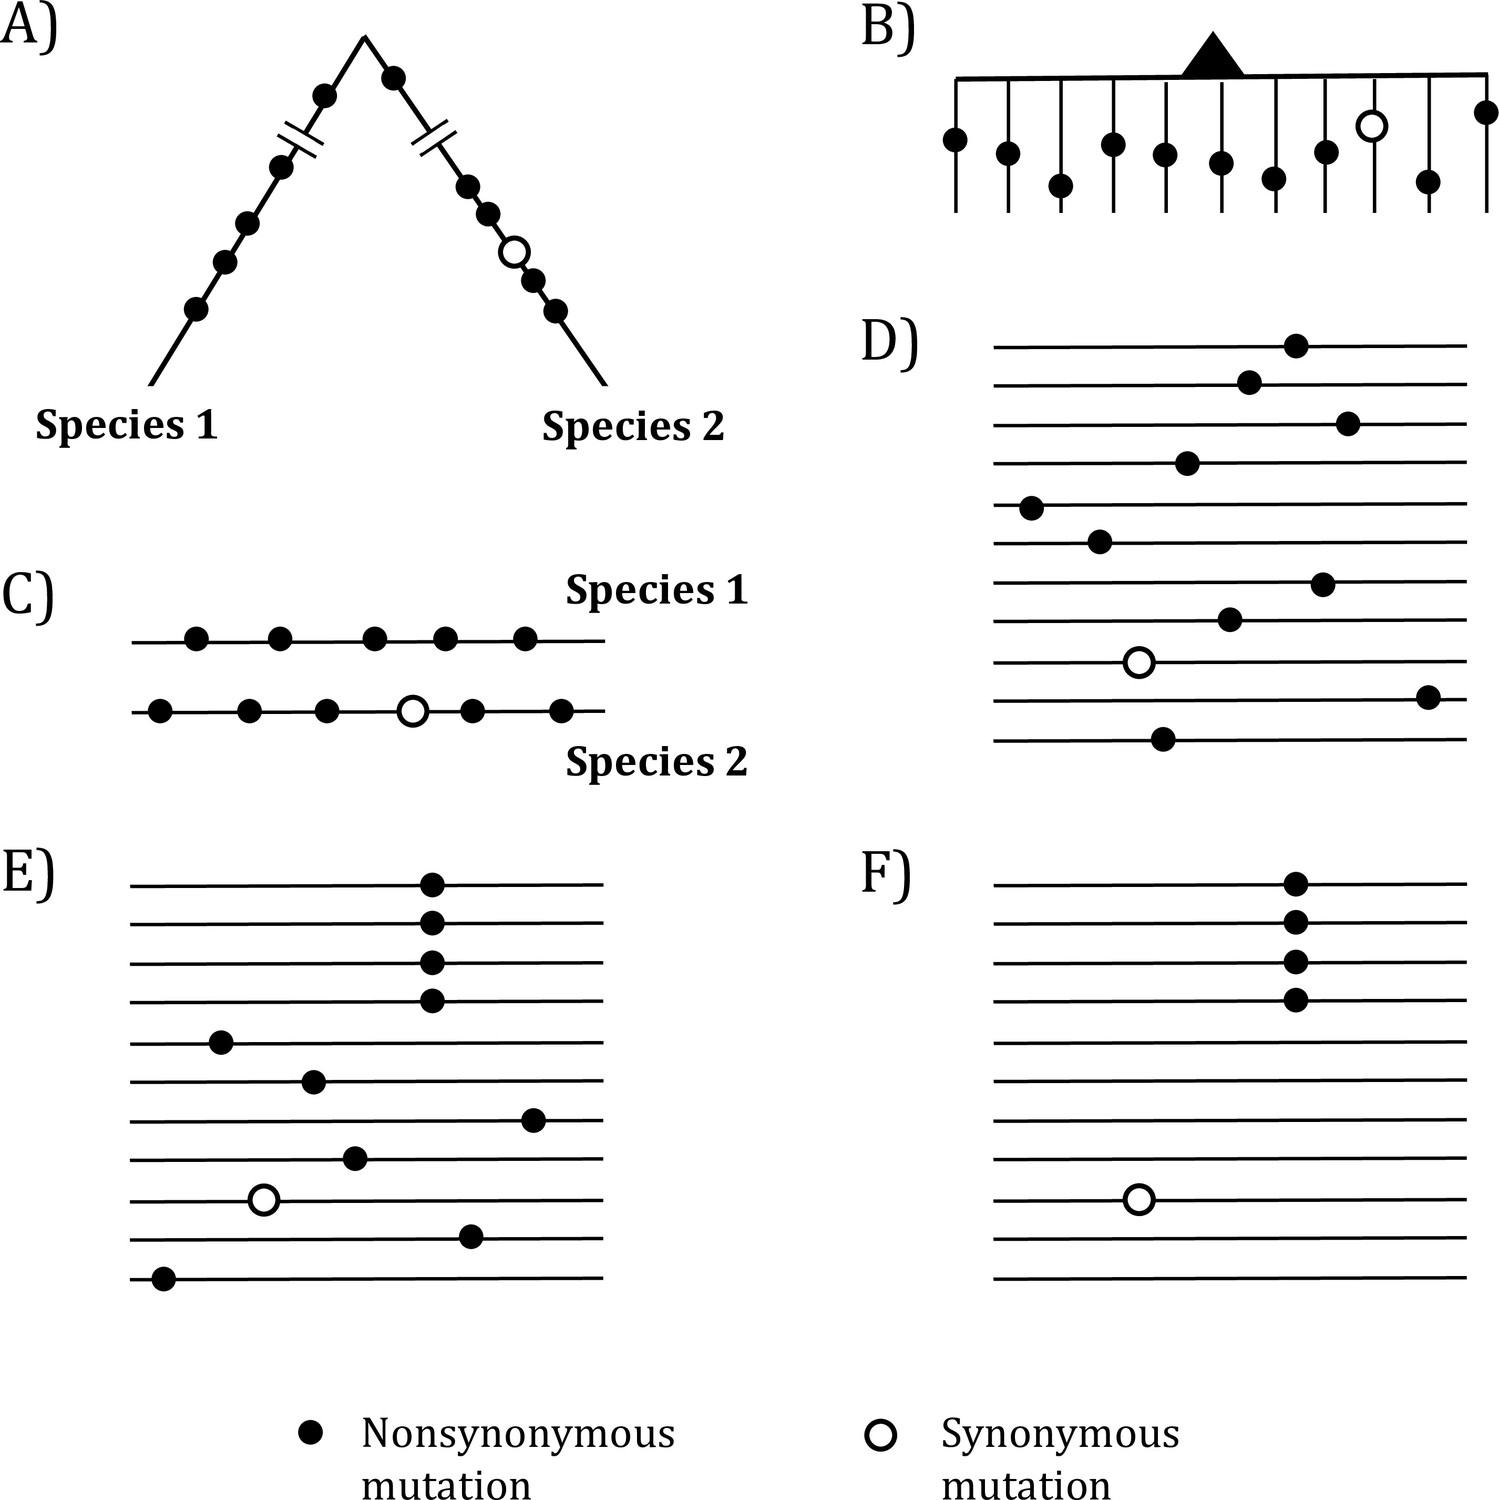
Mutations in organismal evolution vs. cancer evolution.
(A, B) A hypothetical example of DNA sequence evolution in organism vs. in cancer with the same number of mutations. (C) Mutation distribution in two species in the organismal evolution of (A). (D, E) Mutation distribution in cancer evolution among 10 sequences may have D and E patterns. (F) Another pattern of mutation distribution in cancer evolution with a recurrent site but shows too few total mutations. Mutations of (F) are cancer-driving nucleotides (CDNs) missed in the conventional screens.
Figure 2
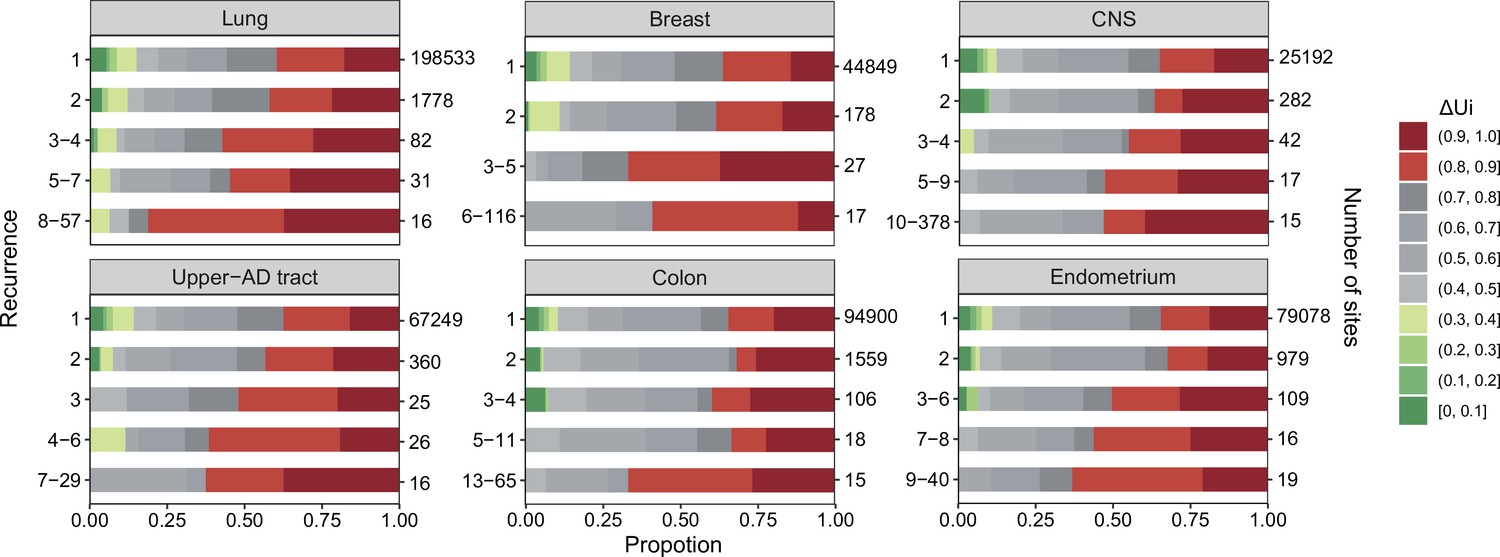
analysis across six cancer types.
, ranging between 0 and 1 (Tang et al., 2004; Chen et al., 2019a), is a measure of physico-chemical differences among the 20 amino acids (see the text). The most similar amino acids have near 0 and the most dissimilar ones have near 1. Each panel corresponds to one cancer type, with horizontal bar represents distribution of each recurrence group. The numbers on the left of the panel are i values and on the right are the number of sites. Note that the proportion of dark red segments increases as i increases. This figure shows that mutations at high recurrence sites (larger is) code for amino acids that are chemically very different from the wild type.
Figure 3
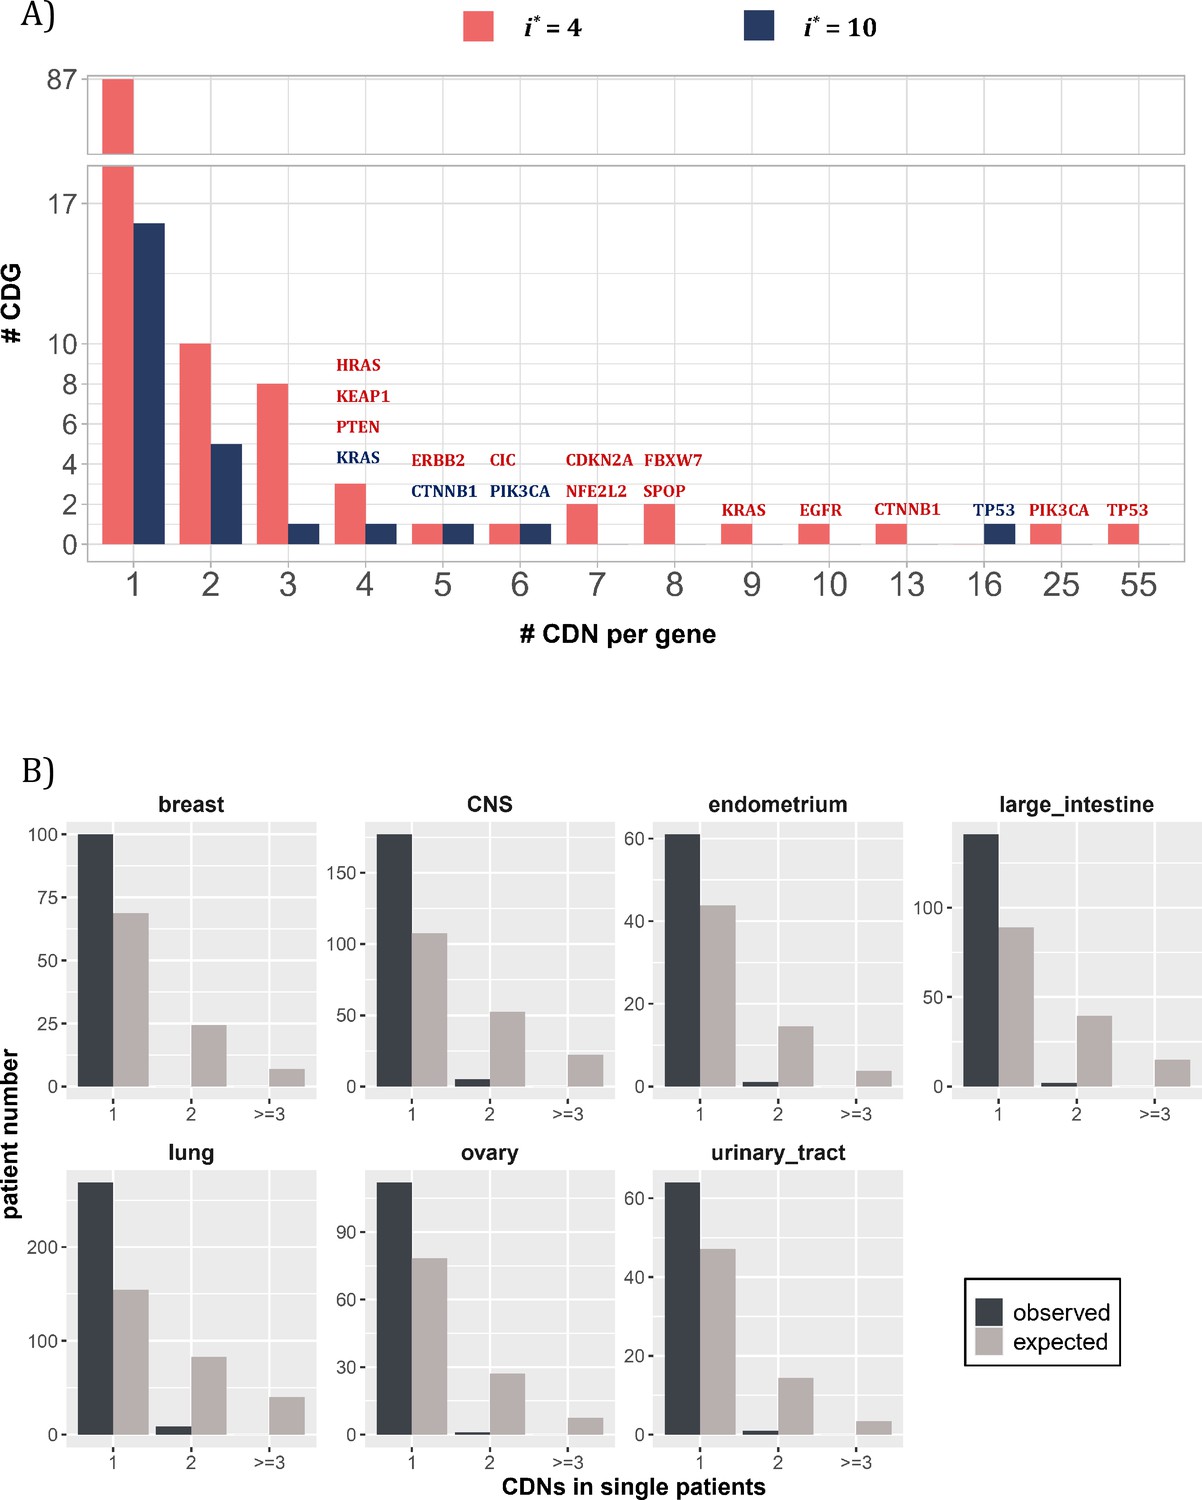
Distribution of cancer-driving nucleotides (CDNs) among genes.
(A) Out of 119 CDN-carrying genes (red bars), 87 have only one CDN. For the rest, TP53 possesses the most CDNs with three others having more than 10 CDNs. (B) CDN number in TP53 among patients. The dark bar represents the observed patient number with corresponding CDNs of the X-axis. The gray bar shows the expected patient distribution. Clearly, TP53 only needs to contribute one CDN to drive tumorigenesis. Hence, TP53 (and other canonical driver genes; see text), while prevalent, does not contribute disproportionately to the tumorigenesis of each patient.
Figure 4
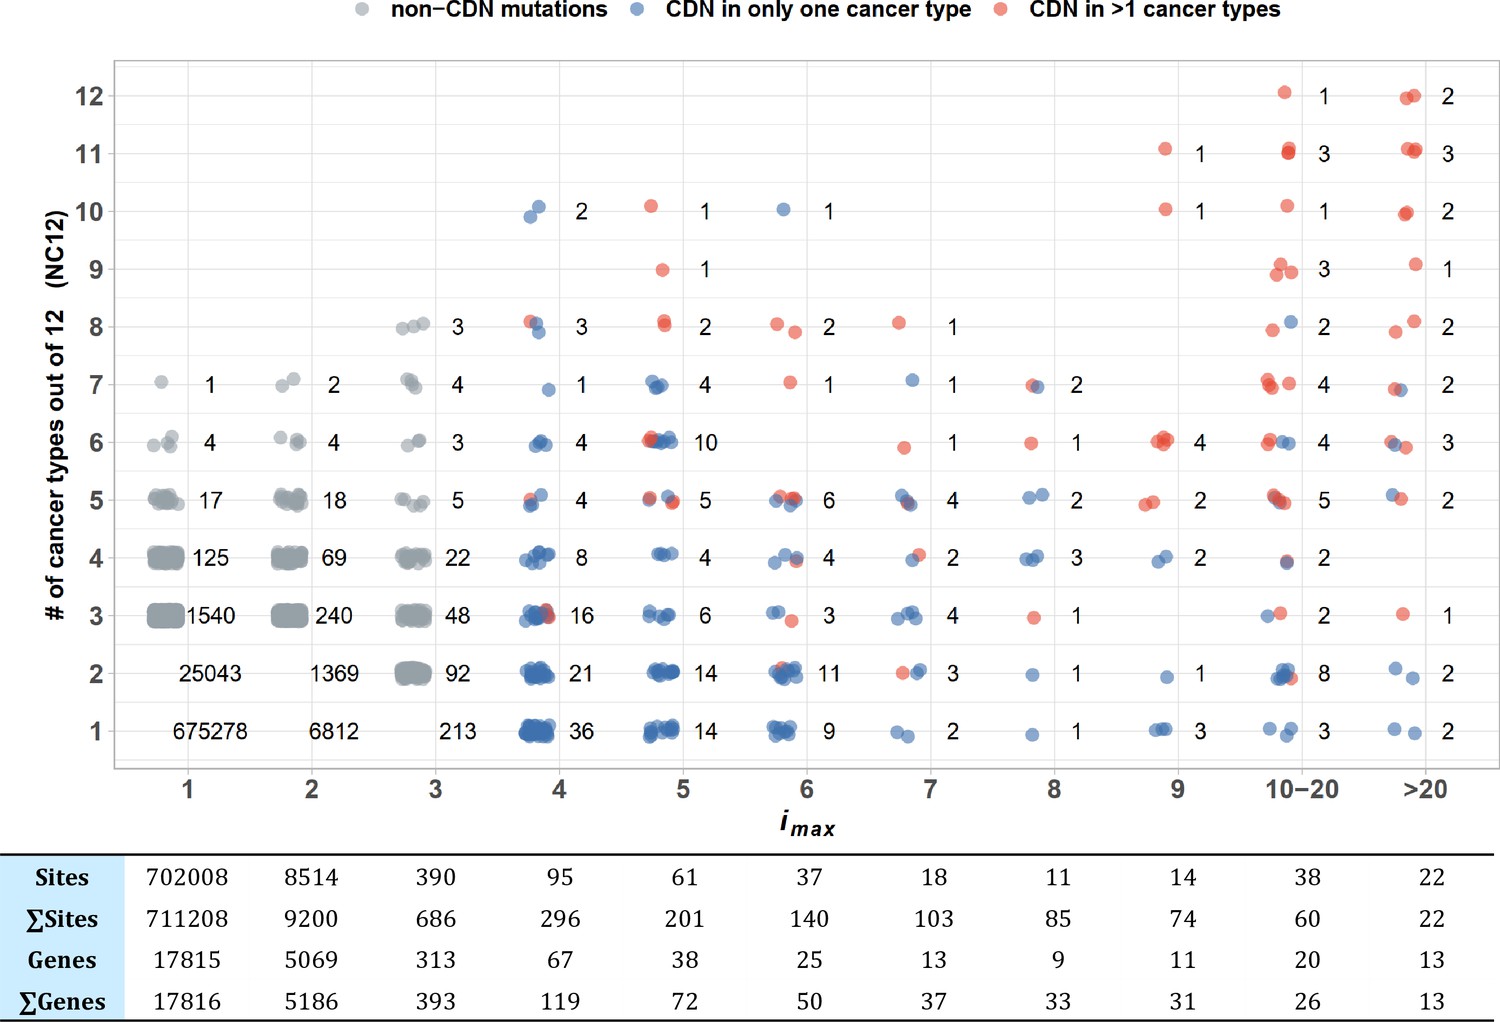
Sharing of cancer-driving nucleotides (CDNs) across cancer types.
The X-axis shows imax, which is the largest i a CDN reaches among the 12 cancer types. The Y-axis shows the number of cancer types where the mutation also occurs. Each dot is a CDN, and the number of dots in the cloud is given. The blue and red dots denote, respectively, mutations classified as a CDN in one or multiple cancer types. Gray dots are non-CDNs. The table in the lower panel summarizes the number of sites and the number of genes harboring these sites.
Figure 5
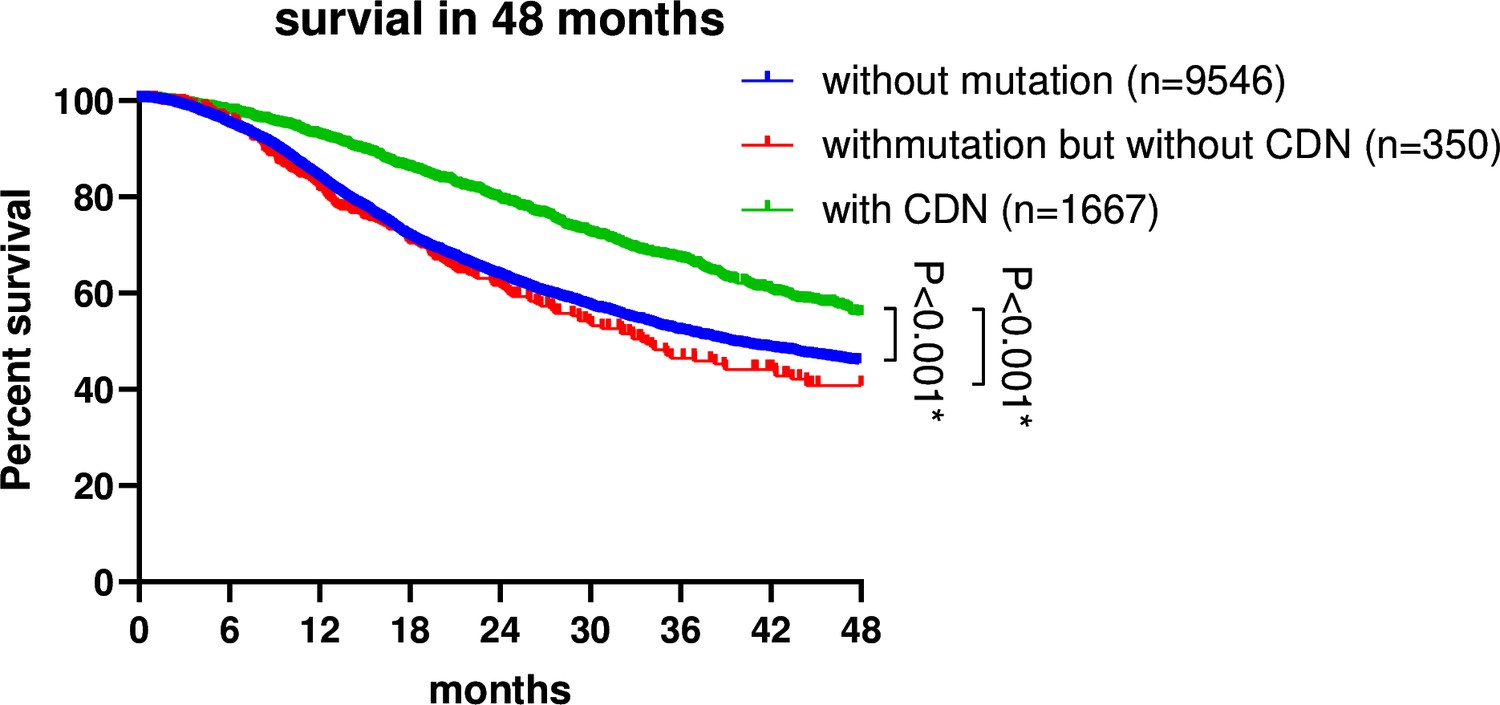
Survival analysis of non-small cell lung cancer (NSCLC) patients based on EGFR mutation status.
Patient data were retrieved from the GENIE database (https://genie-public-beta.cbioportal.org/) and stratified into three groups based on EGFR mutation profiles: Group 1 comprises patients with EGFR CDN mutations; group 2 includes patients with nonsynonymous mutations in EGFR that are not cancer-driving nucleotides (CDNs); the EGFRWT group consists of patients with no EGFR mutations (see ‘Methods’). Patients of groups 1 and 2 received EGFR-targeted therapies in accordance with the guidelines for managing EGFR mutant NSCLC (Passaro et al., 2022; Choudhury et al., 2023). Survival analysis using the Kaplan–Meier method revealed a significantly higher survival rate for group 1 patients compared to group 2 and the EGFRWT group (p<0.001).
Appendix 1—figure 1
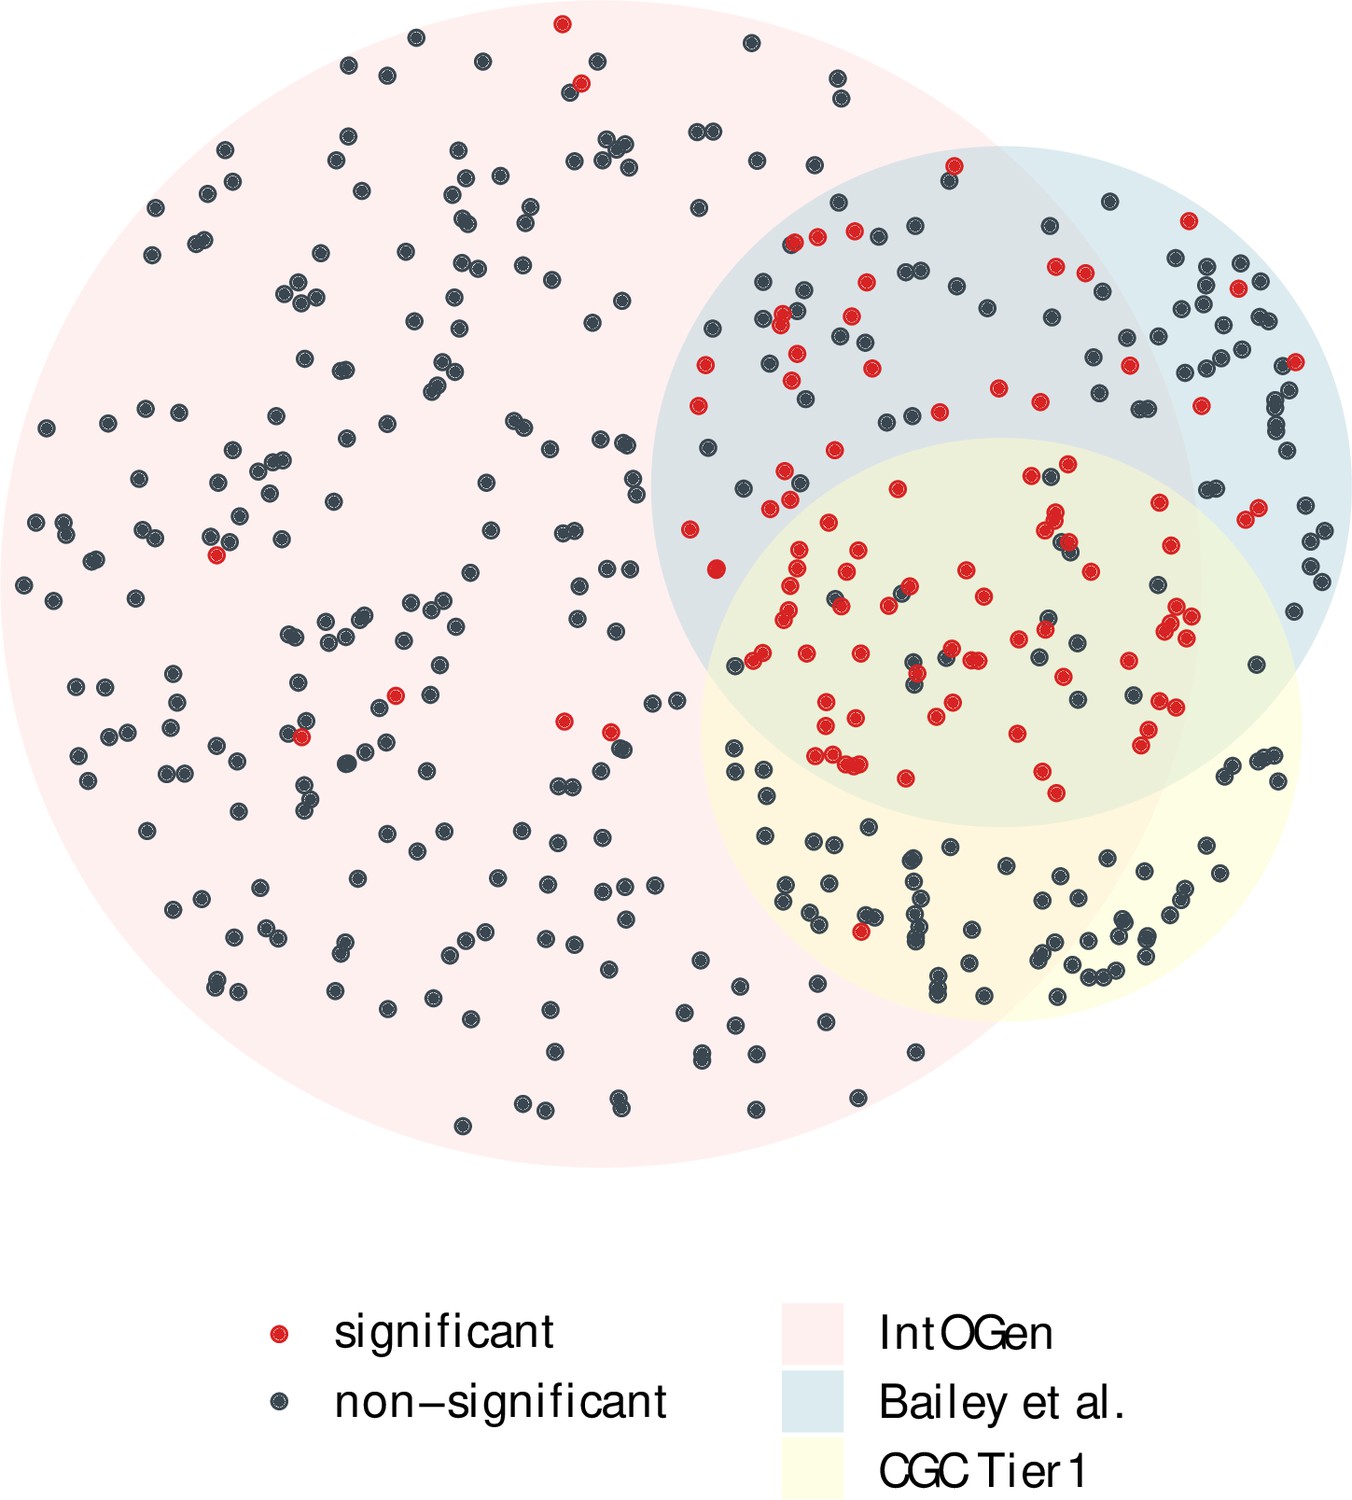
The overlap of cancer drivers from IntOGen, Bailey et al. and CGC Tier 1 (Bailey et al., 2018; Sondka et al., 2018; Martínez-Jiménez et al., 2020).
Driver genes (dots) for 12 cancer types were extracted from each driver list, indicated by three different region colors. The area size of each region is proportional to the gene number, with 384 genes for IntOGen, 168 for Bailey et al. and 137 for CGC Tier 1. Genes with a significant positive selection signal in the merged mutation set are marked in red, while nonsignificant ones are colored in blue. Notably, genes shared across the three driver sets are largely those with a significant Ka/Ks > 1.
Appendix 2—figure 1
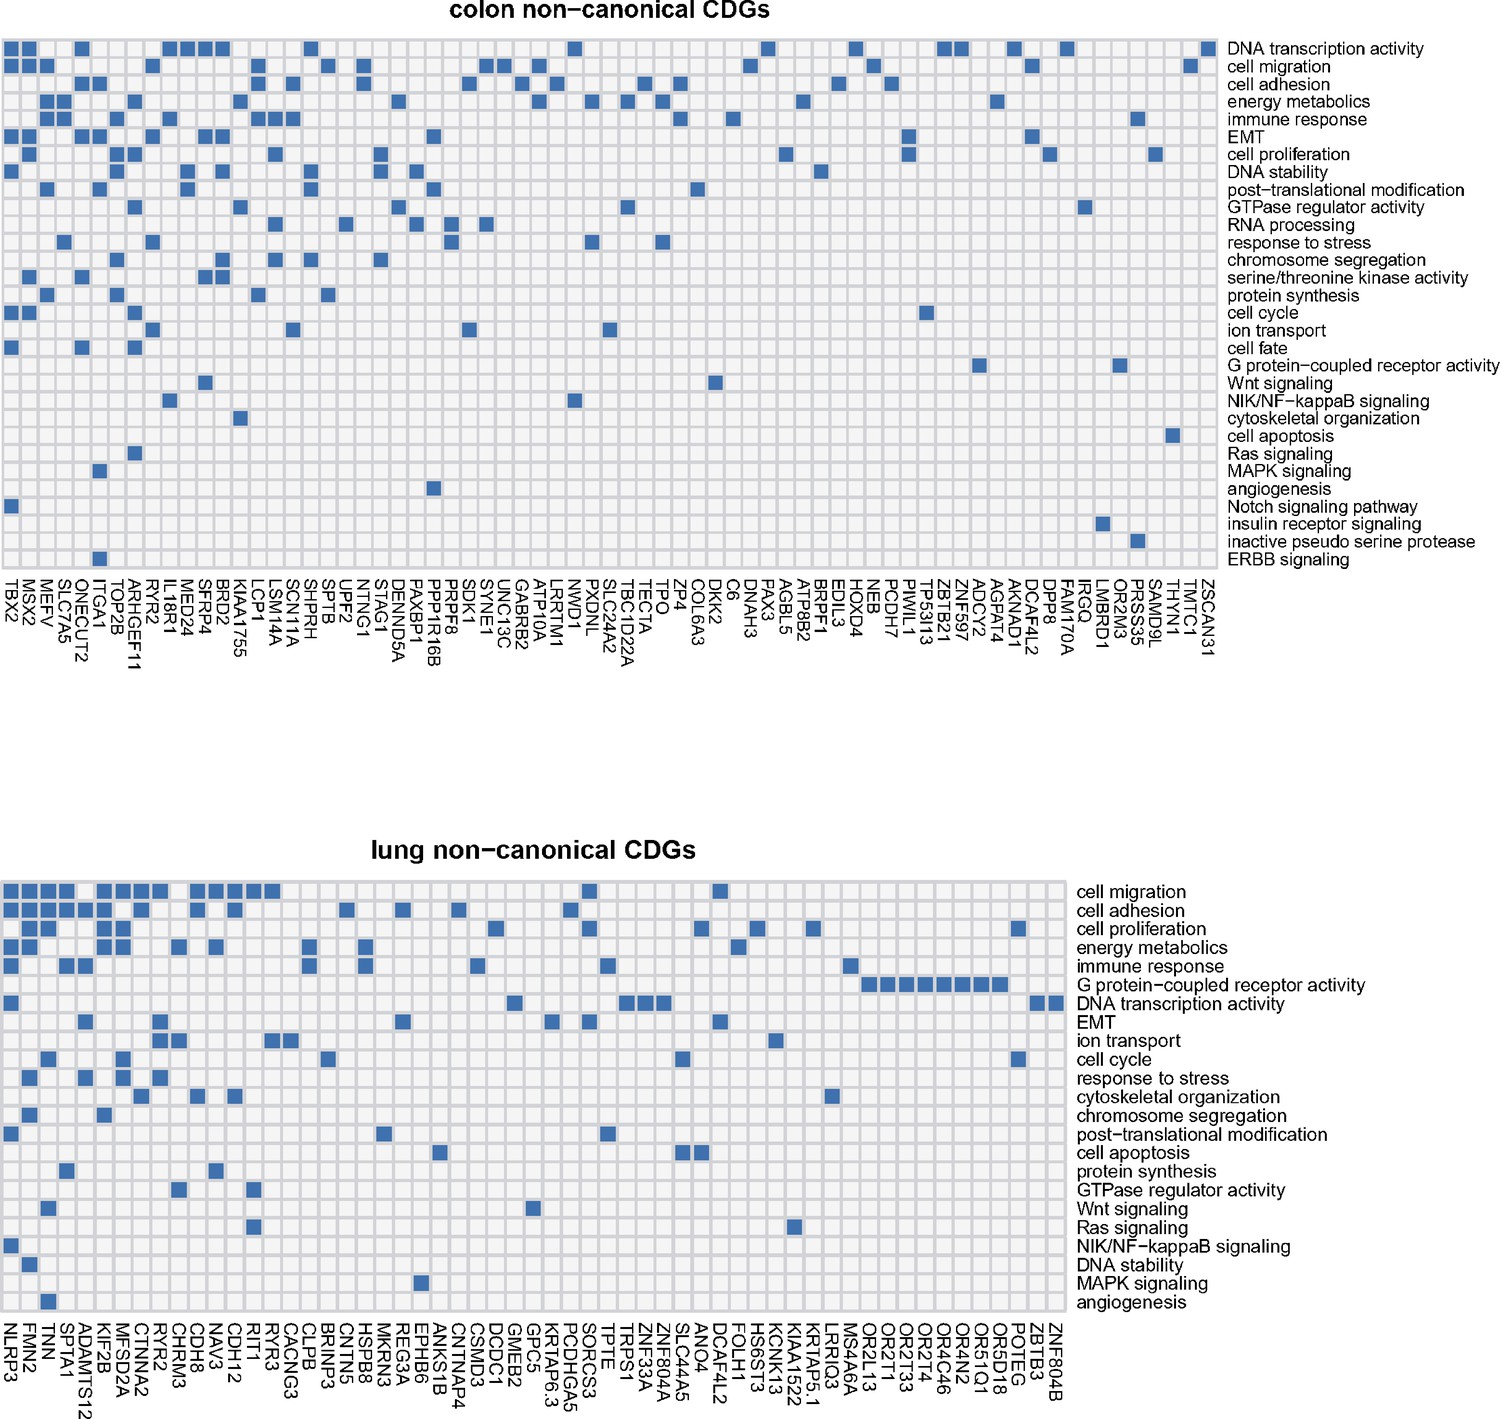
Noncanonical cancer driver genes (CDGs) in colon and lung cancer along with associated biological processes (Y-axis).
For each gene, we examine its annotation results from GO analysis and search for cancer-related evidence in the literature. Biological processes are summarized and curated in relation to cancer hallmarks. Each connection between gene ID and biological process is depicted by a blue block in the grid.
Appendix 2—figure 2
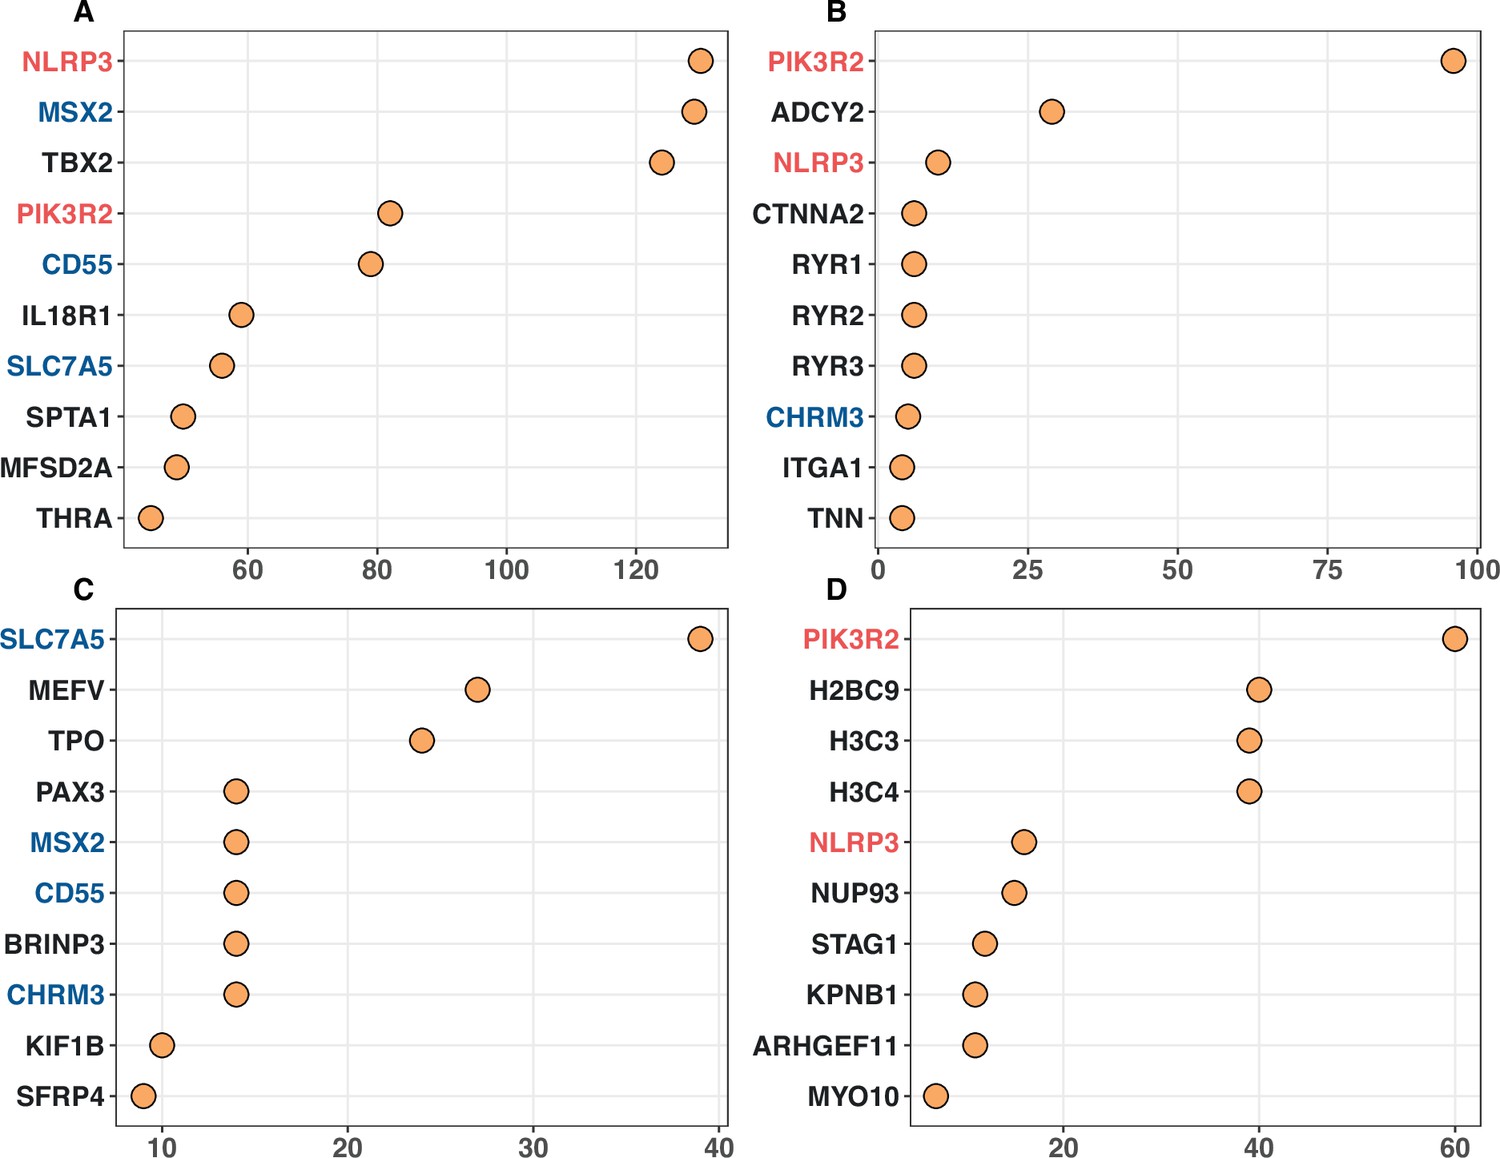
Top 10 noncanonical cancer driver genes (CDGs) with the highest enrichment records with IntOGen’s driver list from four enrichment analysis.
Panels (A–D) corresponds to Gene Ontology, KEGG, Disease Ontology, and Reactome analysis, respectively. The X-axis represents the number of enrichment records for each gene, while genes are listed on the Y-axis according to their enrichment record number. Genes with different occurrences across the top set of four analysis are marked with red (three hits), blue (two hits) and black (one hit).
Tables
Table 1
Mutation recurrences (Ais and Sis) in 12 cancer types.
| Lung | Breast | Central nervous system | Kidney | Upper aerodigestive tract | Colon | Endometrium | Prostate | Stomach | Urinary tract | Ovary | Liver | Average | |
|---|---|---|---|---|---|---|---|---|---|---|---|---|---|
| Patients # | 1035 | 963 | 873 | 711 | 688 | 571 | 465 | 465 | 423 | 404 | 404 | 367 | 614 |
| *A0 | 22,540,623 | 21,683,136 | 20,783,835 | 22,247,653 | 21,580,444 | 20,601,026 | 20,766,001 | 21,300,810 | 20,892,755 | 21628918 | 22278124 | 22618059 | 21576782 |
| *S0 | 78,042,81 | 9,388,418 | 10,298,911 | 87,814,83 | 93,332,83 | 10,428,913 | 10,375,596 | 97,543,31 | 10,243,634 | 9426888 | 8746002 | 8255268 | 9403084 |
| A/S_0 | 2.89 | 2.31 | 2.02 | 2.53 | 2.31 | 1.98 | 2.00 | 2.18 | 2.04 | 2.29 | 2.55 | 2.74 | 2.29 |
| A1 | 195958 | 44696 | 25122 | 25669 | 66924 | 94634 | 78870 | 9583 | 78834 | 66153 | 21138 | 25731 | 61109 |
| S1 | 69393 | 16732 | 10182 | 9317 | 26151 | 38606 | 31982 | 3613 | 32538 | 26546 | 7227 | 9398 | 23474 |
| A/S_1 | 2.82 | 2.67 | 2.47 | 2.76 | 2.56 | 2.45 | 2.47 | 2.65 | 2.42 | 2.49 | 2.92 | 2.74 | 2.60 |
| A2 | 2946 | 233 | 287 | 56 | 489 | 1662 | 1052 | 29 | 1176 | 816 | 51 | 46 | 737 |
| S2 | 969 | 62 | 75 | 11 | 159 | 736 | 386 | 9 | 489 | 308 | 9 | 12 | 249 |
| A/S_2 | 3.04 | 3.76 | 3.83 | 5.09 | 3.08 | 2.26 | 2.73 | 3.22 | 2.40 | 2.65 | 5.67 | 3.83 | 2.74 |
| A3 | 99 | 18 | 42 | 14 | 28 | 91 | 52 | 6 | 79 | 60 | 9 | 9 | 42.3 |
| S3 | 21 | 2 | 6 | 1 | 5 | 28 | 11 | 0 | 14 | 9 | 0 | 0 | 8.08 |
| A/S_3 | 4.71 | 9 | 7 | 14 | 5.6 | 3.25 | 4.73 | 6:0 | 5.64 | 6.67 | 9:0 | 9:0 | 5.23 |
| †Ai ≥3 | 178 | 51 | 84 | 18 | 77 | 148 | 142 | 14 | 124 | 100 | 26 | 23 | 82.1 |
| †Ai ≥4 | 79 | 33 | 42 | 4 | 49 | 57 | 90 | 8 | 45 | 40 | 17 | 14 | 39.8 |
| A4 | 23 | 10 | 8 | 2 | 14 | 23 | 21 | 3 | 23 | 11 | 4 | 3 | 11.1 |
| A5 | 16 | 6 | 10 | 2 | 10 | 6 | 20 | 2 | 9 | 9 | 3 | 5 | 8.2 |
| A6-9 | 27 | 10 | 10 | 0 | 13 | 9 | 32 | 2 | 7 | 12 | 6 | 2 | 10.8 |
| A[10, 20) | 7 | 3 | 10 | 0 | 9 | 11 | 9 | 1 | 6 | 5 | 4 | 4 | 5.75 |
| A≥20 | 6 | 4 | 4 | 0 | 3 | 8 | 8 | 0 | 0 | 3 | 0 | 0 | 3 |
| ‡Total | 202828 | 45669 | 26596 | 25841 | 68387 | 98931 | 81898 | 9706 | 81678 | 68297 | 21387 | 25944 | 63097 |
| SiteNbr | 22739705 | 21728116 | 20809328 | 22273396 | 21647934 | 20697470 | 20846065 | 21310436 | 20972889 | 21695987 | 22299339 | 22643859 | 21638710 |
| nE(u) | 9.07E-03 | 1.79E-03 | 1.00E-03 | 1.06E-03 | 2.83E-03 | 3.84E-03 | 3.15E-03 | 3.72E-04 | 3.27E-03 | 2.88E-03 | 8.28E-04 | 1.14E-03 | 2.6E-03 |
-
*
See ‘Methods’ for the calculations of A0 and S0.
-
†
Ai and Si are as defined in the text.
-
‡
‘Total’ represents the total number of missense mutations, or . ‘Site number’ refers to the count of missense sites. nE(u) is calculated based on synonymous mutations, representing the expected number of neutral mutations per site in a population of size n.
Table 2
Excess of Ais of each i class.
| Recurrences | Lung | Breast | Central nervous system | Kidney | Upper aerodigestive tract | Colon | Endometrium | Prostate | Stomach | Urinary tract | Ovary | Liver |
|---|---|---|---|---|---|---|---|---|---|---|---|---|
| *A1_o | 195958 | 44696 | 25122 | 25669 | 66924 | 94634 | 78870 | 9583 | 78834 | 66153 | 21138 | 25731 |
| *, †A1_e | 198627 | 38586 | 20532 | 23582 | 60316 | 76049 | 63860 | 7888 | 66194 | 60751 | 18396 | 25720 |
| Excess | –2669 | 6110 | 4590 | 2087 | 6608 | 18585 | 15010 | 1695 | 12640 | 5402 | 2742 | 11 |
| ‡Ratio (%) | –1.36 | 13.67 | 18.27 | 8.13 | 9.87 | 19.64 | 19.03 | 17.69 | 16.03 | 8.17 | 12.97 | 0.04 |
| A2_o | 2946 | 233 | 287 | 56 | 489 | 1662 | 1052 | 29 | 1176 | 816 | 51 | 46 |
| A2_e | 1750 | 69 | 20 | 25 | 169 | 280 | 196 | 3 | 210 | 171 | 15 | 29 |
| Excess | 1195.61 | 164.36 | 266.72 | 31.01 | 320.48 | 1381.54 | 855.77 | 26.08 | 966.42 | 645.41 | 35.81 | 16.75 |
| Ratio (%) | 40.58 | 70.54 | 92.93 | 55.37 | 65.54 | 83.13 | 81.35 | 89.93 | 82.18 | 79.09 | 70.22 | 36.42 |
| A3_o | 99 | 18 | 42 | 14 | 28 | 91 | 52 | 6 | 79 | 60 | 9 | 9 |
| A3_e | 15.43 | 0.12 | 0.02 | 0.03 | 0.47 | 1.03 | 0.60 | 0.00 | 0.66 | 0.48 | 0.01 | 0.03 |
| Excess | 83.57 | 17.88 | 41.98 | 13.97 | 27.53 | 89.97 | 51.40 | 6.00 | 78.34 | 59.52 | 8.99 | 8.97 |
| Ratio (%) | 84.42 | 99.32 | 99.95 | 99.81 | 98.32 | 98.86 | 98.84 | 99.98 | 99.16 | 99.20 | 99.86 | 99.63 |
| A4_o | 23 | 10 | 8 | 2 | 14 | 23 | 21 | 3 | 23 | 11 | 4 | 3 |
| A4_e | 0.13593 | 0.00022 | 1.98E-05 | 2.81E-05 | 0.00132 | 0.00381 | 0.00185 | 4.00E-07 | 0.00210 | 0.00135 | 1.04E-05 | 3.78E-05 |
| Excess | 22.8641 | 9.99978 | 7.99998 | 1.99997 | 13.9987 | 22.9962 | 20.9981 | 3 | 22.9979 | 10.9987 | 3.99999 | 2.99999 |
| Ratio (%) | 99.41 | 100 | 100 | 100 | 99.99 | 99.98 | 99.99 | 100.00 | 99.99 | 99.99 | 100 | 100.00 |
-
*
The notation of ‘o’ and ‘e’ following Ais represents the observed Ai and expected Ai.
-
†
See ‘Methods’ for the calculation of expected Ai ’s.
-
‡
Ratio is the proportion of observed sites in excess, that is, the proportion of putative CDNs in the observation.
Table 3
Distribution of cancer-driving nucleotides (CDNs) among genes.
| CDN calls based on i*=3 | Lung | Breast | Central nervous system | Upper aerodigestive tract | Colon | Endometrium | Mean | †Total | Overlap with the conventional set | Criteria of classification |
|---|---|---|---|---|---|---|---|---|---|---|
| # of patients (n) | 1035 | 963 | 873 | 688 | 571 | 465 | - | - | - | |
| CDN count | 178 | 50 | 83 | 77 | 148 | 142 | 113.3 | 495 | - | |
| # CDN-carrying genes (type I fulfills the convention of ‡Ka/Ks > 1**; type II does not) | ||||||||||
| Type I (Ka/Ks >1**) | 10 | 8 | 12 | 13 | 10 | 21 | 12.33 | 45 | 95.7% | Conventional |
| Type II (Ka/Ks ~1) | 79 | 9 | 12 | 19 | 86 | 35 | 40 | 229 | 26.1% | This study only |
| All CDN genes | 89 | 17 | 24 | 32 | 96 | 56 | 52.33 | 258 | 47% | Both types |
| Genes with 1–2 CDNs (% all CDN genes) | 80 (89.9 %) | 14 (82.4 %) | 19 (79.2 %) | 27 (84.4 %) | 90 (93.8 %) | 45 (80.4 %) | 45.8 (85 %) | 250 (96.9%) | A subset of both types | |
| Number of driver genes in three major CDG lists | ||||||||||
| *Other criteria: | – | Variable (see legends) | ||||||||
| IntOGen | 118 | 100 | 100 | 106 | 86 | 72 | 97 | 321 | ||
| Bailey et al. | 36 | 29 | 32 | 38 | 20 | 55 | 35 | 134 | ||
| CGC Tier 1 | 30 | 32 | 32 | 24 | 44 | 23 | 30.83 | 118 | ||
-
*
intOGen, Bailey et al., and CGC Tier 1 are the three major CDG lists adopted here for comparison (Bailey et al., 2018; Sondka et al., 2018; Martínez-Jiménez et al., 2020).
-
†
”Total” refers to the cumulative number of unique genes identified across all six cancer types.
-
‡
Here, ** denotes significant Ka/Ks results with a corrected q-value < 0.1 based on dndscv analysis.
Table 4
Numbers of patients with cancer-driving nucleotides (CDNs) vs. number of patients with any non-synonymous mutations in the same genes.
| Lung | Breast | Central nervous system | Upper aerodigestive tract | Colon | Endometrium | |||||||
|---|---|---|---|---|---|---|---|---|---|---|---|---|
| CDN*† (178) | Gene† ‡ (89) | CDN (50) | Gene (17) | CDN (83) | Gene (24) | CDN (77) | Gene (32) | CDN (148) | Gene (96) | CDN (142) | Gene (56) | |
| n0 | 342 (33%) § | 53 (5.3%) | 492 (51.1%) | 415 (43.1%) | 235 (26.9%) | 163 (18.7%) | 268 (39%) | 140 (20.3%) | 102 (17.9%) | 42 (7.4%) | 42 (9%) | 14 (3%) |
| n1 | 411 (39.7%) | 70 (6.8%) | 379 (39.4%) | 395 (41%) | 359 (41.1%) | 306 (35.1%) | 268 (39%) | 229 (33.3%) | 159 (27.8%) | 79 (13.8%) | 108 (23.2%) | 59 (12.7%) |
| n2 | 192 (18.6%) | 84 (8.1%) | 73 (7.6%) | 114 (11.8%) | 225 (25.8%) | 293 (33.6%) | 101 (14.7%) | 171 (24.9%) | 140 (24.5%) | 93 (16.3%) | 169 (36.3%) | 101 (21.7%) |
| n>2 | 90 (8.7%) | 826 (79.8%) | 18 (1.9%) | 38 (3.9%) | 53 (6.1%) | 110 (12.6%) | 50 (7.3%) | 147 (21.4%) | 170 (29.8%) | 357 (62.5%) | 146 (31.4%) | 291 (62.6%) |
| Total n | 1035 | 1035 | 963 | 963 | 873 | 873 | 688 | 688 | 571 | 571 | 465 | 465 |
| Mean # | 1.06 | 7.19 | 0.61 | 0.78 | 1.12 | 1.44 | 0.93 | 1.63 | 1.96 | 4.6 | 2.17 | 3.7 |
-
*
ni designates the number of patients with i CDN mutations.
-
†
The number in the parentheses is the total number of CDNs or genes.
-
‡
In this column, ni designates the number of patients with any nonsynonymous mutation in the same gene as the CDN column.
-
§
There are 684 CDNs summed over all cancer types. The percentage is ni/Total n.
Table 5
Gene numbers for different cancer hallmarks.
| Gene number | |||
|---|---|---|---|
| Hallmark | All records | Breast | Colon |
| Angiogenesis | 78 | 8 | 6 |
| Cell division control | 107 | 12 | 10 |
| Cell replicative immortality | 44 | 4 | 3 |
| Change of cellular energetics | 70 | 10 | 4 |
| Escaping immune response to cancer | 51 | 1 | 1 |
| Escaping programmed cell death | 202 | 32 | 20 |
| Genome instability and mutations | 106 | 10 | 7 |
| Invasion and metastasis | 206 | 52 | 27 |
| Proliferative signaling | 176 | 40 | 20 |
| Senescence | 48 | 3 | 5 |
| Suppression of growth | 130 | 11 | 12 |
| Tumor-promoting inflammation | 54 | 2 | 3 |
-
Data downloaded from COSMIC (https://cancer.sanger.ac.uk/cosmic/download), see ‘Methods’.
Additional files
Download links
A two-part list of links to download the article, or parts of the article, in various formats.
Downloads (link to download the article as PDF)
Open citations (links to open the citations from this article in various online reference manager services)
Cite this article (links to download the citations from this article in formats compatible with various reference manager tools)
Characterization of cancer-driving nucleotides (CDNs) across genes, cancer types, and patients
eLife 13:RP99341.
https://doi.org/10.7554/eLife.99341.3


