Systematic genetic characterization of the human PKR kinase domain highlights its functional malleability to escape a poxvirus substrate mimic
- Center for Genomics and Data Science Research, National Human Genome Research Institute, National Institutes of Health, United States
- Department of Microbiology & Immunology, Georgetown University, United States
Figures
Figure 1 with 7 supplements

Exploring genetic variants of human PKR against the pseudosubstrate antagonist vaccinia K3.
(A) (Left) AlphaFold2 model of the PKR kinase domain (green) bound to its target, eIF2α (gray). (Right) Rotated 90°, the eIF2α binding surface of PKR is shaded gray and outlined in white dashed line. (B) PKR kinase domain with vertebrate positive selection sites highlighted in red (Rothenburg et al., 2009), with the K3 binding surface delineated with white dashed line. (C) AlphaFold2 model of the PKR kinase domain bound to vaccinia K3 (purple). Rotated 90°, the K3 binding surface of PKR is shaded purple and outlined in white dashed line. (D) (Left) The PKR kinase domain with four windows highlighted in which we designed 426 nonsynonymous variants. Secondary structures occurring in these windows (alpha helices α0, αD, and αG, beta strand β1, and the kinase activation loop) are marked (Dar et al., 2005). The positions of conserved sites and sites under positive selection (Rothenburg et al., 2009) are denoted above with black and red triangles, respectively, and the positions of sites within 5 angstroms of either K3 or eIF2α in an Alphafold2 binding model are denoted with purple and gray triangles, respectively. Note that the modeled interaction between PKR and eIF2α resembles the pre-phosphorylation state in which the phosphoacceptor loop of eIF2α has not entered the PKR active site, and thus there are likely additional sites in PKR that contact eIF2α. (Right) Mutated windows are highlighted on the surface of the PKR kinase domain, with the K3 binding surface delineated with a white dashed line, and in cartoon form with secondary structures marked. (E) Methodological approach to explore the effects of variants of human PKR in the presence of different K3 alleles. 426 nonsynonymous variants of PKR were generated and paired with wild-type K3, K3∆58, and K3-H47R. Variant effects were characterized using a high-throughput yeast growth assay and massively parallel sequencing.
Figure 1—figure supplement 1
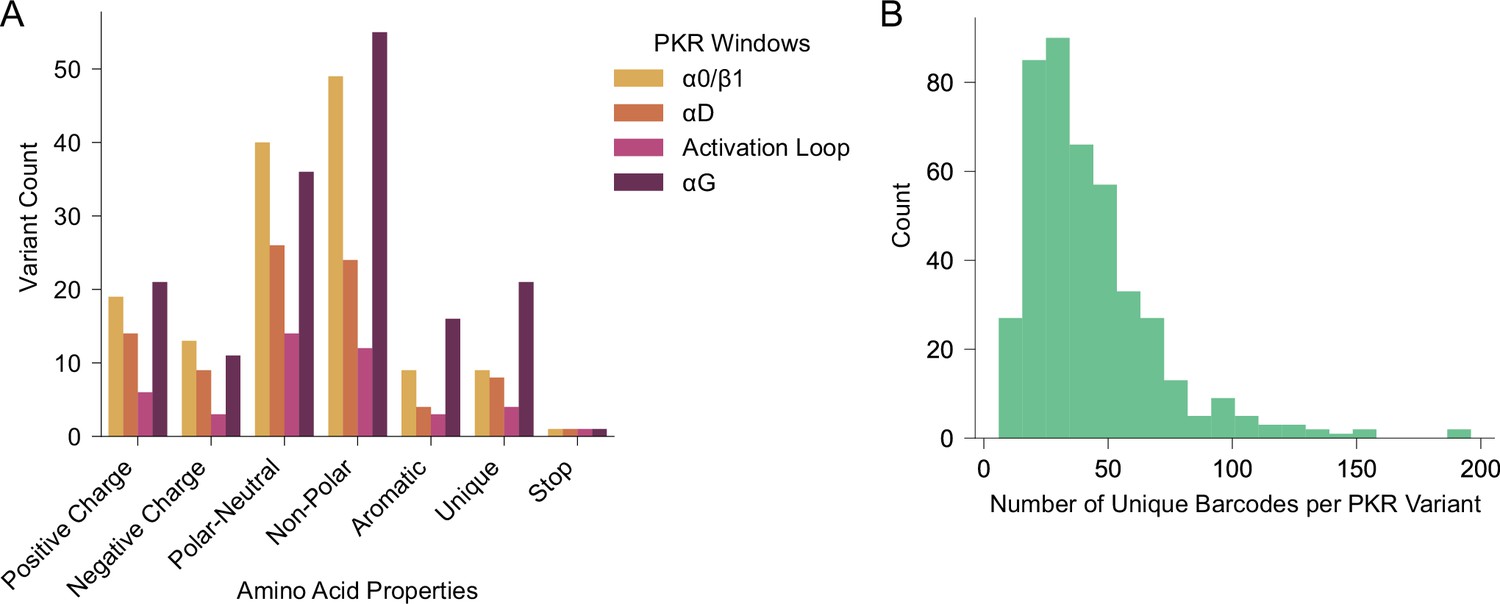
Composition of the PKR variant library.
(A) Barchart depicts the number of variants made at each of the four PKR windows categorized by amino acid properties: Positive Charge = H, K, R; Negative Charge = D, E; Polar-Neutral=C, N, Q, S, T; Non-Polar=A, I, L, M, V; Aromatic = F, W, Y; Unique = G, P; Stop = *. A total of 140 variants were made in α0/β1, 86 in αD, 43 in the Activation Loop, and 161 in αG for a total of 430 variants, which includes 4 nonsense variants, with one made in each window. (B) Histogram depicts the number of unique barcodes linked to each PKR variant, with a mean of 42.83.
Figure 1—figure supplement 2

Calculation of PKR functional scores from yeast growth assay.
(A) Line plot of mock barcode read count data over time for cells expressing nonfunctional (red) or functional (blue) PKR across four sampled timepoints. As PKR activity is toxic to yeast, the number of cells in the pool expressing the functional PKR will decrease over time, and thus the associated barcode read count will also decrease, while the read count for the nonfunctional PKR will increase. (B) Line plot depicting the fold changes from timepoint 0 of barcode abundance derived from Panel A, with a -log2 transformation to assign positive values to functional PKR and negative values to nonfunctional PKR, from which the area under the curve (AUC) is calculated to produce a PKR functional score.
Figure 1—figure supplement 3
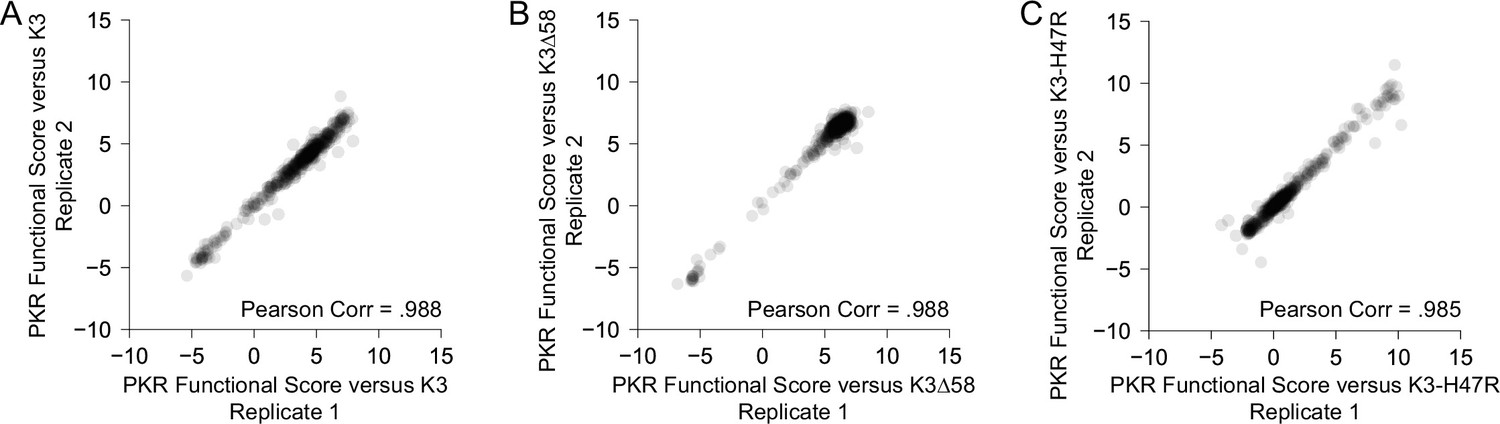
Replication of PKR variants paired with K3 alleles.
(A) Scatter plot of PKR functional scores for variants paired with K3-WT for two biological replicate experiments. Functional scores were calculated across four timepoints as the area under the curve (see Materials and methods). Thus, variants with increased evasion of K3 would have higher PKR functional scores, while those with increased susceptibility to K3 or loss of eIF2α kinase activity would have lower scores. (B) Scatter plot of PKR functional scores for variants paired with K3∆58 for two biological replicate experiments. (C) Scatter plot of PKR functional scores for variants paired with K3-H47R for two biological replicate experiments.
Figure 1—figure supplement 4
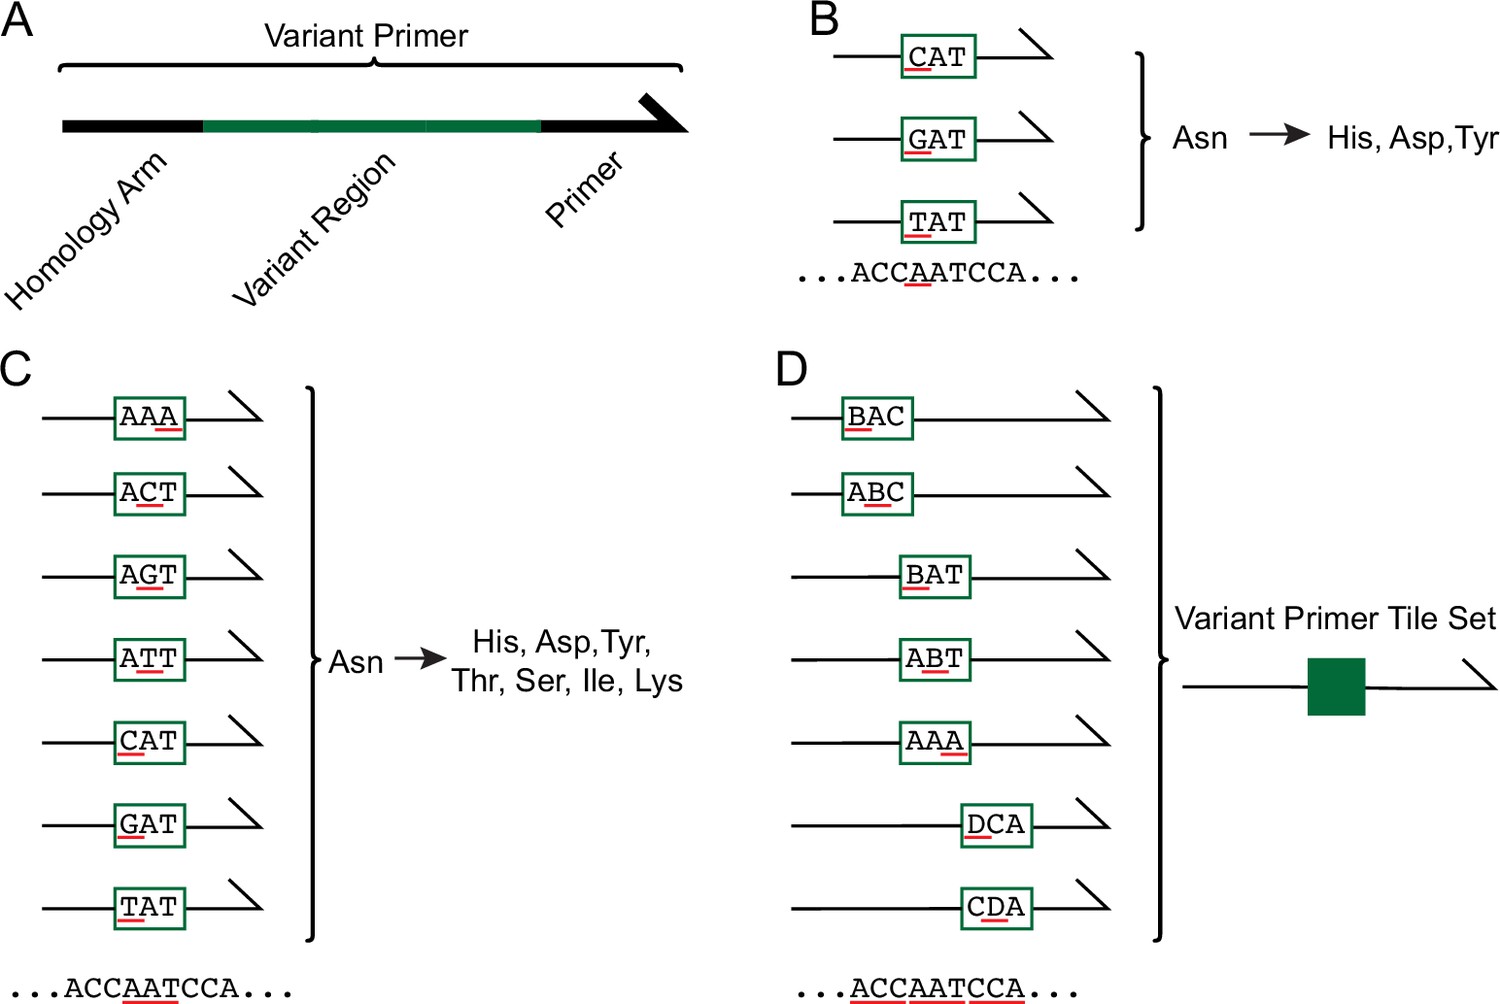
Systematic generation of PKR variants using mixed-base primer tile sets.
(A) Each variant primer is composed of a homology arm, variant region, and priming region. (B) Nonsynonymous SNP-accessible variants are generated by altering the codon in the variant region of the primer. This example depicts the codon ‘AAT’ encoding Asn. The first nucleotide in the codon, ‘A’, is underlined in red, with three codons above having changes to ‘C’, ‘G’, and ‘T’ underlined in red, which generate the nonsynonymous variants His, Asp, and Tyr. (C) Variant primers were designed across all three nucleotides in each codon, as underlined in red. (D) Variant primer tile sets, represented in dark green, were made by pooling variant primers that modify adjacent codons. Primers included in a given variant primer tile sets have differing variant regions but share homology arms and priming region sequences.
Figure 1—figure supplement 5

Multiple unique barcode sequences were attached to each PKR variant.
(A) The barcode primer is composed of a homology arm, barcode region, and priming region. The barcode primer is used as the reverse primer in the variant-generating PCR reactions to attach a unique nucleotide sequence after the PKR variant sequence. (B) The barcode region of the primer is composed of 20 ‘N’, representing an equal mix of the nucleotides ‘A’, ‘C’, ‘G’, and ‘T’. A barcode primer with 20 random nucleotides can take on 420 unique nucleotide sequences. Dinucleotide sequences ‘TT’ and ‘AA’ are interspersed throughout the barcode region to avoid making unintended restriction enzyme cut sites.
Figure 1—figure supplement 6
Assembly of PKR variant library using variant tile sets and barcode primers.
(A) 15 variant primer tile sets were designed to generate variants across four windows of interest in PKR. The full-length PKR sequence is denoted in green, with Windows 1–4 overlaid in yellow, orange, magenta, and burgundy, respectively. Variant primer tile sets were used to generate 426 PKR missense variants, for a total of 15 PCR-1 reactions. (B) Two separate PCR reactions were used to generate complementary insert and vector fragments. PCR-1 primers (light gray box) include a single variant primer tile set (dark green, see Figure 1—figure supplement 4) and a single doped barcode primer (light blue, see Figure 1—figure supplement 5) that amplified from WT PKR (green) and made the PCR-1 insert fragment containing a select nonsynonymous variants (dark green) and a unique barcodes (blue). PCR-2 primers included a single forward and reverse primer that amplified from WT PKR and made a larger vector fragment with 20 bp homology arms that complement the homology arms of the PCR-1 insert fragment. The two fragments were combined via Gibson Assembly to form a pool of complete vectors, each vector containing a single, nonsynonymous variant with a unique barcode.
Figure 1—figure supplement 7
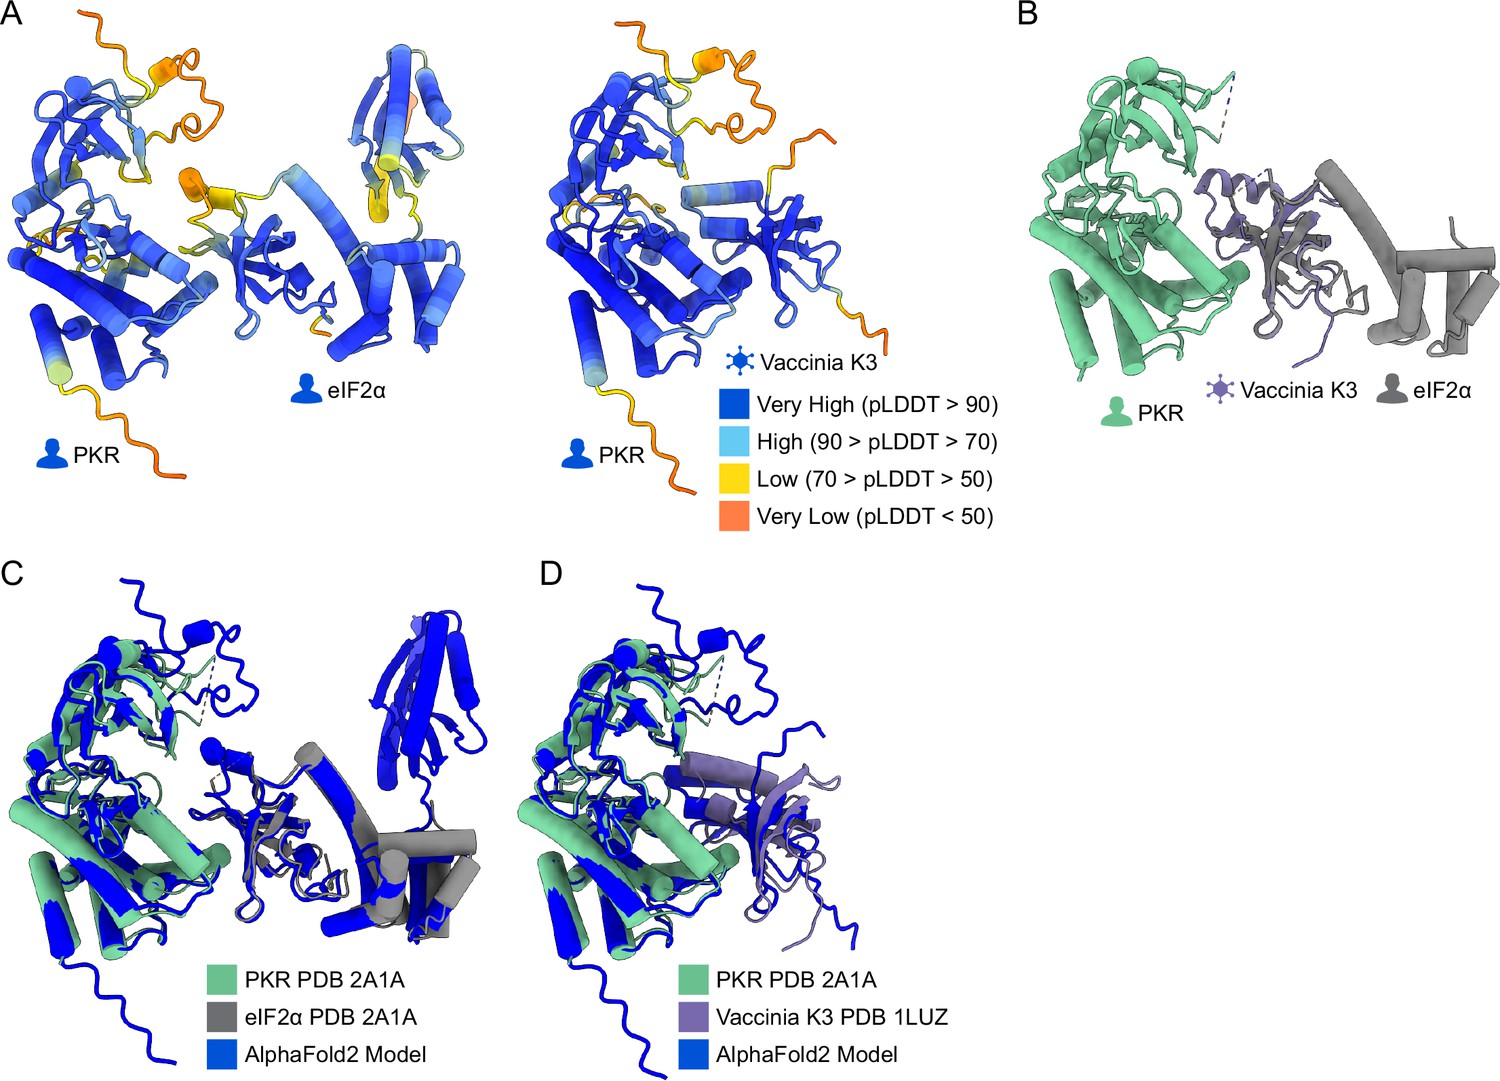
Alphafold2 multimer predictions used to identify PKR sites proximal to eIF2α and K3.
(A) AlphaFold2 multimer prediction of PKR in complex with eIF2α (Left) and K3 (Right). Residues are colored by AlphaFold2 pLDDT confidence scores per residue. In both predicted models, PKR is on the left and its binding partner is on the right, as in Figure 1A and B. (B) Crystal structure of PKR (green, PDB 2A1A) in complex with eIF2α (gray, PDB 2A1A) with the crystal structure of vaccinia K3 (purple, PDB 1LUZ) aligned to eIF2α (root-mean-square deviation (RMSD)=0.819 Å). (C) Overlay of the PKR-eIF2a from PDB 2A1A (green and gray) and AlphaFold2 (blue), RMSD = 0.970 Å. (D) Overlay of the PKR-Vaccinia K3 complex from PDB 2A1A and 1LUZ (green and purple) to AlphaFold2 (blue), RMSD = 0.944 Å.
Figure 2 with 2 supplements

PKR variants that evade K3 and maintain kinase function are enriched at positive selection sites and helices αD and αG.
(A, C) PKR functional scores versus K3 are colored ranging from susceptible (red) to WT-like (white) to resistant (blue). (A) Heatmap of PKR variants with cells colored by the PKR functional score versus K3 for SNP-accessible variants. Wild-type PKR residues and untested variants are denoted with black circles and gray squares, respectively. Previously characterized K3-H47R-resistant variants are noted with an asterisk (Seo et al., 2008). (B) Attractive electrostatic interaction between PKR-Glu375 (blue) and K3-Lys45 (yellow) in the AlphaFold2 model of PKR bound to K3. (C) Surface structure of the PKR kinase domain with sites colored by the mean PKR functional score versus K3 for missense variants. The K3 binding surface is delineated with black dashed line. (Inset) Location of K3-resistant sites cited in the text. (D–F) Strip plots of PKR functional score versus K3 for variants, with green and red dashed lines representing mean scores for WT PKR and nonsense variants, respectively. Variants are partitioned by nearest secondary structural element (D), level of conservation in vertebrates (E), or predicted contact with K3 (F). Points in D are ordered left to right by their position along the kinase domain, whereas they are randomly jittered along the x-axis in E and F. * p<0.05, **** p<0.0001, Tukey’s HSD (D) and two-sample t-test (E, F).
Figure 2—figure supplement 1
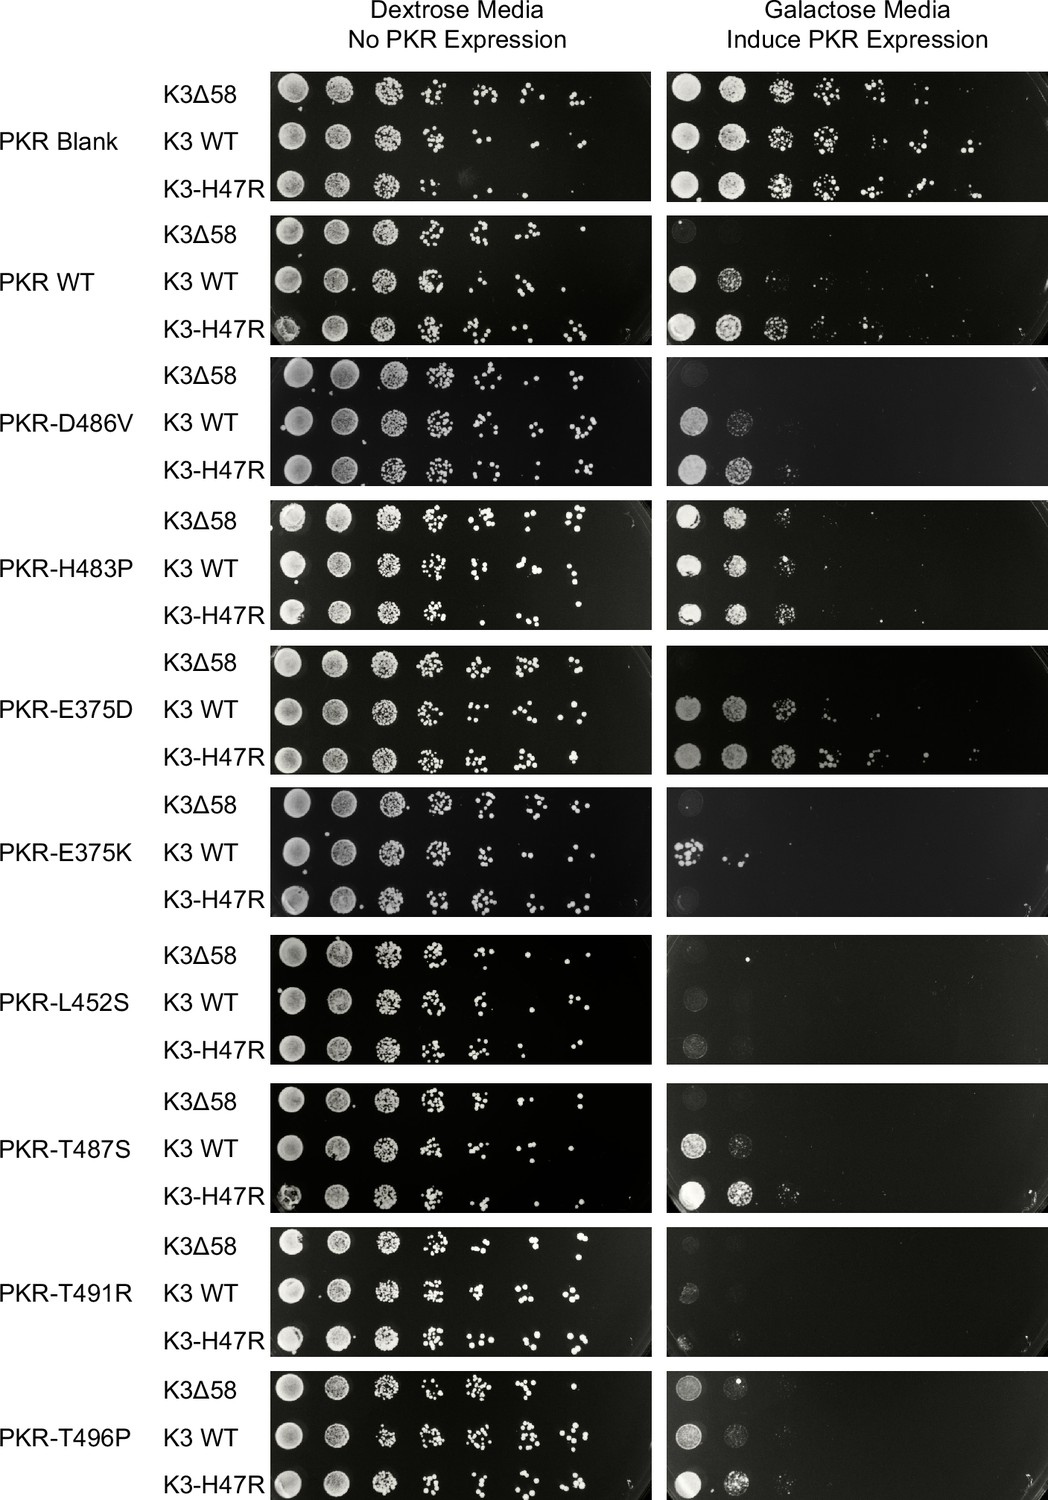
Experimental validation of the K3 resistance phenotypes of PKR variants.
Select PKR variants were generated and screened against K3Δ58, WT, and H47R alleles using a yeast growth assay visualized through serial dilution (Kawagishi-Kobayashi et al., 1997). PKR is under the inducible pGAL10/CYC1 hybrid promoter, and thus is repressed in dextrose media (left) and expressed in galactose media (right). We selected one variant that exhibited loss of function in the high-throughput screen (H483P, Figure 3C), one variant whose phenotype was similar to PKR WT (E375D, Figures 2A, 3C and 5C), and five variants whose K3 resistance was improved (E375K, L452S, T487S, T491R, and T496P, Figures 2A and 5C).
Figure 2—figure supplement 2

Bimodal distribution of PKR functional scores at K3 contact sites.
Strip plot of PKR functional scores versus K3 partitioned by predicted contact with K3. Black dashed line denotes the threshold at which variants were separated as nonfunctional-like or functional. Green and red dashed lines represent mean scores for WT PKR and nonsense variants. ** p<0.01, two-sample t-test, comparing just the variants classified as functional in the two classes.
Figure 3

Few nonfunctional PKR variants identified in the absence of K3 inhibition.
(A) Scatter plot showing each variant’s PKR functional score versus wild-type K3 plotted against its PKR functional score versus K3∆58. The data point for PKR-WT is colored green and a data point representing the average of the four nonsense variants (PKR∆) is colored red. (B, C) PKR functional scores versus K3∆58 are colored ranging from nonfunctional (red) to WT-like (white). (B) Surface structure of the PKR kinase domain with sites colored by the mean PKR functional score versus K3∆58 for missense variants. The K3 binding surface is delineated with a black dashed line. (Inset) Location of highly constrained sites cited in the text. (C) Heatmap of PKR variants with cells colored by the PKR functional score versus K3∆58 for each variant.
Figure 4 with 1 supplement

Identification of PKR sites highly susceptible to K3 inhibition.
(A) A line was drawn connecting the data point for PKR-WT to the position of the average data point for the four nonsense variants (PKR∆) from the data in the scatter plot from Figure 3A, with all other data points colored by their residual from that line (K3 /K3∆58 Residuals), ranging from K3-susceptible (purple) to K3-indifferent (green) to K3-resistant (yellow). This color scheme is used in panels B and C. (B) Surface structure of the PKR kinase domain with sites colored by the mean K3 /K3∆58 residuals for missense variants. The K3 contact site is delineated with a black dashed line. (Inset) Location of K3-susceptible sites cited in the text. (C) Heatmap of PKR variants with cells colored by the K3 /K3∆58 residuals for each variant.
Figure 4—figure supplement 1
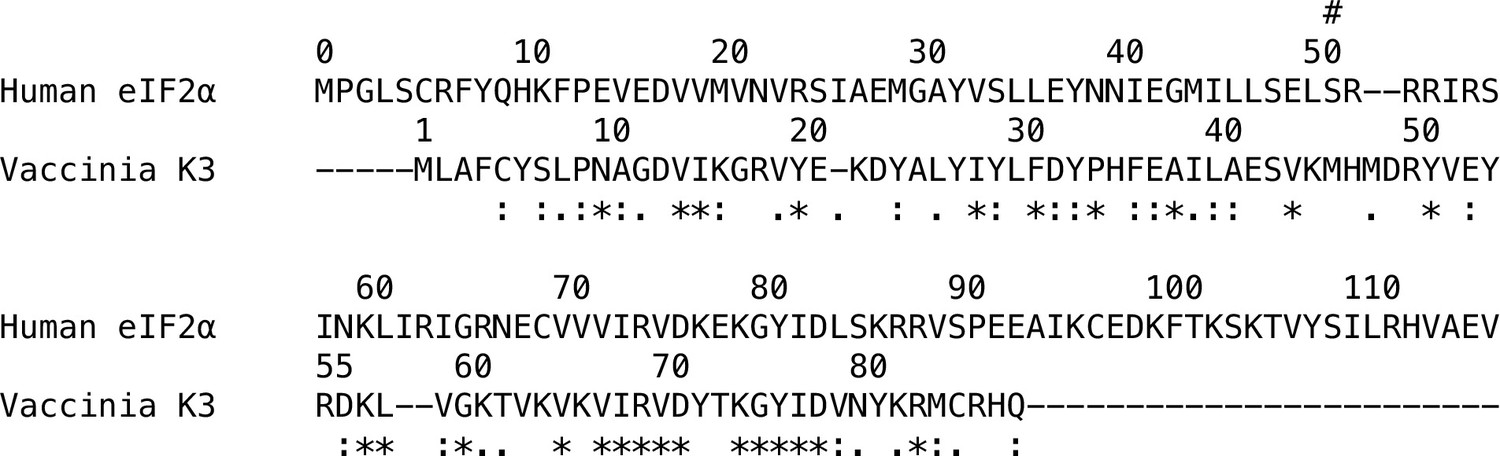
Sequence similarity between human eIF2α and vaccinia K3.
Alignment of human eIF2α (RefSeq Accession NP_004085.1, residues 0–117) to vaccinia K3 (RefSeq Accession YP_232916.1). The Ser51 site of phosphorylation in eIF2α is indicated by #. Sequences were aligned using Muscle 3.8 and displayed in Clustal format, *=fully conserved,:=strong group conservation,.=weak group conservation. Sites 41–58 of K3 correspond to the rigid helix insert, which is proximal to PKR’s ATP-binding site in the Alphafold2-predicted complex, while sites 72–83 are proximal to PKR’s helix αG.
Figure 5 with 2 supplements

PKR variants that are K3-resistant are also largely K3-H47R-resistant.
(A) Scatter plot of PKR functional scores versus wild-type K3 plotted against PKR functional scores versus K3-H47R. The data point for PKR-WT is colored green and a datapoint representing the average of the four nonsense variants (PKR∆) is colored red. (B, C) PKR functional score versus K3-H47R ranging from susceptible (red) to WT-like (white) to resistant (blue). (B) Surface structure of the PKR kinase domain with sites colored by the mean PKR functional score versus K3-H47R for missense variants. The K3 binding surface is delineated with a black dashed line. (Inset) Location of K3-H47R-resistant sites cited in the text. (C) Heatmap of PKR variants with cells colored by the PKR functional score versus K3-H47R for each variant. (D–F) Strip plots of PKR functional scores versus K3-H47R for variants, as plotted in Figure 2D–F. Variants are partitioned by nearest secondary structural element (D), level of conservation in vertebrates (E), or predicted contact with K3 (F). Points in D are ordered left to right by their position along the kinase domain, whereas they are randomly jittered along the x-axis in E and F. * p<0.05, ** p<0.01, **** p<0.0001, Tukey’s HSD (D) and two-sample t-test (E, F).
Figure 5—figure supplement 1
Differing patterns of resistance between wild-type K3 and K3-H47R.
(A) A nonlinear exponential curve (black line) was fitted to the data in the scatter plot from Figure 5A. Points are colored by their residuals from that curve (K3 /K3 H47R Residuals), ranging from enhanced (purple) to decreased (yellow) resistance to K3-H47R relative to the expectation from K3 resistance. This color scheme is used in panels B and C. (B) Surface structure of PKR kinase domain with sites colored by the mean K3 /K3 H47R residuals for missense variants. The K3 contact site is delineated with a black dashed line. (Inset) Location of K3-H47R-resistant sites where variants deviated most strongly between the wild-type K3 and K3-H47R conditions. (C) Heatmap of PKR variants with cells colored by the K3 /K3 H47R residuals for each variant. (D) Two PKR variants that did not follow the general trend of enhanced susceptibility to K3-H47R relative to K3 WT were selected for validation. The variants were generated and screened against K3Δ58, WT, and H47R alleles using a yeast growth assay visualized through serial dilution as in Figure 2—figure supplement 1.
Figure 5—figure supplement 2
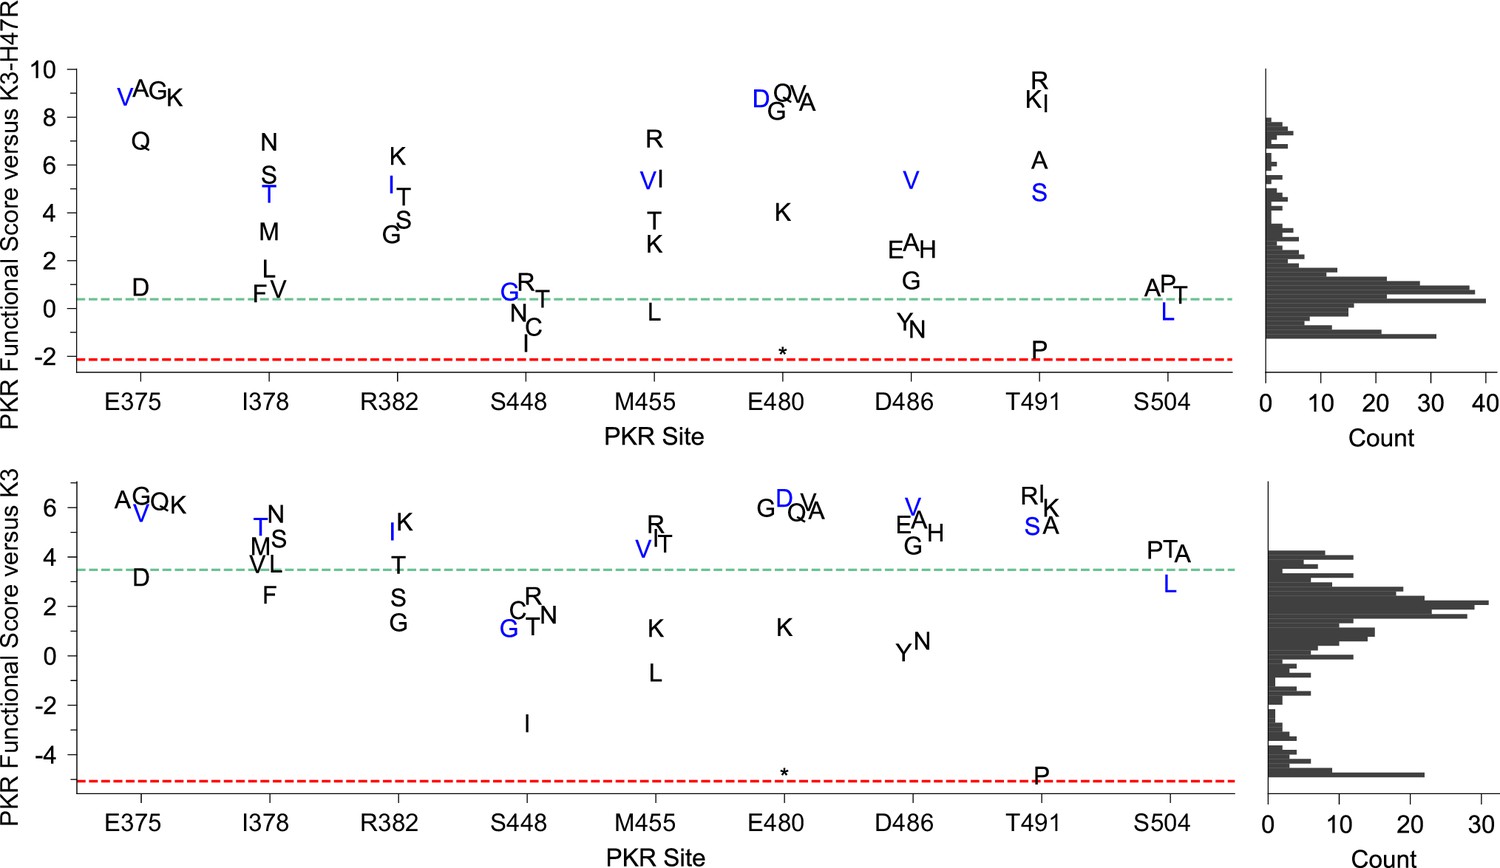
Additional variants at the sites of previously identified K3-H47R-resistant variants often also conferred resistance to K3.
Strip plots of PKR functional scores of variants paired with K3-H47R (top) and K3-WT (bottom). Each plot highlights PKR variants made at sites where an improved PKR variant was previously identified (Seo et al., 2008). Blue markers denote previously identified variants; black markers are additional variants made at the same site. Green and red dashed lines represent mean scores for WT PKR and nonsense variants, respectively. Histograms (right) show PKR functional scores versus K3-H47R (top) and K3 (bottom) for all variants. *=stop codon.
Figure 6

Unified spatial view of highlighted PKR sites across the K3-binding interface.
(A) Positions of sites classified as essential residues (black), K3-resistant (blue), and K3-susceptible (red) based upon the above analyses. All other tested sites are marked white. (Left) The vaccinia K3 binding surface of PKR is outlined with a black dashed line. (B) PKR functional scores versus K3Δ58 (Left), K3 (Center), and K3-H47R (Right), with each vertical line representing a PKR variant. Variants are sorted by functional score from high (left) to low (right). Gray and black lines indicate the standard deviation and standard error, respectively, in PKR functional scores across barcodes associated with the given variant. (C) (Left) AlphaFold2 model of Vaccinia K3 with surface residues colored as different from eIF2α (purple) or identical to eIF2α (gray) based on sequence alignment (Figure 4—figure supplement 1). (Right) Rotated 90°, K3 residues that contact the PKR activation loop or helix αD or αG are outlined in pink and dashed orange and burgundy, respectively.
Additional files
-
Supplementary file 1
Oligonucleotides used in the study.
- https://cdn.elifesciences.org/articles/99575/elife-99575-supp1-v1.xlsx
-
Supplementary file 2
Expanded list of oligonucleotides used to generate PKR variants.
- https://cdn.elifesciences.org/articles/99575/elife-99575-supp2-v1.xlsx
-
Supplementary file 3
Plasmids used in this study.
- https://cdn.elifesciences.org/articles/99575/elife-99575-supp3-v1.xlsx
-
Supplementary file 4
- https://cdn.elifesciences.org/articles/99575/elife-99575-supp4-v1.csv
-
Supplementary file 5
Root mean square deviation between AlphaFold2-predicted complexes and experimentally determined structures.
- https://cdn.elifesciences.org/articles/99575/elife-99575-supp5-v1.xlsx
-
Supplementary file 6
PDB-formatted atomic coordinate file for the AlphaFold2-predicted structure of the kinase domain of human PKR bound to human eIF2α.
- https://cdn.elifesciences.org/articles/99575/elife-99575-supp6-v1.zip
-
Supplementary file 7
PDB-formatted atomic coordinate file for the AlphaFold2-predicted structure of the kinase domain of human PKR bound to vaccinia K3.
- https://cdn.elifesciences.org/articles/99575/elife-99575-supp7-v1.zip
-
MDAR checklist
- https://cdn.elifesciences.org/articles/99575/elife-99575-mdarchecklist1-v1.pdf
Download links
A two-part list of links to download the article, or parts of the article, in various formats.
Downloads (link to download the article as PDF)
Open citations (links to open the citations from this article in various online reference manager services)
Cite this article (links to download the citations from this article in formats compatible with various reference manager tools)
Systematic genetic characterization of the human PKR kinase domain highlights its functional malleability to escape a poxvirus substrate mimic
eLife 13:RP99575.
https://doi.org/10.7554/eLife.99575.3


