Endopiriform neurons projecting to ventral CA1 are a critical node for recognition memory
- Department of Biomedicine, Aarhus University, Denmark
- PROMEMO, The Center for Proteins in Memory, Aarhus University, Denmark
- DANDRITE, The Danish Research Institute of Translational Neuroscience, Aarhus University, Denmark
- Dominick P. Purpura Department of Neuroscience, Albert Einstein College of Medicine, United States
- Department of Psychiatry and Behavioral Sciences, Albert Einstein College of Medicine, United States
Figures
Figure 1 with 1 supplement
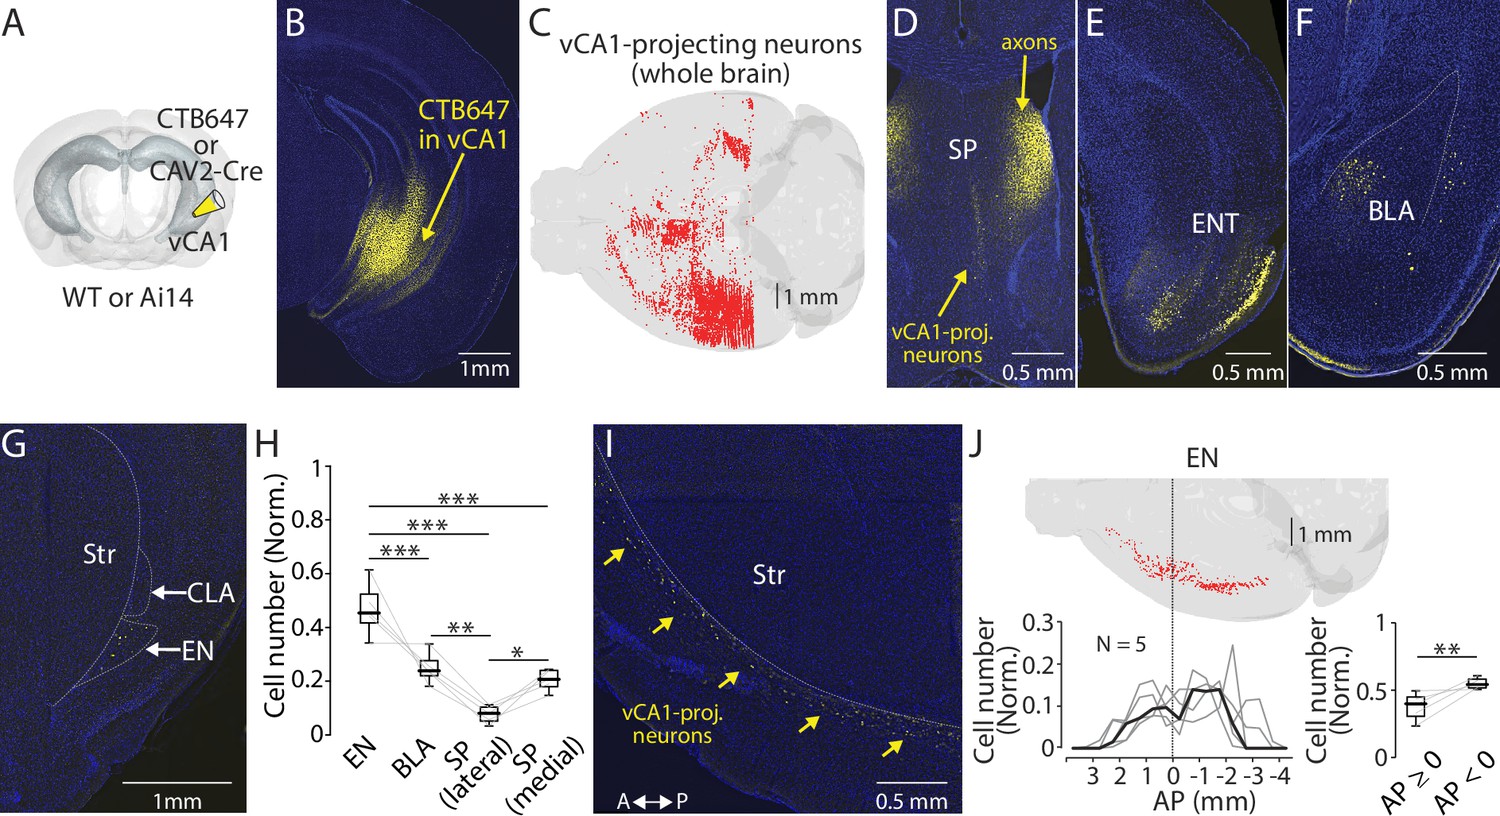
Endopiriform projects to the ventral CA1.
(A) Schematic diagram of a retrograde tracer injection performed. CAV-2-Cre or CTB647 was used in combination with Ai14 or wild-type mice, respectively. (B) An example fluorescent image of the injection site. (C) Distribution of retrogradely labeled ventral CA1 (vCA1)-projecting neurons in the entire brain as a result of injection in panel B. (D–G) Fluorescent images showing retrogradely labeled vCA1-projecitng neurons in the septum (SP), entorhinal cortex (ENT), basolateral amygdala (BLA), and endopiriform (EN). Str: Striatum, CLA: Claustrum. (H) Box plots showing a relative number of vCA1-projecting neurons in different brain areas. Cell numbers in each brain area were normalized by summed cell numbers of EN, BLA, SP (lateral), and SP (medial). Cell numbers in each brain areas of individual brains are presented in Table 1. Median values for EN, BLA, SP (lateral), and SP (medial) is 0.45, 0.24, 0.08, and 0.21, respectively. Statistics: EN vs BLA, SP (lateral), or SP (medial), p<0.001 for all; BLA vs SP (lateral) or SP (medial): p=0.002 and 0.694, respectively; SP (lateral) vs SP (medial) p=0.023. One-way ANOVA, repeated comparison with Tukey-Kramer test. N=5. (I) An example fluorescent image of the horizontal section showing retrogradely labeled vCA1-projecting neurons in EN. A: anterior, P: posterior. (J) Top: Example map showing the distribution of vCA1-projecting neurons in the entire EN in one mouse. Bottom left: A plot showing a quantified distribution at a bin size of 1 mm. Each bin was normalized to the total number of labeled neurons in EN. Data from each mouse is shown in gray. Median is indicated in black. Bottom right: Box plots comparing a number of vCA1-projecting neurons in anterior and posterior EN. Data were normalized to the total number of labeled neurons in EN. Median value for anterior vs posterior was 0.39 vs 0.54. Statistics: p=0.008, Rank-sum.
-
Figure 1—source data 1
Presynaptic cell numbers projecting to vCA1.
- https://cdn.elifesciences.org/articles/99642/elife-99642-fig1-data1-v1.xlsx
-
Figure 1—source data 2
Presynaptic cell numbers projecting to vCA1.
- https://cdn.elifesciences.org/articles/99642/elife-99642-fig1-data2-v1.xlsx
Figure 1—figure supplement 1
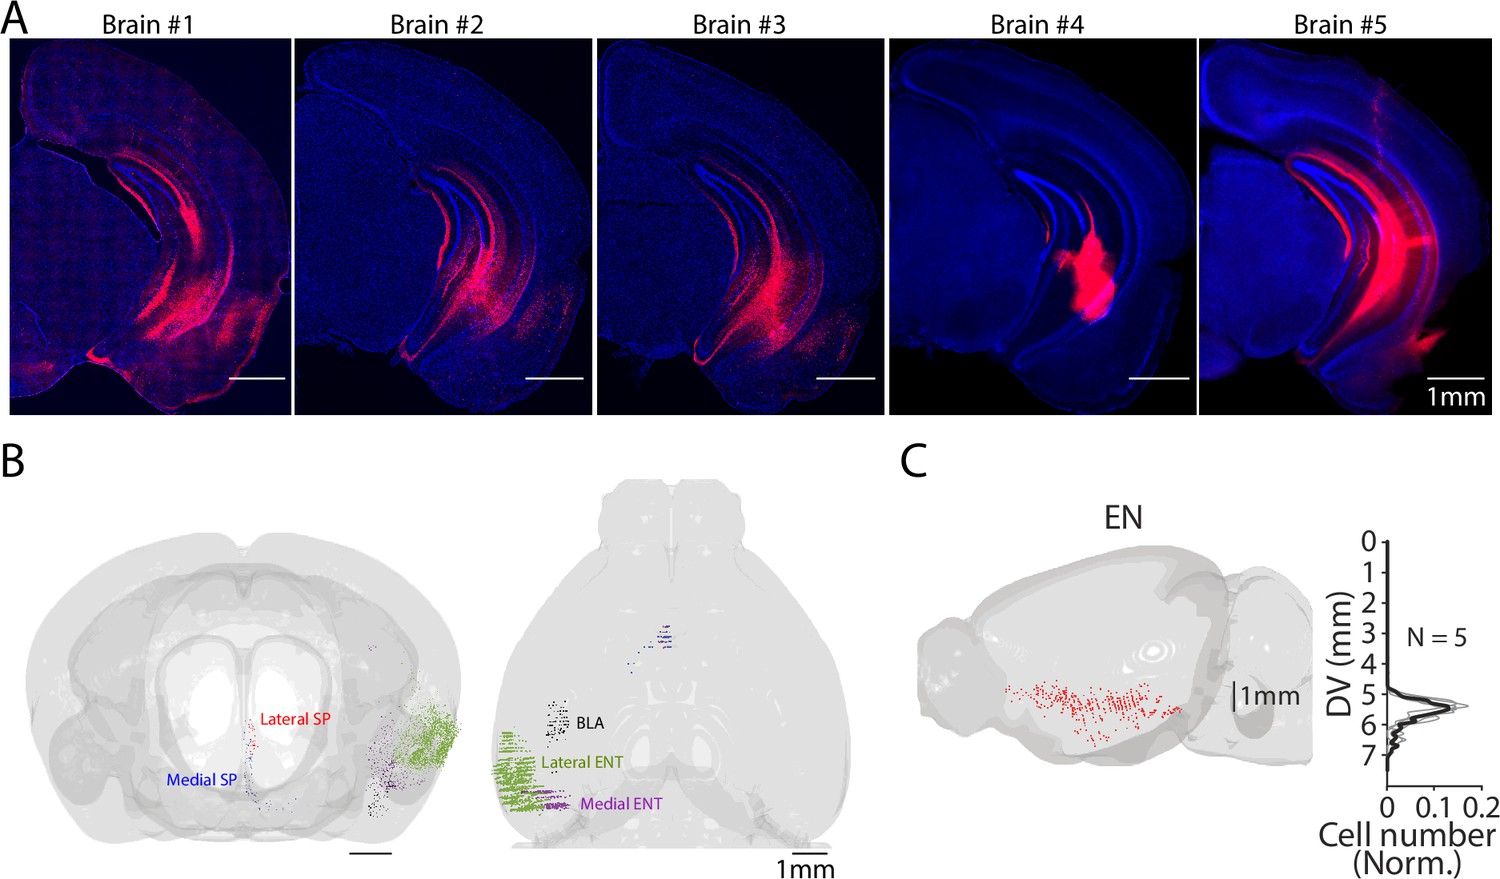
Whole brain distribution of ventral CA1 (vCA1)-projecting neurons.
(A) Fluorescent images of the injection site (vCA1) of CAV2-Cre (60 nl) of Ai14 mice for analysis of presynaptic neuron distribution using AMaSiNe. The presynaptic cell numbers counted in individual brains are presented in Table 1. (B) An example distribution map of vCA1-projecting neurons in septum (SP) (lateral andmedial), basolateral amygdala (BLA), and entorhinal cortex (ENT) (lateral and medial) shown from front and top view. Neurons in different brain areas are color-coded. (C) The side view of the brain shown in Figure 1J. Plots indicate the distribution of vCA1-projecting neurons in endopiriform (EN) along the dorsal-ventral axis (DV). Data from different mice are shown in gray. Median is indicated in black.
Figure 2 with 1 supplement
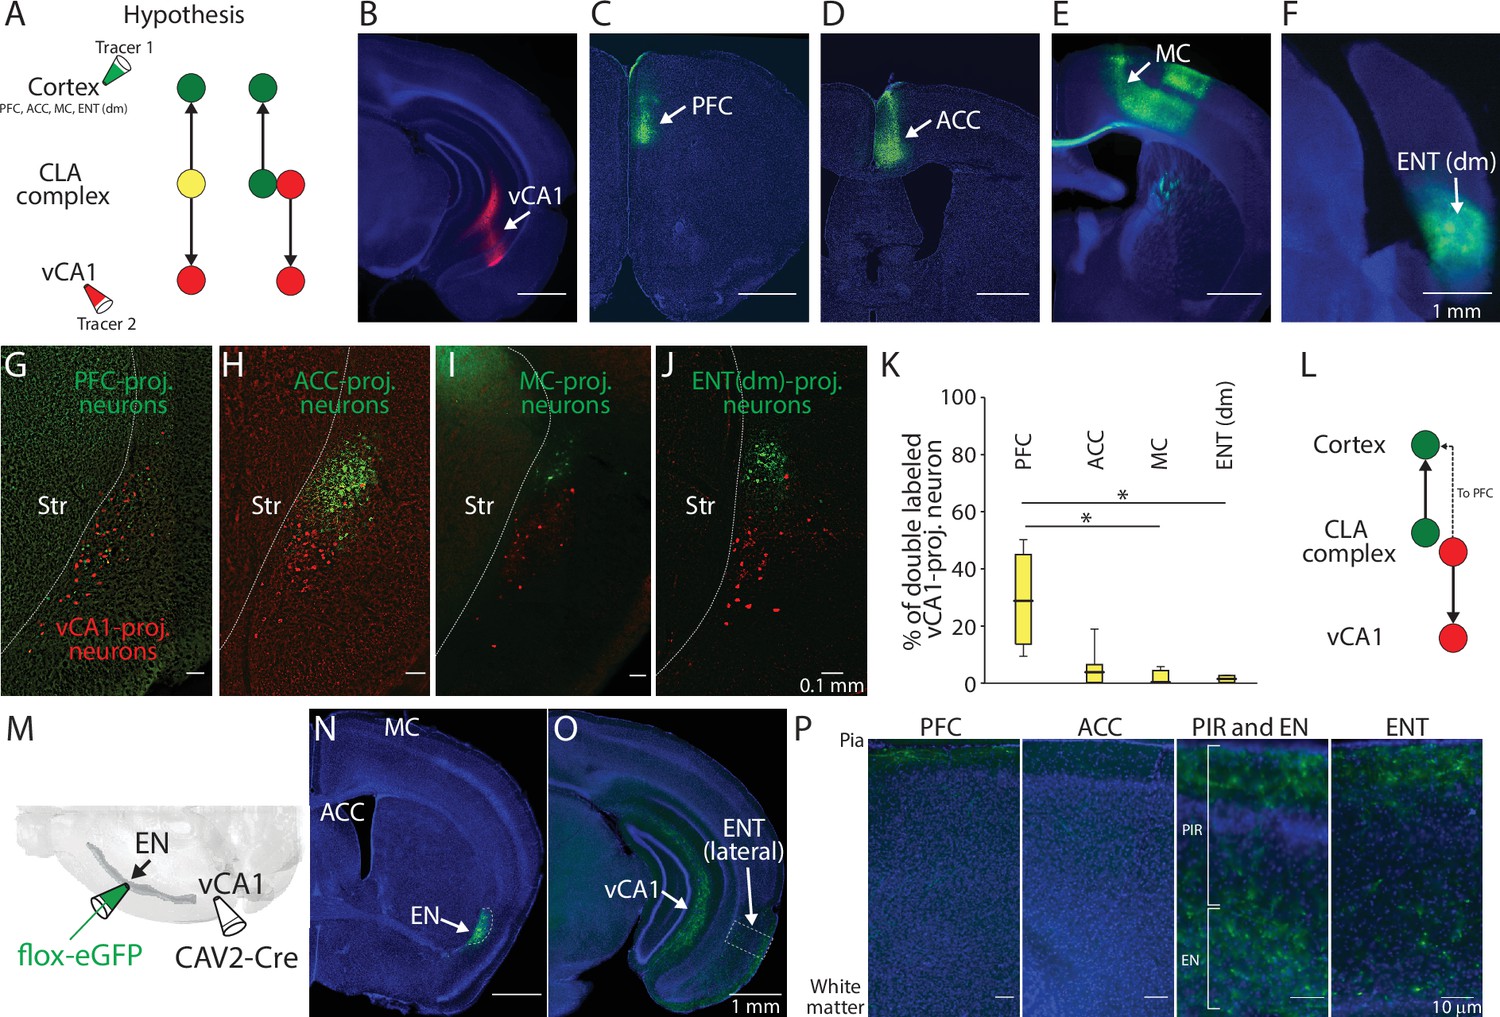
Axon branching of ventral CA1 (vCA1)-projecting endopiriform (EN) neurons.
(A) Schematic diagram of injection performed and two hypothesized outcomes. Yellow color indicates double-labeled neurons. PFC: Prefrontal cortex, ACC: Anterior cingulate cortex, MC: Motor cortex, ENT(dm): Dorsomedial entorhinal cortex, CLA: claustrum (B–F) Example fluorescent images of the injection site for each region indicated. (G–J) Example fluorescent images of retrogradely labeled neurons in CLA complex. vCA1-projecting neurons were colored in red and cortex-projecting neurons were colored in green. (K) Box plots showing the percentage of double-labeled vCA1-projecting neurons for each cortical injection. Medial values for PFC, ACC, MC, and ENT(dm) were 28.6, 4.6, 0, and 1.2, respectively. Statistics: PFC vs ACC, MC or ENT(dm), p=0.405, 0.015, and 0.047, respectively. ACC vs MC or ENT (dm), p=0.422 and 0.64, respectively. MC vs ENT (dm), p=0.993. One-way ANOVA with post-hoc Kruskal-Wallis test. Slice and animal numbers: 16 and 4 for PFC, 20 and 5 for ACC, 10 and 3 for MC, and 18 and 4 for ENT(dm). (L) Schematic diagram of projection pattern found in the experiment shown in A. (M) Schematic diagram of the intersectional approach performed to label vCA1-projecting EN neurons. (N–O) Example fluorescent images showing vCA1-projecting axons in different brain areas. All images were from the same mouse. (P) Magnified images showing vCA1-projecting axons in cortical layers. Magnified areas are indicated in (O) and fig. S2A-C as dashed squares. PIR: Piriform cortex.
-
Figure 2—source data 1
Single and double labeled EN cell numbers.
- https://cdn.elifesciences.org/articles/99642/elife-99642-fig2-data1-v1.xlsx
Figure 2—figure supplement 1
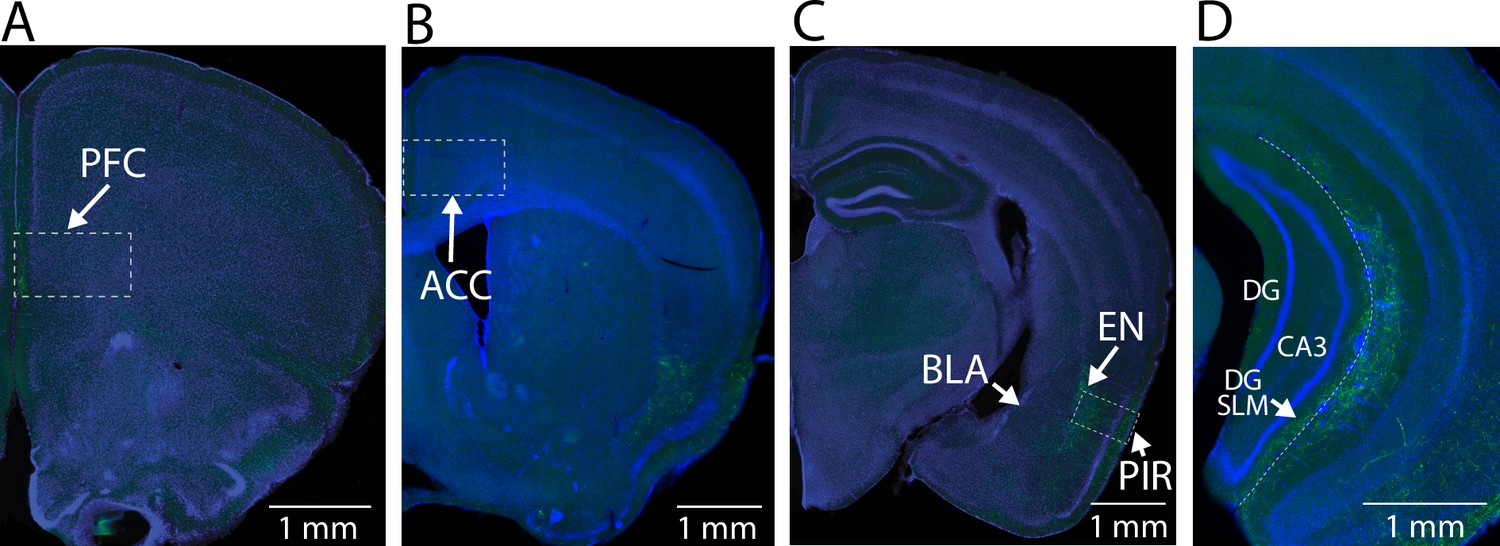
Axon branching of ventral CA1 (vCA1)-projecting endopiriform (EN) neurons.
(A-D) Example fluorescent images of branching of vCA1-projecting neurons. All images were from the same mouse shown in Figure 2N–O. DG: Dentate gyrus.
Figure 3 with 1 supplement
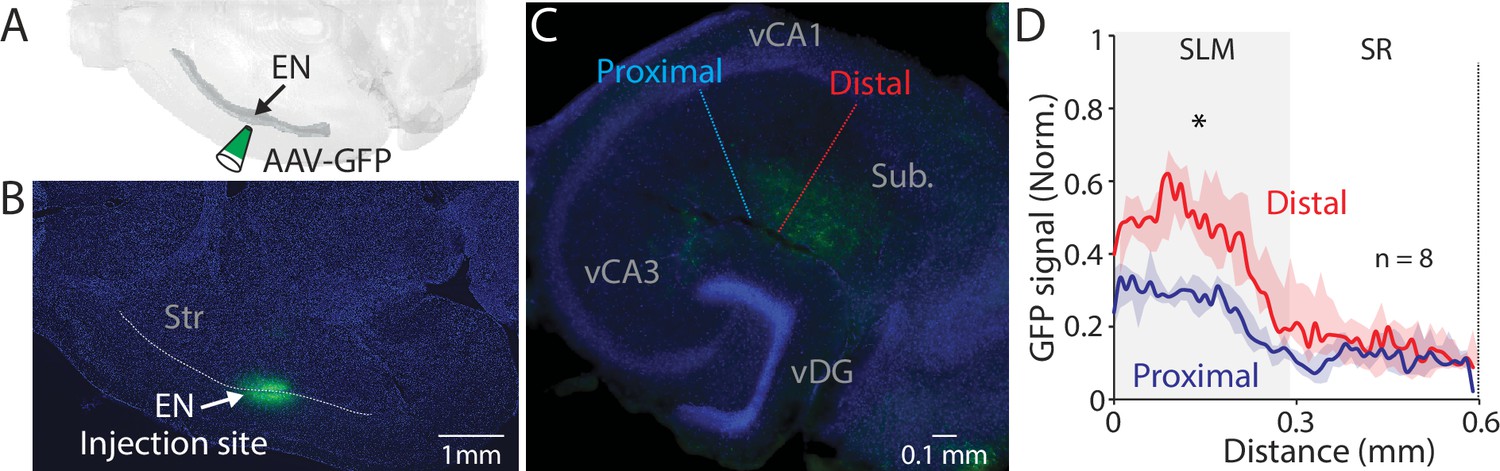
EN projection pattern in ventral CA1 (vCA1).
(A) Schematic diagram of injection performed. (B) An example fluorescent image of a horizontal brain section containing an injection site in endopiriform (EN). (C) An example fluorescent image of the ventral hippocampal slice with EN axons resulted from the injection in panel B. Dashed lines indicate the distal and proximal vCA1 regions where GFP signals were measured for the plot in panel D. (D) Normalized GFP signals across the layer. All signals were normalized by the maximum GFP signal in the distal subregion. Median of the area under the curve: distal; 11.12, proximal; 5.99. distal vs proximal, p=0.016. Wilcoxon signed-rank test. n=8 slices (N=4 mice). SR: stratum radiatum, Py: pyramidal layer.
-
Figure 3—source data 1
Normalized GFP signals in hippocampal slices.
- https://cdn.elifesciences.org/articles/99642/elife-99642-fig3-data1-v1.xlsx
Figure 3—figure supplement 1
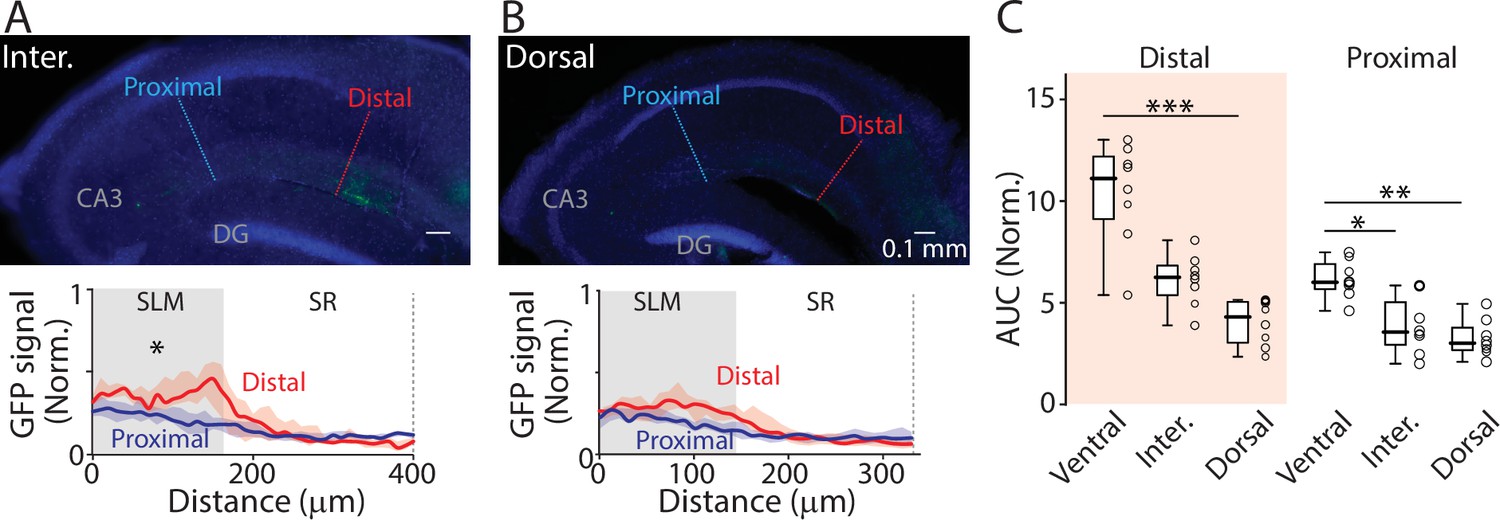
Projections of ENvCA-proj. neurons to the hippocampus.
(A) Top: An example fluorescent image of intermediate hippocampal sections from the same brain as in Figure 3B and C. Bottom: GFP signal profile at the distal and proximal region indicated in the top image. (B) The same as in (A) but for the dorsal hippocampus. Median area under the curve (AUC): distal vs proximal (intermediate), 6.3 vs 3.5, p=0.007; distal vs proximal (dorsal), 4.3 vs 3.0, p=0.055; Wilcoxon signed-rank test. n=8 slices (N=4 mice). (C) Comparison of GFP signal (in AUC) between different hippocampal axis for distal or proximal ventral CA1 (vCA1). Distal; ventral vs intermediate, p=0.086; ventral vs dorsal, p<0.001; intermediate vs dorsal, p=0.136. Proximal: ventral vs intermediate, p=0.018; ventral vs dorsal, p=0.001; intermediate vs dorsal, p=0.695; Kruskal-Wallis test. n=8 slices (N=4 mice).
Figure 4 with 1 supplement
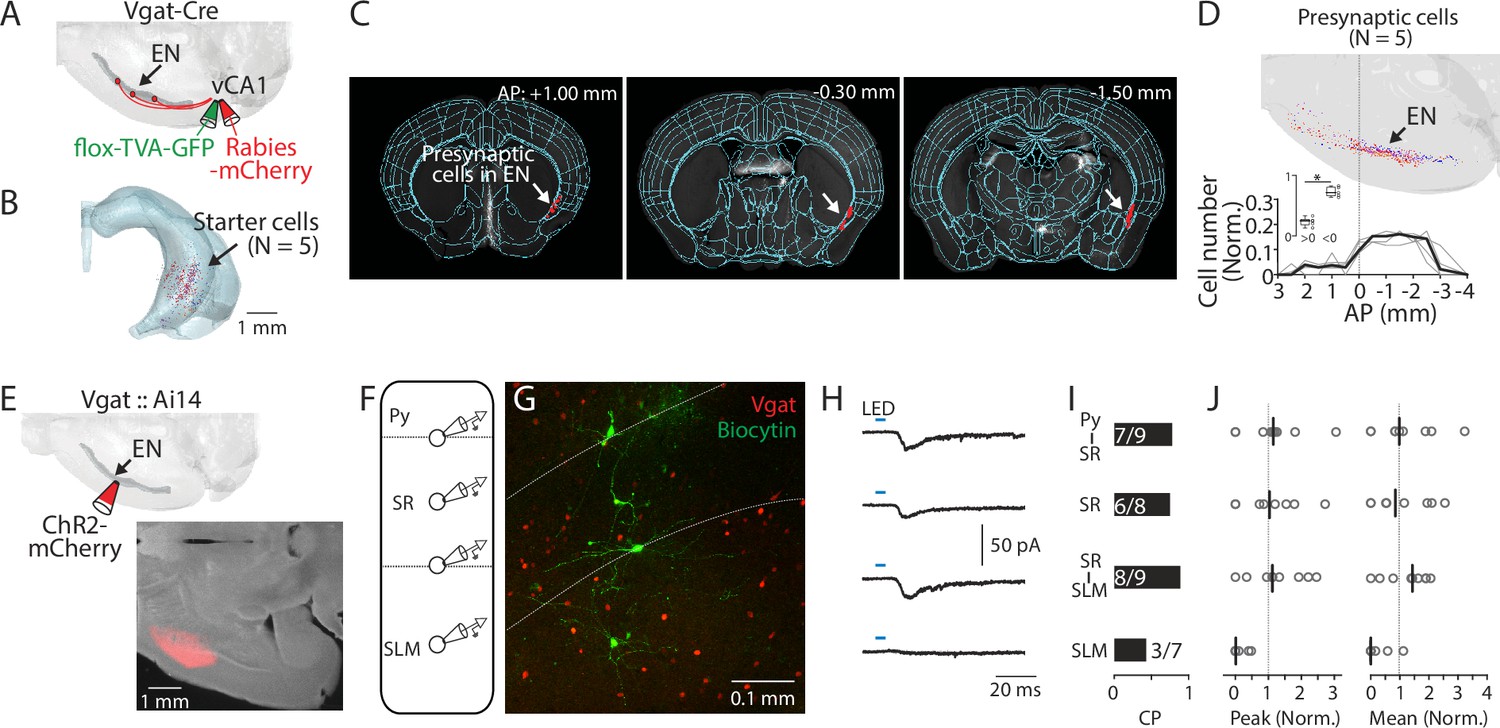
ENvCA1-proj. neurons target ventral CA1 (vCA1) interneurons.
(A) Schematic diagram of injection performed for monosynaptic rabies tracing. Flox-TVA-GFP (60 nl) was injected into the vCA1. 4 wk later, Rabies-mCherry (60 nl) was injected. (B) Location of starter cells in the hippocampus. Data from five brains (each brain represented by a different color) were overlaid. (C) Example images showing presynaptic cells in endopiriform (EN) (white arrow). (D) Top: Location of presynaptic EN neurons. Data from five brains were overlaid (different brains were coded by different colors). Bottom: Plots indicate the distribution of presynaptic cells in EN along the AP axis. Cell counts in a given bin (1 mm) were normalized by the total cell number in EN. Thin gray lines indicate individual data. A thick black line indicates median. Inset showing plot comparing cell number in anterior and posterior location as in Figure 1J. Median: anterior vs posterior, 0.25 vs 0.72, p=0.031; Wilcoxon signed-rank test. (E) Top: Schematic diagram of the injection performed. Bottom: An example fluorescent image of injection site in EN. (F) Schematic diagram of recordings performed. Recordings were performed from identified GABAergic neurons sequentially in a random order. (G) An example confocal image of an acute vCA1 slice is used for recordings. Recorded GABAergic neurons were filled with biocytin and post-labeled with Alexa488. White dashed lines indicate the border of Py-SR and SR-SLM. (H) Median traces of photo-evoked EPSCs were recorded from neurons at different laminar positions. (I) Connection probability (CP) of EN axons and recorded neurons at different laminar positions. Numbers in bars indicate number of response-positive neurons /total recorded neurons. (J) Left: Peak amplitudes of evoked EPSCs (normalized to total input from recorded slice). Right: the same as left but for mean amplitude. Gray circles indicate each neuron. Black lines indicate the median. Median (peak amp): Py-SR vs SR, SR-SLM or SLM: 1.1 vs 1.0 vs 1.1 vs 0.0. [Py-SR vs SR, SR/SLM vs SLM], p=0.999, 0.988, 0.076; [SR vs SR-SLM or SLM], p=0.972, 0.111; [SR-SLM vs SLM], p=0.039; one-way ANOVA, repeated comparison with Tukey-Kramer test. Median (mean amp): Py-SR vs SR, SR-SLM, or SLM: 1.0 vs 0.8 vs 1.4 vs 0.0. [Py-SR vs SR, SR-SLM or SLM], p=0.991, 0.999, and 0.141; [SR vs SR-SLM or SLM], p=0.978, and 0.251; [SR-SLM vs SLM], p=0.114; one-way ANOVA, repeated comparison with Tukey-Kramer test. N=5 mice.
-
Figure 4—source data 1
Number of presynaptic cells projecting to ventral hippocampal interneurons.
- https://cdn.elifesciences.org/articles/99642/elife-99642-fig4-data1-v1.xlsx
-
Figure 4—source data 2
Recorded EN-evoked EPSPs from ventral CA1 interneurons.
- https://cdn.elifesciences.org/articles/99642/elife-99642-fig4-data2-v1.xlsx
Figure 4—figure supplement 1
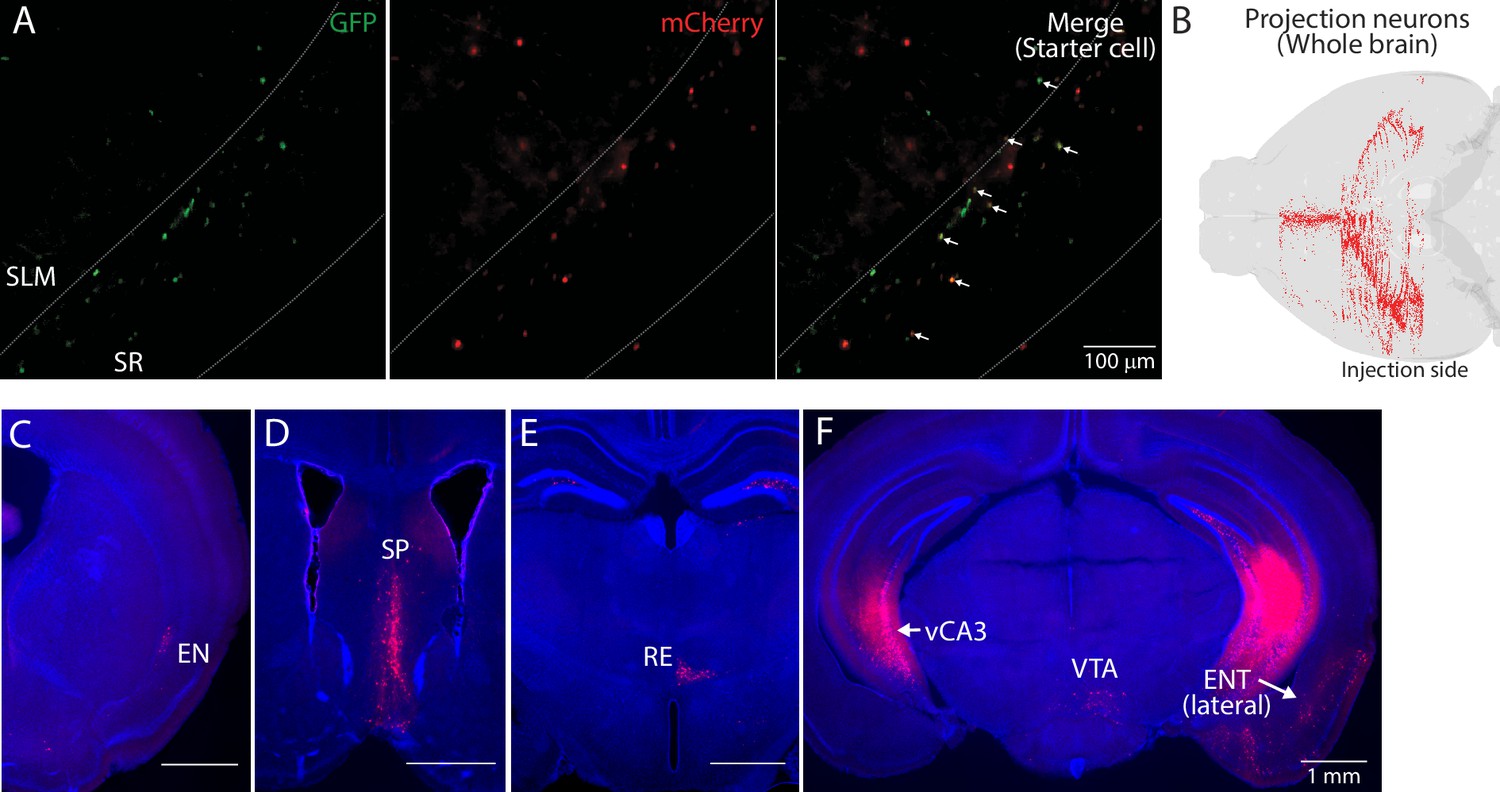
Presynaptic neurons of ventral hippocampal GABAergic neurons.
(A) Example fluorescent images of starter cells in ventral CA1 (vCA1). TVA_oG-expressing neurons were labeled by GFP and rabies-expressing neurons were labeled by mCherry. GFP and mCherry double-expressing neurons were counted as starter cells. White allows in eight panels indicating starter cells. White dashed lines indicate the Py-SR and SR-SLM border. (B) An example map of presynaptic cells in a whole brain. Injection was made in the left hemisphere. (C–F) Fluorescent images of presynaptic cells in coronal sections from the same mouse brain. Presynaptic neurons were in endopiriform (EN) (C), septum (SP) (D), nucleus reunion (RE) (E), contralateral vCA3 (vCA3) (F), ventral tegmental area (VTA) (F), and lateral ENT (F).
Figure 5 with 1 supplement
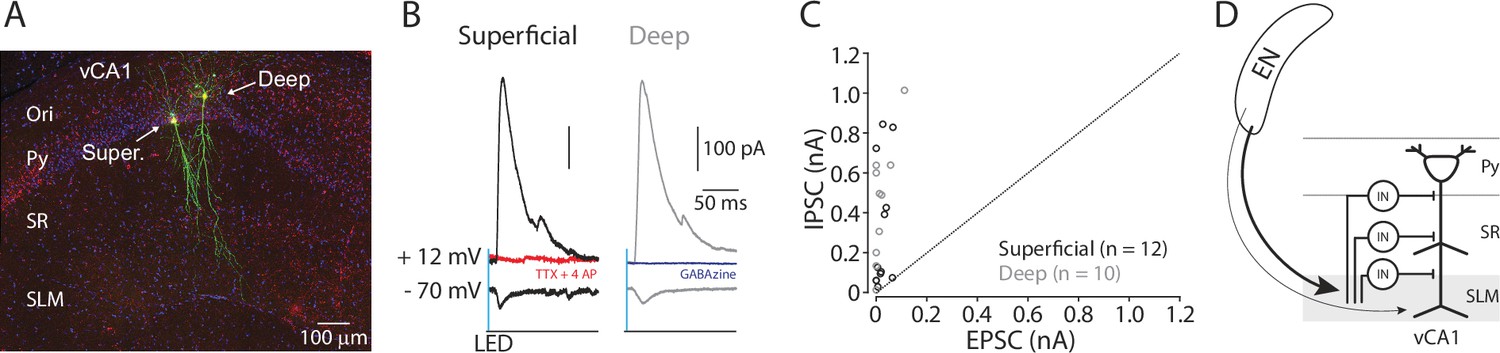
EN disynaptically inhibits ventral CA1 (vCA1) pyramidal neurons.
(A) A confocal image of recorded pyramidal neurons in vCA1. Recorded pyramidal neurons were filled with biocytin and post-labeled with Alexa488. Ori.: oriens, Super.: superficial layer pyramidal neuron. Deep: deep layer pyramidal neuron. (B) Example traces of photo-evoked EPSCs and IPSCs in superficial (black trace) and deep (gray trace) pyramidal neurons. Red trace: after TTX and 4AP. Blue trace: after gabazine. (C) Scatter plots of peak amplitudes of EPSCs and IPSCs for each neuron. Dashed line indicates a unitary line. Superficial neurons: empty Black circles. Deep neurons: Gray circles. N=4 mice. (D) A summary diagram of EN→vCA1 circuit. In vCA1, EN axons innervate GABAergic neurons (IN), which in turn inhibits pyramidal neurons (both superficial and deep).
-
Figure 5—source data 1
All EPSC and IPSC amplitude in Figure 5C.
- https://cdn.elifesciences.org/articles/99642/elife-99642-fig5-data1-v1.xlsx
Figure 5—figure supplement 1

Endopiriform (EN)-mediated excitatory inputs to ventral hippocampal neurons.
(A) Plots comparing peak amplitude of photo-evoked excitatory postsynaptic currents (EPSCs) in superficial and deep pyramidal neurons. Thin gray lines indicate paired data. Median peak amplitude; superficial vs deep (in pA): 11.5 vs 5.9, p=0.625; signed-rank test. (B) Plots comparing peak amplitude of photo-evoked EPSCs in pyramidal and GABAergic neurons. The data from superficial and deep pyramidal neurons were pooled. n=10 for pyramidal neurons and 11 for GABAergic neurons. N=4 mice. Median EPSC peak amplitude: Pyramidal vs GABAergic (in pA): 7.4 vs 8.0, p=0.86. Rank-sum test.
Figure 6 with 1 supplement
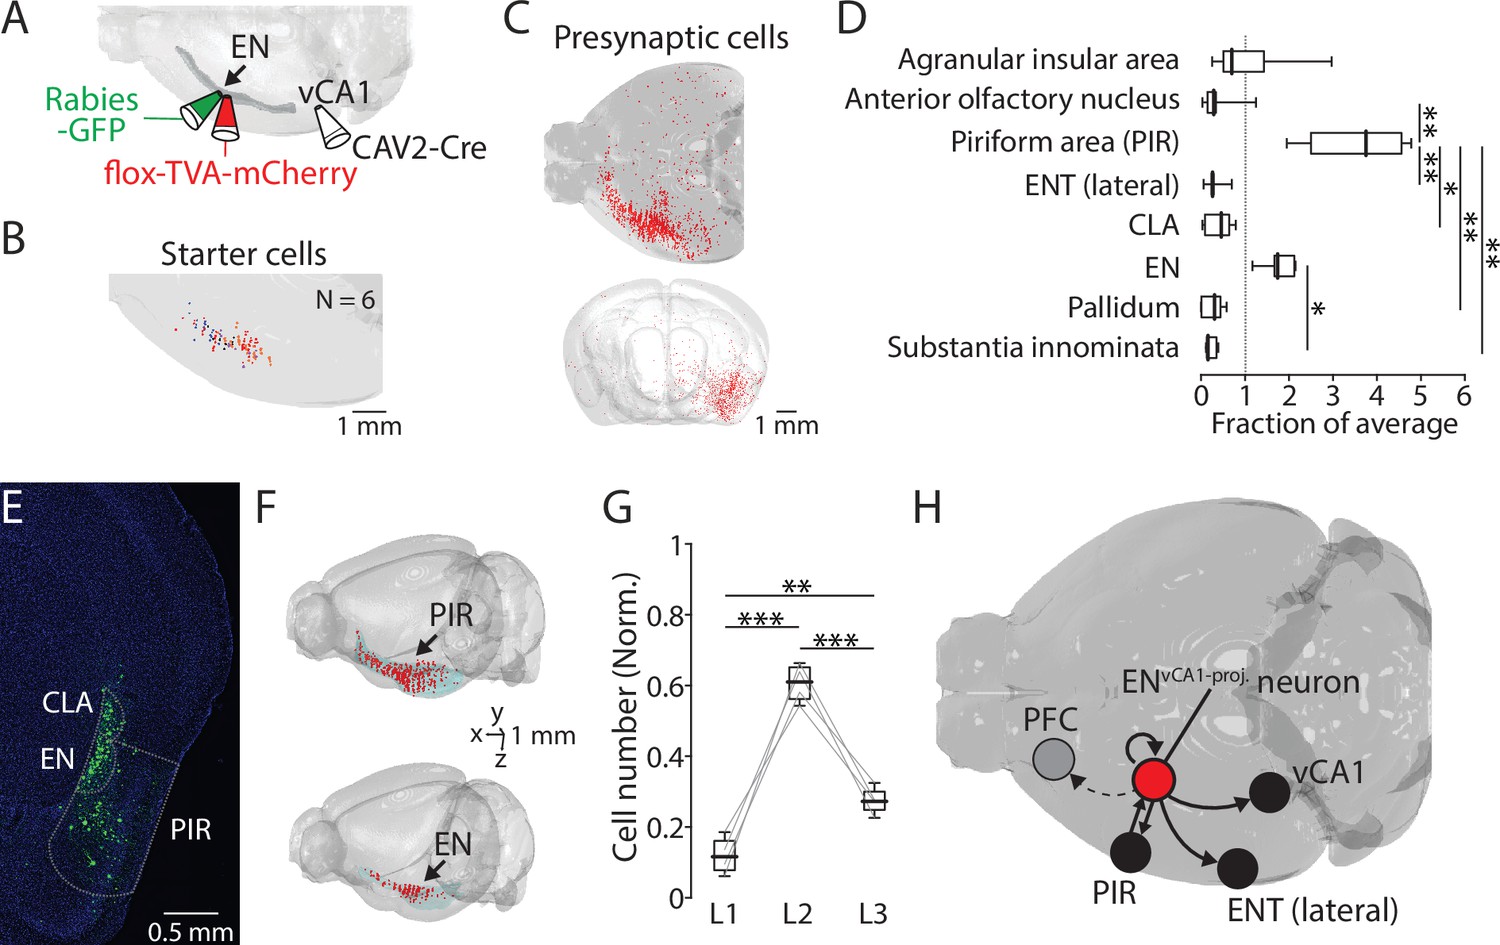
ENvCA1-proj. neurons receive inputs from the piriform cortex and within endopiriform (EN).
(A) Schematic diagram of performed. After CAV2-Cre (60 nl) injection into the ventral CA1 (vCA1), flox-TVA-mCherry (100 nl) was injected into the EN. 4 wk later, Rabies-GFP (100 nl) was injected into the EN. (B) Location of starter cells in EN. Data from six brains were overlaid. (C) An example map of presynaptic cells in one brain. Top: Horizontal view. Injections were made in the left hemisphere. Bottom: Front view. (D) Number of presynaptic cells in different brain areas (normalized to total presynaptic cell number). Median for AIA, AON, PIR, ENT(lateral), CLA, EN, Pallidum, and SI (in fraction): 0.7, 0.3, 3.8, 0.3, 0.5, 1.7, 0.3, and 0.2. [AON, ENT(lateral), CLA, Pallidum, SI] vs PIR: p=0.016, 0.008, 0.048, 0.006, and 0.003. EN vs SI, p=0.043. one-way ANOVA with post-hoc Kruskal-Wallis test. Full list of statistical tests and p-values is in Table 2. (E) An example fluorescent image of coronal slice containing EN and PIR and labeled presynaptic cells. (F) Example maps of a presynaptic cells in PIR (top) and EN (bottom). (G) Number of presynaptic cells in PIR in different layers (normalized to the total number of labeled neurons in PIR). Median: L1 vs L2 vs L3, 0.11 vs 0.61 vs 0.27. L1 vs L2, p<0.001; L1 vs L3, p=0.005; L2 vs L3, p<0.001; one-way ANOVA, repeated comparison with Tukey-Kramer test. (H) Summary diagram showing an input-output circuit of ENvCA1-proj. neurons (red circle).
-
Figure 6—source data 1
Numbers of presynaptic cells projecting to ENvCA1-proj. neurons.
- https://cdn.elifesciences.org/articles/99642/elife-99642-fig6-data1-v1.xlsx
-
Figure 6—source data 2
Number of presynaptic piriform cells projecting to ENvCA1-proj. neurons in different layers.
- https://cdn.elifesciences.org/articles/99642/elife-99642-fig6-data2-v1.xlsx
Figure 6—figure supplement 1
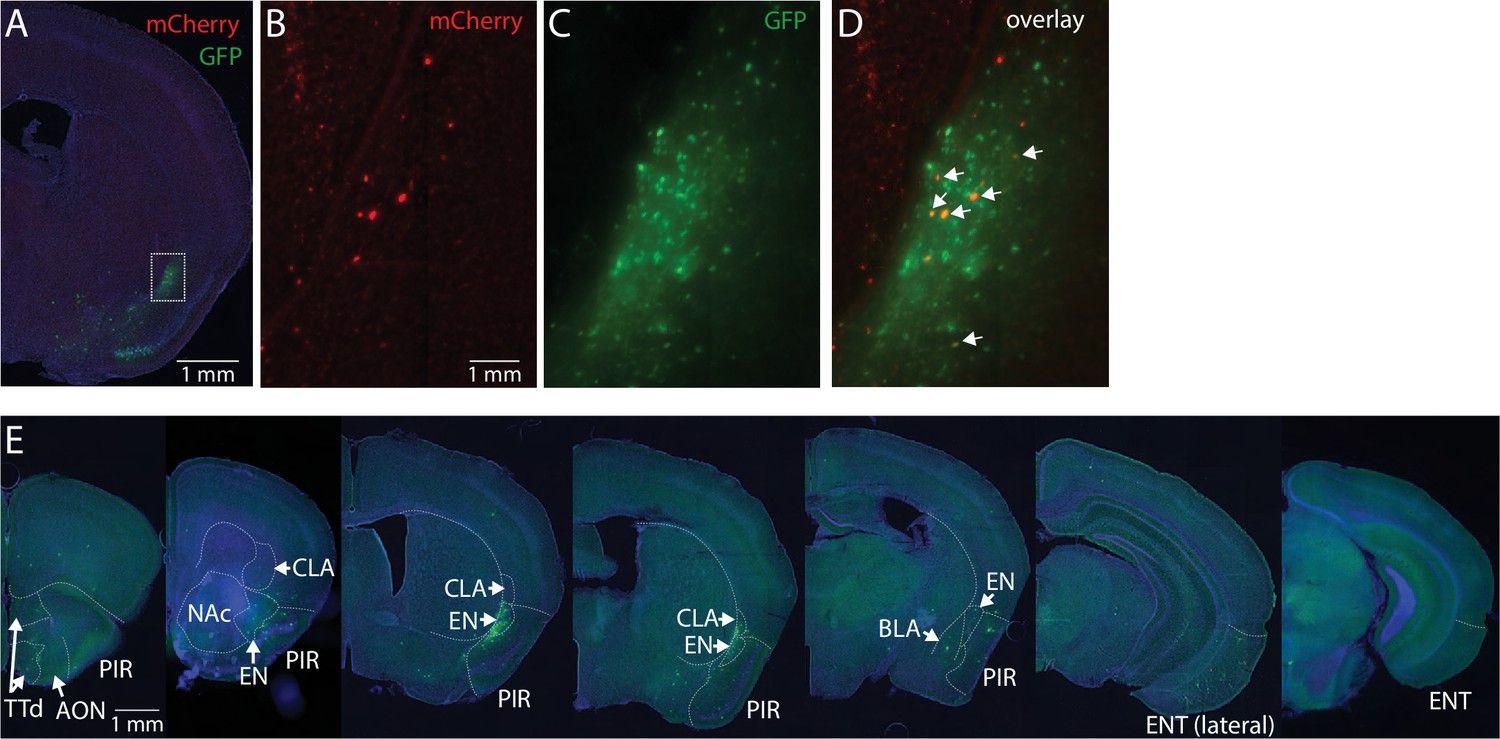
Presynaptic neurons of ENvCA1-proj. Neurons.
(A) An example fluorescent image of starter cells in endopiriform (EN). (B–D) Expanded images of the area marked by a white square in panel A. White allows indicate starter cells. (E) Example fluorescent images of coronal sections in series. Labeled neurons (in green) indicate presynaptic cells of ENvCA1-proj. neurons. TTd: Taenia tecta, AON: Anterior olfactory nucleus, PIR: Piriform cortex, NAc: Nucleus accumbens, EN: Endopiriform, CLA: Claustrum, BLA: Basolateral amygdala, ENT: Entorhinal cortex.
Figure 7 with 2 supplements
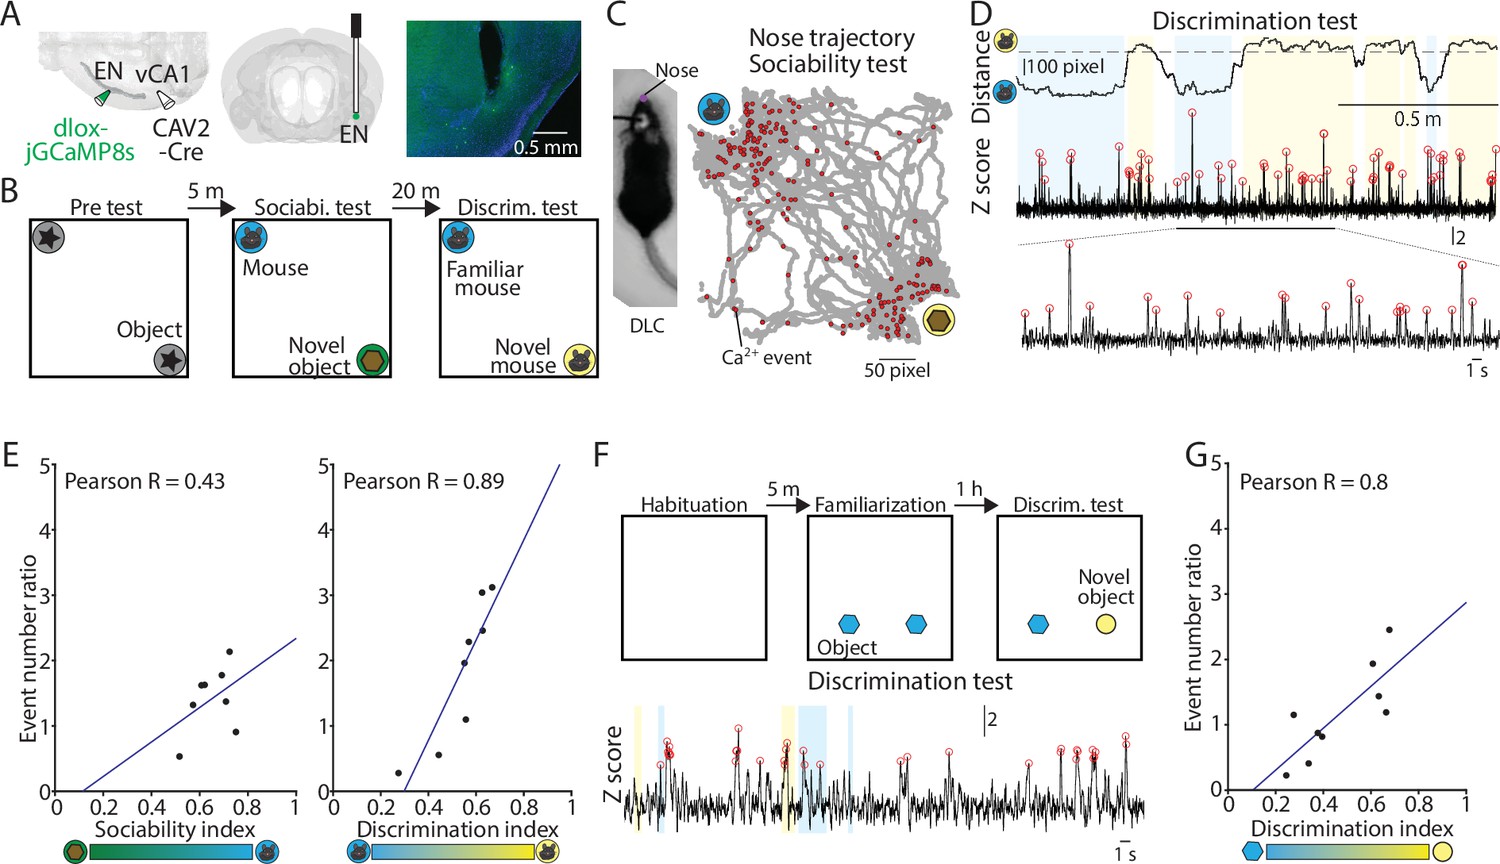
Activity of ENvCA1-proj. neurons correlate with social/object discrimination performance.
(A) Right and Middle: Schematic diagrams of injection and optic cannula implantation performed. CAV2-Cre (60 nl) was injected into the vCA1, and dlox-jGCaMP8s (100 nl) was injected into the endopiriform (EN). Left: An example image showing jGCaMP8s expressing ENvCA1-proj. neurons and a tract of optic cannula. (B) The diagram of social recognition memory test. A test consisted of pretest (5 min), sociability test (10 min), and discrimination test (5 min). (C) Left: An example image of a mouse with a nose point marker tracked by DLC. Right: An example map of nose points and calcium events in the arena during the sociability test. (D) Nose distance vector (distance between subject’s nose point and a center point of novel/familiar mouse chambers) and simultaneously acquired calcium signals during discrimination test. Gray dashed lines indicate the border of interaction zones. Open red circles indicate the calcium event detected (threshold: Z>2.58). A part of the calcium signal trace was expanded at the bottom for clarity. (E) Left: Correlation between calcium event ratios (calcium event number in the mouse interaction zone/ calcium event number in the object interaction zone) and sociability index. p=0.29, N=8 mice. Right: same as in the left panel, but for calcium event ratios (calcium event number in the unfamiliar mouse interaction zone/calcium event number in the familiar mouse interaction zone) and discrimination index. p=0.003, N=8. (F) The diagram of novel object recognition memory test. A test consisted of habituation (5 min), familiarization (10 min), and discrimination test (5 min). (G) Same as in (E), but for calcium event number ratios calcium event number in the unfamiliar object interaction zone/calcium event number in the familiar object interaction zone and discrimination index. p=0.01. N=9 mice.
-
Figure 7—source data 1
Raw data of Figure 7E, G.
- https://cdn.elifesciences.org/articles/99642/elife-99642-fig7-data1-v1.xlsx
Figure 7—figure supplement 1
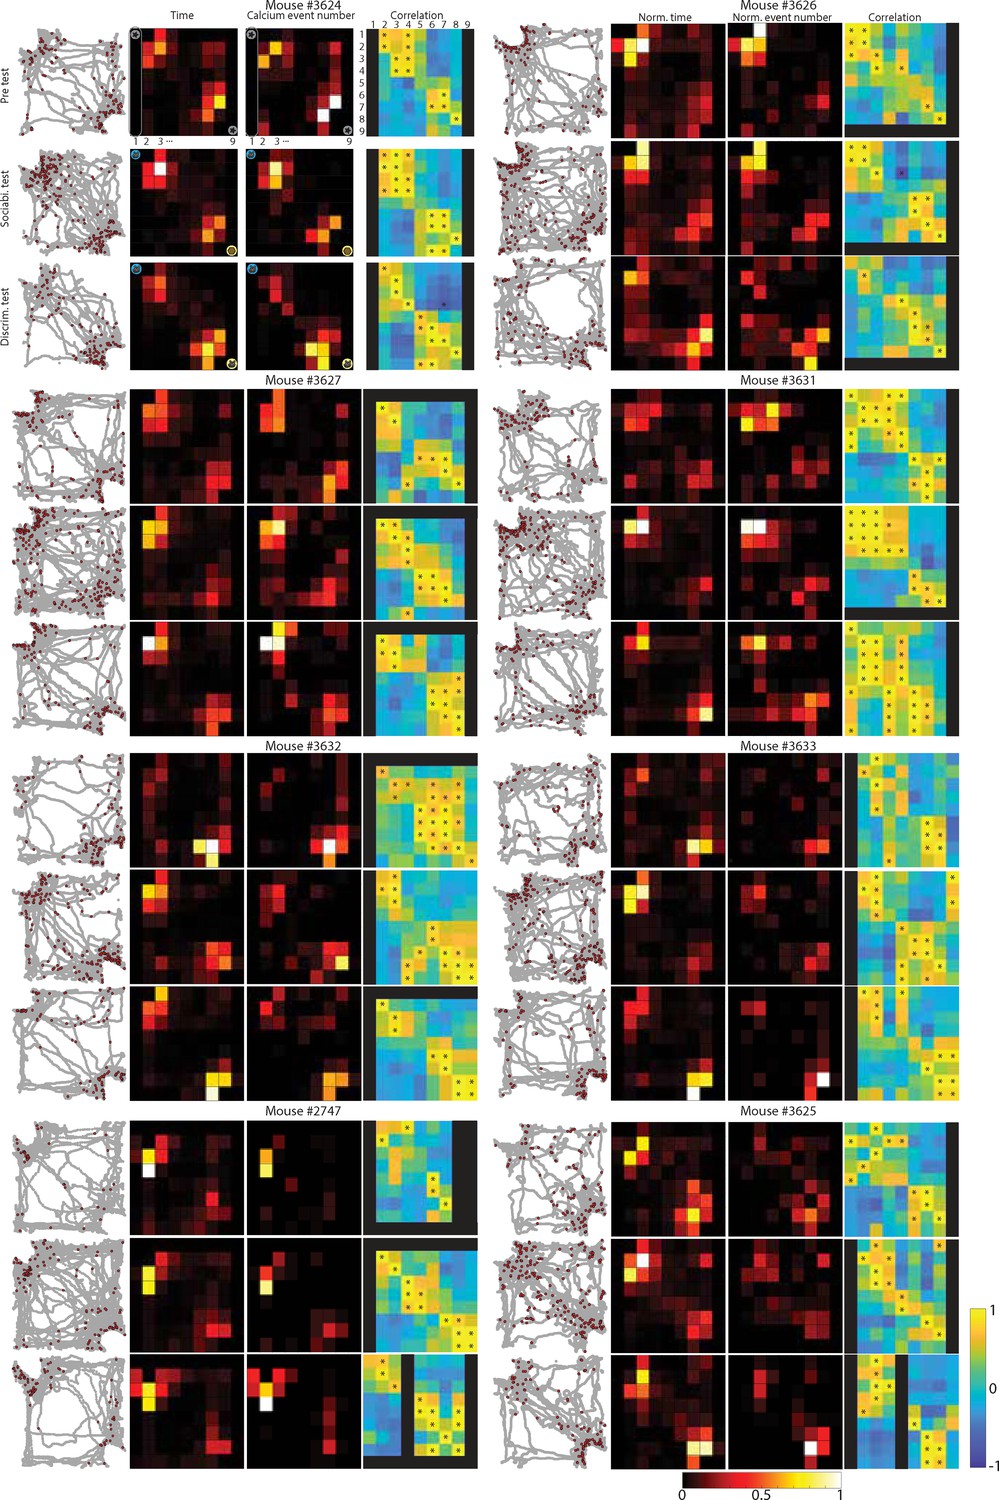
Nose point location and calcium signal data during social memory test.
Maps of nose points (filled gray circles) and calcium events (filled red circles) in the arena. Heat maps of the same data (but cumulative time and calcium event are separated) were also shown for each mouse (N=8). Peason’s correlation coefficients with p<0.05 are indicated by an asterisk. All p-values were presented in Supplementary file 1.
Figure 7—figure supplement 2
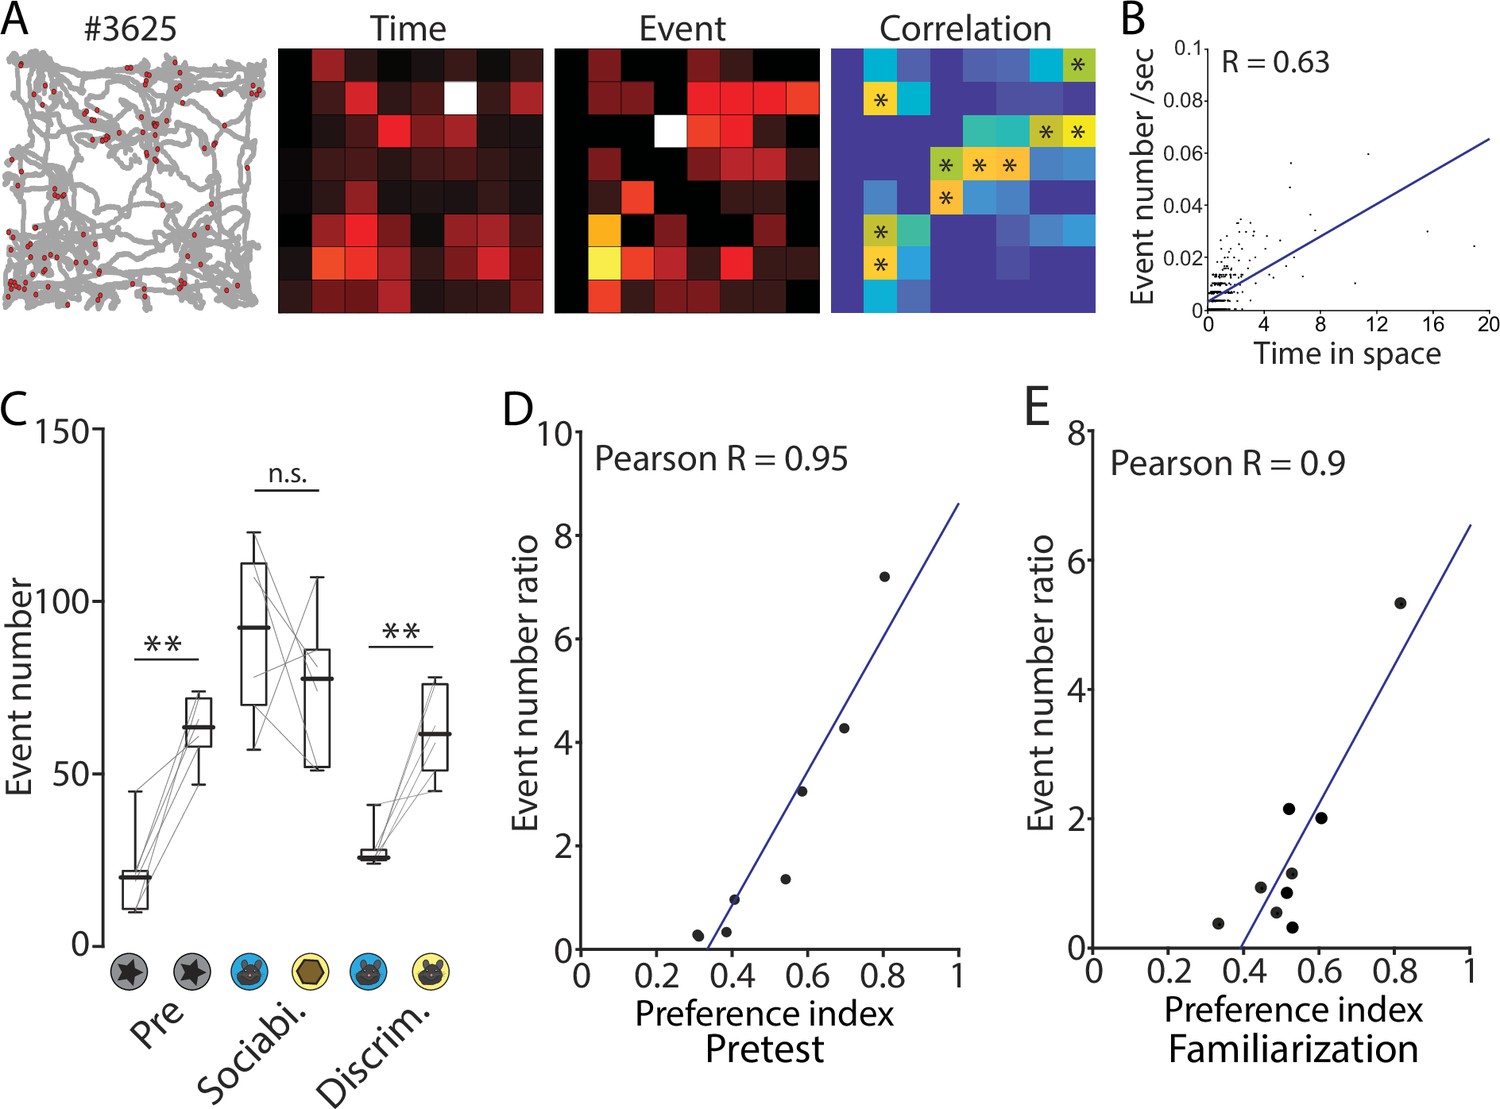
Calcium signals during exploratory behavior in an open field, pretest, and familiarization test.
(A) Example of maps of nose points and calcium events in open field arena. All p-values in a correlation map were presented in Supplementary file 2. (B) Correlation plots of event number and cumulative time in each pixels are shown in A. p<0.001, N=7. (C) Box plots comparing a calcium event number when the mouse was in the interaction zones. In the pretest plot, the object that the mice interacted with more is placed on the right side. Median event number: Pre (left vs right), 20 vs 63.5; Sociability (mouse vs object), 92.5 vs 77.5; Discrimination (familiar vs novel), 22.5 vs 63.5. p=0.001, 0.385, and 0.006. Signed-rank test. N=6. (D and E) Correlation plots of calcium event number ratios and preference index in pretest (D) and familiarization session (E). Pretest, p<0.001, N=8; Familiarization, p=0.001, N=9.
Figure 8 with 2 supplements
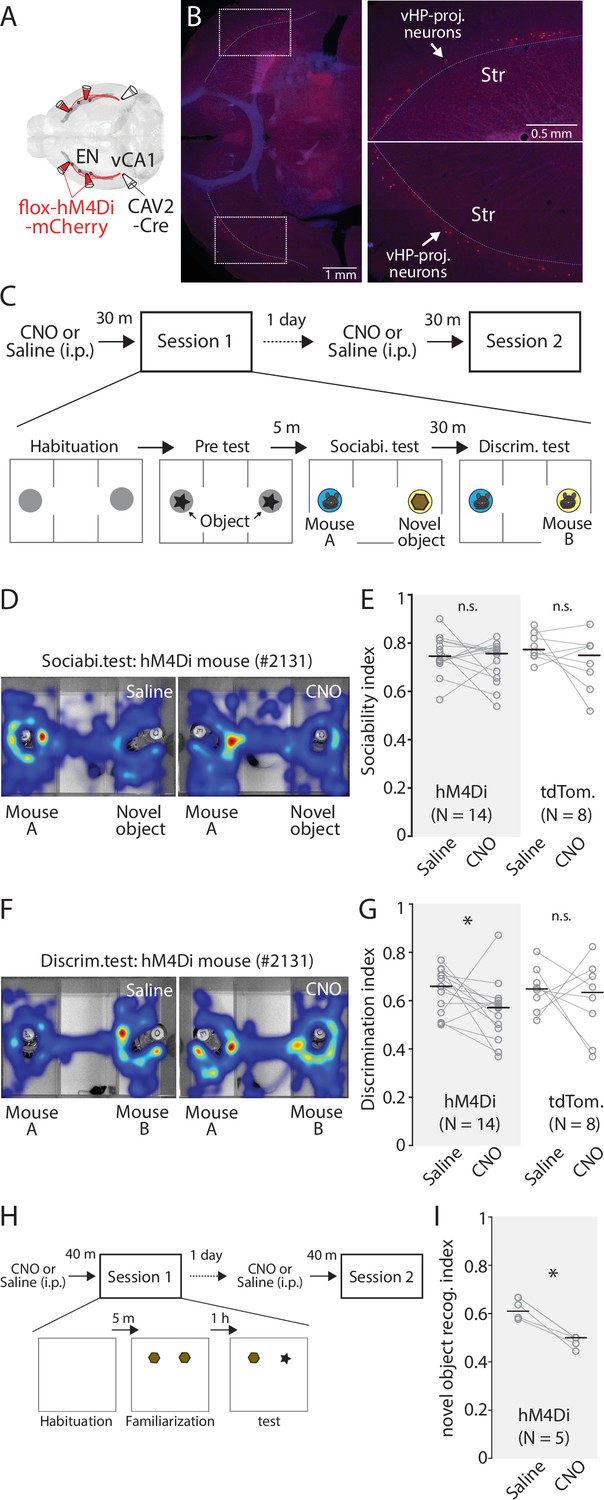
Chemogenetic inhibition of ENvCA1-proj. neurons specifically impairs recognition memory.
(A) Schematic diagram of injection performed. (B) Left: An example fluorescent image showing expression of hM4Di in ENCA1-proj. neurons. Right: Expansion of areas marked by white rectangle in the image on the left. (C) The diagram of social recognition memory test. A session consisted of habituation (5 min), Pretest (5 min), Sociability test (10 min), and discrimination test (5 min). The group treated with a saline in session 1 was treated with clozapine-N-oxide (CNO) (1 mg/ kg) in session 2 the following day. (D) Example cumulative times heat map in the arena during sociability tests for the same mouse under two different treatments. (E) Plots comparing sociability index for hM4Di and tdTomato mice under two different treatments. Gray empty circles indicate each mouse. Gray thin lines show paired data from one mouse. Thick black bars indicate median. Median sociability index: hM4Di mice (Saline vs CNO), 0.75 vs 0.76, p=0.391; signed-rank test; tdTomato mice (Saline vs CNO), 0.77 vs 0.75, p=0.383; signed-rank test. (F) Example cumulative time heat maps in arena during discrimination tests for the same mouse under two different treatments. (G) Comparison of discrimination index for hM4Di and tdTomato mice under two different treatments. Gray empty circles indicate each mouse. Gray thin lines show paired data from one mouse. Thick black bars indicate the median. Median discrimination index: hM4Di mice (Saline vs CNO), 0.66 vs 0.57, p=0.042; signed-rank test; tdTomato mice (Saline vs CNO), 0.65 vs 0.63, p=0.742; signed-rank test. (H) The diagram of novel object recognition memory test. A session consisted of habituation (5 min), familiarization (10 min), and discrimination test (5 min). CNO treatment was the same as in (C). (I Same as in G), but for novel object discrimination index. Median discrimination index: hM4Di mice (Saline vs CNO), 0.64 vs 0.5, p=0.003; signed-rank test.
-
Figure 8—source data 1
Time in each chambers/ interaction zones during sociablity test.
- https://cdn.elifesciences.org/articles/99642/elife-99642-fig8-data1-v1.xlsx
-
Figure 8—source data 2
Time in chambers/interaction zones during discrimination test.
- https://cdn.elifesciences.org/articles/99642/elife-99642-fig8-data2-v1.xlsx
-
Figure 8—source data 3
Interaction time with objects during novel object recognition test.
- https://cdn.elifesciences.org/articles/99642/elife-99642-fig8-data3-v1.xlsx
-
Figure 8—source data 4
% of freezing during each test phases of trace fear conditioning test.
- https://cdn.elifesciences.org/articles/99642/elife-99642-fig8-data4-v1.xlsx
Figure 8—figure supplement 1
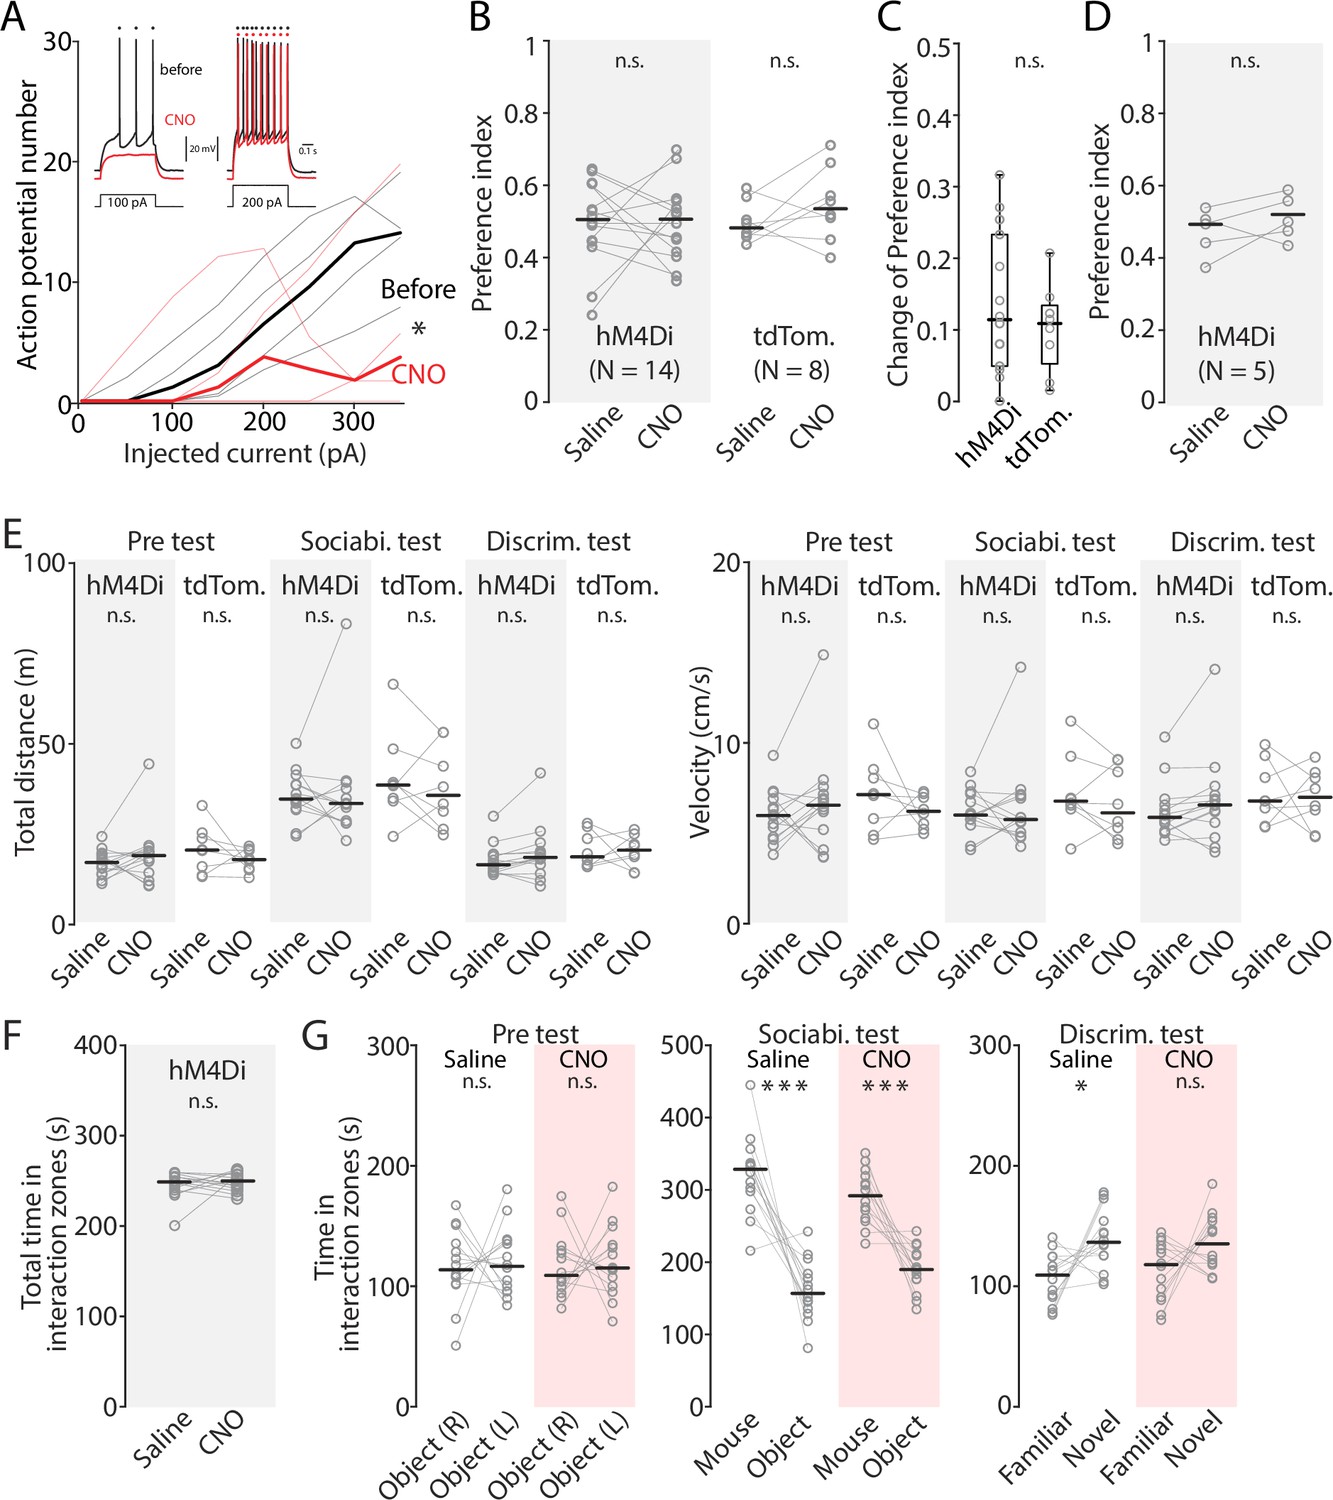
The effect of chemoegentic inhibition of ENvCA1-proj. neurons on the pretest and locomotion.
(A) Frequency-current (FI) curve showing the effect of clozapine-N-oxide (CNO) on action potential number generated by current injection. Recording was made from hM4Di expressing ENvCA1-proj. neurons before and after bath application of CNO (100 nM). Black line indicates before and the red line indicates after the CNO application. Inset: Traces showing spike response to 100 pA (left) and 200 pA (right) current injection. Saline vs CNO; F (1, 4.77)=0.38, p=0.0329, two-way ANOVA. n=4 neurons. N=2 mice. (B) Same as in Figure 8E, but for the preference index in the pretest. Median preference index: hM4Di mice (Saline vs CNO), 0.5 vs 0.5, p=0.92; signed-rank test; tdTomato mice (Saline vs CNO), 0.48 vs 0.53, p=0.227; signed-rank test. (C) Absolute change of preference index before and after CNO treatment in hM4Di and tdTomato mice. Median change of preference index: hM4Di mice 0.11 (N=14); tdTomato 0.11 (N=8). hM4Di vs tdTomato, p=0.517, ranksum test. (D) Same as in B, but for preference index in familiarization session of novel object recognition test. Median preference index: hM4Di mice (Saline vs CNO), 0.49 vs 0.5, p=0.28; signed-rank test (E) Plots comparing locomotor activity (distance moved and velocity) for hM4Di and tdTomato mice under two different treatments. Median total distance: Pretest, hM4Di mice (Saline vs CNO), 17.17 vs 19.10, p=0.426; tdTomato mice (Saline vs CNO), 20.60 vs 17.98, p=0.25; Sociability test, hM4Di mice (Saline vs CNO), 34.72 vs 33.51, p=0.855; tdTomato mice (Saline vs CNO), 38.59 vs 35.76, p=0.547, Discrimination test, hM4Di mice (Saline vs CNO), 16.55 vs 18.58, P=0.0676; tdTomato mice (Saline vs CNO), 18.73 vs 20.60, p=0.945, all signed-rank test. Median velocity: Pretest, hM4Di mice (Saline vs CNO), 5.98 vs 6.55, p=0.391; tdTomato mice (Saline vs CNO), 7.14 vs 6.21, p=0.383; Sociability test, hM4Di mice (Saline vs CNO), 6.01 vs 5.76, p=0.808; tdTomato mice (Saline vs CMO), 6.78 vs 6.13, p=0.313; Discrimination test, hM4Di mice (Saline vs CNO), 5.88 vs 6.57, p=0.104; tdTomato mice (Saline vs CNO), 6.79 vs 6.99, p=0.945. All signed-rank test. (F) Total time in interaction zones during discrimination test (familiar mouse interaction zone +novel mouse interaction zone). Median total time: (Saline vs CNO), 248.32 vs 294.37; p=0.67, signed-rank test. (G) Time in interaction zones during pre-test, sociability test, and discrimination test in hM4Di mice with saline or CNO treatment. Median time in interaction zone: Pretest, Saline (object (in the right chamber) vs object (in the left chamber)), 116.25 vs 120.26, p=1, CNO (object (in right chamber) vs object (in the left chamber)), 117.29 vs 120.2, p=0.855; Sociability test, Saline (Mouse vs Object), 320.89 vs 161.2, p<0.001, CNO (Mouse vs Object), 290.59 vs 189.75, p<0.001; Discrimination test, Saline (Familiar vs Novel), 106.35 vs 138.71, p=0.02, CNO (Familiar vs Novel), 113.1 vs 135.69, p=0.1353. All signed-rank test.
Figure 8—figure supplement 2
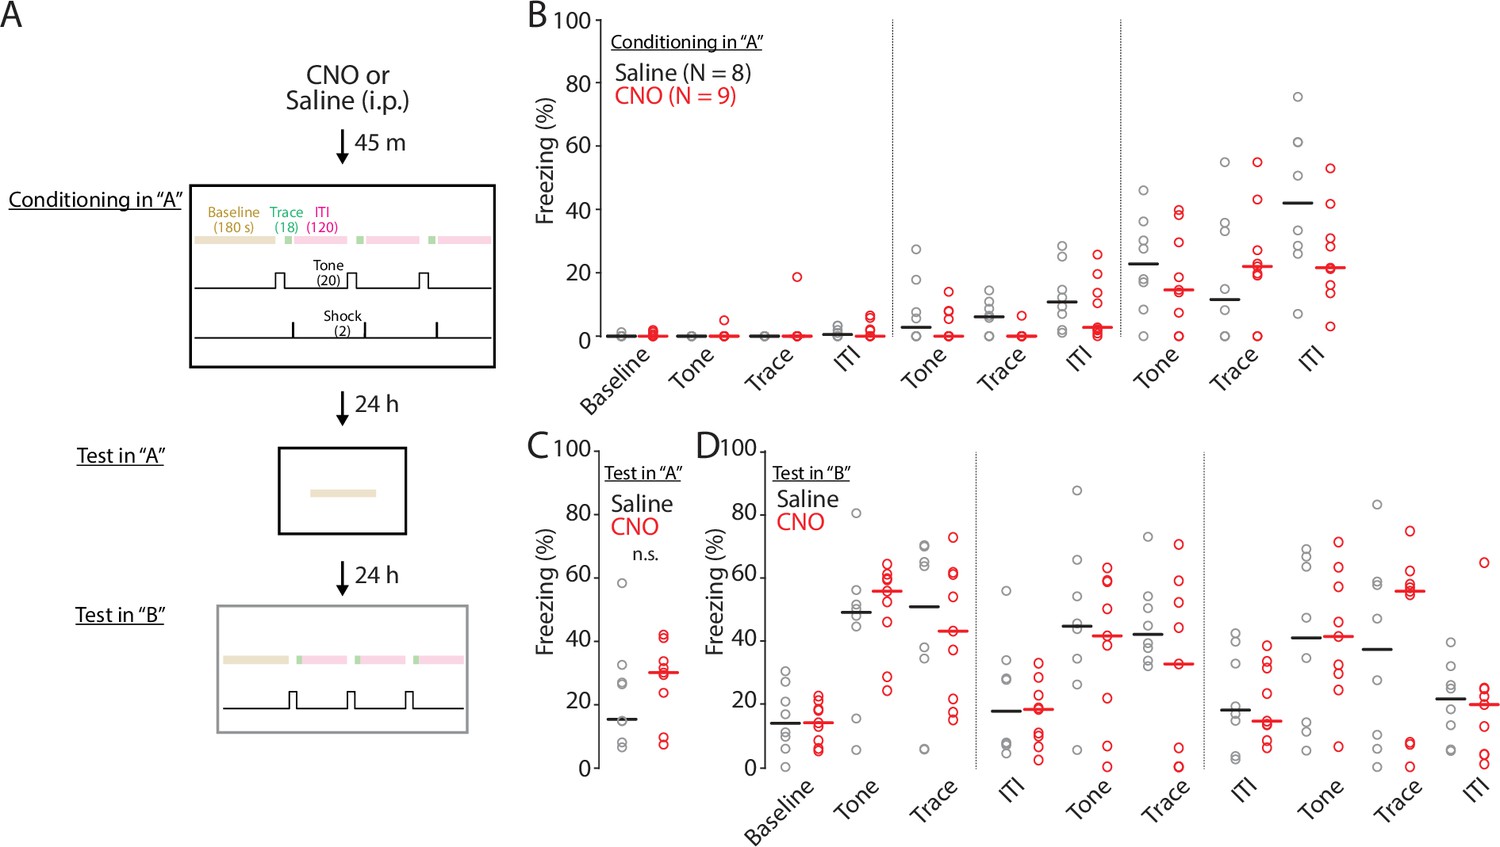
The effect of chemoegentic inhibition of ENvCA1-proj. neurons on trace fear conditioning. (A) Schematic of trace fear conditioning protocol. (B) The effect of clozapine-N-oxide (CNO) on freezing behavior during conditioning. Black indicates saline treated group and red indicates CNO treated group. Data points of individual mice are indicated by empty circles. Thick horizontal bars indicate median values. Saline vs CNO, F(1, 9)=2.52, p=0.115; two-way ANOVA. (C) The effect of CNO on freezing behavior during recall to context ‘A.’ Median values of freezing %: Saline = 14.91, CNO = 30.13. Saline vs CNO, p=0.576; one-way ANOVA. (D) The effect of CNO on freezing behavior during conditional stimulus recall in context ‘B.’ Saline vs CNO, F (1, 9)=0.38, p=0.54; two-way ANOVA.
Figure 9
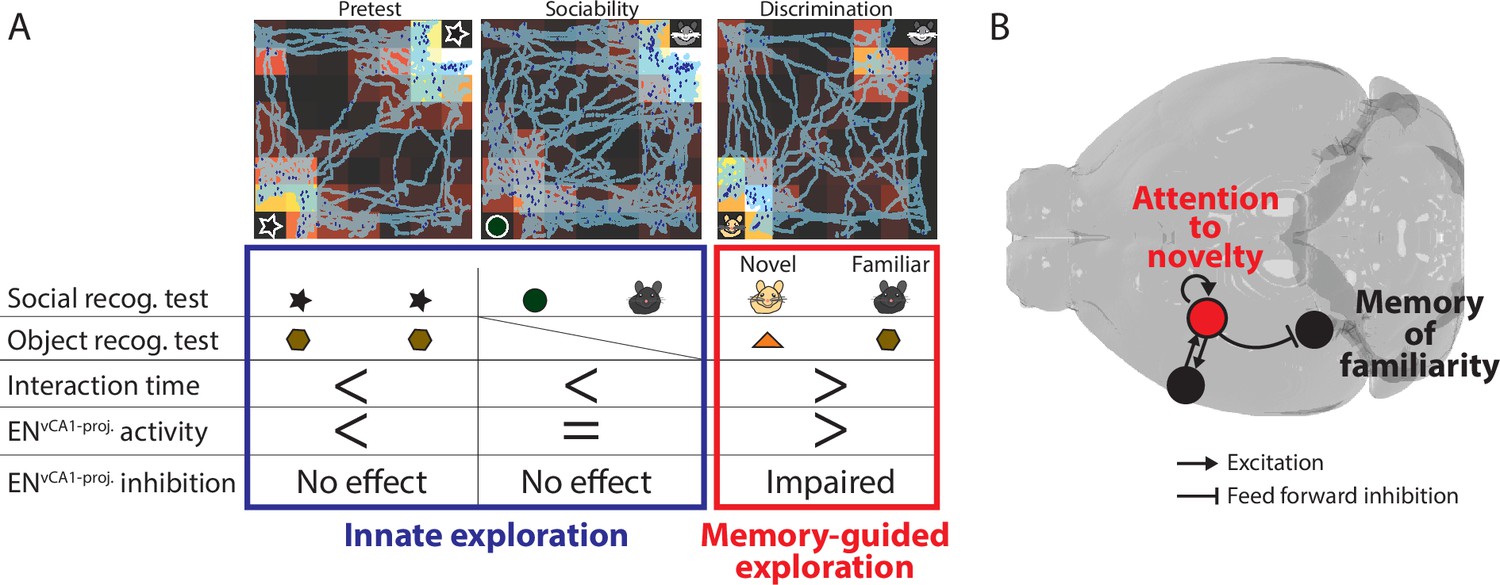
The role of ENvCA1-proj.neurons in recognition memory.
(A) Summary of findings from in vivo experiments. (B) The model of ENvCA1-proj. circuit function in recognition memory. During memory-guided exploration, recurrent circuits in ENvCA1-proj. neurons maintain the attentional response to novel stimuli while regulating the degree of response to familiar stimuli in ventral CA1 (vCA1) via feedforward inhibition.
Tables
Table 1
Presynaptic cell numbers projecting to vCA1 in different brain areas.
| Brain areas | Brain #1 | Brain #2 | Brain #3 | Brain #4 | Brain #5 |
|---|---|---|---|---|---|
| EN | 288 | 201 | 310 | 210 | 250 |
| BLA | 85 | 107 | 175 | 208 | 118 |
| SP (lateral) | 27 | 36 | 69 | 69 | 17 |
| SP (medial) | 69 | 111 | 130 | 127 | 121 |
| Sum | 469 | 455 | 684 | 614 | 506 |
Table 2
ANOVA comparison of Figure 6D.
| Compared brain areas | p-value | |
|---|---|---|
| Agranular insular | AOB | 0.764 |
| Agranular insular | PIR | 0.617 |
| Agranular insular | ENT | 0.624 |
| Agranular insular | CLA | 0.921 |
| Agranular insular | EN | 0.971 |
| Agranular insular | Palidum | 0.588 |
| Agranular insular | Substantia innominata | 0.44 |
| AOB | PIR | 0.016 |
| AOB | ENT | 1 |
| AOB | CLA | 1 |
| AOB | EN | 0.156 |
| AOB | Palidum | 1 |
| AOB | Substantia innominata | 1 |
| PIR | ENT | 0.008 |
| PIR | CLA | 0.048 |
| PIR | EN | 0.994 |
| PIR | Palidum | 0.006 |
| PIR | Substantia innominata | 0.003 |
| ENT | CLA | 1 |
| ENT | EN | 0.091 |
| ENT | Palidum | 1 |
| ENT | Substantia innominata | 1 |
| CLA | EN | 0.317 |
| CLA | Palidum | 0.999 |
| CLA | Substantia innominata | 0.992 |
| EN | Palidum | 0.079 |
| EN | Substantia innominata | 0.043 |
| Palidum | Substantia innominata | 1 |
Additional files
-
Supplementary file 1
p-values of correlation plots in Figure 7—figure supplement 1.
- https://cdn.elifesciences.org/articles/99642/elife-99642-supp1-v1.xlsx
-
Supplementary file 2
p-values of correlation plots in Figure 7—figure supplement 2A.
- https://cdn.elifesciences.org/articles/99642/elife-99642-supp2-v1.xlsx
-
MDAR checklist
- https://cdn.elifesciences.org/articles/99642/elife-99642-mdarchecklist1-v1.docx
Download links
A two-part list of links to download the article, or parts of the article, in various formats.
Downloads (link to download the article as PDF)
Open citations (links to open the citations from this article in various online reference manager services)
Cite this article (links to download the citations from this article in formats compatible with various reference manager tools)
Endopiriform neurons projecting to ventral CA1 are a critical node for recognition memory
eLife 13:RP99642.
https://doi.org/10.7554/eLife.99642.4


