Isobaric crosslinking mass spectrometry technology for studying conformational and structural changes in proteins and complexes
- Institute for Systems Biology, United States
Figures
Figure 1 with 4 supplements
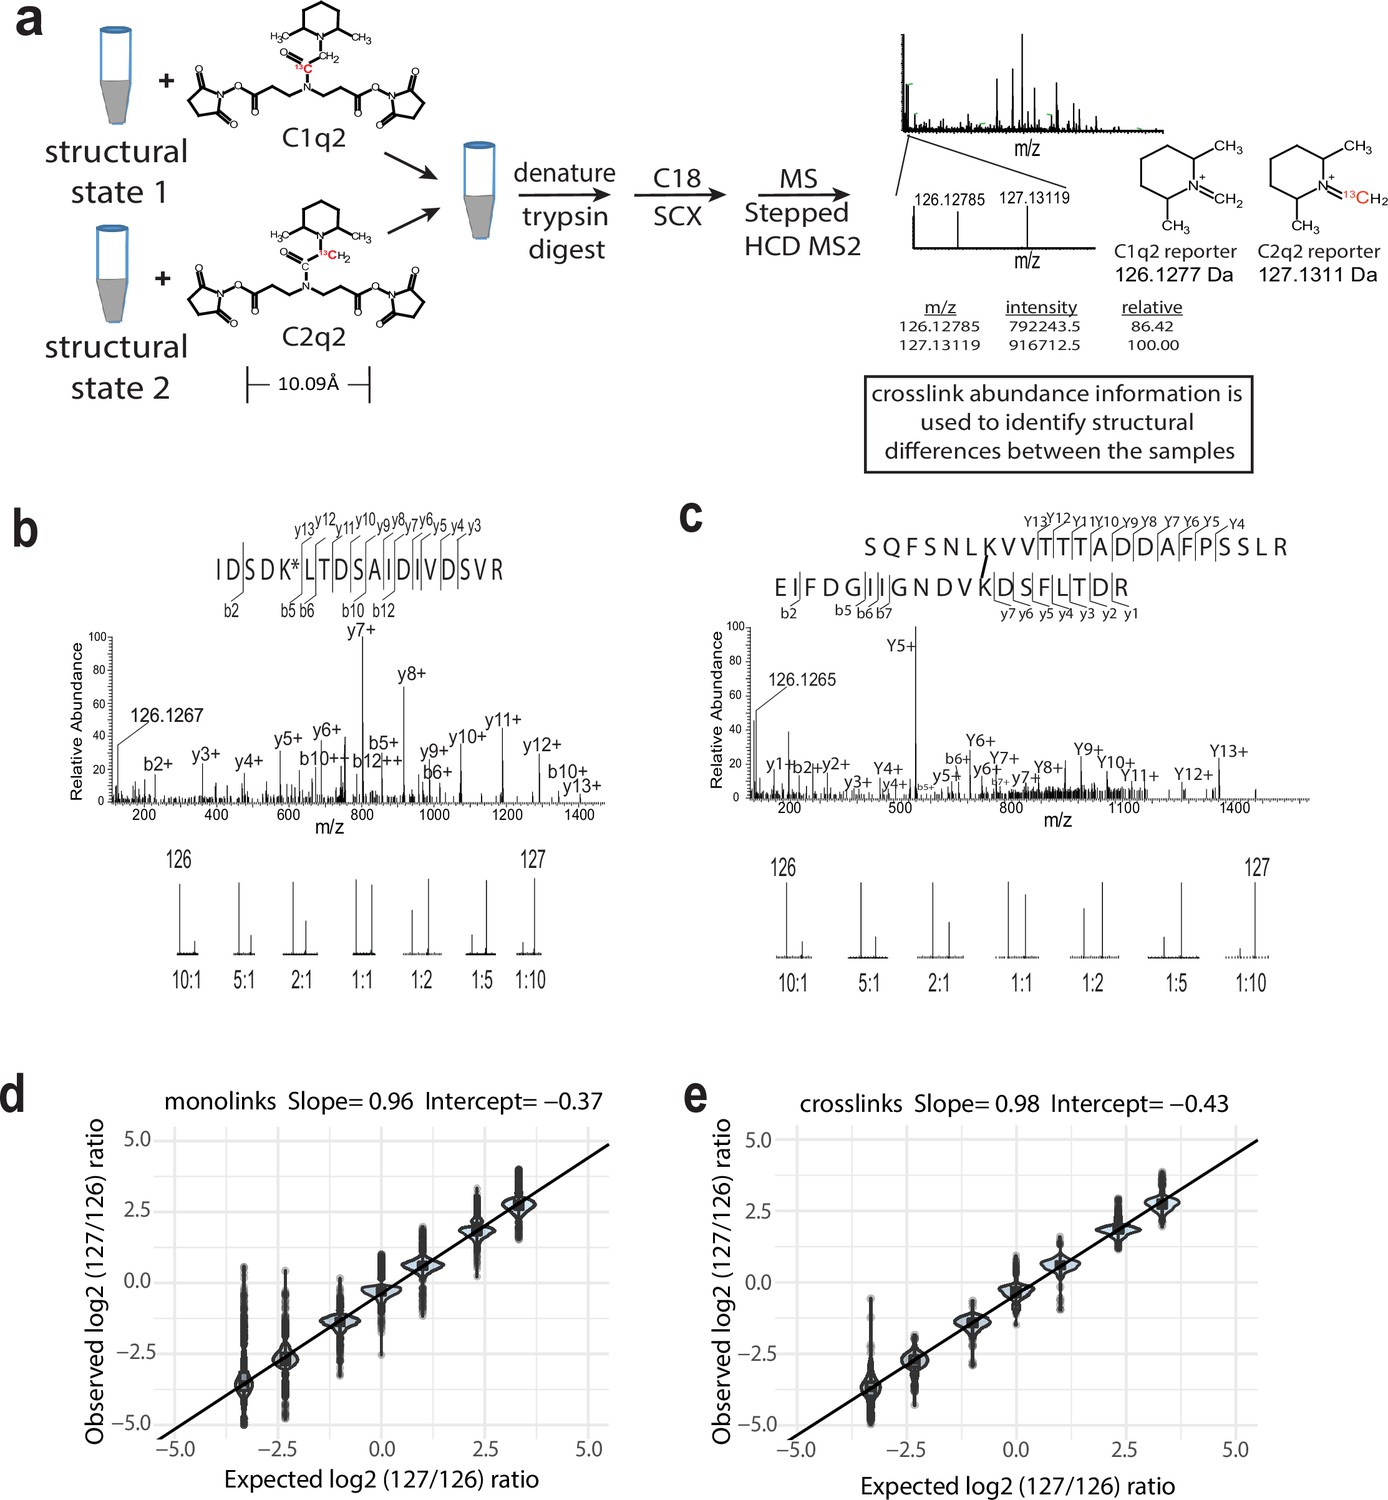
The isobaric Qlinker quantitative crosslinking-mass spectrometry (CLMS) approach for studying conformational and structural changes in proteins and protein complexes.
(a) The structure of Q2linkers and the general scheme for qCLMS using Q2linkers. The 13C atom in C1q2 or C2q2 is indicated by red font. (b–e) Experiment to evaluate the ability of Q2linkers to quantify the relative abundances of crosslinks and monolinks derived from Q2linker modification of TAP-tag affinity-purified pol I at designated ratios (~20 ug for each mixing ratio). Example spectra of a monolinked peptide (b) and a crosslinked peptide (c) with the observed reporter ion intensities at each mixing ratio. (d) Observed vs. expected log2 (127/126) reporter ion ratios for monolinks. (e) Observed vs. expected log2 (127/126) reporter ion ratios for crosslinks. Boxplot in R was used to create the graphs in (d) and (e). Center line, median; box limits, upper and lower quartiles; whiskers, 1.5× interquartile range; points, outliers. The experiment was performed once.
-
Figure 1—source data 1
Table containing information about the monolinks reported in Figure 1b and d.
The information includes the peptide sequence and protein name, site of Qlinker modification, score, reporter ion intensities, and reporter ion ratios.
- https://cdn.elifesciences.org/articles/99809/elife-99809-fig1-data1-v1.xlsx
-
Figure 1—source data 2
Table containing information about the intralinks reported in Figure 1c and e.
The information includes the peptide sequences and protein names, sites of Qlinker modification, score, search engine (N = Nexus, P = pLink2), reporter ion intensities, and reporter ion ratios.
- https://cdn.elifesciences.org/articles/99809/elife-99809-fig1-data2-v1.xlsx
-
Figure 1—source data 3
Table containing information about the interlinks reported in Figure 1c and e.
The information includes the peptide sequences and protein names, sites of Qlinker modification, score, search engine (N = Nexus, P = pLink2), reporter ion intensities, and reporter ion ratios.
- https://cdn.elifesciences.org/articles/99809/elife-99809-fig1-data3-v1.xlsx
Figure 1—figure supplement 1
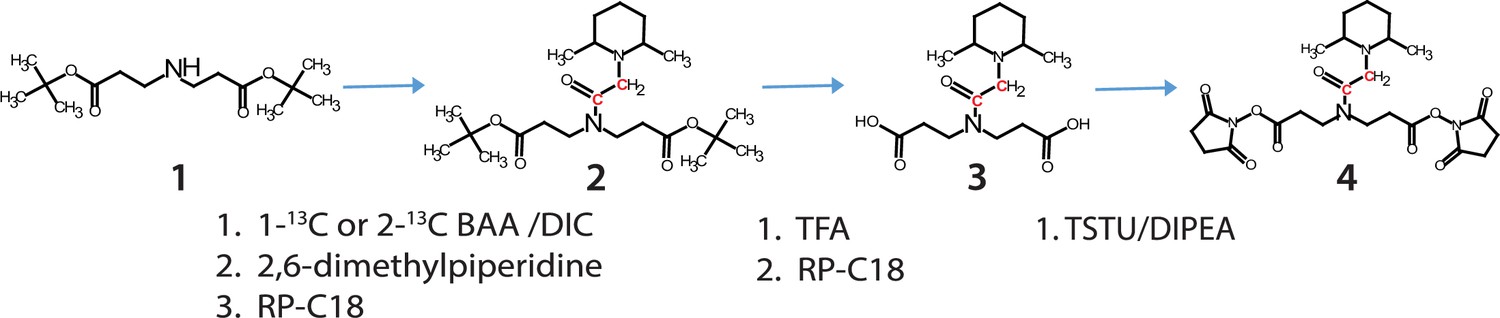
Synthesis of Q2linkers.
The 13C atom in C1q2 or C2q2 is indicated by red font.
Figure 1—figure supplement 2
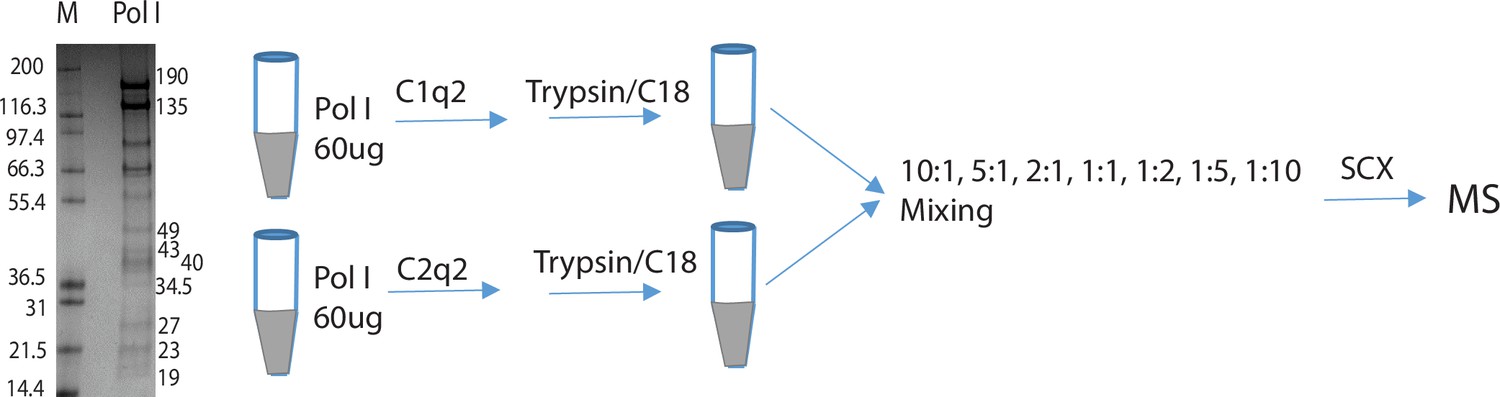
Experimental procedure to evaluate the ability of Q2linkers to quantify the relative abundances of crosslinks and monolinks derived from Q2linker modification of affinity-purified pol I.
M = molecular weight markers.
-
Figure 1—figure supplement 2—source data 1
File containing the original gel for Figure 1—figure supplement 2, indicating the relevant bands and molecular weight markers.
- https://cdn.elifesciences.org/articles/99809/elife-99809-fig1-figsupp2-data1-v1.zip
-
Figure 1—figure supplement 2—source data 2
Original file for the gel displayed in Figure 1—figure supplement 2.
- https://cdn.elifesciences.org/articles/99809/elife-99809-fig1-figsupp2-data2-v1.zip
Figure 1—figure supplement 3
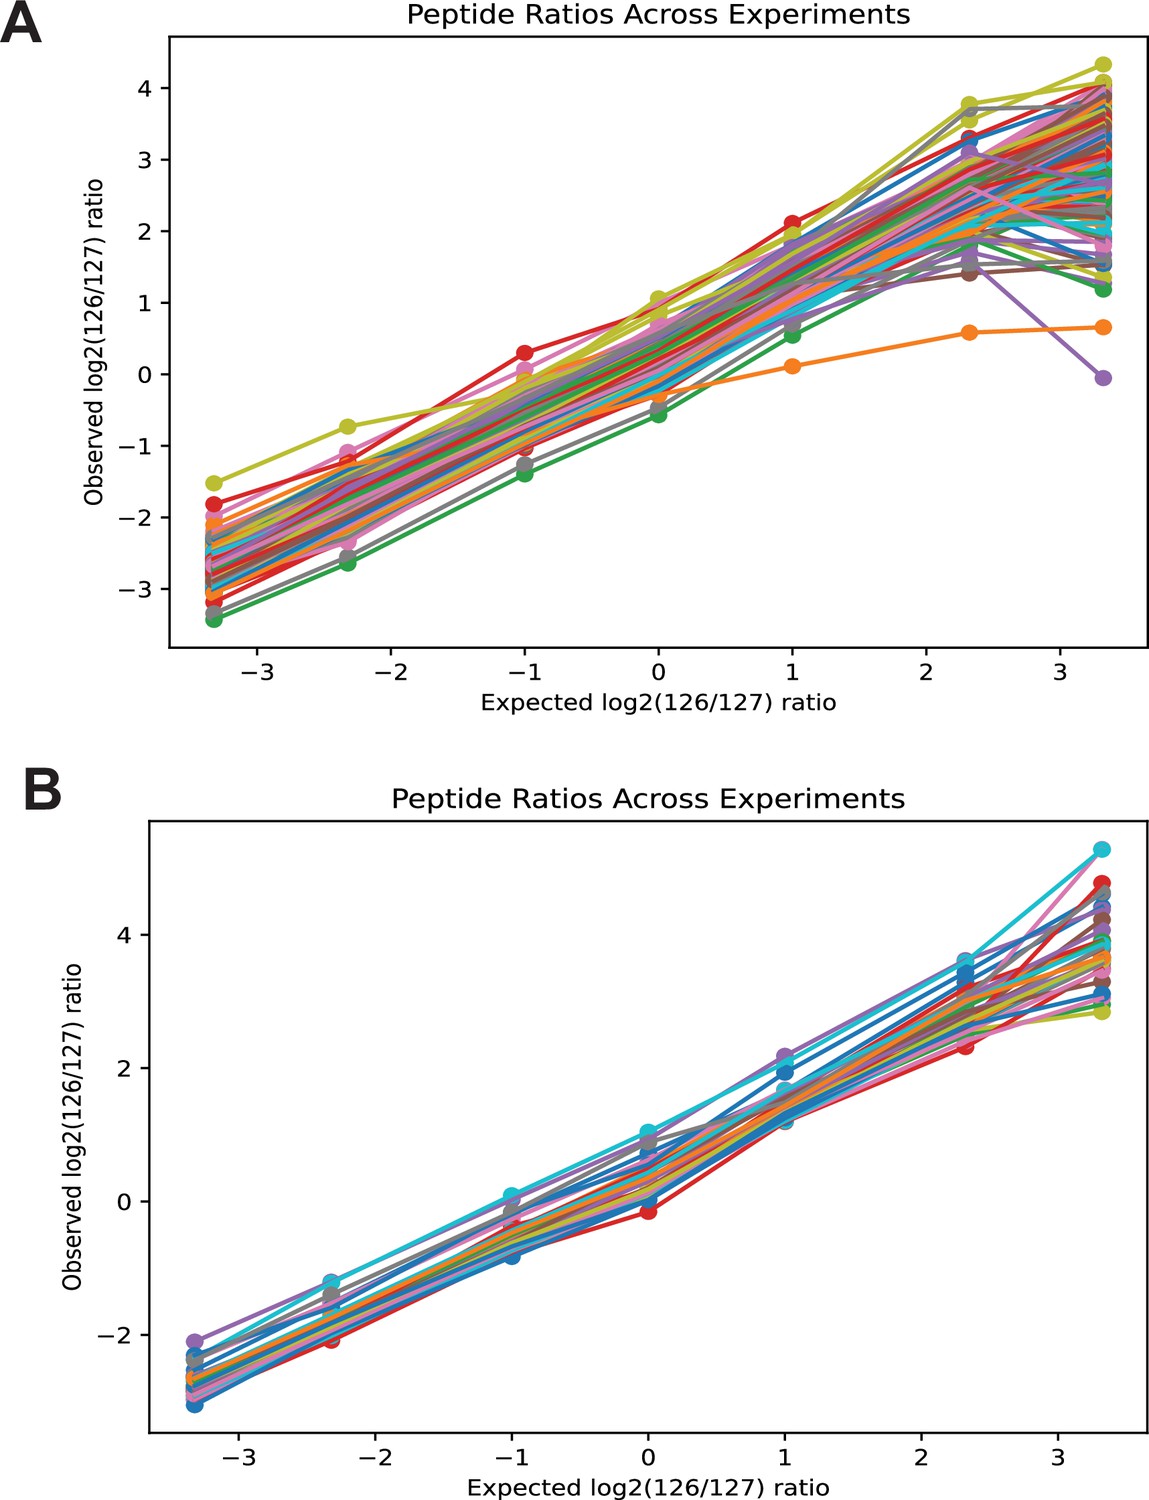
Observed vs. expected log2 (126/127) reporter ion ratios for individual monolinks (A) and crosslinks (B) at different mixing ratios.
There are 298 monolinks and 32 crosslinks identified in all runs.
Figure 1—figure supplement 4
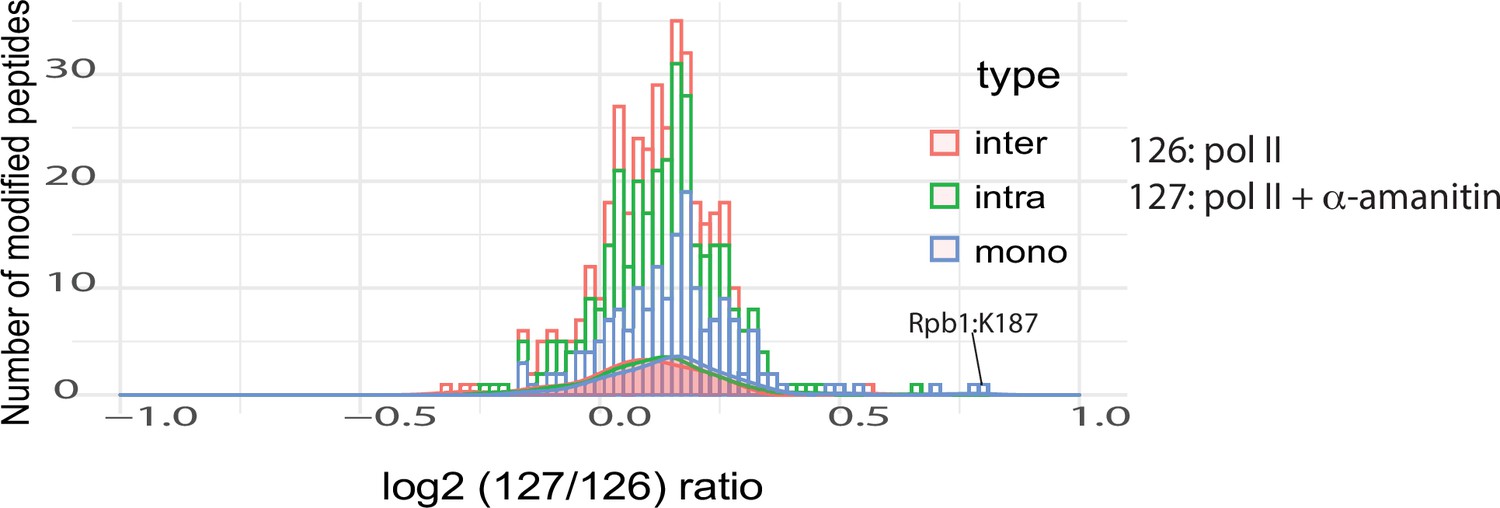
The ratio distributions for interlinks, intralinks, and monolinks from the pol II +/-a-amanitin experiment.
Figure 2
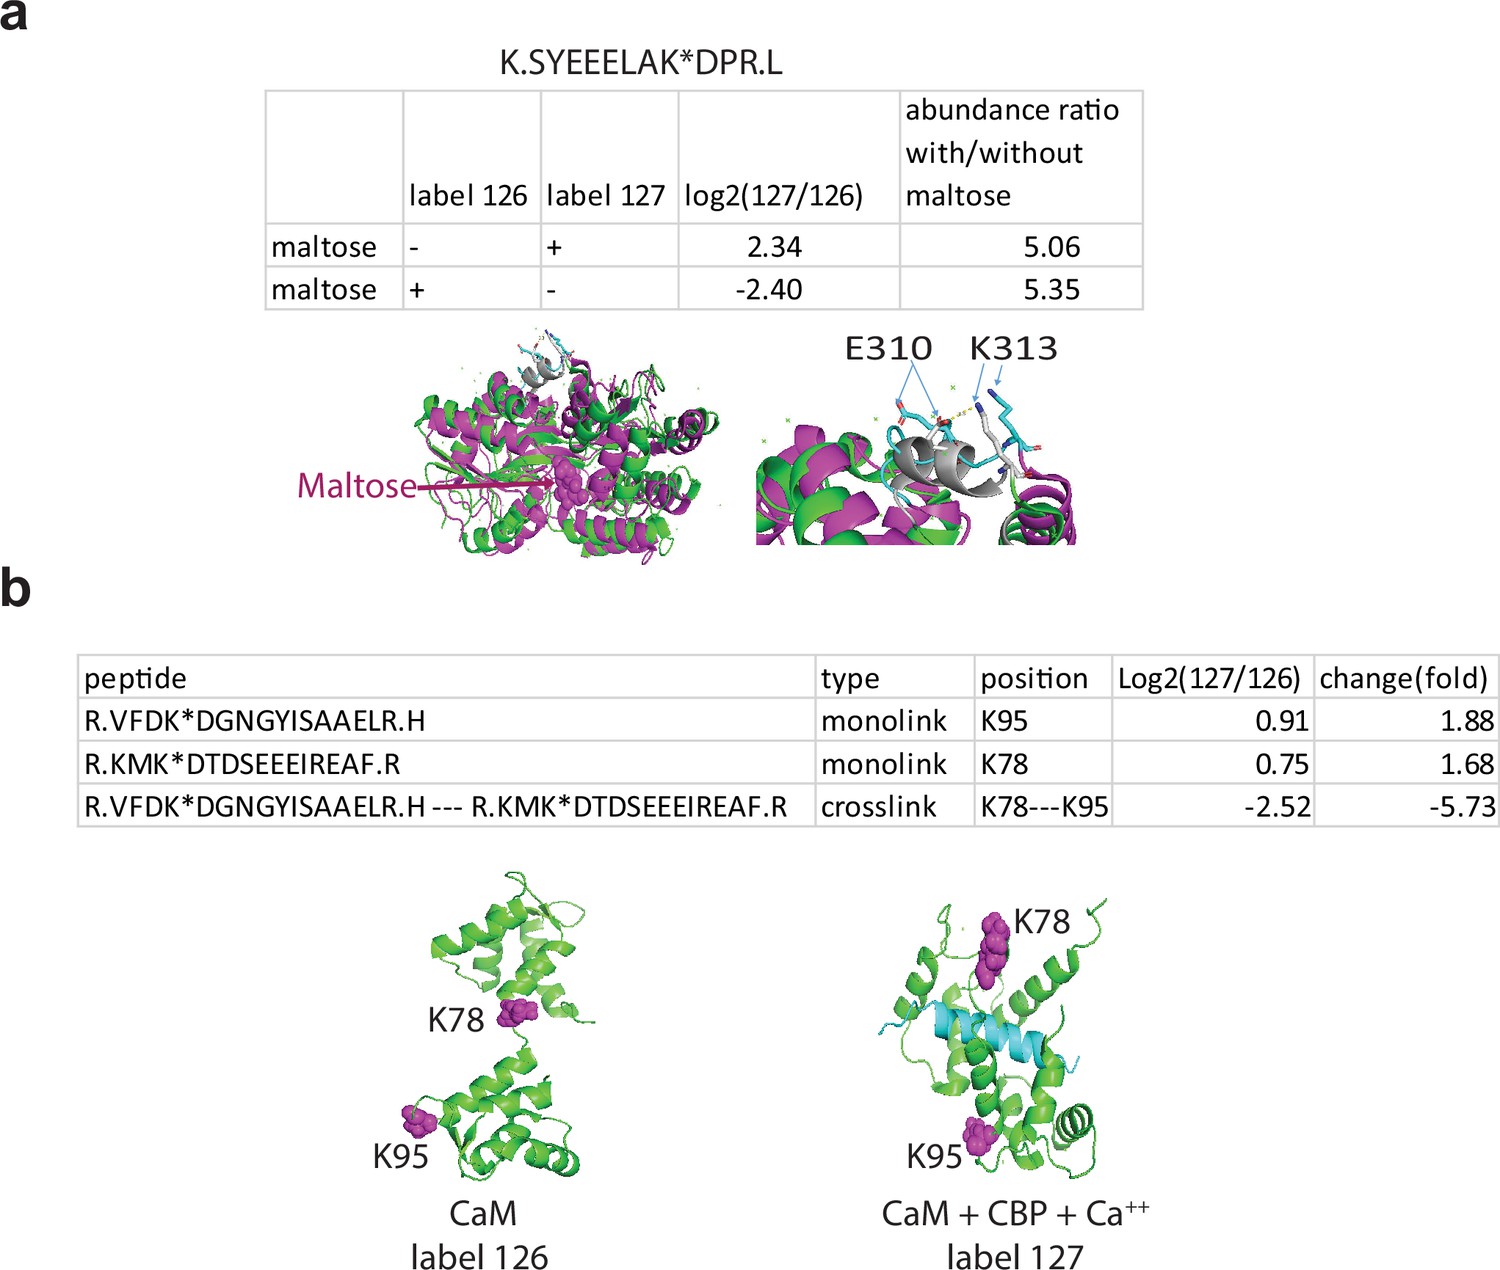
Q2linkers detect conformational changes in protein biosensors.
(a) Quantification of a monolinked peptide from maltose binding protein (MBP) with or without maltose. Structures of MBP in the open, ligand-free conformation (green, 1mpb.pdb) and the closed, maltose-bound conformation (brown, 1n3w.pdb) are shown on the left. A close-up view of the ‘balancing interface’ is shown on the right. In the closed conformation, the sequence between amino acids 301–312 forms an alpha helix (gray) and K313 forms a salt bridge with E310. The helix and the salt bridge are disrupted in the open conformation (cyan). A crosslinker swapping experiment was performed on the same preparation of MBP; a technical replicate. (b) Quantification of monolinked and crosslinked peptides involving K78 and K95 from apo-CaM and CaM with Ca2+ and CBP. Structures of apo-CaM (left) and CaM + CBP (blue) + Ca2+ (right) are shown with key lysine residues space filled and magenta. The experiment was performed once.
Figure 3
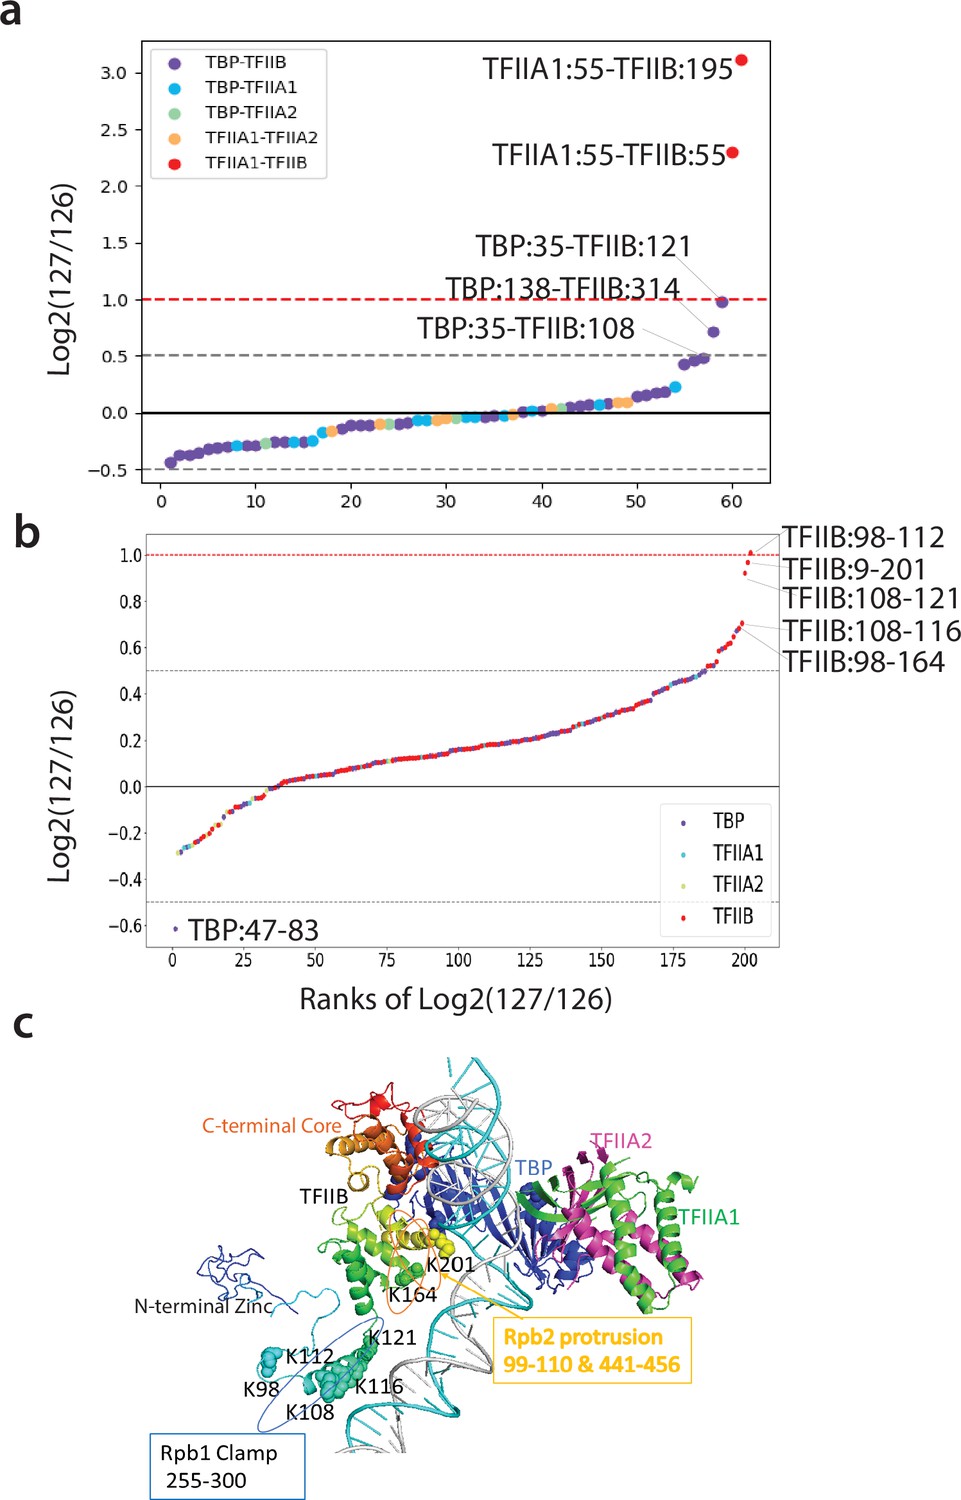
Q2linkers detect structural changes during TFIIA/TBP/TFIIB ternary complex formation.
(a, b) The distribution of log2 (127/126) ratios for interlinks (a) and intralinks (b) from the Qlinker experiment comparing the TFIIA/TBP/TFIIB ternary complex (127) to the TFIIA/TBP and TFIIB/TBP binary complexes (126). The x-axis is the ranking of the log2 (127/126) ratios. Crosslinks with the highest ratios are labeled. (c) The structure of TFIIA, TBP, and TFIIB in the pol II PIC complex (5fmf) is shown. TFIIB is rainbow colored with blue at the N-terminus and red at the C-terminus. Residues in the central region of TFIIB that are involved in crosslinks with high ratios are shown as space filled. The regions of TFIIB that interact with the Rpb1 clamp and Rpb2 protrusion are also shown. The experiment was performed once.
-
Figure 3—source data 1
Table containing information about the interlinks reported in Figure 3a.
The information includes the peptide sequences and protein names, sites of Qlinker modification, score, search engine (N = Nexus, P = pLink2), reporter ion intensities, and reporter ion ratios.
- https://cdn.elifesciences.org/articles/99809/elife-99809-fig3-data1-v1.xlsx
-
Figure 3—source data 2
Table containing information about the intralinks reported in Figure 3b.
The information includes the peptide sequences and protein names, sites of Qlinker modification, score, search engine (N = Nexus, P = pLink2), reporter ion intensities, and reporter ion ratios.
- https://cdn.elifesciences.org/articles/99809/elife-99809-fig3-data2-v1.xlsx
Figure 4 with 1 supplement
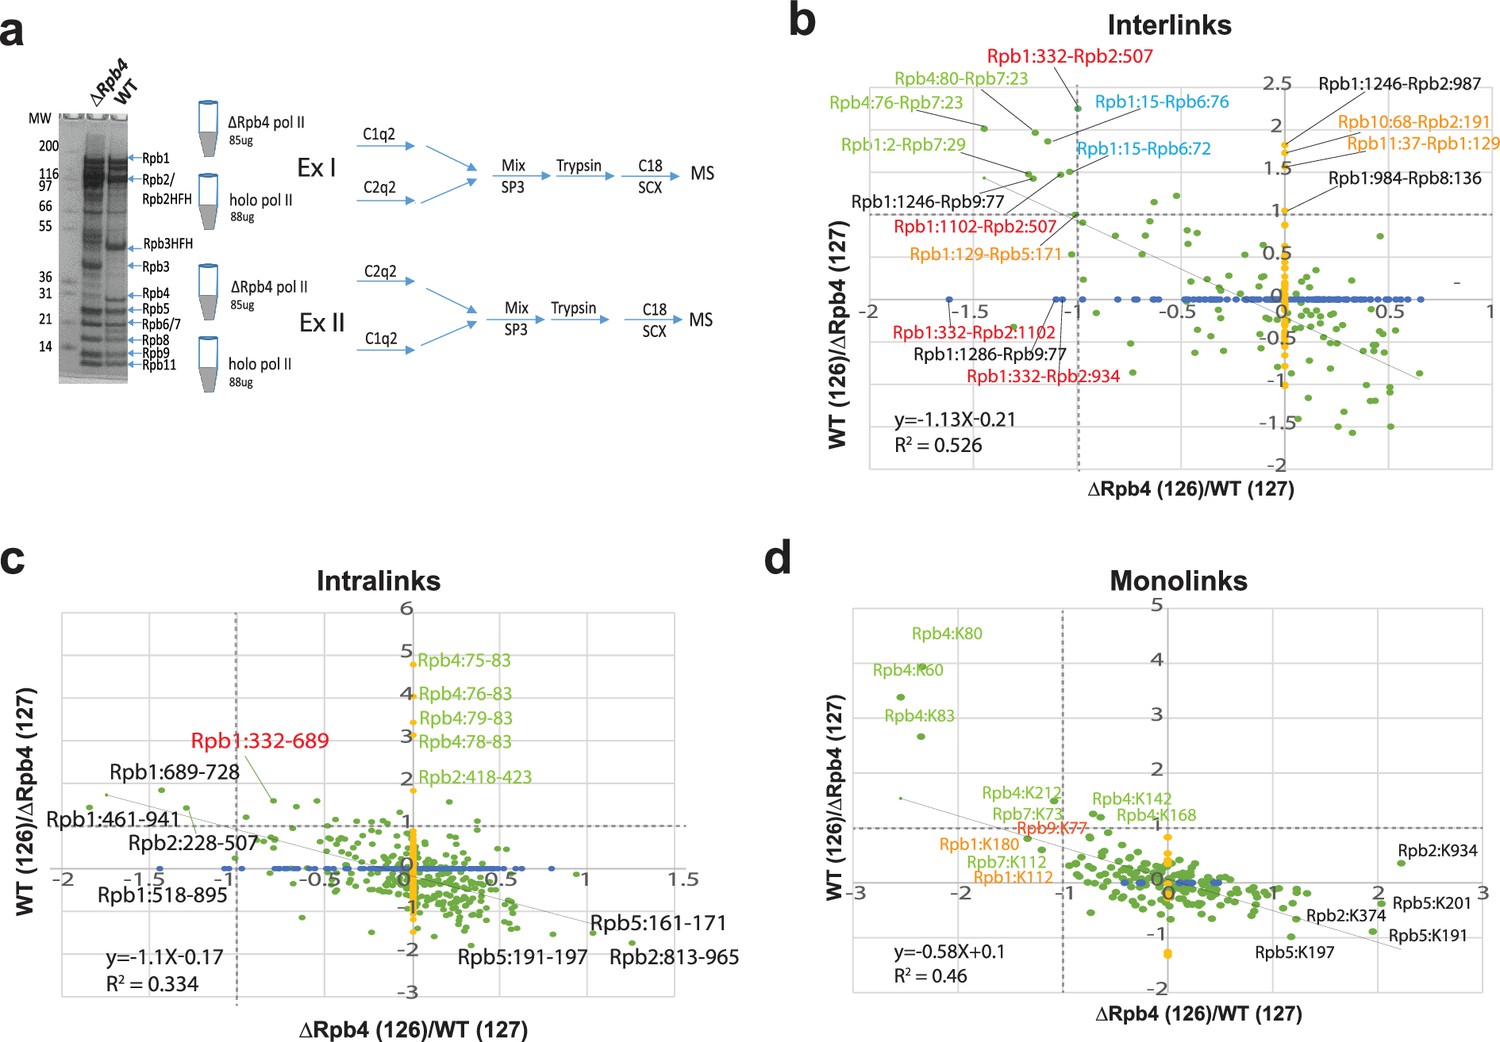
Q2linkers detect conformational changes in large protein complexes.
(a) The SDS-PAGE gel of affinity-purified pol II from WT and ∆Rpb4 strains and experimental design for studying conformational changes in RNA polymerase II due to deletion of Rpb4. (b–d) The log2(126/127) ratio comparisons in experiment I and II for holo-Pol II and ∆Rpb4-pol II. x-axis is ΔRpb4-pol II (126)/holo-pol II (127). y-axis is holo-pol II (126)/ΔRpb4-pol II (127). Enrichment in the holo-pol II sample (labeled with C2q2 in experiment I) will have a smaller log2(126/127) ratio on the x-axis; enrichment in the holo-pol II (labeled with C1q2 in experiment II) will have a higher log2(126/127) ratio on the y-axis. Each green dot corresponds to one unique pair of crosslinking sites identified in both experiments. Each blue dot on the x-axis corresponds to one unique pair of crosslinking sites identified only in experiment I and each yellow dot on the y-axis corresponds to one unique pair of crosslinking sites identified only in experiment II. Only the green dots are used for the linear regression analysis. (b) Interlinks, (c) intralinks, and (d) monolinks. Dashed lines indicate log2 ratio = 1. The same preparation of each protein complex was used in a crosslinker swapping experiment; a technical replicate.
-
Figure 4—source data 1
File containing the original gel for Figure 4a, indicating the relevant bands and molecular weight markers.
- https://cdn.elifesciences.org/articles/99809/elife-99809-fig4-data1-v1.zip
-
Figure 4—source data 2
Original file for the gel displayed in Figure 4a.
- https://cdn.elifesciences.org/articles/99809/elife-99809-fig4-data2-v1.zip
Figure 4—figure supplement 1
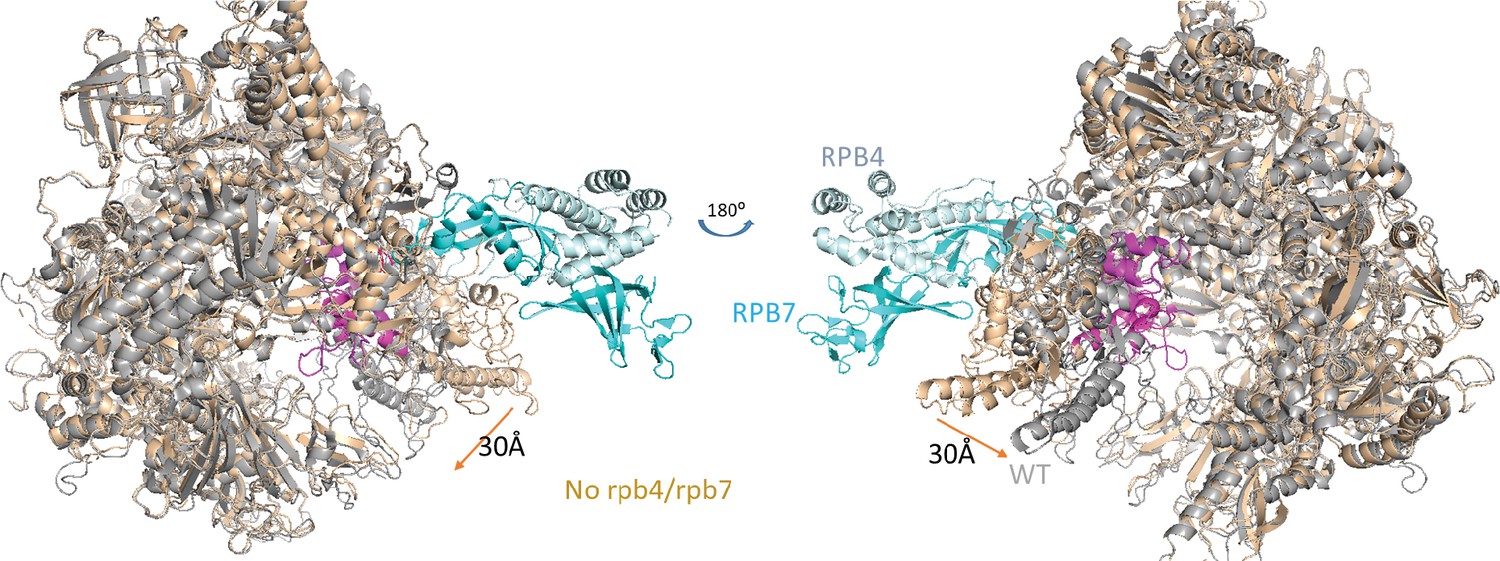
Structural comparison of holo-pol II (5u5q) and core-pol II (li3q).
Core-pol II without Rpb4/Rpb7 is colored brown and holo-pol II is colored gray with Rpb4 and Rpb7 in light blue. The five switches that cause the movement of the clamp are colored in magenta.
Figure 5
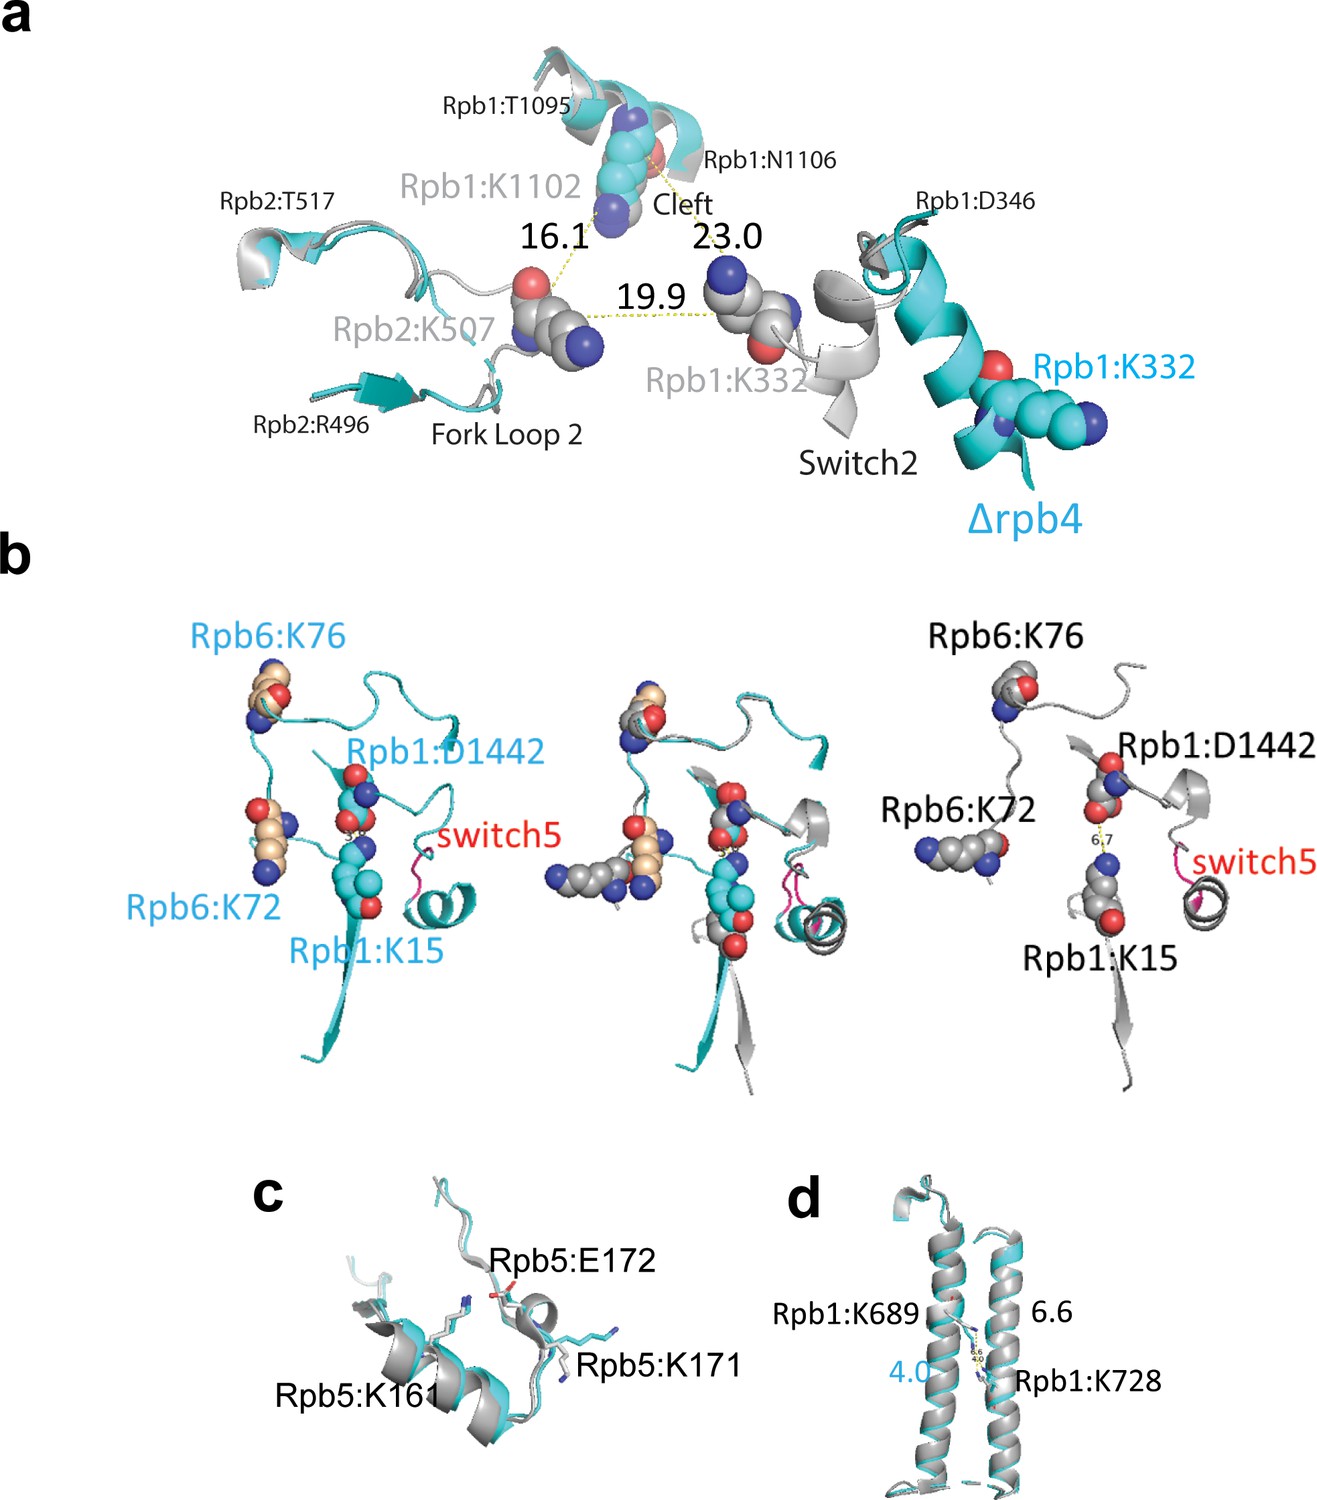
Q2linkers detect conformational changes in pol II complexes.
(a) Switch 2 (Rpb1:328–346) conformational changes in ∆Rpb4-pol II (cyan) and holo-pol II (gray). The crosslinked lysine residues are shown as spheres. Cα−Cα distances between crosslinked lysines are indicated. (b) Structural comparison of crosslinks involving Switch 5 (red, Rpb1:1431–1433) for ∆Rpb4-pol II (cyan, left), holo-pol II (gray, right), and the merged structures (middle). In the holo-pol II structure (right), Switch 5 bending pulls Rpb1:D1442 away from K15, breaking the salt bridge that is formed in the core pol II structure (left). The increase in the abundances of the Rpb1:15-Rpb6:76 and Rpb1:15-Rpb6:72 crosslinks in holo-pol II is likely attributed to the salt bridge between K15 and D1442 in core pol II, which impedes the NHS ester-based reaction between the epsilon amino group of K15 and the crosslinker. (c) Structural comparison of the region of Rpb5 involving the crosslink between K161 and K171 in ∆Rpb4-pol II and holo-pol II. A salt bridge (not shown) is formed between K161 and E172 in both structures. (d) Structure of Rpb1 near the crosslink between Rpb1:K689 and Rpb1:K728 in ∆Rpb4-pol II and holo-pol II. In all structures, ∆Rpb4-pol II is cyan and holo-pol II is gray. NZ−NZ distances between crosslinked lysines are indicated.
Tables
Key resources table
| Reagent type (species) or resource | Designation | Source or reference | Identifiers | Additional information |
|---|---|---|---|---|
| Strain, strain background (Escherichia coli) | BL21(DE3)-CodonPlus-RIL | Agilent | Cat# 230245 | Chemically Competent cells |
| Strain, strain background (Saccharomyces cerevisiae) | BY4741 with C-terminal His6-3XFLAG-His6-Ura3 (HFH) tag on RPA2 | This paper | Available on request from the Ranish lab | |
| Strain, strain background (S. cerevisiae) | BY4741 with C-terminal (HFH) tag on RPB3 | This paper | Available on request from the Ranish lab | |
| Strain, strain background (S. cerevisiae) | Δrpb4 strain with C-terminal (HFH) tag on RPB2 | This paper | Available on request from the Ranish lab | |
| Recombinant DNA reagent | His6-tagged TBP | Dr. Steven Hahn (Fred Hutchinson Cancer Research Center) | ||
| Recombinant DNA reagent | His6-tagged TFIIB | Dr. Steven Hahn (Fred Hutchinson Cancer Research Center) | ||
| Recombinant DNA reagent | His6-tagged TFIIA | PMID:28259734 | ||
| Peptide, recombinant protein | Human Brain Calmodulin | MilliporeSigma | Cat# 208698500ug | |
| Peptide, recombinant protein | Calmodulin binding peptide 1 | GenScript Biotech Corp. | Cat# RP13247 | |
| Peptide, recombinant protein | Bacterial maltose binding protein | Novus Biologicals | Cat# NBC118538 | |
| Chemical compound, drug | Di-tert-butyl 3,3'-Iminodipropionate | TCI America | D4110 | CAS: 128988-04-5 |
| Chemical compound, drug | Bromoacetic acid (1-13C) | Cambridge Isotope Laboratories, Inc | CLM-723-PK | CAS: 57858-24-9 |
| Chemical compound, drug | Bromoacetic acid (2-13C) | Cambridge Isotope Laboratories, Inc | CLM-724-PK | CAS: 64891-77-6 |
| Chemical compound, drug | cis-2’–6’-Dimethylpiperidine | MilliporeSigma | D180300 | CAS: 766-17-6 |
| Software, algorithm | Nexus | PMID:30343899 | Source code 1 | |
| Software, algorithm | pLink2 | PMID:31363125 | ||
| Software, algorithm | Rawconverter | PMID:26499134 | ||
| Software, algorithm | Trans-Proteomics Pipeline (TPP)/ | PMID:36648445 | http://tools.proteomecenter.org/wiki/index.php?title=Software:TPP |
Additional files
-
Supplementary file 1
Table containing information about the interlinks, intralinks, and monolinks reported in Figure 4 .
The information includes the peptide sequences and protein names, sites of Qlinker modification, score, search engine (N = Nexus, P = pLink2), reporter ion intensities, and reporter ion ratios.
- https://cdn.elifesciences.org/articles/99809/elife-99809-supp1-v1.xlsx
-
MDAR checklist
- https://cdn.elifesciences.org/articles/99809/elife-99809-mdarchecklist1-v1.docx
-
Source code 1
Nexus algorithm.
- https://cdn.elifesciences.org/articles/99809/elife-99809-code1-v1.zip
Download links
A two-part list of links to download the article, or parts of the article, in various formats.
Downloads (link to download the article as PDF)
Open citations (links to open the citations from this article in various online reference manager services)
Cite this article (links to download the citations from this article in formats compatible with various reference manager tools)
Isobaric crosslinking mass spectrometry technology for studying conformational and structural changes in proteins and complexes
eLife 13:RP99809.
https://doi.org/10.7554/eLife.99809.3


