The endoplasmic reticulum, not the pH gradient, drives calcium refilling of lysosomes
- University of Michigan, United States
Abstract
Impaired homeostasis of lysosomal Ca2+ causes lysosome dysfunction and lysosomal storage diseases (LSDs), but the mechanisms by which lysosomes acquire and refill Ca2+ are not known. We developed a physiological assay to monitor lysosomal Ca2+ store refilling using specific activators of lysosomal Ca2+ channels to repeatedly induce lysosomal Ca2+ release. In contrast to the prevailing view that lysosomal acidification drives Ca2+ into the lysosome, inhibiting the V-ATPase H+ pump did not prevent Ca2+ refilling. Instead, pharmacological depletion or chelation of Endoplasmic Reticulum (ER) Ca2+ prevented lysosomal Ca2+ stores from refilling. More specifically, antagonists of ER IP3 receptors (IP3Rs) rapidly and completely blocked Ca2+ refilling of lysosomes, but not in cells lacking IP3Rs. Furthermore, reducing ER Ca2+ or blocking IP3Rs caused a dramatic LSD-like lysosome storage phenotype. By closely apposing each other, the ER may serve as a direct and primary source of Ca2+for the lysosome.
https://doi.org/10.7554/eLife.15887.001Introduction
A vacuolar-type H+-ATPase (V-ATPase) on the membrane of the lysosome maintains the acidic lumen (pHLy ~ 4.6), and improper acidification of lysosomes may lead to lysosomal storage diseases (LSDs) (Mindell, 2012). Like the Endoplasmic Reticulum (ER) (Clapham, 2007; Berridge, 2012), lysosomes are also intracellular Ca2+ stores with free [Ca2+]Ly ~0.4–0.6 mM (Christensen et al., 2002; Lloyd-Evans et al., 2008), which is 3–4 orders of magnitude higher than the cytosolic [Ca2+] (~100 nM). A reduction in [Ca2+]Ly is believed to be the primary pathogenic cause for some LSDs and common neurodegenerative diseases (Lloyd-Evans et al., 2008; Coen et al., 2012). Using the fast Ca2+ chelator BAPTA, Ca2+ release from the lysosome has been shown to be required for late endosome-lysosome fusion (Pryor et al., 2000), lysosomal exocytosis, phagocytosis, membrane repair, and signal transduction (Reddy et al., 2001; Lewis, 2007; Kinnear et al., 2004). Consistently, the principal Ca2+ channel in the lysosome, Mucolipin TRP channel 1 (TRPML1 or ML1), as well as lysosomal Ca2+ sensors such as the C2 domain–containing synaptotagmin VII, are also required for these functions (Steen et al., 2007; Lewis, 2007; Kinnear et al., 2004). Whereas human mutations of TRPML1 cause type IV Mucolipidosis, pathogenic inhibition of ML1 underlies several other LSDs (Shen et al., 2012).
How the 5000-fold Ca2+ concentration gradient across the lysosomal membrane is established and maintained is poorly understood. The most well understood Ca2+ store in the cell is the ER. Upon store depletion, the luminal sensor protein STIM1 oligomerizes to activate the highly Ca2+-selective ORAI/CRAC channels on the plasma membrane, refilling the ER Ca2+ store via the SERCA pump (Clapham, 2007; Lewis, 2007; Berridge, 2012). However, depletion of lysosomal Ca2+ stores does not induce extracellular Ca2+ entry (Haller et al., 1996b). The endocytic pathway may theoretically deliver extracellular Ca2+ to lysosomes. However, most Ca2+ taken up through endocytosis is lost quickly during the initial course of endosomal acidification prior to reaching lysosomes during endosome maturation (Gerasimenko et al., 1998). In various cell types, when the lysosomal pH gradient is dissipated, either by inhibiting the V-ATPase or by alkalizing reagents such as NH4Cl, free luminal [Ca2+]Ly was found to drop drastically (Calcraft et al., 2009; Christensen et al., 2002; Dickson et al., 2012; Lloyd-Evans et al., 2008; Shen et al., 2012), with no or very small concomitant increase in cytosolic Ca2+ (Christensen et al., 2002; Dickson et al., 2012). These findings have been interpreted to mean that the proton gradient in the lysosome is responsible for actively driving Ca2+ into the lysosome via an unidentified H+-dependent Ca2+ transporter (Morgan et al., 2011). Because these findings are consistent with studies in yeast showing that the Ca2+/H+ exchangers establish the vacuolar Ca2+ gradient (Morgan et al., 2011), this 'pH hypothesis' has been widely accepted (Calcraft et al., 2009; Christensen et al., 2002; Lloyd-Evans et al., 2008; Morgan et al., 2011; Shen et al., 2012). However, large, prolonged manipulations of luminal pH may interfere directly with Ca2+ reporters, and secondarily affect many other lysosomal processes, especially lysosome luminal Ca2+ buffering (Dickson et al., 2012), lysosome membrane potential, and fusion/fission of endosomes and lysosomes (Mindell, 2012). Therefore, these hypotheses about lysosomal Ca2+ refilling and store maintenance remain to be tested under more physiological conditions. Directly measuring lysosomal Ca2+ release has been made possible recently by using lysosome-targeted genetically-encoded Ca2+ indicators (Shen et al., 2012) (GCaMP3-ML1; see Figure 1—figure supplement 1A), which co-localized well, in healthy cells, with lysosomal associated membrane protein-1 (Lamp1), but not with markers for the ER, mitochondria, or early endosomes (Figure 1—figure supplement 1B).
Results
A physiological assay to monitor lysosomal Ca2+ refilling
Monitoring lysosomal Ca2+ store refilling requires direct activation of lysosomal Ca2+ channels with specific agonists to repeatedly induce Ca2+ release. NAADP, the only known endogenous Ca2+-mobilizing messenger that has been suggested to be lysosome-specific, was not useful due to its membrane impermeability and strong desensitization (Morgan et al., 2011). Using the specific, membrane–permeable synthetic agonists that we recently identified for lysosomal TRPML1 channels (ML-SA1) (Shen et al., 2012), we developed a lysosomal Ca2+ refilling assay as shown in Figure 1A. In HEK293 cell lines stably-expressing GCaMP3-ML1 (HEK-GCaMP3-ML1 cells), bath application of ML-SA1 (30s) in a 'zero' (low; free [Ca2+] <10 nM) Ca2+ external solution produced robust lysosomal Ca2+ release measured by GCaMP3 fluorescence (△F/F0 >0.5; Figure 1A,B, Figure 1—figure supplement 1, Figure 1—figure supplement 2A). The membrane-permeable form of the fast Ca2+ chelator BAPTA (BAPTA-AM) completely blocked the ML-SA1 response (Figure 1—figure supplement 1D), supporting its Ca2+ specificity. Importantly, GCaMP3-ML1-tagged lysosomes co-localized well with LysoTracker, indicating that the pH of these lysosomes was not different from lysosomes without GCaMP3-ML1 (Figure 1—figure supplement 1E).
Figure 1 with 4 supplements see all
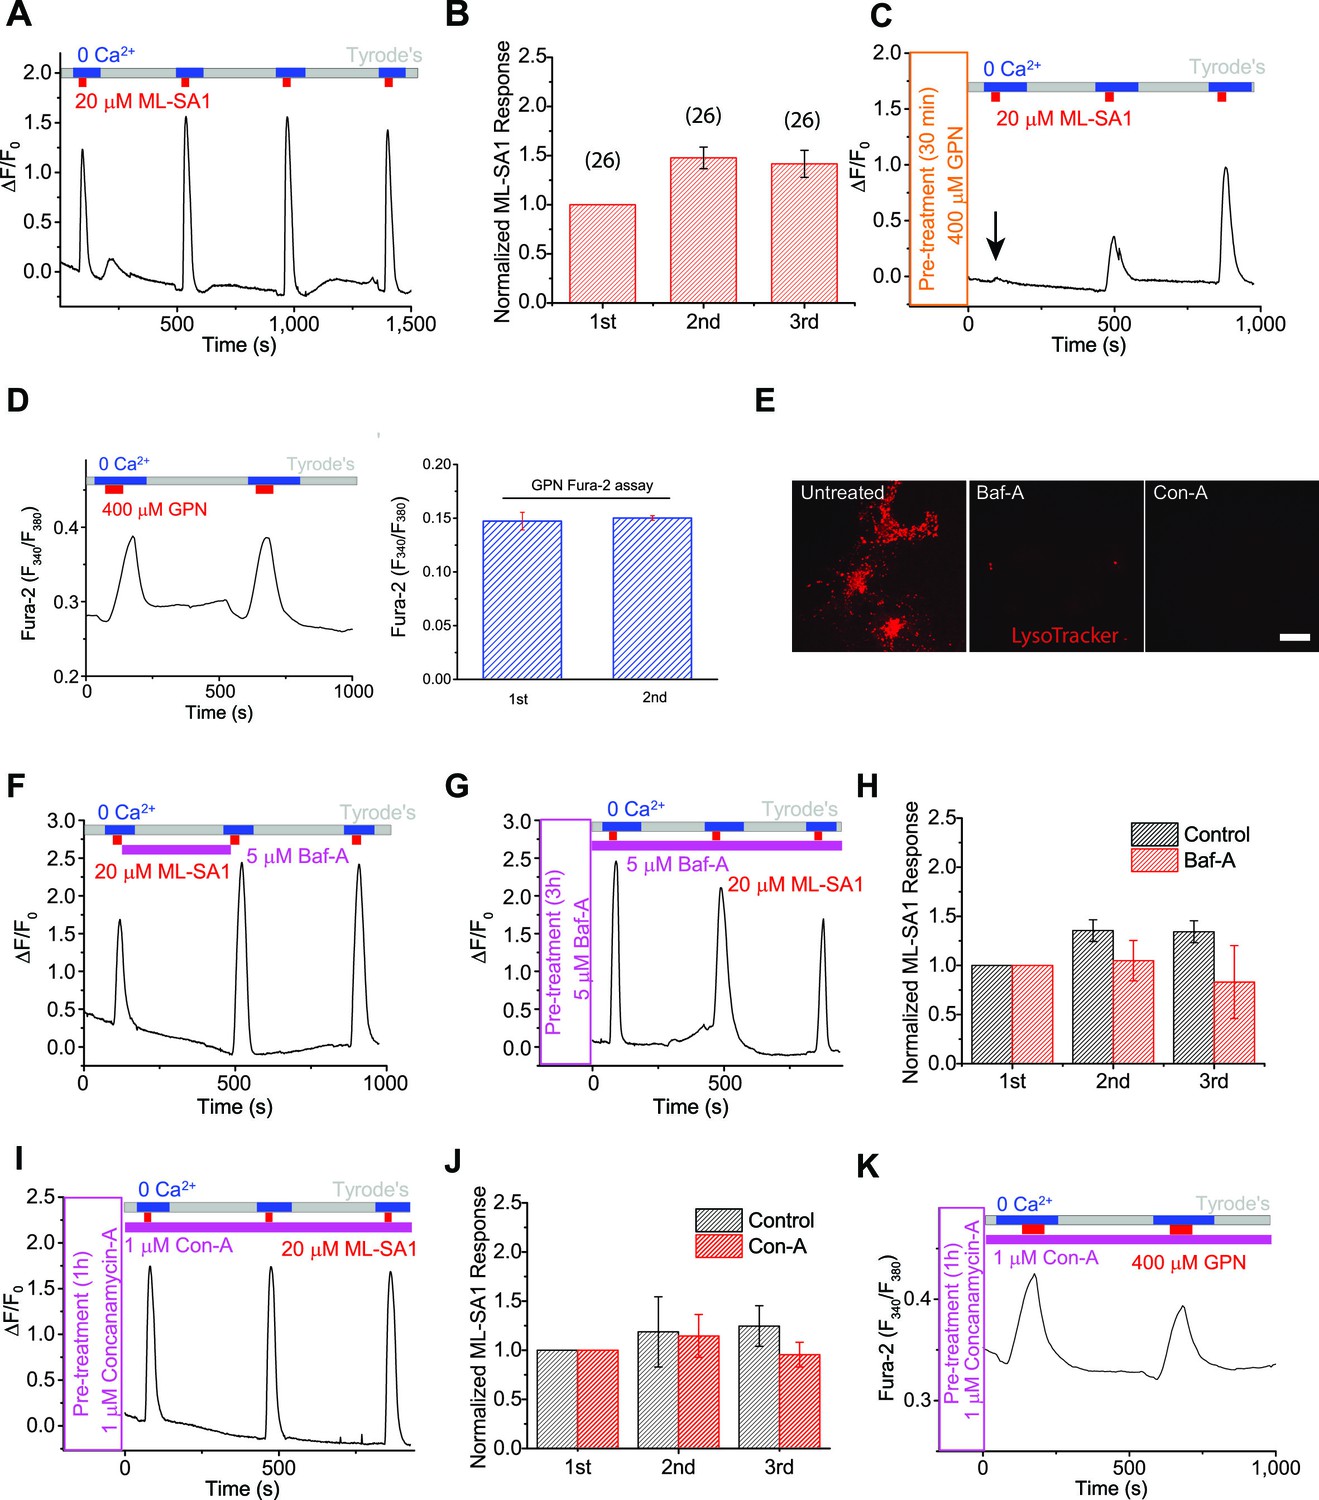
The proton gradient of the lysosome is not required for lysosomal Ca2+ store refilling.
(A) In HEK293 cells stably expressing GCaMP3-ML1 (HEK-GCaMP3-ML1 cells), bath application of the ML1 channel agonist ML-SA1 (20 µM) in a low or 'zero' Ca2+ (free [Ca2+]<10 nM) external solution induced an increase in GCaMP3 fluorescence (F470). After washout for 5 min, repeated applications of ML-SA1 induced responses that were similar to or larger than the first one. Note that because baseline may drift during the entire course of the experiment (up to 20 min), we typically set F0 based on the value that is closest to the baseline. (B) The average Ca2+ responses of three ML-SA1 applications at intervals of 5 min (n=26 coverslips; Figure 1—source data 1). (C) Pre-treatment with lysosome-disrupting agent GPN for 30 min abolished the response to ML-SA1 in HEK-GCaMP3-ML1 cells. Washout of GPN resulted in a gradual re-appearance of ML-SA1 responses. See quantitation in Figure 1—figure supplement 2K. (D) Repeated applications of GPN resulted in Ca2+ release that was measured with the Ca2+-sensitive dye Fura-2 (F340/F380) in non-transfected HEK293T cells. (E) Application of Bafilomycin-A (Baf-A, 5 µM) and Concanamycin-A (Con-A, 1 µM) quickly (<5 min) abolished LysoTracker staining, an indicator of acidic compartments. (F) Acute application of Baf-A (5 µM) for 5 min did not block Ca2+ refilling of lysosomes in HEK-GCaMP3-ML1 cells. (G) Prolonged pre-treatment (3 hr) with Baf-A did not block Ca2+ refilling of lysosomes. (H) Quantification of 1st (p value = 0.11), 2nd (p=0.01), and 3rd (p=0.004) ML-SA1 responses upon Baf-A treatment (n=8) compared to control traces (n=6; Figure 1—source data 1). (I) Prolonged treatment (1 hr) with Con-A did not prevent lysosomes from refilling their Ca2+ stores. (J) Quantification of 1st (p=0.90), 2nd (p=0.33), and 3rd (p=0.66) ML-SA1 responses with Con-A pre-treatment (n=3; Figure 1—source data 1). (K) Con-A did not reveal differences in Ca2+ refilling responses to repeated applications of GPN in untransfected HEK293T cells. Panels A, C, D, F, G, I, and K are the average of 30–40 cells from one representative coverslip/experiment. The data in panels B, H, and J represent mean ± SEM from at least three independent experiments.
-
Figure 1—source data 1
Source data of Figure 1B, H, J: The average Ca2+ responses to ML-SA1 applications under control (B), Baf-A1 treatment (H), and Con-A treatment (J).
- https://doi.org/10.7554/eLife.15887.003
After release of the initial, 'naïve' Ca2+ store upon first application of ML-SA1, lysosomal Ca2+ stores are largely depleted, as immediate re-application of ML-SA1 evoked much smaller or no response (Figure 1—figure supplement 2B). The reduction in the second response was unlikely caused by channel desensitization, as surface-expressed TRPML1 mutant (TRPML1-4A [Shen et al., 2012]) showed repeated Ca2+ entry in Ca2+-containing (2 mM) external solution (Figure 1—figure supplement 2C). Notably, increasing the time interval between consecutive applications quickly and effectively restored the lysosomal ML-SA1 responses; it required 5 min for full restoration/refilling (Figure 1—figure supplement 2D–F). With 5 min of refilling time (chosen for the rest of our experiments), in healthy HEK-GCaMP3-ML1 cells, the second and third ML-SA1 responses are often slightly higher than the first, naïve response (Figure 1A,B).
To ensure the ML-SA1-induced Ca2+ responses are exclusively intracellular and lysosomal, all ML-SA1 responses were measured either in the 'zero' Ca2+ external solution (Figure 1A) or in the presence of La3+ (Figure 1—figure supplement 2G,H), a membrane-impermeable TRPML channel blocker (Dong et al., 2008) that is expected to completely inhibit surface-expressed TRPML1 channels. Ca2+ release was completely blocked by the TRPML-specific, synthetic antagonists ML-SI1 or ML-SI3 (Figure 1—figure supplement 2I,J). In addition, pretreatment with the lysosome-disrupting reagent Glycyl-L-phenylalanine 2-naphthylamide (GPN) (Berg et al., 1994) also completely abolished the refilling either in 'zero' Ca2+ or in the presence of La3+ (Figure 1C; Figure 1—figure supplement 2G), further supporting the lysosome-specificity of the response. The effect of GPN, presumably on so-called 'lysosomal membrane permeabilization', is known to be rapid and reversible (i.e. membrane 'resealing') (Kilpatrick et al., 2013). Consistently, washout of GPN led to gradual recovery of ML-SA1 responses (Figure 1C; Figure 1—figure supplement 2K). Similar Ca2+ refilling of lysosomes was also observed in GCaMP3-ML1-transfected human fibroblasts (Figure 1—figure supplement 2L), Cos-7 cells (Figure 1—figure supplement 2M), primary mouse macrophages, mouse myoblasts, and DT40 chicken B cells (Figure 3D–E’). These findings support the idea that these responses are mediated by intracellular Ca2+ release from refilled lysosomal stores (also see Figure 1—figure supplement 1C for signals from individual lysosomes). Taken together, these results ensure that lysosomal Ca2+ stores can be emptied and refilled repeatedly and consistently in a time-dependent manner.
Studying lysosomal Ca2+ refilling using a lysosome-specific 'membrane-permeabilizer'
GPN is a membrane-permeable di-peptide that is broken down by the lysosome-specific enzyme Cathepsin C. GPN causes permeabilization of lysosome membranes resulting from the accumulation of its breakdown products within lysosomes (Berg et al., 1994). Because it is a lysosome-specific membrane disrupting agent, it is often used to mobilize lysosome-specific Ca2+ stores (Jadot et al., 1984; Morgan et al., 2011; Berg et al., 1994; Haller et al., 1996a; Haller et al., 1996b). Using Fura-2 Ca2+ imaging in non-transfected HEK293T cells, repeated applications of GPN resulted in a response of similar magnitude to the first, suggestive of Ca2+ refilling (Figure 1D). Importantly, in HEK-GCaMP3-ML1 cells, pre-treatment with GPN or BAPTA-AM abolished the initial response to ML-SA1, confirming the GCaMP3-ML1 probe’s lysosome and Ca2+ specificity (Figure 1C).
The GPN-mediated 'membrane permeabilizaton' causes the leakage of small solutes including Ca2+ and H+ into the cytosol (Appelqvist et al., 2012), resulting in changes in the pH (see Figure 1—figure supplement 3A) and [Ca2+] in both the lysosome lumen and the peri-lysosomal (juxta-lysosomal) cytosol (Berg et al., 1994; Kilpatrick et al., 2013; Appelqvist et al., 2012). We therefore tested the Ca2+-specificity of GPN-induced increases on the Fura-2 and GCaMP3 signals. In cells pretreated with BAPTA-AM, whereas ER-mediated Ca2+ responses were abolished, GPN-induced Fura-2 increases were much reduced but not abolished (Figure 1—figure supplement 3B,C). Consistently, in HEK-GCaMP3-ML1 cells pre-treated with BAPTA-AM, GPN still induced a significant increase in GCaMP3 fluorescence. However, in these BAPTA-AM-treated cells, GPN-induced increases in GCaMP3 responses were completely abolished by a pre-treatment of Bafilomycin-A (Baf-A), a specific inhibitor of the V-ATPase (Morgan et al., 2011) (Figure 1—figure supplement 3D). Given that both Ca2+ dyes and GFP-based Ca2+ indicators are known to be sensitive to other ionic factors, particularly pH (Rudolf et al., 2003), GPN-induced changes in lysosomal and peri-lysosomal pH could directly or indirectly account for the BAPTA-insensitive GCaMP3 and residual Fura-2 signals. Consistent with this prediction, in the vacuoles isolated from HEK-GCaMP3-ML1 cells, GCaMP3 fluorescence was sensitive not only to high Ca2+, but also to low pH (Figure 1—figure supplement 3E). Because ratiometric dyes are less susceptible to pH changes (Morgan et al., 2015), in the Fura-2 assay, GPN may induce a large Ca2+ signal, but also a pH-mediated contaminating non-Ca2+ signal (compare Figure 1—figure supplement 3B with C).
The pH gradient and V-ATPase are not required for lysosome Ca2+ refilling
Next, we investigated the mechanisms underlying Ca2+ refilling of lysosomes. Inhibition of endocytosis using dynasore and organelle mobility using cytoskeleton inhibitors such as nocodazole and trichostatin A did not block refilling (data not shown). Furthermore, disruption of Golgi function using Brefeldin-A also had no effect on refilling (Figure 2—figure supplement 1A). Hence, in agreement with previous findings, the secretory and endocytic pathways are not directly involved in Ca2+ refilling. PI(3,5)P2 is a lysosome-specific phosphoinositide that regulates multiple lysosomal channels and transporters including ML1 (Xu and Ren, 2015). Pharmacologically decreasing PI(3,5)P2 levels using two small molecule PIKfyve inhibitors: YM201636 (Jefferies et al., 2008) and Apilimod (Xu et al., 2013) did not prevent lysosomal Ca2+ refilling (Figure 1—figure supplement 4A,B).
Previous findings have suggested that the pH gradient in the lysosome may be important to Ca2+ refilling (Xu and Ren, 2015; Morgan et al., 2011), however few studies have carefully investigated this possibility. Baf-A and Concanamycin-A (Con-A), inhibitors of the V-ATPase, increase the pH of the lysosome (Morgan et al., 2011), demonstrated by abolishing LysoTracker staining within minutes after application (Figure 1E). Surprisingly, acute application of Baf-A did not affect the response to ML-SA1, and had little effect on refilling (Figure 1F), nor did pretreatment of Baf-A for 1, 3 (Figure 1G,H), or 16 hr. Similarly, pretreatment with Con-A also had no effect on Ca2+ refilling of lysosomes (Figure 1I, J, K). These findings suggest that contradictory to previous conclusions, the pH gradient and V-ATPase may not be required for Ca2+ refilling, and that an alternative mechanism is responsible for supplying Ca2+ to lysosomes.
The Endoplasmic Reticulum (ER) Ca2+ store is required for lysosomal Ca2+ refilling
Lysosomal Ca2+ refilling was drastically reduced upon removal of extracellular Ca2+ during refilling time in HEK-GCaMP3-ML1 cells (Figure 2A). However, blocking Ca2+ entry using the generic cation channel blocker La3+ did not prevent refilling (Figure 2—figure supplement 1B). Because ER stores are passively, although slowly, depleted in 0 Ca2+ (Wu et al., 2006) (also see Figure 2—figure supplement 1C), given the demonstrated role of extracellular Ca2+ in ER store refilling (Lewis, 2007; Berridge, 2012), we investigated the role of the ER in lysosomal refilling. Thapsigargin (TG), a specific inhibitor of the ER SERCA pump (Thastrup et al., 1990), rapidly and completely abolished Ca2+ refilling to lysosomes (Figure 2B,G), but did not affect the first, naïve ML-SA1 response (Figure 2C; second response marked with arrow) or lysosomal pH (Figure 2D). In the GPN & Fura-2 assay that provides a reasonable (but not perfect; see above) measurement of lysosomal Ca2+ release independent of ML1, TG application also largely reduced the second GPN response (Figure 1D, 2E), which could be further reduced or abolished by Baf-A pretreatment. These results suggest that TG had no direct effect on the naïve Ca2+ store in lysosomes, but specifically and potently affected lysosomal Ca2+ refilling. A rapid and complete block of Ca2+ refilling was also observed for another SERCA pump inhibitor CPA (Figure 2—figure supplement 1D–G). TG may induce an unfolded protein response (UPR; Matsumoto et al., 2013). However, the UPR inducer Tunicamycin (Oslowski and Urano, 2011) did not affect refilling (Figure 2—figure supplement 1H,I).
Figure 2 with 2 supplements see all
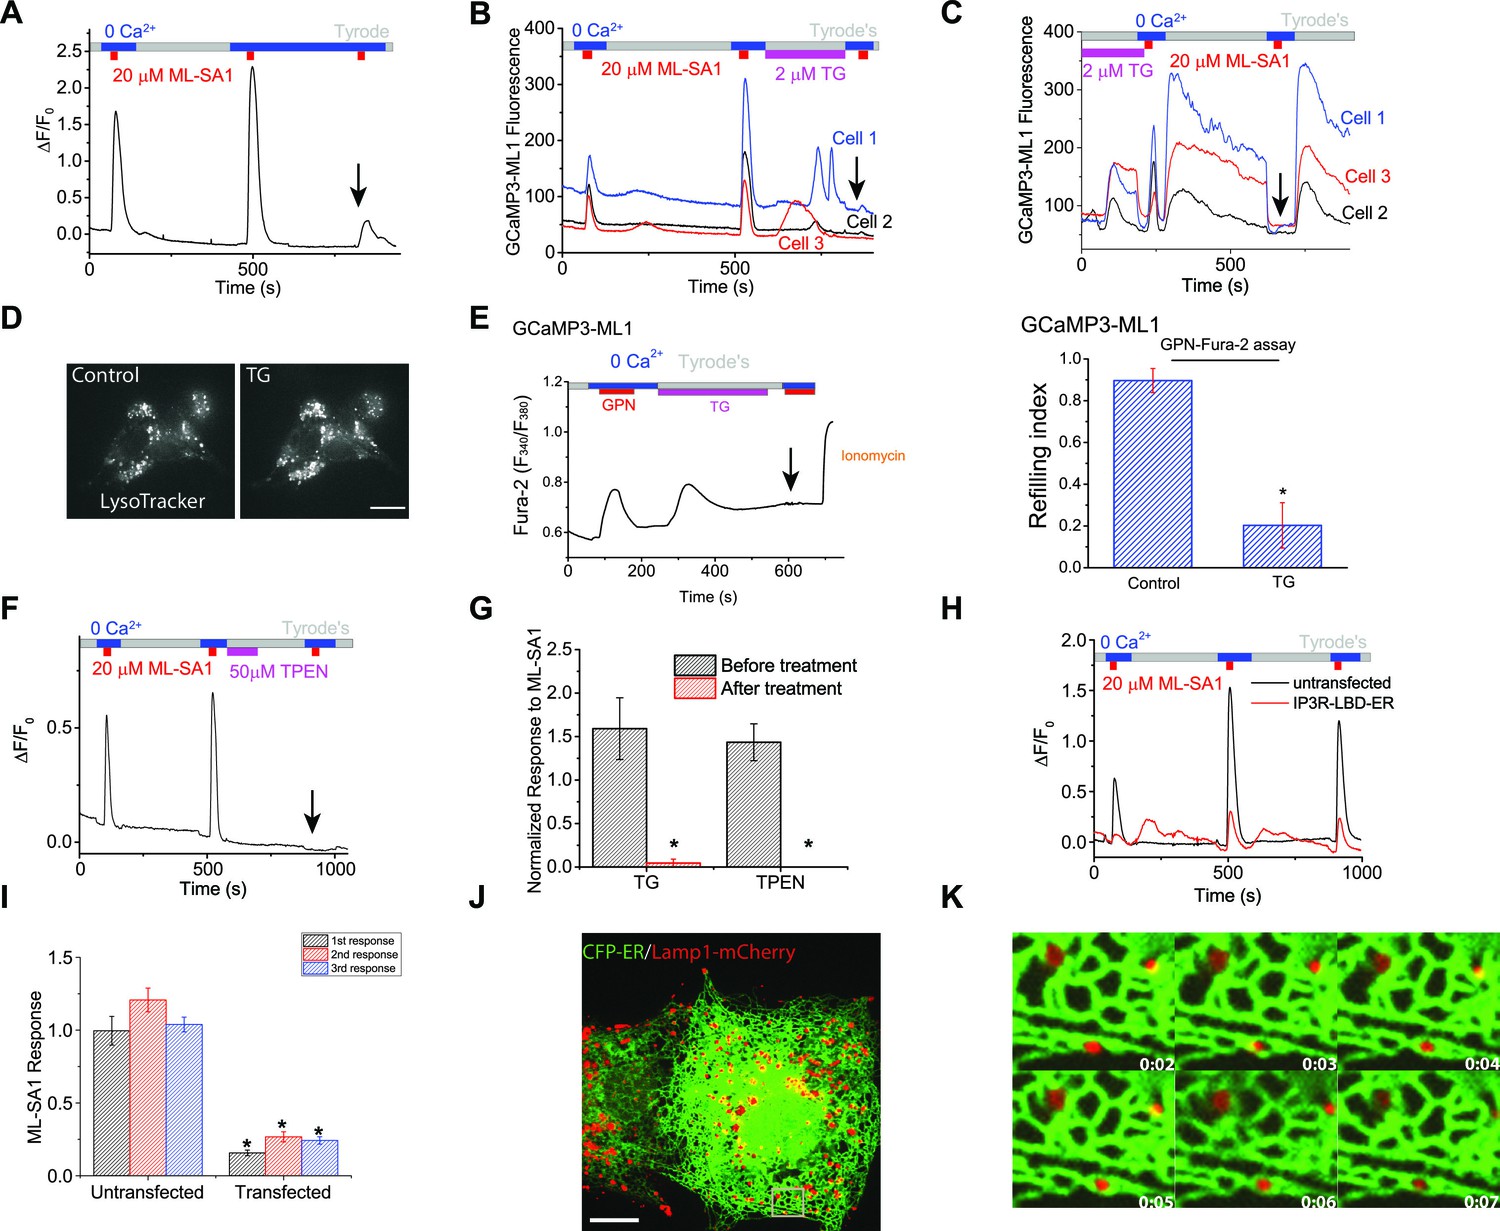
Lysosomal Ca2+ refilling is dependent on the endoplasmic reticulum (ER) Ca2+.
(A) Ca2+ refilling of lysosomes requires external Ca2+. (B) Dissipating the ER Ca2+ gradient using SERCA pump inhibitor Thapsigargin (TG) blocked lysosomal Ca2+ refilling in HEK-GCaMP3-ML1 cells. Three representative cells from among 30–40 cells on one coverslip are shown. Note that Ca2+ release from the ER through passive leak revealed after blocking SERCA pumps was readily seen in HEK-GCaMP3-ML1 cells, presumably due to the close proximity between lysosomes and the ER (Kilpatrick et al., 2013). (C) The effect of acute application of TG (2 μM) on the naïve ML-SA1 response and lysosomal Ca2+ refilling in HEK-GCaMP3-ML1 cells. Application of TG did not affect the naïve, initial response to ML-SA1, but did abolish the refilled response (see arrow). Control naïve response 1.39 ± 0.09 (n=3); Naïve response after TG 1.08 ± 0.07 (n=3); p=0.2024). (D) LysoTracker staining was not reduced by TG (2 μM). (E) Representative Ca2+ imaging trace and statistical data (right panel; Figure 2—source data 1) show that TG application reduced the second responses to GPN compared to the control shown in Figure 1D. (F) Chelating ER Ca2+ using 2-min TPEN treatment blocked Ca2+ refilling of lysosomes. (G) TG (p=0.008; n=5) and TPEN (p=0.001; n=5) abolished Ca2+ refilling of lysosomes (Figure 2—source data 1). (H) In HEK-GCaMP3-ML1 cells that were transiently transfected with the IP3R-ligand binding domain with ER targeting sequence (IP3R-LBD-ER), which significantly reduces basal [Ca2+]ER (see Figure 2—figure supplement 2E), ML-SA1 responses were reduced, compared to untransfected cells on the same coverslip. (I) The 1st (p=0.0014), 2nd (p=0.0004), and 3rd responses (p<0.0001) of GCaMP3-ML1 cells transfected with the IP3R-LBD-ER were significantly reduced compared to untransfected cells on the same coverslip (n=5; Figure 2—source data 1). (J) Lysosomes (labeled with Lamp1-mCherry) interact closely with the ER (labeled with CFP-ER). (K) Time lapse zoomed-in images of a selected region from J show the dynamics of ER-lysosome association (see an example in the boxed area). Panels A, F, H are the average responses of 30–40 cells from one representative experiment. The data in panel G represent mean ± SEM from five independent experiments.
-
Figure 2—source data 1
Comparisons of GPN (E) and ML-SA1 responses (G, I) under different pharmacological and genetic manipulations (Figure 2E,G,I).
Comparisons of responses to ML-SA1 (E) and GPN (G) (Figure 2—figure supplement 1E,G).
- https://doi.org/10.7554/eLife.15887.009
[Ca2+]ER, but not cytosolic Ca2+, can be chelated by N,N,N',N'-Tetrakis (2-pyridylmethyl) ethylenediamine (TPEN), a membrane-permeable metal chelator with a low affinity for Ca2+ (Hofer et al., 1998). Although TPEN may also enter the lysosomal lumen, the much reduced (>100 fold less) Ca2+-binding affinity in the acidic pH (pHLY = 4.6) suggests that chelation of lysosomal Ca2+ would be minimal. Acute application of TPEN completely blocked lysosomal Ca2+ refilling (Figure 2F,G). A short application of TPEN also blocked ER Ca2+ release stimulated by the endogenous P2Y receptor agonist ATP (Figure 2—figure supplement 2B compared to Figure 2—figure supplement 2A), but not the lysosomal Fura-2 Ca2+ response stimulated by GPN (Figure 2—figure supplement 2C compared to Figure 2—figure supplement 2A). These findings suggest that chelation of ER Ca2+ stores using TPEN had no direct effect on the naïve Ca2+ store in lysosomes, but specifically and potently affected lysosomal Ca2+ refilling.
The ER Ca2+store can also be genetically and chronically reduced without raising intracellular Ca2+ levels by transfecting cells with the IP3R ligand-binding domain with an ER targeting sequence (IP3R-LBD-ER) (Várnai et al., 2005). As expected, IP3R-LBD-ER expression decreased ATP-induced IP3R-mediated Ca2+ release (Figure 2—figure supplement 2E). Interestingly, it also reduced the GPN induced lysosomal Ca2+ release in HEK293T cells (Figure 2—figure supplement 2E). Furthermore, in HEK-GCaMP3-ML1 cells transfected with IP3R-LBD-ER, lysosomal Ca2+ release was significantly reduced when compared to un-transfected cells on the same coverslip (Figure 2H,I). Collectively, these findings suggest that the ER, the major Ca2+ store in the cell, is essential for refilling and the ongoing maintenance of lysosomal Ca2+ stores, but not required for the naïve Ca2+ release from lysosomes.
A functional interaction between ER and lysosome Ca2+ stores was previously suggested (Haller et al., 1996a; 1996b), but these results have been largely ignored, presumably due to the lack of specific tools required for definitive interpretation. Recent findings have shown that as endosomes mature, they increase their contact with the ER (Friedman et al., 2013). Interestingly, the Ca2+ released from SERCA inhibition on the ER was detected on our GCaMP3-ML1 probe (Figure 2B,C, Figure 2—figure supplement 1D,F), likely due to close membrane contact between the ER and lysosomes (Eden, 2016). Similar detection of ER Ca2+ release by a genetically-encoded, lysosomally-targeted chameleon Ca2+ sensor utilizing lysosome membrane protein Lamp1 has also been reported (McCue et al., 2013). Using time-lapse confocal imaging, we found that the majority of lysosomes, marked by Lamp1-mCherry, move and traffic together with ER tubules, labeled with CFP-ER (Figure 2J,K). Thus, the ER could be the direct source of Ca2+ to lysosomes by forming nanojunctions with them (Eden, 2016).
IP3-receptors, not ryanodine receptors, on the ER are required for Ca2+ refilling of lysosomes
Ca2+ release from the ER is mediated primarily by two Ca2+ release channels, IP3Rs and ryanodine receptors (RYRs), both of which are expressed in HEK cells (Querfurth et al., 1998; Jurkovicova et al., 2008) (see also Figure 2—figure supplement 2F). Since IP3Rs are responsible for Ca2+ transfer to mitochondria (Hayashi et al., 2009), we examined whether IP3Rs on the ER were responsible for Ca2+ refilling of the lysosome. Notably, Ca2+ refilling of the non-naïve lysosome Ca2+ store was completely blocked by Xestospongin-C (Xesto; Figure 3A,C), a relatively specific IP3R blocker (Peppiatt et al., 2003) (Figure 3—figure supplement 1A–E). In addition, in the GPN & Fura-2 assay that provides a measurement of lysosomal Ca2+ release independent of ML1, blocking IP3 receptor by Xesto profoundly attenuated lysosomal Ca2+ refilling in both HEK-GCaMP3-ML1 cells and non-transfected mouse embryonic fibroblasts (MEF) cells (Figure 1D; Figure 3—figure supplement 1F–J). Acute application of Xesto after allowing lysosomal Ca2+ stores to refill for 5 min (hence stores are completely refilled and functionally equivalent to 'naïve' ones) also slowly (up to 10 min) reduced lysosomal Ca2+ release, suggesting that constitutive lysosomal Ca2+ release under resting conditions may gradually deplete lysosome Ca2+ stores if refilling is prevented (Figure 3—figure supplement 1B–E). Consistent with this hypothesis, long-term (20 min) treatment with the aforementioned ER Ca2+ manipulators including TG and TPEN almost completely abolished lysosomal Ca2+ release (Figure 2—figure supplement 2D), further supporting the interpretation that ongoing constitutive Ca2+ release and refilling requires ER Ca2+.
Figure 3 with 3 supplements see all
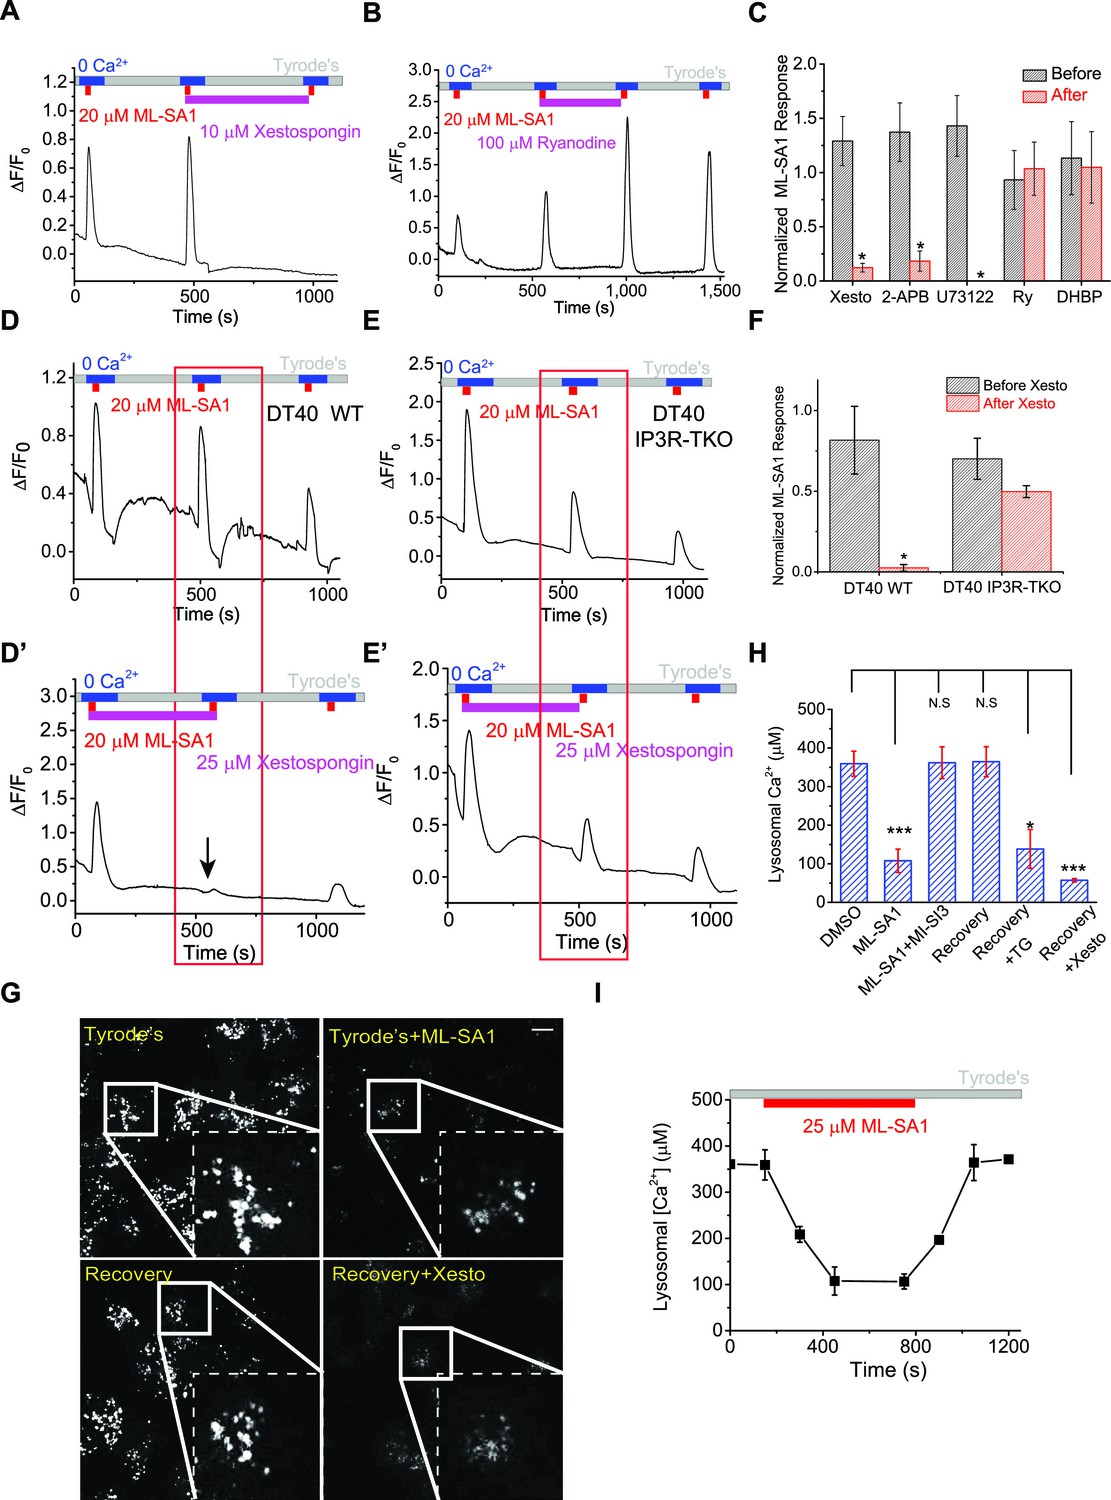
IP3-receptors on the ER are required for lysosomal Ca2+ store refilling.
(A) The IP3-receptor (IP3R) antagonist Xestospongin-C (Xesto, 10 μM) prevented Ca2+ refilling of lysosomes in HEK-GCaMP3-ML1 cells (p=0.007). Note that Xesto was co-applied with ML-SA1. (B) Ryanodine (100 μM), which blocks Ryanodine receptors at high concentrations, did not block Ca2+ refilling to lysosomes. Note that Ryanodine was co-applied with ML-SA1. (C) Quantification of the responses to ML-SA1 in HEK-GCaMP3-ML1 cells after treatment with Xesto, 2-APB (Figure 3—figure supplement 1K), U73122 (Figure 3—figure supplement 1L,M), Ryanodine (Ry), and DHBP (Figure 3—figure supplement 2A) (Figure 3—source data 1).(D) DT40 WT cells transiently transfected with GCaMP3-ML1 show Ca2+ refilling. (D’) IP3R antagonist Xesto completely blocked Ca2+ refilling of lysosomes in DT40 WT cells. (E) DT40 IP3R triple KO (TKO) cells transiently transfected with GCaMP3-ML1 also show Ca2+ refilling. (E’) Xesto did not block Ca2+ refilling of lysosomes in IP3R-TKO cells. (F) Quantification of ML-SA1 responses with or without Xesto in WT and IP3R-TKO DT40 cells (Figure 3—source data 1). (G) Representative images showing the effects of Xesto on the recovery of ML-SA1-induced responses in HEK-ML1 stable cells loaded with OG-BAPTA-dextran. La3+ was used to block external Ca2+ influx that could be mediated by surface-expressed ML1 in the overexpression system (see Figure 1—figure supplement 2G). (H) The effects of TG and Xesto on intralysosomal Ca2+ contents measured by OG-BAPTA-dextran (Figure 3—source data 1). (I) The effects of ML-SA1 on [Ca2+]Ly measured by OG-BAPTA-dextran. Panels A, B, D, D’, E, E’, F, F’ and H are the average of 30–40 cells from one representative experiment. The data in panels C, F and H represent mean ± SEM from at five independent experiments. The scale bar in panel G = 10 μm.
-
Figure 3—source data 1
Normalized ML-SA1 responses or lysosomal Ca2+ contents under pharmacological (C, H) or genetic manipulations (F) (Figure 3C, F, H).
The effects of Xesto on GPN responses in GCaMP3-ML1 (G) and MEF cells (J) (Figure 3—figure supplement 1G, J). ML-SA1 responses in GCaMP3-ML1-transfected WT and IP3R-TKO DT40 cells (Figure 3—figure supplement 2B). The effects of Xesto treatment on lysosomal Ca2+ changes induced by ML-SA1 (Figure 3—figure supplement 3E, G).
- https://doi.org/10.7554/eLife.15887.013
2-APB, a non-specific IP3R antagonist (Peppiatt et al., 2003), also blocked Ca2+ refilling (Figure 3C, Figure 3—figure supplement 1K). U73122 is a PLC inhibitor that blocks the constitutive production of IP3 (Cárdenas et al., 2010) and prevents ATP-induced IP3R-mediated Ca2+ release (Figure 3—figure supplement 1L). U73122 also completely prevented Ca2+ refilling of lysosomes (Figure 3C, Figure 3—figure supplement 1M), suggesting that basal production of IP3 is essential for Ca2+ refilling of lysosomes. In contrast, blocking the RyRs with high (>10 μM) concentrations of ryanodine (Figure 3B,C), or with the receptor antagonist 1,1′-diheptyl-4,4′-bipyridinium (DHBP) (Berridge, 2012) (Figure 3C, Figure 3—figure supplement 2A), did not affect Ca2+ refilling. Notably, co-application of RYR and IP3R blockers with the second ML-SA1 response did not change the amplitude of the response (Figure 3A,B). Together, these findings demonstrate that IP3Rs on the ER are specifically required for lysosomal Ca2+ refilling, but not for Ca2+ release from naïve stores or completely refilled stores.
In contrast with the pharmacological analyses described above, lysosomal store refilling occurred in both WT and IP3R triple KO (TKO) DT40 chicken B cells (Várnai et al., 2005; Cárdenas et al., 2010) that were transfected with GCaMP3-ML1 (Figure 3D–F, Figure 3—figure supplement 2B). However, unlike WT DT40 cells, in which the IP3R-specific antagonist Xesto completely blocked Ca2+ refilling (Figure 3D’, F), Xesto had no obvious blocking effect in IP3R-TKO cells (Figure 3E’, F). In addition, the kinetics of lysosomal refilling was markedly delayed in IP3R TKO cells compared with WT cells (Figure 3—figure supplement 2C). These results are consistent with the notion that in normal conditions, IP3Rs are the sole source of Ca2+ refilling of lysosomes. When IP3Rs are genetically deleted, however, IP3R-independent mechanisms contribute to lysosomal Ca2+ refilling, possibly as a consequence of genetic compensation. Refilling in IP3R-TKO DT40 cells was not blocked by RYR inhibitors (Figure 3—figure supplement 2D,E).
Studying lysosomal Ca2+ refilling using intra-lysosomal Ca2+ dyes
As an additional assay to directly 'monitor' intralysosomal Ca2+, we employed two intraluminal Ca2+ indicators Fura-Dextran and Oregon 488 BAPTA-1 dextran (OG-BAPTA-dextran) (Morgan et al., 2015). After being pulse/chased into ML1-mCherry-transfected HEK293T cells or HEK-ML1 stable cells, the dyes enter the lysosome lumen (Figure 3—figure supplement 3A,B) after endocytosis (Christensen et al., 2002). Due to their pH sensitivities, these dyes can detect intra-lysosomal Ca2+ ([Ca2+]LY) changes, but preferentially only when the intra-lysosomal pH (pHL) remains constant below pH 5.0 (Morgan et al., 2015) (see Figure 3—figure supplement 3C). In the Fura-Dextran-loaded ML1-mCherry-transfected HEK-293T cells, ML-SA1 application induced Ca2+ release from the lysosome lumen (Figure 3—figure supplement 3D). As we found in our GCaMP3-ML1 assay, Xesto abolished the ML-SA1-induced decrease in [Ca2+]LY(Figure 3—figure supplement 3D,E). Likewise, in HEK-ML1 stable cells loaded with OG-BAPTA-dextran, which had a much higher efficiency in loading to the lysosome (Figure 3—figure supplement 3B), TG or Xesto treatment profoundly reduced lysosomal Ca2+ refilling (Figure 3G—I; Figure 3—figure supplement 3F,G). Note that LysoTracker staining was not significantly reduced by ML-SA1, TG, or Xesto, suggesting that the signals were primarily mediated by changes of intralysosomal Ca2+, not intralysosomal pH. In contrast, treatment of cells with Baf-A1 or NH4Cl markedly increased lysosomal pH from 4.8 to 7.0 (Figure 3—figure supplement 3J,K). Such large pH elevations may cause dramatic changes in both Kd of OG-BAPTA-dextran (see Figure 3—figure supplement 3C) and luminal Ca2+ buffering capability (Morgan et al., 2015; Dickson et al., 2012), preventing accurate determinations of [Ca2+]LY under these pH manipulations. Taken together, these results are consistent with the conclusions that were drawn based on the aforementioned ML-SA1 & GCaMP3-ML1 assay and the GPN & Fura-2 assay.
Inhibition of ER IP3R channels and Ca2+ release causes lysosomal dysfunction and a LSD-like phenotype
Lysosomal Ca2+ is important to lysosomal function and membrane trafficking (Kiselyov et al., 2010; Shen et al., 2012; Lloyd-Evans et al., 2008). Lysosomal dysfunction is commonly associated with a compensatory increase of lysosome biogenesis, manifested as increased expression of essential lysosomal genes (Settembre et al., 2013). For example, the expression of Lamp1, a lysosomal marker, is elevated in most LSDs (Meikle et al., 1997). Lamp1 expression was significantly elevated in cells treated with low concentrations of IP3R blockers 2-APB and Xesto, as well as the ER Ca2+ chelator TPEN, but not in the cells treated with the RyR blocker DHBP (Figure 4A). Consistently, LysoTracker staining was significantly increased in cells treated with Xesto, but not 1,1'-diheptyl-4,4'-bipyridinium dibromide (DHBP; Figure 4B). Lysosomal dysfunction is also often associated with lysosomal enlargement and accumulation of various incompletely digested biomaterials (Shen et al., 2012; Dong et al., 2008). Notably, in cells that were treated with Xesto, but not with the vehicle control DMSO, lysosomal compartments were enlarged, and non-degradable, autofluorescent lipofuscin-like materials accumulated in puncta structures (Figure 4C), reminiscent of cells with defective lysosomal Ca2+ release (ML1 KO cells; Dong et al., 2008) (Figure 4C). By showing that inhibiting IP3R-mediated Ca2+ release from the ER results in a lysosome storage phenotype in the cell, these findings suggest that lysosome Ca2+ store refilling from IP3Rs ion the ER has important consequences for lysosome function and cellular health.
Figure 4
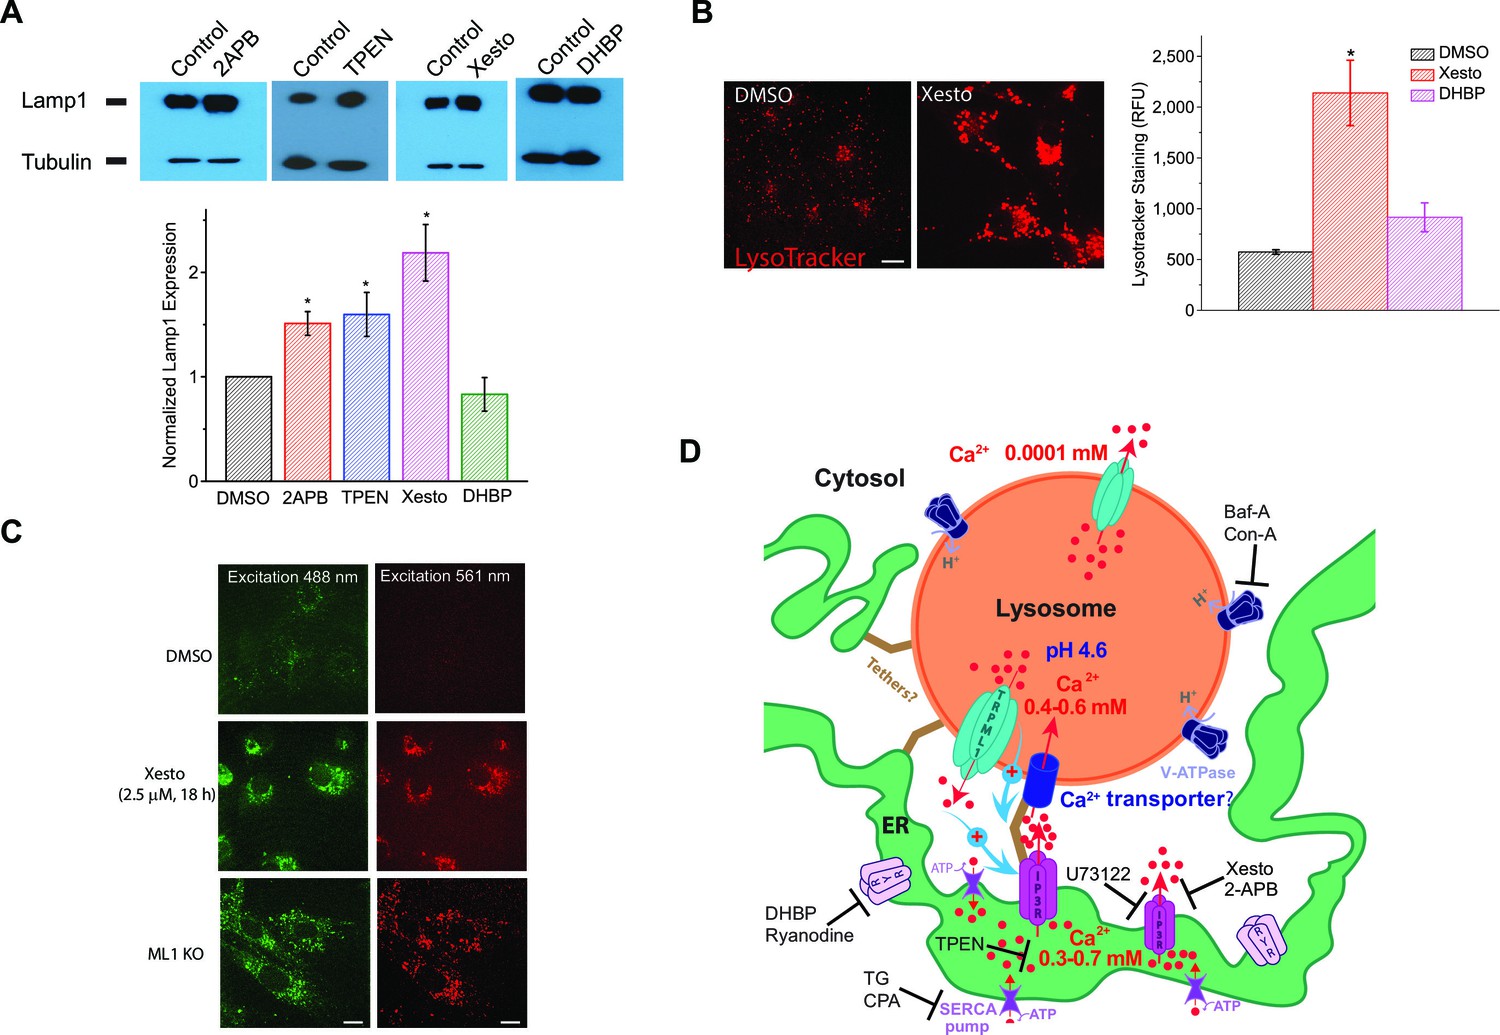
Blocking ER IP3-receptors Ca2+ channels refill lysosome Ca2+ stores to prevent lysosomal dysfunction.
(A) Upper panels: Western blotting analyses of Lamp1 in HEK293T cells treated with 2-APB (50 μM), TPEN (0.1 μM), Xesto (10 μM), and DHBP (5 μM) compared to DMSO for 24 hr (n=4 separate experiments for each condition). Lower panel: treating HEK293T cells with 2-APB (p=0.05) and Xesto (p=0.013), as well as TPEN (p=0.02), significantly increased Lamp1 expression. DHBP did not significantly change Lamp1 expression (p=0.23) (Figure 4—source data 1). (B) The effects of Xesto (10 μM, 18 hr; p=0.0001) and DHBP (50 μM, 18 hr; p=0.063) treatment compared to DMSO on the lysosomal compartments detected by LysoTracker staining in HEK293T cells (average of 20–30 cells in each of 3 experiments; Figure 4—source data 1). Scale bar = 15 μm. (C) The effect of Xesto (10 μM, 18 h) treatment on accumulation of the autofluorescent lipofuscin materials in non-transfected HEK293T cells. Autofluorescence was observed in a wide spectrum but shown at two excitation wavelengths (488 and 561 nm). ML1 KO MEFs are shown for comparison. Scale bar = 15 μm. (D) A proposed model of Ca2+ transfer from the ER to lysosomes. The ER is a Ca2+ store with [Ca2+]ER ~ 0.3–0.7 mM; lysosomes are acidic (pHLy ~ 4.6) Ca2+ stores ([Ca2+]Ly ~ 0.5 mM). IP3Rs on the ER release Ca2+ to produce a local high Ca2+ concentration, from which an unknown low-affinity Ca2+ transport mechanism refills Ca2+ to a lysosome. Unidentified tether proteins may link the ER membrane proteins directly with the lysosomal membrane proteins to maintain contact sites of 20–30 nm for purposes of Ca2+ exchange. Ca2+ released from lysosomes or a reduction/depletion in [Ca2+]Ly may, through unidentified mechanisms, 'promote' or 'stabilize' ER-lysosome interaction (Phillips and Voeltz, 2016; Eden, 2016). At the functional ER-lysosome contact sites, Ca2+ can be transferred from the ER to lysosomes through a passive Ca2+ transporter or channel based on the large chemical gradient of Ca2+ that is created when lysosome stores are depleted. Baf-A and Con-A are specific V-ATPase inhibitors; Xesto and 2APB are IP3R blockers; U73122 is a PLC inhibitor that blocks the constitutive production of IP3; DHBP and Ryanodine (>10 μM) are specific RyR blockers; TG and CPA are SERCA pump inhibitors; and TPEN is a luminal Ca2+ chelator.
-
Figure 4—source data 1
Source data of Figure 4A,B: Quantifications of Lamp-1 protein levels (A) or LysoTracker staining (B) under different experimental conditions and manipulations.
- https://doi.org/10.7554/eLife.15887.018
Discussion
Using pharmacological and genetic approaches to manipulate ER Ca2+ levels and Ca2+ release and three different assays to directly measure lysosome Ca2+ release, we show that under normal conditions lysosome Ca2+ stores are refilled from the ER Ca2+ store through IP3 receptors independent of lysosome pH (see Figure 4D). Our findings are in contrast to several studies in the literature that suggest that inhibition of the V-ATPase is sufficient to deplete lysosome Ca2+ stores. Previous conclusions suggesting the importance of H+ gradient in regulating lysosome Ca2+ stores would therefore implicate the existence of an H+-dependent Ca2+ transporter in lysosomal membranes that can operate at the extremely low cytosolic free Ca2+ level (100 nM), representing a high affinity uptake system. Our work, however, suggest that a low affinity uptake mechanism is more likely. Hence either a low affinity Ca2+ transporter or rectifying Ca2+ channel might suffice. A putative VDAC-like channel in the lysosome, resembling mitochondrial VDAC channels (van der Kant and Neefjes, 2014), may interact directly with IP3Rs to receive Ca2+ from the ER. Importantly, it has been previously suggested that Ca2+ uptake into isolated lysosomes is mediated by a low-affinity (mM range) Ca2+ transporter (Lemons and Thoene, 1991).
The lysosomal pH gradient is thought to be essential for the maintenance of high free [Ca2+]Ly (Calcraft et al., 2009; Christensen et al., 2002; Dickson et al., 2012; Lloyd-Evans et al., 2008; Shen et al., 2012). However, in addition to triggering lysosomal Ca2+ release, as proposed by Christensen et al. (Christensen et al., 2002), lysosomal pH elevation is also known to affect [Ca2+]Ly or its measurement via several other mechanisms. Whereas the total [Ca2+]Ly is reported to be in the low mM range (5–10 mM), free [Ca2+]Ly is generally agreed to be in the high μM range (100–500 μM) (Morgan et al., 2015). Therefore, the lysosome lumen must contain substantial Ca2+ buffers (Morgan et al., 2015). Ca2+ buffers in acidic compartments and the ER are known to bind Ca2+ much better at neutral pH (Dickson et al., 2012). Hence increasing pHL from 4.8 to 7.0 may effectively reduce free [Ca2+]Ly without necessarily triggering lysosomal Ca2+ release and affecting total [Ca2+]Ly. Consistent with such an interpretation, a compelling study recently demonstrated that in secretory granules and the ER, increasing luminal pH changed the Ca2+ buffering capacity of both Ca2+ containing compartments and reduced free [Ca2+], while causing a minimal (20 nM) increase in cytosolic Ca2+ (Dickson et al., 2012). Additionally, lysosomal pH may act on luminal Ca2+ dyes by affecting their chromophore fluorescence and Ca2+-binding affinity (Kd) (Morgan et al., 2015). Because Kd drops more than 1,000 foldtimes when pHL is increased from 4.8 to 7.0, accurate calibration is currently not possible. Furthermore, prolonged lysosomal pH manipulations may also indirectly affect lysosomal Ca2+ homeostasis, for instance, via membrane fusion and fission between compartments containing different amounts of Ca2+, H+, and their buffers. Finally, although elevating lysosomal pH may trigger lysosomal Ca2+ release, the accompanying increase in cytoplasmic Ca2+ was rather small (20–40 nM) (Dickson et al., 2012; Christensen et al., 2002). Moreover, the instantaneous changes (following pH increase and decrease) of Ca2+ probe fluorescence (Dickson et al., 2012; Christensen et al., 2002) are inconsistent with the slow rates of Ca2+ leak and re-uptake demonstrated in the current study.
The persistence of a GPN signal even after intracellular Ca2+ chelation is important for understanding the limits of this lysosome-specific pharmacological tool. GPN can certainly be used in conjunction with other tools to examine lysosome specificity, but caution is necessary with its use for Ca2+ store measurement, as a component of the signal observed in Fura-2 loaded cells, although small, is a result of the membrane permeabilization that causes a decrease in cytosolic pH. Similarly, reagents like Baf-A and NAADP that are used to mobilize lysosomal Ca2+ also release H+ into the cytosol (Morgan and Galione, 2007; Appelqvist et al., 2012; Scott and Gruenberg, 2011; Yoshimori et al., 1991), which could have been misinterpreted as a Ca2+ signal in previous studies (Morgan et al., 2011). pH may affect cytosolic Ca2+ indicators through the chromophore fluorescence, Ca2+-binding affinity, or Ca2+-dependent conformational changes (e.g., in the case of GCaMP) (Morgan et al., 2015). Therefore, if experimental conditions are not optimized, the presumed cytosolic Ca2+ signals may also reflect pH changes, or unidentified pH-mediated non-Ca2+ signals. We propose that BAPTA-AM control experiments be routinely conducted in any lysosomal Ca2+ measurement. It is possible that the 'pH contaminating effect' might have resulted in numerous misinterpretations of lysosome Ca2+ stores in the literature, particularly those examining the interactions between ER and lysosome Ca2+.
Based on our results in the current study, recent studies of ER-lysosome interactions (Phillips and Voeltz, 2016), and previous Ca2+ uptake studies on isolated lysosomes (Lemons and Thoene, 1991), we hypothesize that ER-refilling of lysosomal stores is a regulated, two-step process (see Figure 4D). First, lysosome store depletion may trigger establishment of ER-lysosome contacts (Phillips and Voeltz, 2016). Although lysosomes and ER are in close proximity under resting conditions, lysosome store depletion may 'stabilize' the ER-lysosome contact, and/or 'tether' and approximate both membranes (e.g., from 20–30 nm to 10 nm) (Phillips and Voeltz, 2016; Eden, 2016). Second, at the relatively stable, functional ER-lysosome contact sites, a passive Ca2+ transport process can occur from the ER to lysosomes, by utilizing the large Ca2+gradient created when lysosome stores are actively depleted. Up to 5 min may be required to complete the whole refilling process from 'initiation' through 'uptake'.
Our results not only provide an explanation for the reported sensitivity of the Ca2+ stores of acidic organelles to ER disrupting agents (Menteyne et al., 2006; Haller et al., 1996a), but are also consistent with the observations that lysosomes may buffer cytosolic Ca2+ released from the ER (López-Sanjurjo et al., 2013). The unexpected role of the ER in maintaining Ca2+ stores in lysosomes may help resolve the long-standing mystery of how impaired ER Ca2+ homeostasis is commonly seen in lysosomal storage diseases (LSDs) (Coen et al., 2012), and how manipulating ER Ca2+ reduces lysosome storage (Lloyd-Evans et al., 2008; Mu et al., 2008). In addition, our work reveals that, depending on the treatment conditions (acute versus prolonged treatment), many assumed-to-be ER-specific reagents may indirectly affect lysosome Ca2+ stores. This may impact the interpretations of a large body of literature on Ca2+ signaling. Although we demonstrated a central role of IP3Rs in lysosomal Ca2+ refilling, other ER Ca2+ channels may also participate under certain conditions, as seen in the IP3R TKO cells.
Accumulating evidence suggests that the ER forms membrane contact sites with other organelles, including plasma membrane, mitochondria (Cárdenas et al., 2010), endosomes (Alpy et al., 2013), and lysosomes (van der Kant and Neefjes, 2014). ER-endosome membrane contact, although currently difficult to study, was proposed to facilitate cholesterol transport from endosomes to the ER (Rocha et al., 2009; van der Kant and Neefjes, 2014; Drin et al., 2016). Given the established role of lysosomal Ca2+ release in cholesterol transport (Shen et al., 2012), lysosomal Ca2+ release may have a direct role in regulating ER-lysosome interaction (see Figure 4D). In ER-mitochondria contact sites, the tethering protein GRP-75 links IP3Rs with VDAC channels on mitochondria to regulate Ca2+ homeostasis and ATP production (Cárdenas et al., 2010). Similar unidentified tethers may also link IP3Rs with the putative lysosomal Ca2+ transporter for store refilling (see Figure 4D). The importance of lysosomal Ca2+ in regulating a variety of intracellular signaling pathways is becoming increasingly recognized (Medina et al., 2015). ER-lysosome interaction may serve as a hub for Ca2+ signaling to regulate cellular homeostasis through coordinating the primary anabolic and catabolic pathways in the cell. Studying the two-step lysosomal Ca2+ refilling process may prove important for future identification of the low-affinity Ca2+ uptake transporter/channel in the lysosome, and for studying the molecular mechanisms that regulate the functional ER-lysosome interaction.
Materials and methods
Molecular biology
Request a detailed protocolGenetically-encoded Ca2+ indicator GCaMP3 was fused directly to the N-terminus of ML1 (GCaMP3-ML1) as described previously (Shen et al., 2012). The IP3R-LBD-ER construct (Várnai et al., 2005) was a kind gift from Dr. Thomas Balla (National Institute of Child Health and Human Development, NIH). The pECFP-ER plasmid was obtained from CLONTECH. Lamp1-mCherry was made by fusing mCherry with the C terminus of Lamp1.
Western blotting
Request a detailed protocolStandard Western blotting protocols were used. HEK293T cells were treated every 4 hr for 24 hr with IP3R antagonists 2-APB and Xestospongin-C, ER Ca2+ chelator TPEN, and RyR antagonist DHBP. Lamp1 antibody was from Developmental Studies Hybridoma Bank (Iowa).
Mammalian cell culture
Request a detailed protocolImmortalized cell lines (HEK293 and Cos-7) were purchased from ATCC and cultured following standard culture protocols. DT40-WT and IP3R-TKO cells were a generous gift from Dr. Darren Boehning (The University of Texas Health Sciences Center at Houston). Human fibroblasts were obtained from the Cornell Institute for Medical Research (NJ, USA). HEK 293 cells stably expressing GCaMP3-ML1 (HEK-GCaMP3-ML1 cells) were generated using the Flip-In T-Rex 293 cell line (Invitrogen). All these cells were neither authenticated nor tested for mycoplasma contamination. HEK293 cells are on the list of frequently misidentified or cross-contaminated cell lines. All cells were cultured in a 37°C incubator with 5% CO2. HEK293T cells, Tet-On HEK293 cells stably expressing GCaMP3-ML1 (HEK-GCaMP3-ML1 cells), Cos-7 cells, and human fibroblasts were cultured in DMEM F12 (Invitrogen) supplemented with 10% (vol/vol) FBS or Tet-free FBS. DT40 cells were kept in suspension in RPMI 1640 (Invitrogen) supplemented with 450 µL β-mercaptoethanol, 2 mM L-glutamine, 10% FBS, and 1% chicken serum (Várnai et al., 2005; Cárdenas et al., 2010). We noted that lysosomal Ca2+ store refilling was often compromised in high-passage or poorly-maintained cell cultures.
Human fibroblasts and DT40 cells were transiently transfected using the Invitrogen Neon electroporation kit (1200 V, 1 pulse, 30 s). HEK293T cells, HEK-GCaMP3-ML1 cells, and Cos-7 cells were transfected using Lipofectamine 2000 (Invitrogen). All cells were used for experiments 24–48 hr after transfection.
Confocal imaging
Request a detailed protocolLive imaging of cells was performed on a heated and humidified stage using a Spinning Disc Confocal Imaging System. The system includes an Olympus IX81 inverted microscope, a 100X Oil objective NA 1.49 (Olympus, UAPON100XOTIRF), a CSU-X1 scanner (Yokogawa), an iXon EM-CCD camera (Andor). MetaMorph Advanced Imaging acquisition software v.7.7.8.0 (Molecular Devices) was used to acquire and analyze all images. LysoTracker (50 nM; Invitrogen) was dissolved in culture medium and loaded into cells for 30 min before imaging. MitoTracker was dissolved in culture medium and loaded into cells for 15 min before imaging (25 nM). Coverslips were washed 3 times with Tyrode’s and imaged in Tyrode’s.
GCaMP3-ML1 Ca2+ imaging
Request a detailed protocolGCaMP3-ML1 expression was induced in Tet-On HEK-GCaMP3-ML1 cells 20-24h prior to experiments using 0.0 1µg/mL doxycycline. GCaMP3-ML1 fluorescence was monitored at an excitation wavelength of 470 nm (F470) using a EasyRatio Pro system (PTI). Cells were bathed in Tyrode’s solution containing 145 mM NaCl, 5 mM KCl, 2 mM CaCl2, 1 mM MgCl2, 10 mM Glucose, and 20 mM Hepes (pH 7.4). Lysosomal Ca2+ release was measured in a zero Ca2+ solution containing 145 mM NaCl, 5 mM KCl, 3 mM MgCl2, 10 mM glucose, 1 mM EGTA, and 20 mM HEPES (pH 7.4). Ca2+ concentration in the nominally free Ca2+ solution is estimated to be 1–10 μM. With 1 mM EGTA, the free Ca2+ concentration is estimated to be <10 nM based on the Maxchelator software (http://maxchelator.stanford.edu/). Experiments were carried out 0.5 to 6 hr after plating. Because baseline may drift during the entire course of the experiment (up to 20 min), we typically set F0 based on the value that is closest to the baseline.
Fura-2 Ca2+ imaging
Request a detailed protocolCells were loaded with Fura-2 (3 µM) and Plurionic-F127 (3 µM) in the culture medium at 37°C for 60 min. Florescence was recorded using the EasyRatio Pro system (PTI) at two different wavelengths (340 and 380 nm) and the ratio (F340/F380) was used to calculate changes in intracellular [Ca2+]. All experiments were carried out 1.5 to 6 hr after plating.
Oregon green 488 BAPTA-1 dextran imaging
Request a detailed protocolCells were loaded with Oregon Green 488 BAPTA-1 dextran (100 μg/ml) at 37°C in the culture medium for 4–12 hr, and then pulsed/chased for additional 4–16 hr. Fluorescence imaging was performed at 37°C. In vitro calcium-binding (Kd) affinities of OG-BAPTA-dextran were determined using KCl-based solutions (140 mM KCl, X mM CaCl2, 1 mM MgCl2, 10 mM HEPES, 10 mM MES, 0 or 1 mM BAPTA) adjusted to different pH (pH 4.5, 5.0, 6.0, and 7.0). By varying the amount of added Ca2+ (X= 0- 10 mM), solutions with different pH and free [Ca2+] were made based on the Maxchelator software (http://maxchelator.stanford.edu/). OG-BAPTA-dextran (5 μg/ml) fluorescence for each solution was obtained to plot the calibration curve (Morgan et al., 2015; Dickson et al., 2012; Christensen et al., 2002). In cells that were pre-treated with ionomycin, nigericin, and valinomycin (Morgan et al., 2015; Dickson et al., 2012; Christensen et al., 2002), in vivo minimal and maximal Fluorescence (Fmin and Fmax) were determined by perfusing the cells with 0 or 10 mM Ca2+ external solutions, respectively. Lysosomal [Ca2+] at different pH were determined using the following calibration equation: [Ca2+] = Kd × (F-Fmin)/ (Fmax-F).
Lysosomal pH measurement
Request a detailed protocolCells were pulsed with OG-488-dextran for 6 hr, and chased for additional 12 hr (Johnson et al., 2016). Cells were then bathed in the external solutions (145 mM KCl, 5 mM glucose, 1 mM MgCl2, 1 mM CaCl2, 10 mM HEPES, 10 mM MES, adjusted to various pH values ranging from 4.0 to 8.0) that contained 10 μM nigericin and 10 μM monensin (Johnson et al., 2016). Images were captured using an EasyRatio Pro system. A pH standard curve was plotted based on the fluorescence ratios: F480/ F430.
Cytosolic pH sensitivity of GCaMP3-ML1
Request a detailed protocolGCaMP3-ML1-positive vacuoles were isolated from vacuolin-1-treated HEK-GCaMP3-ML1 cells, as described previously (Zhang et al., 2012). Briefly, cells were treated with 1 μM vacuolin-1 for up to 12 hr to increase the size of late endosomes and lysosomes (Cerny et al., 2004). Vacuoles were released into the dish by mechanical disruption of the cell membrane with a small glass electrode. After vacuoles were released into the dish, patch pipettes containing either a 'high-Ca2+' (10 mM) internal solution or a 'low-pH' solution (140 mM KCl, 1 mM EGTA, 20 mM MES, 10 mM Glucose, pH adjusted to 2.0) were placed close to 'puff' the vacuoles. Images were captured using a CCD camera connected to the fluorescence microscope.
Reagents
All reagents were dissolved and stored in DMSO or water and then diluted in Tyrode’s and 0 Ca2+ solutions for experiments. 2-APB, ATP, Con-A, CPA, Doxycycline, DHBP, TG, TPEN were from Sigma; GPN and U73122 were from Santa Cruz; Ryanodine was from Abcam; LysoTracker, Fura-2, Mitotracker, Plurionic F-127, and Fura-Dextran were from Invitrogen; Baf-A was from LC Laboratories; ML-SA1 was from Chembridge; and Xestospongin-C was from Cayman Chemical, AG Scientific, and Enzo; Oregon Green 488 BAPTA-1 dextran was from life technologies. ML-SI compounds were identified from a Ca2+-imaging-based highthroughput screening conducted at NIH/NCATS Chemical Genomics Center (NCGC;https://pubchem.ncbi.nlm.nih.gov/bioassay/624414#section=Top). ML-SI compounds are available upon request.
Data analysis
Request a detailed protocolData are presented as mean ± SEM. All statistical analyses were conducted using GraphPad Prism. Paired t-tests were used to compare the average of three or more experiments between treated and untreated conditions. A value of p<0.05 was considered statistically significant. In the cases only individual traces were shown, the traces are representative from at least 30–40 cells, or from at least independent repeats.
References
-
STARD3 or STARD3NL and VAP form a novel molecular tether between late endosomes and the ERJournal of Cell Science 126:5500–5512.https://doi.org/10.1242/jcs.139295
-
Lysosome-mediated apoptosis is associated with cathepsin D-specific processing of bid at Phe24, Trp48, and Phe183Annals of Clinical and Laboratory Science 42:231–242.
-
Calcium signalling remodelling and diseaseBiochemical Society Transactions 40:297–309.https://doi.org/10.1042/BST20110766
-
pH-dependent regulation of lysosomal calcium in macrophagesJournal of Cell Science 115:599–607.
-
Orai-STIM-mediated Ca2+ release from secretory granules revealed by a targeted Ca2+ and pH probeProceedings of the National Academy of Sciences of the United States of America 109:E3539–E3548.https://doi.org/10.1073/pnas.1218247109
-
New molecular mechanisms of inter-organelle lipid transportBiochemical Society Transactions 44:486–578.https://doi.org/10.1042/BST20150265
-
The formation and function of ER-endosome membrane contact sitesBiochimica Et Biophysica Acta.https://doi.org/10.1016/j.bbalip.2016.01.020
-
Endoplasmic reticulum-endosome contact increases as endosomes traffic and matureMolecular Biology of the Cell 24:.https://doi.org/10.1091/mbc.E12-10-0733
-
MAM: more than just a housekeeperTrends in Cell Biology 19:81–88.https://doi.org/10.1016/j.tcb.2008.12.002
-
Intralysosomal hydrolysis of glycyl-L-phenylalanine 2-naphthylamideThe Biochemical Journal 219:965–970.https://doi.org/10.1042/bj2190965
-
The position of lysosomes within the cell determines their luminal pHThe Journal of Cell Biology 212:677–692.https://doi.org/10.1083/jcb.201507112
-
Hypoxia differently modulates gene expression of inositol 1,4,5-trisphosphate receptors in mouse kidney and HEK 293 cell lineAnnals of the New York Academy of Sciences 1148:421–427.https://doi.org/10.1196/annals.1410.034
-
Direct mobilisation of lysosomal Ca2+ triggers complex Ca2+ signalsJournal of Cell Science 126:60–66.https://doi.org/10.1242/jcs.118836
-
Lysosome-sarcoplasmic reticulum junctions. A trigger zone for calcium signaling by nicotinic acid adenine dinucleotide phosphate and endothelin-1The Journal of Biological Chemistry 279:54319–54326.https://doi.org/10.1074/jbc.M406132200
-
Mediated calcium transport by isolated human fibroblast lysosomesThe Journal of Biological Chemistry 266:14378–14382.
-
Generation and characterization of a lysosomally targeted, genetically encoded Ca(2+)-sensorThe Biochemical Journal 449:449–457.https://doi.org/10.1042/BJ20120898
-
Lysosomal calcium signalling regulates autophagy through calcineurin and TFEBNature Cell Biology 17:288–299.https://doi.org/10.1038/ncb3114
-
Diagnosis of lysosomal storage disorders: evaluation of lysosome-associated membrane protein LAMP-1 as a diagnostic markerClinical Chemistry 43:1325–1335.
-
Lysosomal acidification mechanismsAnnual Review of Physiology 74:69–86.https://doi.org/10.1146/annurev-physiol-012110-142317
-
Imaging approaches to measuring lysosomal calciumMethods in Cell Biology 126:159–195.https://doi.org/10.1016/bs.mcb.2014.10.031
-
NAADP induces pH changes in the lumen of acidic Ca2+ storesThe Biochemical Journal 402:301–310.https://doi.org/10.1042/BJ20060759
-
Molecular mechanisms of endolysosomal Ca2+ signalling in health and diseaseThe Biochemical Journal 439:349–374.https://doi.org/10.1042/BJ20110949
-
Structure and function of ER membrane contact sites with other organellesNature Reviews. Molecular Cell Biology 17:69–82.https://doi.org/10.1038/nrm.2015.8
-
Expression of ryanodine receptors in human embryonic kidney (HEK293) cellsThe Biochemical Journal 334:79–86.https://doi.org/10.1042/bj3340079
-
Cholesterol sensor ORP1L contacts the ER protein VAP to control Rab7-RILP-p150 Glued and late endosome positioningThe Journal of Cell Biology 185:1209–1225.https://doi.org/10.1083/jcb.200811005
-
Looking forward to seeing calciumNature Reviews. Molecular Cell Biology 4:579–586.https://doi.org/10.1038/nrm1153
-
Signals from the lysosome: a control centre for cellular clearance and energy metabolismNature Reviews. Molecular Cell Biology 14:283–296.https://doi.org/10.1038/nrm3565
-
NAADP mobilizes calcium from the endoplasmic reticular Ca(2+) store in T-lymphocytesThe Journal of Biological Chemistry 282:18864–18871.https://doi.org/10.1074/jbc.M610925200
-
Thapsigargin, a tumor promoter, discharges intracellular Ca2+ stores by specific inhibition of the endoplasmic reticulum Ca2(+)-ATPaseProceedings of the National Academy of Sciences of the United States of America 87:2466–2470.https://doi.org/10.1073/pnas.87.7.2466
-
Small regulators, major consequences - Ca²⁺ and cholesterol at the endosome-ER interfaceJournal of Cell Science 127:929–938.https://doi.org/10.1242/jcs.137539
-
Targeted expression of the inositol 1,4,5-triphosphate receptor (IP3R) ligand-binding domain releases Ca2+ via endogenous IP3R channelsProceedings of the National Academy of Sciences of the United States of America 102:7859–7864.https://doi.org/10.1073/pnas.0407535102
-
Ca2+ store depletion causes STIM1 to accumulate in ER regions closely associated with the plasma membraneThe Journal of Cell Biology 174:803–813.https://doi.org/10.1083/jcb.200604014
-
Lysosomal physiologyAnnual Review of Physiology 77:57–80.https://doi.org/10.1146/annurev-physiol-021014-071649
-
Bafilomycin A1, a specific inhibitor of vacuolar-type H(+)-ATPase, inhibits acidification and protein degradation in lysosomes of cultured cellsThe Journal of Biological Chemistry 266:17707–17712.
Article and author information
Author details
Funding
NIH Office of the Director (NS062792)
- Abigail G Garrity
- Wuyang Wang
- Crystal MD Collier
- Sara A Levey
- Qiong Gao
- Haoxing Xu
NIH Office of the Director (AR060837)
- Abigail G Garrity
- Wuyang Wang
- Crystal MD Collier
- Sara A Levey
- Qiong Gao
- Haoxing Xu
The funders had no role in study design, data collection and interpretation, or the decision to submit the work for publication.
Acknowledgements
We thank Dr. Darren Boehning for DT40-WT and IP3R-TKO cells, and Thomas Balla for the IP3R-LBD-ER construct. We also thank Richard Hume and Edward Stuenkel for comments on the manuscript, and appreciate the encouragement and helpful comments of other lab members in the Xu lab.
Copyright
© 2016, Garrity et al.
This article is distributed under the terms of the Creative Commons Attribution License, which permits unrestricted use and redistribution provided that the original author and source are credited.
Metrics
-
- 10,178
- views
-
- 1,901
- downloads
-
- 167
- citations
Views, downloads and citations are aggregated across all versions of this paper published by eLife.
Download links
A two-part list of links to download the article, or parts of the article, in various formats.
Downloads (link to download the article as PDF)
Open citations (links to open the citations from this article in various online reference manager services)
Cite this article (links to download the citations from this article in formats compatible with various reference manager tools)
The endoplasmic reticulum, not the pH gradient, drives calcium refilling of lysosomes
eLife 5:e15887.
https://doi.org/10.7554/eLife.15887
Further reading
-
- Cell Biology
- Chromosomes and Gene Expression
Meiotic crossover recombination is essential for both accurate chromosome segregation and the generation of new haplotypes for natural selection to act upon. This requirement is known as crossover assurance and is one example of crossover control. While the conserved role of the ATPase, PCH-2, during meiotic prophase has been enigmatic, a universal phenotype when pch-2 or its orthologs are mutated is a change in the number and distribution of meiotic crossovers. Here, we show that PCH-2 controls the number and distribution of crossovers by antagonizing their formation. This antagonism produces different effects at different stages of meiotic prophase: early in meiotic prophase, PCH-2 prevents double-strand breaks from becoming crossover-eligible intermediates, limiting crossover formation at sites of initial double-strand break formation and homolog interactions. Later in meiotic prophase, PCH-2 winnows the number of crossover-eligible intermediates, contributing to the designation of crossovers and ultimately, crossover assurance. We also demonstrate that PCH-2 accomplishes this regulation through the meiotic HORMAD, HIM-3. Our data strongly support a model in which PCH-2’s conserved role is to remodel meiotic HORMADs throughout meiotic prophase to destabilize crossover-eligible precursors and coordinate meiotic recombination with synapsis, ensuring the progressive implementation of meiotic recombination and explaining its function in the pachytene checkpoint and crossover control.
-
- Cell Biology
- Physics of Living Systems
Cell mechanical properties determine many physiological functions, such as cell fate specification, migration, or circulation through vasculature. Identifying factors that govern the mechanical properties is therefore a subject of great interest. Here, we present a mechanomics approach for establishing links between single-cell mechanical phenotype changes and the genes involved in driving them. We combine mechanical characterization of cells across a variety of mouse and human systems with machine learning-based discriminative network analysis of associated transcriptomic profiles to infer a conserved network module of five genes with putative roles in cell mechanics regulation. We validate in silico that the identified gene markers are universal, trustworthy, and specific to the mechanical phenotype across the studied mouse and human systems, and demonstrate experimentally that a selected target, CAV1, changes the mechanical phenotype of cells accordingly when silenced or overexpressed. Our data-driven approach paves the way toward engineering cell mechanical properties on demand to explore their impact on physiological and pathological cell functions.


