Drosophila larval to pupal switch under nutrient stress requires IP3R/Ca2+ signalling in glutamatergic interneurons
- Tata Institute of Fundamental Research, India
- Manipal University, India
- Janelia Research Campus, Howard Hughes Medical Institute, United States
Abstract
Neuronal circuits are known to integrate nutritional information, but the identity of the circuit components is not completely understood. Amino acids are a class of nutrients that are vital for the growth and function of an organism. Here, we report a neuronal circuit that allows Drosophila larvae to overcome amino acid deprivation and pupariate. We find that nutrient stress is sensed by the class IV multidendritic cholinergic neurons. Through live calcium imaging experiments, we show that these cholinergic stimuli are conveyed to glutamatergic neurons in the ventral ganglion through mAChR. We further show that IP3R-dependent calcium transients in the glutamatergic neurons convey this signal to downstream medial neurosecretory cells (mNSCs). The circuit ultimately converges at the ring gland and regulates expression of ecdysteroid biosynthetic genes. Activity in this circuit is thus likely to be an adaptation that provides a layer of regulation to help surpass nutritional stress during development.
https://doi.org/10.7554/eLife.17495.001eLife digest
Insect larvae must feed voraciously to accumulate enough nutrients to tide them over the pupal stage of their lifecycle. Unlike larvae, pupae do not feed but instead use their stored energy reserves to fuel their metamorphosis into adults. To maximise their chances of survival, insect larvae must carefully time their transformation into pupae based on both the availability of nutrients in the environment and their own energy stores.
The circuit of neurons within the larval nervous system that detects external nutrient levels, and then relays that information to the insect’s metabolic system, remains unknown. This circuit is also of interest because many animal species are thought to use it to slow down their metabolism during periods of food deprivation. Jayakumar et al. therefore set out to identify this circuit by studying how genetically modified fruit fly larvae transform into pupae when nutrients are in short supply.
The experiments show that mutant larvae that lack a protein called IP3R struggle to turn into pupae when fed a diet deficient in proteins. IP3R proteins are ion channels that control the release of calcium ions from stores within the cells. Jayakumar et al. showed that food that is deficient in nutrients triggers some larval neurons to release a chemical called acetylcholine, which in turn activates receptors on certain other neurons that communicate using the signalling molecule glutamate. In normal insects, this causes the glutamate-producing neurons to release calcium ions through their IP3R channels. The calcium ions then activate a chain of events that ultimately causes other cells to produce a hormone called ecdysone, which drives the transformation from larva to pupa. In IP3R mutants, by contrast, the absence of calcium ion release keeps the insect in the larval stage.
This circuit helps to explain how some insects and other animals are able to survive being deprived of food for extended periods. Further work will be required to understand how a lack of protein in the diet changes the signalling properties of cells in various parts of the circuit.
https://doi.org/10.7554/eLife.17495.002Introduction
Animals frequently find themselves in situations of nutritional deprivation. To combat these lean periods, physiological mechanisms have evolved that are common to both vertebrates and invertebrates (Waterson and Horvath, 2015; Zhang et al., 2002). Such mechanisms require the animal to integrate sensory perception of nutrient deprivation with appropriate metabolic changes. The nervous system plays a central role in this process, and communication between multiple neuronal cell types can regulate the necessary metabolic and hormonal changes required for coordinating an organismal response (Chantranupong et al., 2015; Waterson and Horvath, 2015). The vertebrate hindbrain acts as a central regulator of energy balance. Nuclei of the solitary tract integrate energy status signals from relevant inputs such as blood-borne endocrine signals and synaptic signals from the gastrointestinal tract and peripheral neurons, to modulate appetite and feeding (Grill and Hayes, 2012). However, the specific identity and circuitry of neurons responsible for sensing and responding to nutritional cues is not completely understood. This is in part due to the complexity of the vertebrate brain, in which monitoring activity in specific neuronal subtypes is challenging. A less-complex nervous system, consisting of approximately 10,000 neurons (Scott et al., 2001), compared with 70 million neurons in the mouse brain (Economo et al., 2016), makes Drosophila larvae a powerful system to elucidate central brain circuitry underlying systemic responses to nutrient deprivation (Bjordal et al., 2014).
Intracellular signaling mechanisms shape neural responses across circuits and contribute greatly to systemic outcome. For example, ghrelin, a gut-derived orexigenic hormone, affects synaptic plasticity under conditions of nutrient deprivation through intracellular signaling involving calcium (Yang et al., 2011). Nonetheless, intracellular signaling pathways responsible for synaptic plasticity in circuits that regulate organismal responses to an altered nutrient status need further elucidation. Intracellular calcium signaling evolved in parallel with multi-cellularity (Cai, 2008), and may therefore function in coordinating systemic metabolic responses (Chantranupong et al., 2015) of metazoans. A key component of intracellular calcium signaling is the Inositol 1, 4, 5-trisphosphate receptor (IP3R). These are calcium channels that mediate intracellular calcium release from the endoplasmic reticulum (ER) in response to extracellular stimuli (Streb et al., 1983). In vertebrates, calcium release through IP3R2 and IP3R3 is required in various classes of non-excitable cells for metabolic control (Wang et al., 2012) and exocrine secretion of insulin or amylase from the pancreas (Berggren et al., 2004; Futatsugi et al., 2005). IP3R1 is expressed in different classes of neurons where it regulates processes ranging from synaptic plasticity (Nishiyama et al., 2000) to axonal guidance (Xiang et al., 2002). Due to the broad expression of most components of metazoan intracellular signaling, including the IP3R family, identifying cell-specific function in vivo can be challenging. Drosophila genetics provides the tools for such cell-specific analysis.
In Drosophila, IP3R is encoded by the single itpr gene (Hasan and Rosbash, 1992). IP3R mutants exhibit delayed moulting (Venkatesh and Hasan, 1997) recently attributed to release of the steroid hormone ecdysone from the prothoracic gland (Yamanaka et al., 2015). While null alleles are lethal as second instar larvae, heteroallelic hypomorphs exhibit developmental and metabolic phenotypes. These range from lethality across larval stages to hyperphagic adults with altered lipid metabolism. The focus of adult metabolic defects observed in itpr mutants appears to be the central nervous system (Subramanian et al., 2013a, 2013b). For a better understanding of neuronal IP3R function in the context of metabolic regulation, we chose to study the Drosophila larval to pupal transition. This transition requires systemic integration of the nutritional state of late-stage larvae with release of hormones that drive pupariation (Andersen et al., 2013). Here, we identify a neural circuit that allows Drosophila larvae to overcome chronic protein-deprivation and pupariate. We demonstrate that nutrient sensitive plasticity of this circuit requires intracellular calcium signaling in newly identified glutamatergic neurons of the ventral ganglion.
Results
Pupariation in a protein-deprived environment requires intracellular calcium signaling in neurons
To assess the role of IP3R in nutrient stress, itpr mutants (itprka1091/ug3) were transferred as early third-instar larvae from a normal diet (ND) to a protein-deprived diet (PDD) containing only sucrose (Figure 1A and Figure 1—figure supplement 1A and B). At 120 hr post transfer, wild-type larvae exhibited complete pupariation on either ND or PDD, whereas itpr mutant larvae exhibited a decrease in pupariation on ND which was worsened significantly on PDD (Figure 1A). Pupariation in wild-type larvae was delayed slightly when subjected to PDD, whereas itpr mutants, which barely pupate on PDD, were delayed considerably even on a normal diet (Figure 1B,C,D and E). Protein is the likely nutritional cue necessary for pupariation by itpr mutants, because the extent of pupariation on a lipid-deprived diet was significantly higher than on PDD and closer to pupariation on a normal diet (Figure 1—figure supplement 1C). Moreover, pupariation in itpr mutants was restored when the PDD was supplemented with amino acids and vitamins (Figure 1—figure supplement 1D). Interestingly, itpr mutant larvae feed in excess of controls (Figure 1—figure supplement 1E), but their body weights are similar to that of wild-type larvae at the time of transfer to the PDD, indicating that excess feeding may be an attempt to compensate for metabolic changes due to altered intracellular calcium signaling (Figure 1—figure supplement 1F). Pan-neuronal restoration of itpr function in the mutant by expressing wild-type itpr cDNA (itpr+) with elav-GAL4 rescued the pupariation deficit, whereas pan-neuronal knockdown of the IP3R mimicked the itpr mutant phenotype on PDD, while exhibiting complete pupariation on ND (Figure 1A,B,C,D and E). These data demonstrate that pupariation in a protein-deprived condition requires intracellular calcium signaling through the IP3R in neurons.
Figure 1 with 1 supplement see all

Pupariation in a protein-deprived environment requires intracellular calcium signaling in neurons.
(A) Representative images of larvae and pupae of indicated genotypes subjected to either protein-deprived diet (PDD) or normal diet (ND). Percentages refer to pupariation. B and D Percentage pupariation of indicated genotypes represented as mean ± SEM over hours after transfer to the indicated media at 80–88 hr after egg laying (AEL). Dotted lines indicate 50% viability. C and E Bars represent mean percentage pupariation at 120 hr (± SEM). Larvae were transferred to the indicated diet at 80–88 hr AEL. All pupariation experiments were performed with N ≥ 6 batches, with 25 larvae in each batch. Bars with the same alphabet represent statistically indistinguishable groups (one-way ANOVA with a post hoc Tukey’s test p<0.05).
Protein-deprived larvae require IP3R function in glutamatergic neurons for pupariation
To identify neuronal subsets that require itpr function for pupariation in protein-deprived conditions, IP3R knockdown was performed in various neuronal subsets. Among the tested subsets, the strongest pupariation deficit was observed upon IP3R knockdown in glutamatergic neurons (Figure 2—figure supplement 1A). Peptidergic neurons also showed a significant pupariation deficit, but this effect was not diet specific (Figure 2—figure supplement 1A and Table 2). Interestingly, when pan-neuronal knockdown of the IP3R was restricted to the brain lobes by introducing tsh-GAL80, pupariation was restored from less than 25% (Figure 1E) to more than 75% (Figure 2—figure supplement 1B). These data indicate that IP3R function is required to a greater extent in neurons located in the ventral ganglion for pupariation on PDD as compared with neurons located in the central brain lobes. We therefore used two independent GAL4 strains, vglutVGN6341 and vglutVGN9281(2) (subsequently referred to as VGN6341 and VGN9281-2), with contrasting expression patterns within the glutamatergic population of the ventral ganglion (Figure 2A), to delimit the subpopulation required for pupariation on PDD. The VGN6341 and VGN9281-2 strains differ in their expression patterns especially in the third thoracic and initial abdominal segments of the ventral ganglion (Figure 2A). IP3R knockdown with VGN6341 resulted in significantly reduced pupariation on PDD, whereas larvae with IP3R knockdown in VGN9281-2-expressing cells pupariated similar to control larvae (Figure 2B). Normal pupariation was observed when IP3R knockdown was restricted by introducing tsh-GAL80 in the background of VGN6341 (referred to as restricted VGN6341; Figure 2B). tsh-GAL80 restricted expression of VGN6341, to the central brain and a few neurons in the ventral ganglion. In a complementary experiment, pupariation in the itpr mutant was restored by expression of UAS-itpr+ in VGN6341 expressing neurons but not with the GAL80-restricted VGN6341 neurons (Figure 2C). Comparison of VGN9281-2 and VGN6341 expression with and without tsh-GAL80 pointed to a region between the third thoracic and fifth abdominal segments in the ventral ganglion, subsequently designated as the mid-ventral ganglion or mVG, where IP3R function is required for pupariation on PDD (Figure 2D). These VGN6341-expressing cells were confirmed as glutamatergic by co-immunostaining of VGN6341 driven GFP with DvGlut, an established marker of glutamatergic neurons (Daniels et al., 2004) (Figure 2E, Figure 2—figure supplement 1C). Although a role for peripheral glutamatergic neurons of the mVG remains possible, we focussed on the central ones as they were more easily and repeatedly identifiable.
Figure 2 with 1 supplement see all
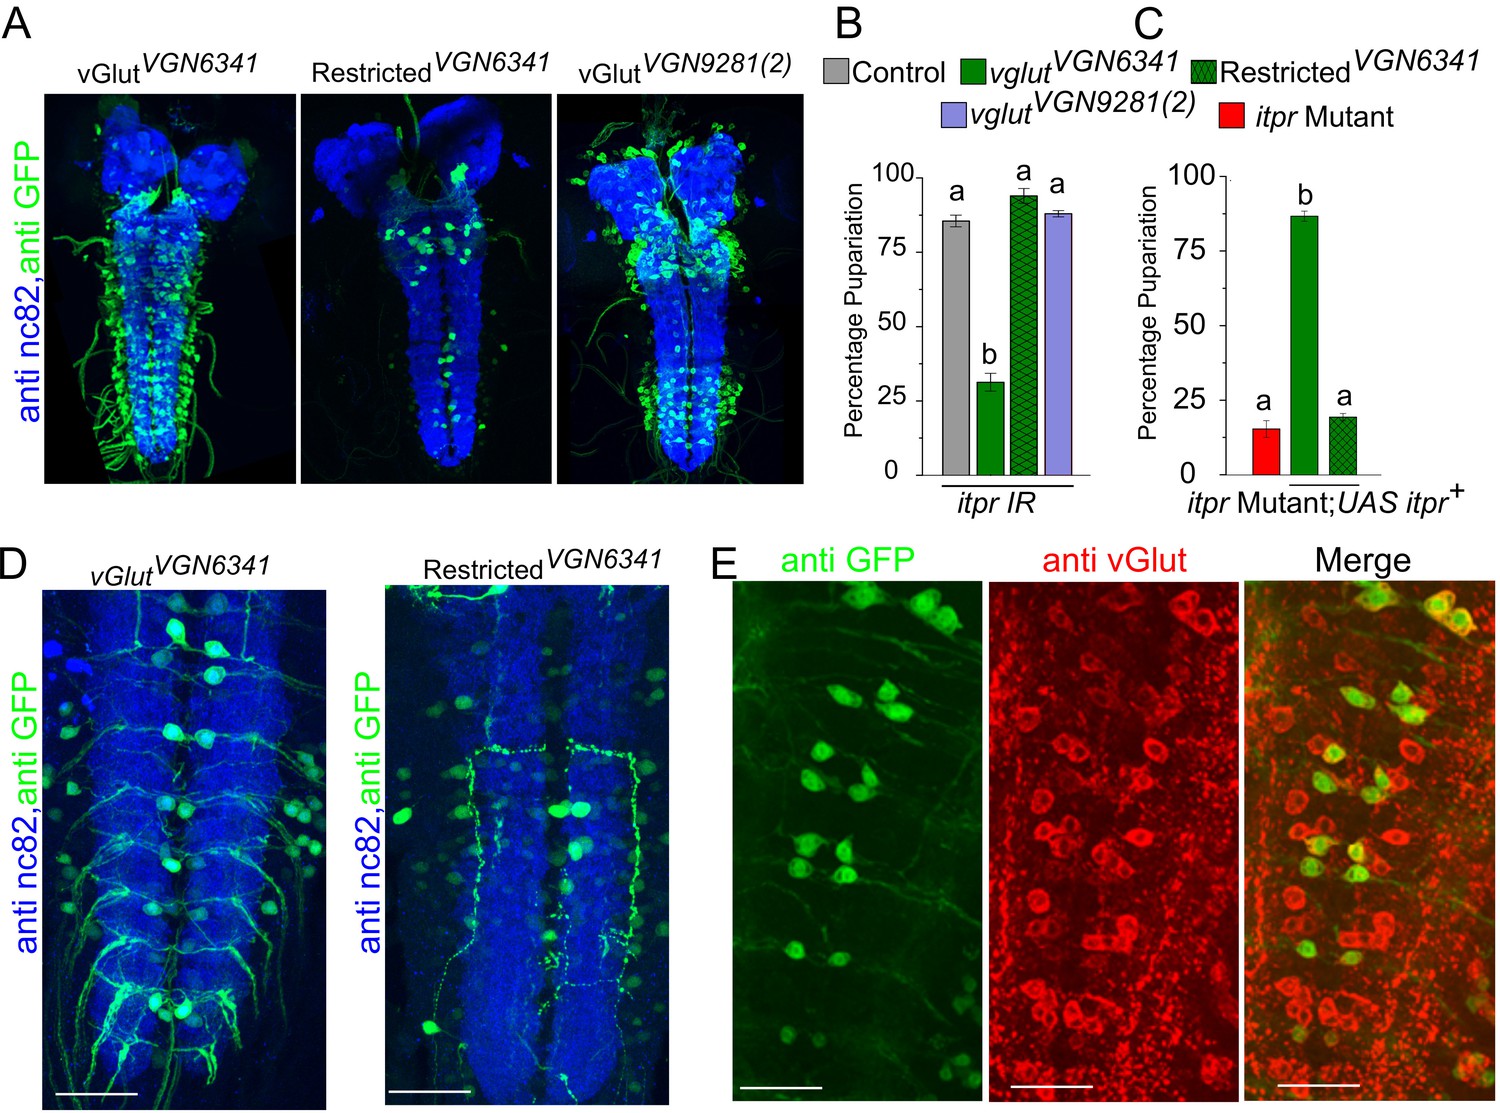
Knockdown of the IP3R in glutamatergic neurons prevents pupariation upon PDD.
(A) Expression patterns of GAL4 drivers used in (B) determined using UAS-eGFP and co-stained with anti-nc82. (B and C) Bars show mean percentage pupariation (± SEM) of the indicated genotypes on PDD. N ≥ 6 batches with 25 larvae each. (D) Images of selected substacks of the ventral ganglion of VGN6341-GAL4, with and without tsh-GAL80, expressing UAS-eGFP, double labelled with anti-nc82. (E) Selected substacks showing overlap of all dvGlut-positive cells and GFP-positive cells marked by VGN6341-GAL4 in the ventral ganglion. Scale bars indicate 50 µm. Bars with the same alphabet represent statistically indistinguishable groups (one-way ANOVA with a post hoc Tukey’s test p<0.05).
Table 1
Validated Hits from the GPCR RNAi Screen. Percentage pupariation (rounded to the nearest integer) upon GPCR knockdown performed with VGN6341-GAL4 as well as their rescue by overexpression of dSTIM and constitutively active form of Gq on PDD.
| Sl. no. | RNAi line (CG) | Receptor category | Receptor | Larvae to pupae with RNAi (%) | Larvae to pupae rescue with UAS-dSTIM (%) | Larvae to pupae rescue with UAS-AcGq (%) |
|---|---|---|---|---|---|---|
| 1 | 16785 | Frizzled | Frizzled 3 | 0 | 80 | 44 |
| 2 | 8784 | NPD | Pyrokinin 2 receptor 1 | 16 | 90 | 84 |
| 3 | 7395 | NPD | sNPF receptor | 16 | 84 | 80 |
| 4 | 8795 | NPD | Pyrokinin 2 receptor 2 | 20 | 72 | 56 |
| 5 | 2114 | NPD | Fmrf receptor | 20 | 88 | 44 |
| 6 | 14593 | NPD | CCHamide-2 receptor | 20 | 68 | 56 |
| 7 | 4356 | Acetylcholine | Muscarinic acetylcholine receptor at 60C | 20 | 88 | 80 |
| 8 | 6515 | NPD | Tachykinin-like receptor at 86C | 20 | 68 | 56 |
| 9 | 16766 | Monoamines | Tyramine receptor II | 24 | 92 | 76 |
| 10 | 15274 (Earlier 33310) | GABA, Glutamate | Metabotropic GABA-B receptor subtype 1 | 28 | 76 | 72 |
| 11 | 10823 | NPD | SIFa receptor | 28 | 78 | 88 |
| 12 | 10001 | NPD | Allatostatin receptor | 44 | 92 | 76 |
Table 2
Percentage pupariation on ND. Percentage pupariation (rounded to the nearest integer) on ND of indicated genotypes.
| Sl. no. | Genotype | Percentage pupariation on ND |
|---|---|---|
| 1 | OK371-GAL4>itpr IR | 97 |
| 2 | VGN6341-GAL4>itpr IR | 95 |
| 3 | ChAT-GAL4>itpr IR | 99 |
| 4 | Dimm-GAL4>itpr IR | 63 |
| 5 | Restricted dimm-GAL4>itpr IR | 86 |
| 6 | Ppk-GAL4>itpr IR | 100 |
| 7 | Restricted VGN6341-GAL4>itpr IR | 97 |
| 8 | VGN6341-GAL4>mAChR IR | 99 |
| 9 | Restricted VGN6341-GAL4>mAChR IR | 100 |
| 10 | Dimm-GAL4>mAChR IR | 97 |
| 11 | Dimm-GAL4>mGluRA IR | 83 |
Glutamatergic neurons of the mVG respond to cholinergic stimuli in a diet-dependent manner
To identify GPCRs that function in glutamatergic neurons and stimulate the IP3R under protein-deficient conditions, a genetic RNAi (IR) screen was performed with VGN6341 and all publicly available RNAi strains for GPCRs in the Drosophila genome (Figure 3—figure supplement 1, Supplementary file 3). Twelve GPCRs identified in the screen (Table 1) were validated as functioning upstream of the IP3R, by rescue of pupariation with two components of the IP3 signaling pathway, a constitutively active Gαq transgene AcGq and dSTIM (Table 1). Among the identified GPCRs, we tested further the role of the muscarinic Acetylcholine Receptor (Flybase mAChR-A, mAChR-60C, CG4356 and henceforth, mAChR) in pupariation. The mAChR activates Gq/PLCβ signaling leading to IP3 production and IP3-mediated Ca2+ release in Drosophila cells (Millar et al., 1995; Srikanth et al., 2006). Knockdown of the mAChR in glutamatergic neurons of the ventral ganglion significantly reduced pupariation on protein-deficient media and expression of the mAChR+ transgene in the same neuronal subset in the itpr mutant rescued pupariation (Figure 3A). These data support mAChR stimulation followed by Ca2+ release through the IP3R as a mechanism required by glutamatergic neurons of the mVG for pupariation under conditions of nutrient stress.
Figure 3 with 3 supplements see all
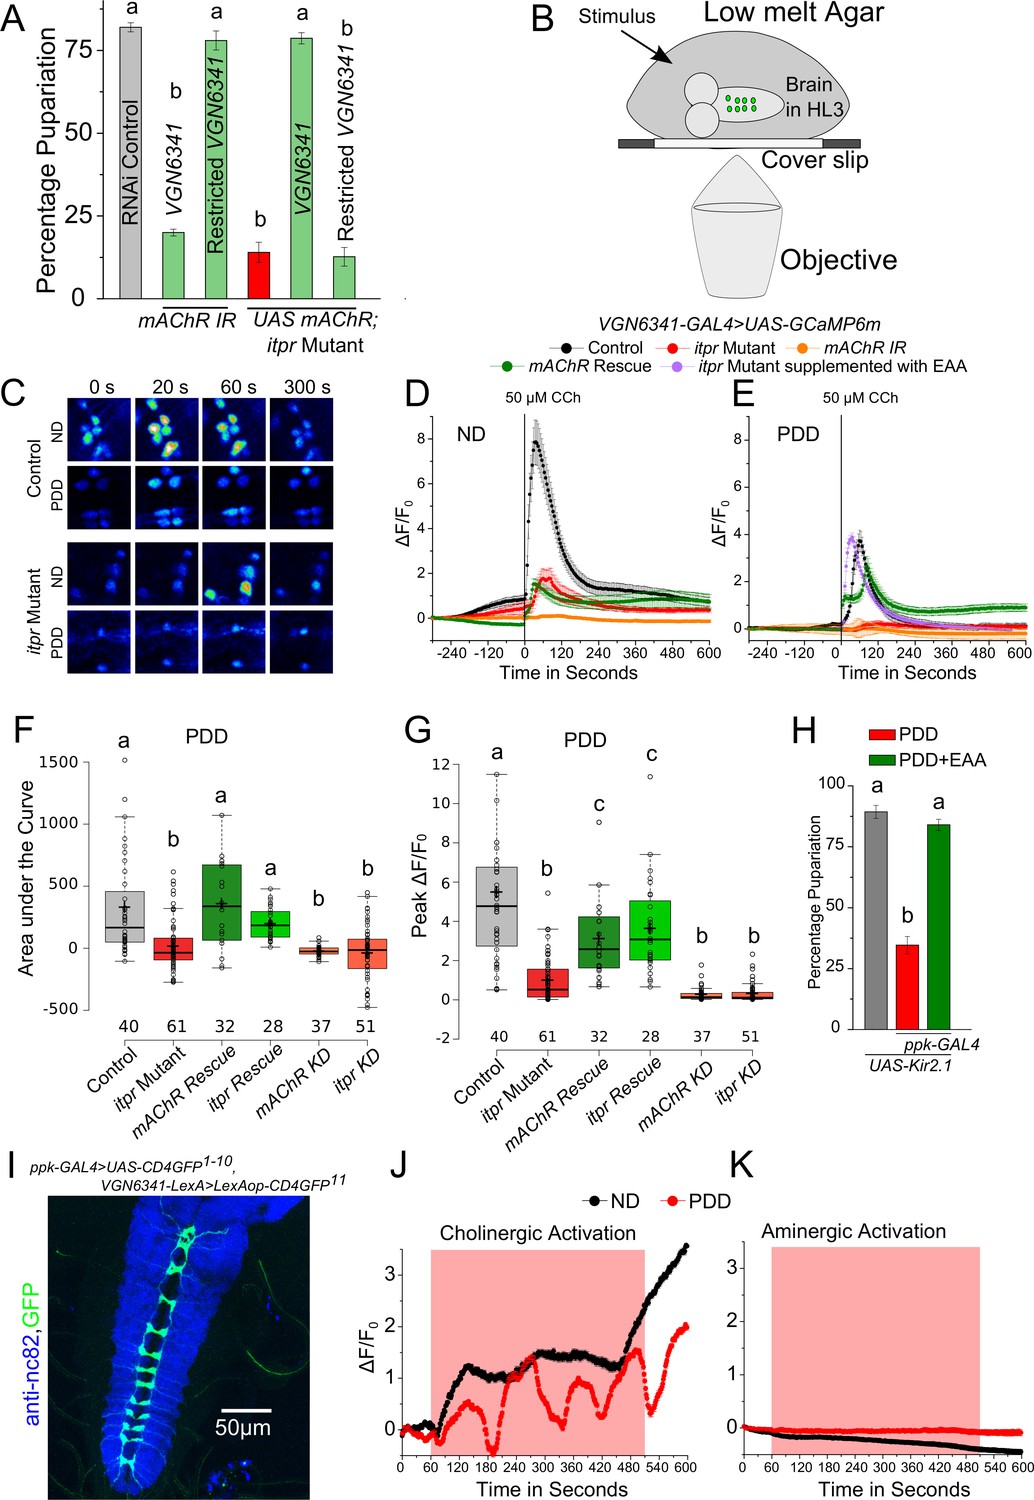
Cholinergic inputs convey nutrient-stress signals to glutamatergic neurons of the ventral ganglion.
(A) Bars indicate mean percentage pupariation (± SEM) of indicated genotypes subjected to PDD. N ≥ 6 batches with 25 larvae each. (B) Schematic illustrating the setup used to image neurons of interest from the larval ventral ganglion. (C) Representative images showing calcium activity measured by GCaMP6m in the mVG neurons of indicated genotypes at indicated time points from a time series. (D and E) Traces represent time series of the mean normalized GCaMP6m responses (± SEM) from the mVG neurons of the indicated genotypes upon stimulation with carbamylcholine (CCh). (F) and (G) Box plots represent Area under the Curve (F) and Peak change in fluorescence (G) quantified from (E). In box plots, center lines show the medians; box limits indicate the 25th and 75th percentiles, whiskers extend 1.5 times the interquartile range from the 25th and 75th percentiles, open circles represent each data point and numbers below represent total number of cells measured. (H) Bars indicate mean percentage pupariation (± SEM) of the indicated genotypes on PDD. N ≥ 6 batches with 25 larvae each. (I) Image showing GRASP between pickpocket-GAL4 and VGN6341-LexA. J and K Traces represent time series of mean normalized GCaMP6m responses (± SEM) from mVG glutamatergic cells upon optogenetic activation of either cholinergic (J) or aminergic (K) domains. Grey box indicates duration of optogenetic activation. Bars with the same alphabet represent statistically indistinguishable groups (one-way ANOVA with a post hoc Tukey’s test p<0.05).
Next we assessed the response of VGN6341-expressing neurons in the mVG to carbamylcholine (CCh), an mAChR agonist (Offermanns et al., 1994). We measured CCh responses in ex vivo preparations of third-instar larval brains (Figure 3B) that were subjected to either ND or PDD for 18 hr, by VGN6341-driven expression of the genetically encoded calcium indicator GCaMP6m. Upon stimulation with CCh, calcium transients were observed in multiple VGN6341 marked cells from larvae fed on a normal diet (Figure 3C,D and Figure 3—figure supplement 2C). The specificity of this response was ascertained by pre-incubation with atropine, an established and specific antagonist of the mAChR (Fryer and Maclagan, 1984), which abolished the response (Figure 3—figure supplement 2A and B). Not surprisingly, the response to CCh was significantly attenuated in itpr mutants on a normal diet (Figure 3C,D and Figure 3—figure supplement 2C). On PDD, the response to CCh was reduced in neurons from control larvae, and it was nearly absent in neurons from itpr mutants (Figure 3C,E,F and G; Videos 1 and 2). To assess whether there was a temporal component to these responses, we measured responses at either 2 hr or 18 hr on NDD and PDD. In control larvae, the CCh response of glutamatergic neurons reduced significantly from 2 hr to 18 hr on PDD (Figure 3—figure supplement 2E). The strongly attenuated CCh response observed in itpr mutants at 18 hr on PDD was not evident at 2 hr on PDD (Figure 3—figure supplement 2E). These data indicate that a physiological change in the mVG glutamatergic neurons happens on PDD over time. The change in response to CCh over time was not evident on ND in either control or itpr mutant neurons (Figure 3—figure supplement 2D). Importantly, the response of glutamatergic neurons in itpr mutants could be rescued by supplementing PDD with essential amino acids (EAA) (Figure 3E). Thus, loss of dietary EAA appears to be a cause for abrogation of the CCh response in itpr mutant glutamatergic neurons after 18 hr on PDD. The response to CCh was also absent in glutamatergic neurons of the mVG with knockdown of either mAChR or itpr on ND (Figure 3D and Figure 3—figure supplement 2C) and PDD (Figure 3E,F,G). The absence of the CCh response on ND in itpr and mAChR knockdowns, even though validating the original response to be through the IP3R, did not correlate with a defect in pupariation (Table 2), suggesting that mAChR and IP3R function in mVG neurons is critically required on PDD but not relevant on ND (see discussion). The response to CCh on PDD was rescued to a significant extent by over-expression of either mAChR+ or itpr+ in VGN6341-marked neurons of itpr mutants (Figure 3E,F and G), and correlated with rescue of pupariation observed in these genotypes (Figures 2C and 3A). These data suggest that cholinergic inputs convey protein-starvation to VGN6341-marked glutamatergic neurons possibly through acetylcholine, that activate mAChR and the IP3R for pupariation.
Video 1
Response to CCh in VGN 6341 neurons of the mVG from control larvae on PDD.
The green flash indicates point of point of addition of CCh.
Video 2
Response to CCh in VGN 6341 neurons of the mVG from itpr mutant larvae on PDD.
Green flash indicates point of addition of CCh.
To test if cholinergic stimuli signal protein-deprivation, recycling of synaptic vesicles was blocked in cholinergic neurons by expression of the dynamin mutant transgene Shibirets (UAS-Shits1)with the cholinergic driver ChaT-GAL4. Pupariation was reduced significantly when cholinergic transmission was blocked, by transferring larvae (80–88 hr AEL) to the restrictive temperature (29°C) for 48 hr (till 128–136 hr AEL), concurrent with protein-deprivation (Figure 3—figure supplement 2G). The same experiment performed either with larvae on ND or with larvae on PDD but at the permissive temperature (22°C) supported pupariation (Figure 3—figure supplement 2F and H). When Shits expression was driven by a combination of ChaT-GAL4 and ppk-GAL80 (blocking GAL4 activity in multidendritic sensory neurons), normal pupariation was observed on the protein-deficient diet (Figure 3—figure supplement 2G and H), suggesting the requirement of neurons expressing the Pickpocket (ppk) channel (Adams et al., 1998) in sensing protein-deficient conditions prior to pupariation. This idea was tested directly by expression of Shits or a hyperpolarising potassium channel Kir2.1 in neurons expressing Pickpocket (ppk-GAL4), both of which caused a severe pupariation deficit (Figure 3H, Figure 3—figure supplement 2G). Pupariation was restored in these animals by supplementing the protein-deficient diet with a mixture of EAA (Figure 3H). Activity in ppk-GAL4-marked neurons is thus required for pupariation on PDD but not on ND. In contrast, pupariation was unaffected when activity was inhibited in cholinergic neurons marked by 19-12-GAL4 expression, which does not overlap with ppk-GAL4 (Figure 3—figure supplement 2G and H; Yan et al., 2013).
The presence of direct cholinergic inputs to VGN6341-marked glutamatergic neurons was tested next by performing an experiment for genetic reconstitution across synaptic partners (GRASP) (Feinberg et al., 2008). GRASP signals between VGN6341- and ppk-marked neurons were detected in the neuropil of the ventral ganglion (Figure 3I), which is a synaptically dense region along the midline. GRASP constructs expressing the split GFP components individually with either ppk-GAL4 or VGN6341-LexA had no GFP expression (Figure 3—figure supplement 3A and B). To test if the observed connections are functional, cholinergic neurons were marked by ChaT-LexA and optogenetically activated with a red-shifted channelrhodopsin variant, LexAop-CsChrimson. Calcium transients were observed in glutamatergic cells of the mVG simultaneously with optogenetic activation of cholinergic neurons on either ND or PDD (Figure 3J; Video 3). On PDD, interestingly, the transients appeared to oscillate. As a control, we tested optogenetic activation of aminergic neurons (marked by HL9-LexA). This did not elicit a response in glutamatergic neurons of the mVG (Figure 3K). To confirm that activation of VGN6341 neurons was through inputs from ppk neurons, we performed an optogenetic activation experiment with TrpA1-QF which marks class IV multidendritic neurons (Petersen and Stowers, 2011; subsequently referred to as ppk-QF). A robust activation of VGN6341-marked cells expressing the red shifted calcium indicator jRCaMP1b was observed upon optogenetic activation of ppk neurons expressing QUAS-ChR2 (Figure 3—figure supplement 3). Knockdown of the IP3R in cholinergic neurons did not change pupariation on PDD (Figure 2—figure supplement 1A), and restoring IP3R function in cholinergic neurons failed to rescue the itpr mutant (Figure 3—figure supplement 2I). As normal pupariation was observed in animals with cholinergic knockdown of the IP3R on PDD, we did not test cholinergic stimulation of glutamatergic neurons in IP3R mutants. Instead, to understand the basis of the pupariation defect on PDD, we investigated next the postsynaptic partners of glutamatergic neurons marked by VGN6341-GAL4.
Video 3
Calcium transients observed in glutamatergic neurons of the mVG as a result of optogenetic activation of cholinergic neurons.
https://doi.org/10.7554/eLife.17495.015Glutamatergic neurons of the mVG convey nutrient stress to medial neurosecretory cells in the brain
Neuropeptides are known to modulate organismal responses to changes in diet in vertebrates as well as insects (Morton et al., 2014; Nässel and Winther, 2010). To test, whether the mVG interneurons synapse on to peptidergic cells, we imaged the two domains at high resolution. Anterior glutamatergic projections arising from near the central mVG interneurons (Figure 4A and B, arrow heads) reach posterior projections of the mNSCs (Figure 4A and B, asterisks). These anterior glutamatergic projections appear to originate from the central mVG neurons, extend laterally toward the midline for a short distance, and then project to the anterior (Figure 4D and video 4). They do not arise from peripheral mVG neurons that appear to project solely to the midline neuropil of the VG. Similar connectivity was observed upon marking the mVG glutamatergic neurons and specifically the mNSCs (Figure 4C).
Figure 4
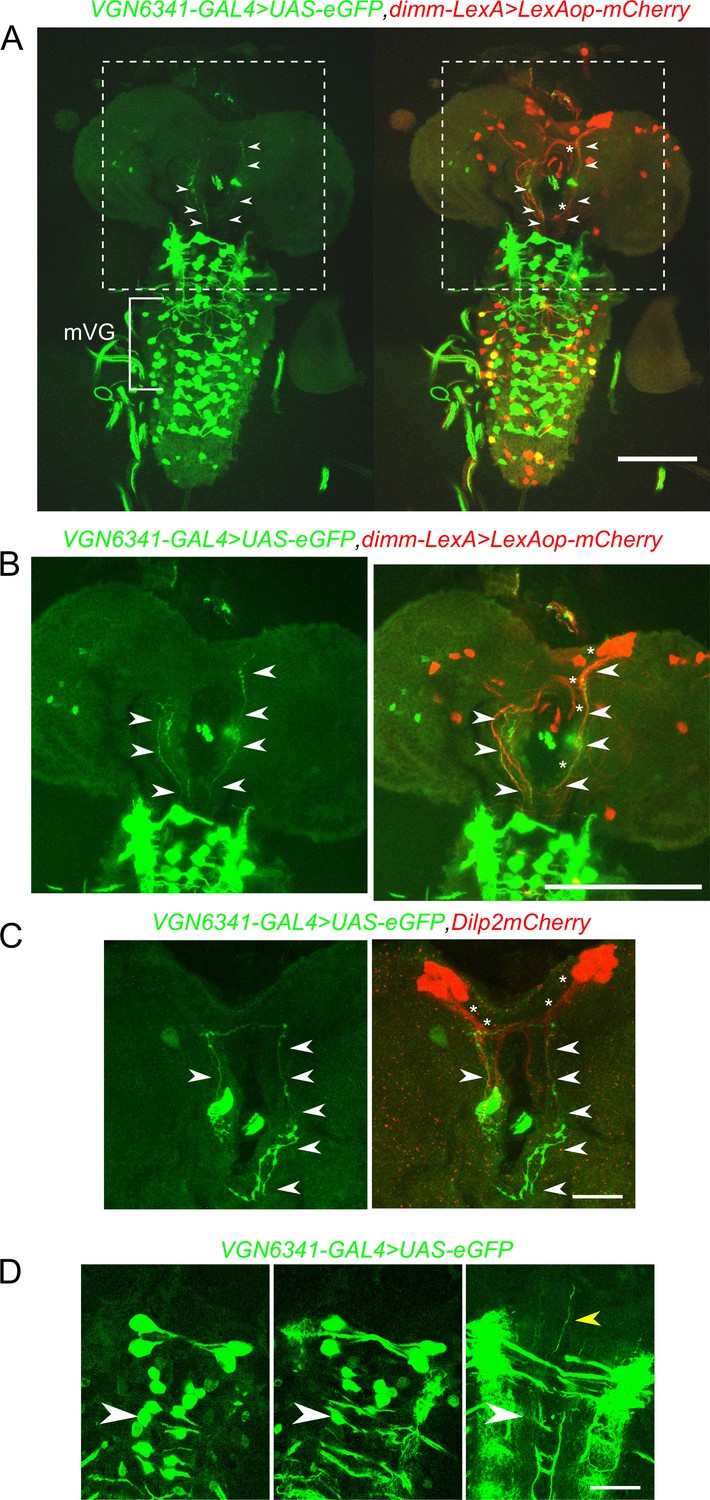
Glutamatergic neurons in the larval ventral ganglion project to peptidergic neurons in the mNSC.
A and B Selected confocal stacks showing the neurites marked by VGN6341-GAL4 driven UAS-eGFP (green) and their merged patterns with dimm-LexA-driven expression of LexAop-mCherry (red). The boxed area in A is shown in B as a high-magnification image. Arrow heads indicate VGN6341-GAL4 expressing neurites projecting toward the mNSCs. Asterisks mark dimm-LexA labelled projections. (C) Neurites marked by VGN6341-GAL4-driven eGFP (arrow heads) overlap with projections of the mNSCs marked by Dilp2mCherry (asterisks). (D) Selected high-magnification confocal images of VGN6341-GAL4 driven UAS-eGFP with an anterior projecting neurite from a midline mVG neuron. The white arrow head marks the same co-ordinates in all three images. The yellow arrow head shows the ascending projections. Scale bars represent 50 µm in A and B and 10 µm in C and D.
Video 4
Projections from VGN 6341-marked glutamatergic neurons to the mNSCs.
https://doi.org/10.7554/eLife.17495.017Additionally, a GRASP experiment was performed between VGN6341-LexA-marked neurons and peptidergic neurons marked by dimm-GAL4 (Figure 5A). The ensuing GRASP presented a complex pattern comprising medial Neurosecretory Cells (mNSCs) in the central brain, multiple projections between the mVGs and the mNSCs, and a few cell bodies and projections in the periphery of the ventral ganglion (Figure 5A and Figure 5—figure supplement 1A). Controls with either GAL4 or LexA driving individual GRASP constructs elicited no GFP immunostaining (Figure 5—figure supplement 2A and B). To test the functional significance of this apparent connectivity between peptidergic and glutamatergic cells, we measured pupariation on PDD after knockdown of various glutamatergic receptors in dimm-positive neurons. Amongst the five receptors tested, pupariation was reduced significantly in animals with knockdown of the metabotropic glutamate receptor A (mGluRA; Figure 5B and Figure 5—figure supplement 1B). Knockdown of mGluRA with two independent RNAi strains showed differing but significant deficits in pupariation (10% and 40%; Figure 5B, Figure 5—figure supplement 1B). We attribute this difference to the strength of the RNAi knockdown in peptidergic cells from the two different RNAi strains. Knockdown of other glutamate receptor classes resulted in normal pupariation (Figure 5—figure supplement 1B). Restriction of mGluRA knockdown in peptidergic neurons of the central brain and in Dilp2-positive mNSCs (Dilp2-GAL4) also resulted in pupariation deficits on PDD (Figure 5B). In contrast, normal pupariation was observed by restricting knockdown of IP3R to VGN6341-marked glutamatergic neurons of the central brain (Figure 2B). Taken together these data support the innervation of central brain peptidergic neurons, specifically the mNSCs, by glutamatergic neurons of the ventral ganglion. This innervation appears relevant for pupariation on PDD.
Figure 5 with 2 supplements see all
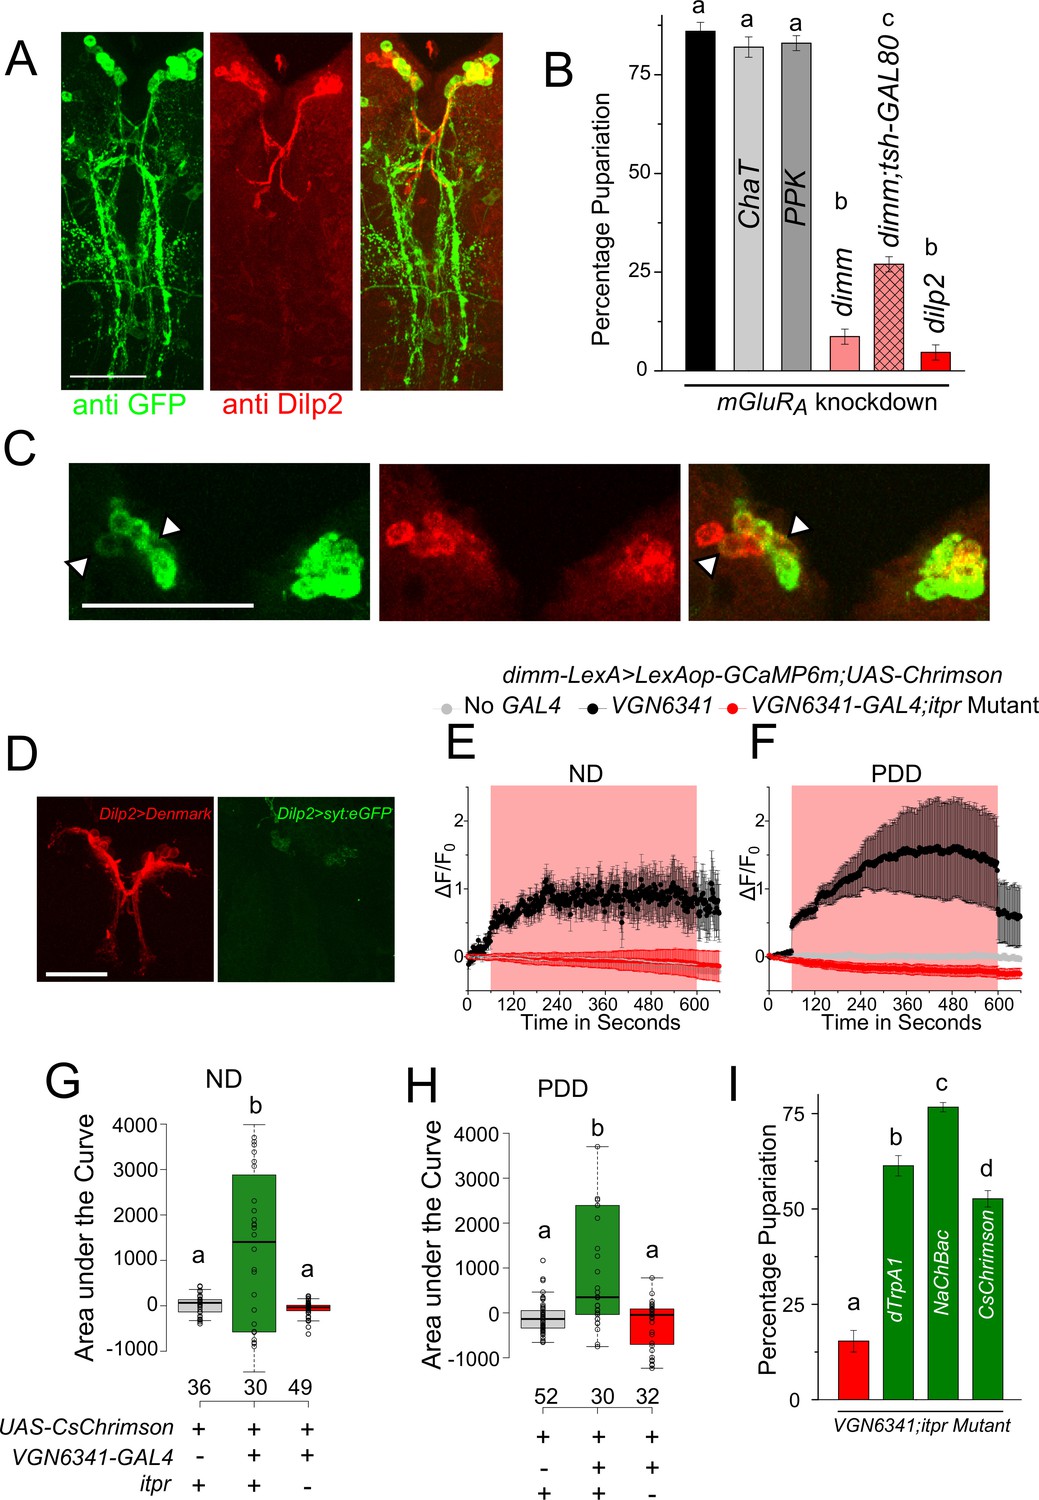
Glutamatergic neurons in the larval ventral ganglion convey signals to peptidergic neurons of the mNSC.
(A) High-magnification images of the mNSC area in a GRASP experiment between the peptidergic and the glutamatergic domains stained for GFP and Dilp2. (B) Bars represent mean percentage pupariation (± SEM) of larvae subjected to mGluRA knockdown using indicated GAL4 drivers on PDD. N ≥ 6 batches with 25 larvae each. (C) A z-project of selected substacks at higher magnification showing the mNSC region from (A). Scale bar indicates 10 µm. Arrow heads point to weakly stained cells. (D) Confocal images showing the mNSC region of the Dilp2-GAL4 simultaneously driving an axonal and dendritic marker (Dilp2>UAS-DenMark, UAS-SyteGFP). E and F Traces represent time series of mean normalized GCaMP responses (± SEM) from peptidergic cells in the mNSC of the indicated genotypes on ND (E) or PDD (F). G and H Quantification of area under the curve from (E) and (F). Box plots and symbols are as described for Figure 3F. (I) Bars represent mean percentage pupariation (± SEM) of indicated genotypes subjected to PDD. N ≥ 6 batches with 25 larvae each. Scale bars indicate 50µm unless specified otherwise Bars with the same alphabet represent statistically indistinguishable groups (one-way ANOVA with a post hoc Tukey’s test p<0.05).
mNSCs in Drosophila central brain secrete multiple neuropeptides, including insulin-like peptides (Dilps), which regulate the response of an organism to dietary changes (Dus et al., 2015). Upon co-immunostaining with an antibody against Dilp2 (Géminard et al., 2009), five of the seven Dilp2-positive cells in the mNSCs were 'GRASPed' by VGN6341 (Figure 5C) as suggested earlier by immunostaining of mVG cells and the mNSCs (Figure 4C). The presence of dendritic fields close to the mNSC soma has been described earlier (Nässel et al., 2008; Vallejo et al., 2015) and was confirmed by simultaneous expression of an axonal and a dendritic marker with Dilp2-GAL4 (Figure 5D). Thus, axonal projections from VGN6341-marked glutamatergic neurons probably stimulate a subset of mNSCs. The presence of functional synaptic connections between VGN6341-GAL4 and mNSCs was tested next. CsChrimson-expressing VGN6341 cells were optogenetically activated in ex vivo preparations in which GCaMP6m was expressed in peptidergic cells, including the mNSCs, marked by dimm-LexA::p65. Upon optogenetic stimulation of CsChrimson in VGN6341 marked neurons calcium transients were observed in the mNSCs of larvae from both normal and protein-deficient diets (Figure 5E,F,G and H; Video 5). Similar activation of the mNSCs was obtained when VGN6341 marked neurons were thermogenically activated with dTrpA1, a temperature-activated cation channel (Figure 5—figure supplement 1C and E). Activation of VGN6341 marked neurons in the itpr mutant, however, did not evoke transients either on ND (Figure 5E and G) or on PDD (Figure 5F and H). The underlying basis for this defect appears to be an inability of the VGN6341-marked neurons to stimulate the mNSCs in itpr mutants, because their optogenetic self-activation evoked robust calcium transients in itpr mutants on ND and PDD (Figure 5—figure supplement F and G). Activation of the Restricted VGN6341-GAL4, where GAL4 expression is absent from the mVG region, did not elicit a signal from the mNSCs (Figure 5—figure supplement 2C).
Video 5
Calcium transients observed in peptidergic neurons in the mNSCs of control larvae on PDD upon optogenetic activation of VGN 6341 neurons.
https://doi.org/10.7554/eLife.17495.021Next, we tested if artificial activation of glutamatergic neurons marked by VGN6341 compensated for reduced itpr function in the context of pupariation on PDD. NaChBac is a bacterial sodium channel that increases excitability of Drosophila neurons (Nitabach et al., 2006). Expression of either dTrpA1, NaChBac, or CsChrimson in glutamatergic neurons marked by VGN6341 indeed rescued the pupariation defect of the itpr mutant on PDD (Figure 5I). For rescue experiments with either dTrpA1 or CsChrimson, activation was for 48 hr and this period was concurrent with transfer to PDD from 80–88 hr to 128–136 hr AEL. Taken together, these results suggest that glutamatergic interneurons in the larval mVG receive cholinergic signals indicating absence of dietary amino acids, process these signals in an IP3R-dependent manner, and convey this information to peptidergic cells in the mNSCs for mounting a suitable physiological response to enable pupariation.
Glutamatergic neurons of the mVG regulate peptide release from mNSC
The effect of CCh-induced calcium transients on neuropeptide release in the mNSCs was tested next. For this purpose, an ex vivo preparation was taken in which cells marked by dimm-LexA::p65 expressed the rat atrial natriuretic peptide fused with GFP (ANF::GFP) under LexAop control. Peptide release in Drosophila neurons has been studied previously by measuring release of ANF::GFP (Shakiryanova et al., 2006). Upon stimulation with 50 µM CCh, a decay in GFP fluorescence was observed in the mNSCs (Figure 6A; Video 6). Application of saline did not show a change in fluorescence (Figure 6A). The extent of release observed was higher in brains from larvae on PDD as compared to larvae on ND (Figure 6A). Release of ANF::GFP was significantly attenuated in mNSCs of the itpr mutant and importantly, this could be rescued by expressing mAChR+ in glutamatergic neurons marked by VGN6341 (Figure 6B,C and F). Moreover, peptide release from the mNSCs was reduced significantly upon knockdown of mAChR in VGN6341-marked glutamatergic neurons and not by direct knockdown of mAChR in peptidergic neurons with dimm-GAL4 (Figure 6G). Thus, cholinergic stimulation of glutamatergic neurons in the mVG appears to regulate peptide release from the mNSCs by activating mGluRA (Figure 6G). Further support for the ability of glutamatergic neurons to stimulate peptidergic release from the mNSCs comes from optogenetic stimulation of VGN6341-marked glutamatergic neurons (Figure 6D). Enhanced release of ANF::GFP was observed during the period of optogenetic stimulation (Figure 6H). Conversely, acute optogenetic inhibition of VGN6341-marked glutamatergic neurons using halorhodopsin, a light-activated chloride pump known to hyperpolarize neurons (Berni et al., 2012; Inada et al., 2011), during CCh stimulation inhibited peptide release from mNSCs (Figure 6E and I).
Figure 6
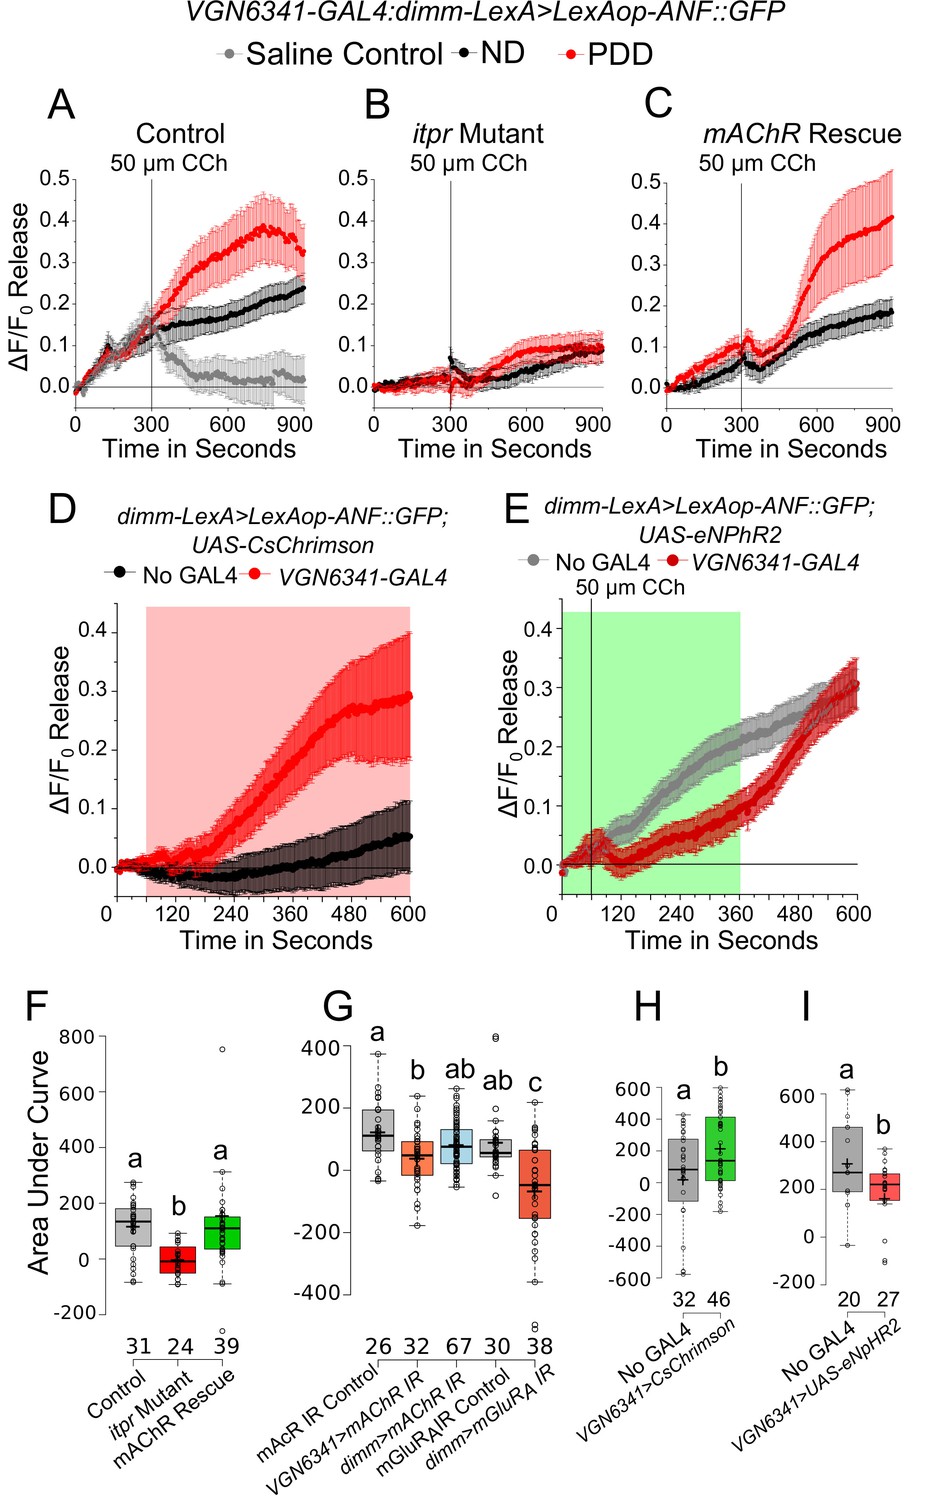
mAChR stimulation in glutamatergic neurons modulates enhanced peptide release from the mNSCs upon protein-deprivation.
(A–C) Traces represent a time series of mean normalized peptide release (ANF::GFP; ± SEM) from mNSCs of the indicated genotypes upon Carbachol (CCh) stimulation. D and E Traces represent a time series of mean normalized peptide release (ANF::GFP; ± SEM) on PDD from the mNSCs upon optogenetic activation of VGN6341-GAL4 (E) and using CCh under acute inhibition from the VGN6341-GAL4 (F). Red and green boxes indicate duration of activation and inhibition, respectively. (F–I) Box plots of CCh stimulated peptide release (ANF::GFP) quantified by area under the curve from the mNSCs of the indicated genotypes on PDD. Box plots and symbols are as described for Figure 3F. Bars with the same alphabet represent statistically indistinguishable groups (one-way ANOVA with a post hoc Tukey’s test p<0.05).
Video 6
Peptide release from mNSC of control larvae on PDD as observed by the decrease in ANF::GFP intensity upon addition of CCh.
Green flash indicates point of addition of CCh.
Although somatic peptide release is known (De-Miguel and Nicholls, 2015; Trueta and De-Miguel, 2012), we also tested if peptide release was affected more specifically in varicosities of the mNSCs that project to the ring gland. In the itpr mutant, ANF::GFP release was significantly reduced upon stimulation with 50 µm carbachol (Figure 7A,C and E). The extent of release could be rescued by expression of mAChR+ in glutamatergic neurons marked by VGN6341 (Figure 7D and E). Similar results were observed when expression of ANF::GFP was restricted to a subset of mNSCs marked by dilp2-GAL4 (Figure 7F–H).
Figure 7
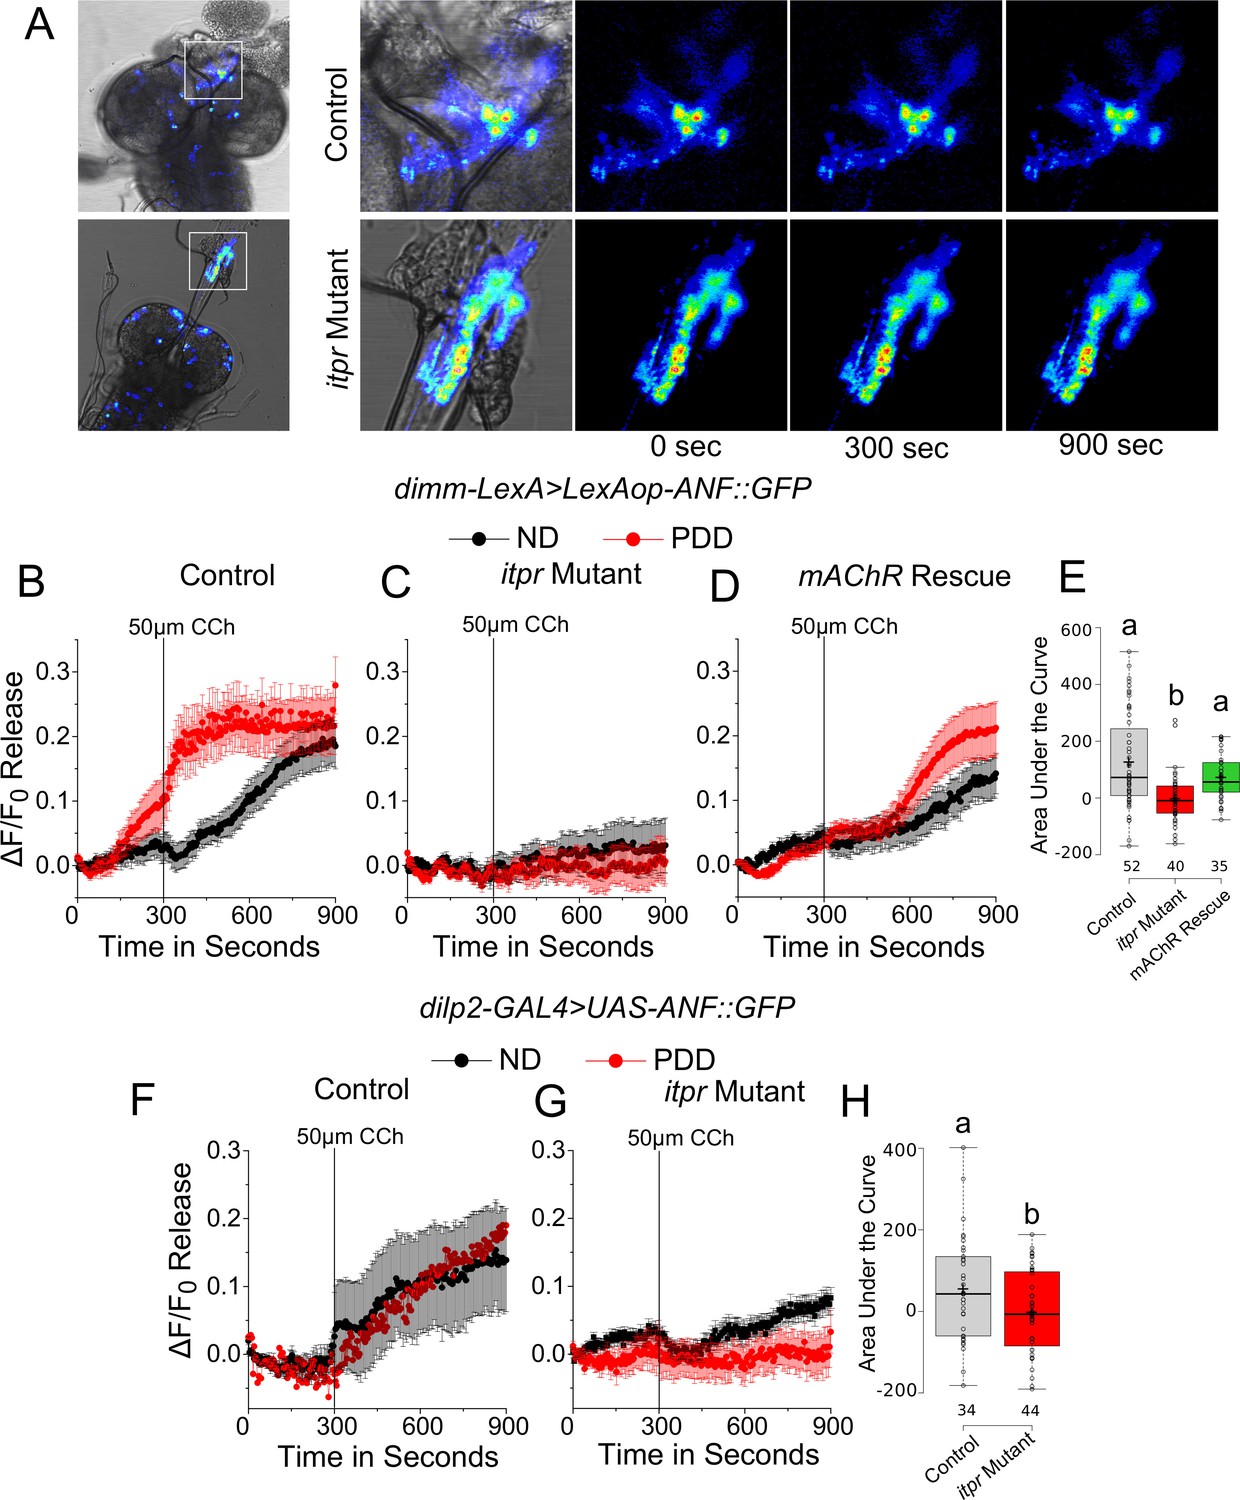
mAChR stimulation of glutamatergic neurons modulates peptide release from varicosities at the ring gland upon protein-deprivation.
(A) Time series of ANF::GFP release from varicosities in the ring gland of the indicated genotypes at the indicated time intervals, after stimulation by Carbachol (CCh). (B–D) Traces represent a time series of mean normalized peptide ( ± SEM) release from varicosities at the ring glands of the indicated genotypes after Carbachol (CCh) stimulation. (E) Box plots representing CCh-stimulated peptide release with ANF::GFP quantified by area under the curve of the indicated genotypes on PDD from (B–D). Box plots and symbols are as described for Figure 3F. F and G Traces represent a time series of mean normalized peptide release (ANF::GFP; ± SEM) from varicosities at the ring glands of indicated genotypes upon Carbachol (CCh) stimulation. (H) Box plots representing CCh-stimulated peptide release with ANF::GFP quantified by area under the curve of the indicated genotypes on PDD from (F and G.). Box plots and symbols are as described for Figure 3F. Bars with the same alphabet represent statistically indistinguishable groups (one-way ANOVA with a post hoc Tukey’s test p<0.05).
Dilp2 release on PDD is regulated by glutamatergic neurons in the mVG
Among the peptides released from the mNSCs, Dilp2 has been implicated in the response to protein deficiency (Géminard et al., 2009; Sano et al., 2015). Therefore, we measured Dilp2 levels in the mNSCs of larvae subjected to either normal or protein-deficient diets before and after subjecting them to CCh stimulation for 30 min. Dilp2 levels were assessed by immunohistochemistry using a previously validated antibody (Géminard et al., 2009). Significant release of Dilp2 was observed post-CCh stimulation, as interpreted from the reduced staining observed in wild-type mNSCs of larvae on ND and PDD (Figure 6A and B). In the itpr mutant, however, CCh-stimulated Dilp2 release was significantly lower, irrespective of the diets (Figure 8A and B). CCh stimulation of brains with itpr knockdown in neurons marked by VGN6341 also induced weaker release of Dilp2 (Figure 8C). Taking these observations forward, when Dilp2+was over-expressed using Dilp2-GAL4, or when Dilp2 positive neurons were maintained in an excitable state by expression of NaChBac, a partial rescue of pupariation in the itpr mutant was observed on PDD (Figure 8D). Taken together, these results suggest that pupariation on a protein-deficient diet requires mVG-mediated neuropeptide release from the mNSCs. Alternately, or in parallel, pupariation on PDD might require up-regulation of Dilp2 synthesis in the mNSCs, triggered by mGluRA signaling. However this seems unlikely because Dilp2 mRNA levels are reduced to equal extents upon starvation in both wild-type and itpr mutant brains (Figure 8—figure supplement 1).
Figure 8 with 1 supplement see all
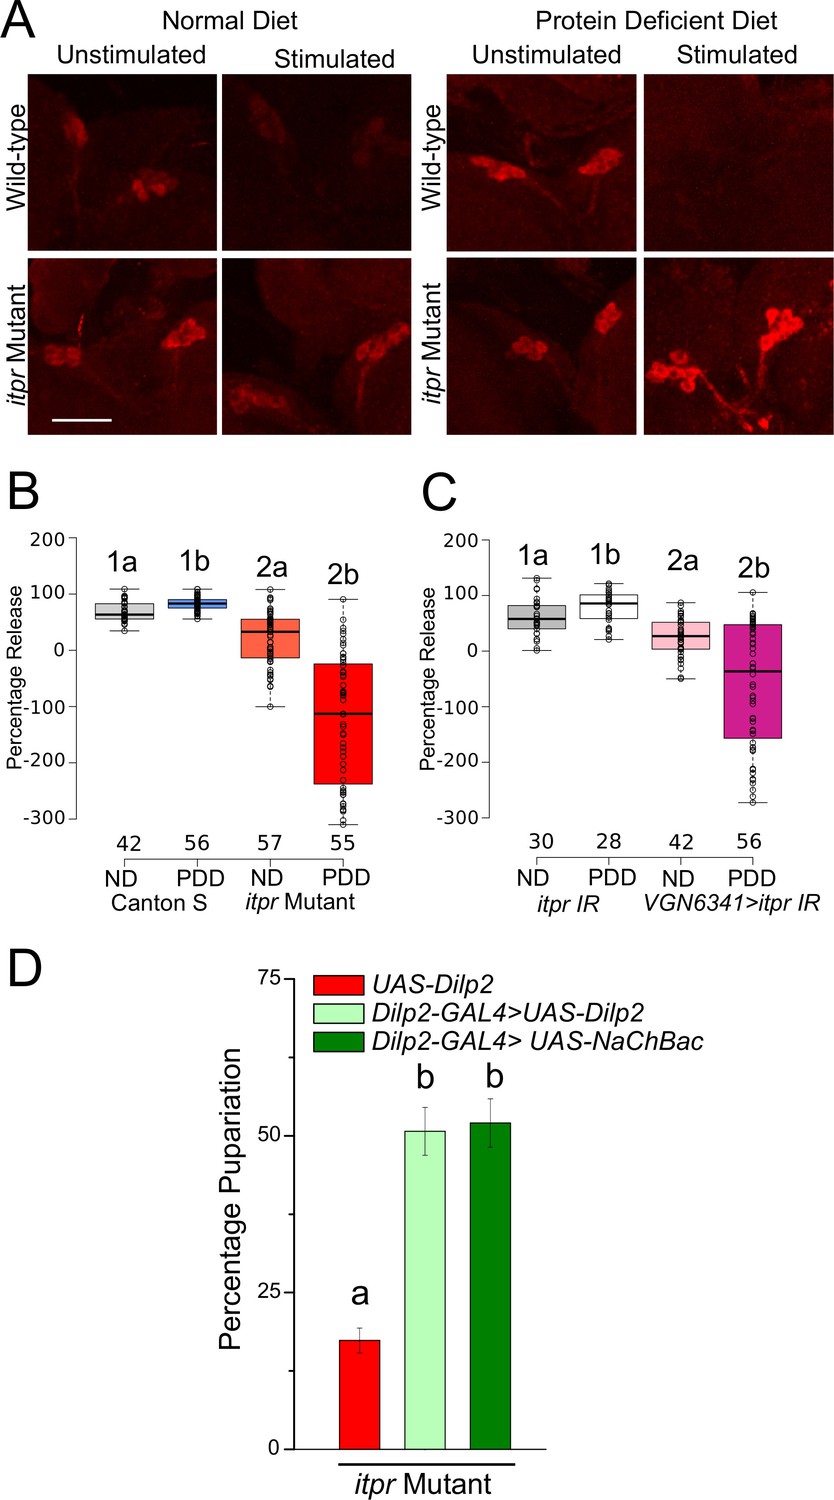
Glutamatergic neurons regulate Dilp2 release upon protein-starvation.
(A) Dilp2 staining in larval brains from the indicated genotypes before and after stimulation with 50µM CCh for 30 min. (B) and (C) Box plots representing percentage release of Dilp2 from the respective genotypes subjected to ND or PDD. Box plots and symbols are as described for Figure 2F. A significant interaction was observed between genotype and diet (p<0.001). (D) Bars represent percentage pupariation as mean ± SEM of indicated genotypes on PDD. N ≥ 6 batches with 25 larvae each. Bars with the same alphabet represent statistically indistinguishable groups (one-way ANOVA with a post hoc Tukey’s test p<0.05). For two-way ANOVA, numbers represent the variable genotype and alphabets represent diets (p<0.05).
IP3R signaling in glutamatergic neurons of the mVG regulate transcription of ecdysone biosynthetic genes in the ring gland during protein-deprivation
A peak of ecdysone release late in the wandering third-instar triggers larval pupariation on ND (Warren et al., 2006). Expression levels of genes encoding enzymes of the ecdysteroid biosynthetic pathway have been studied (McBrayer et al., 2007; Shimada-Niwa and Niwa, 2014), in larvae on a normal diet. Specifically, transcripts of shadow (sad), spookier (spok), phantom (phm), neverland (nvd) and disembodied (dib) are up-regulated dramatically before pupariation (McBrayer et al., 2007; Shimada-Niwa and Niwa, 2014; Warren et al., 2006). It is therefore likely that the neural circuit identified for pupariation on PDD affects ecdysone synthesis by regulating ecdysteroid biosynthesis. Levels of sad, spok, phm, nvd and dib transcripts over time were characterized by analysis of RNA isolated from wild-type prothoracic glands from larvae on PDD. Transcripts for all these genes peaked approximately 42 hr post protein-deprivation in wild-type larvae aged 80–88 hr AEL (Figure 9A). The expression levels of these genes were lower in the itpr mutant at 42 hr and 66 hr and could be significantly rescued by overexpression of mAChR+in the neurons marked by VGN6341, especially at 66 hr (Figure 9B). Their up-regulation corresponded to a rescue in pupariation as well (Figure 3A). Taken together these data indicate that glutamatergic neurons of the mVG regulate expression of genes required for the ecdysone peak for pupariation on PDD in a mAChR- and itpr-dependent manner (Figure 9C and D). Ecdysteroid synthesis and release is regulated by neuropeptides, predominantly prothoracicotropic hormone (PTTH) (McBrayer et al., 2007; Mirth et al., 2005), as well as through insulin signaling (Colombani et al., 2005; Mirth et al., 2005). We propose that this regulation of ecdysone synthesis by the mVG is through neuropeptide release from the mNSCs.
Figure 9

IP3R signaling in glutamatergic neurons regulates the expression of ecdysone biosynthetic genes during protein-deprivation.
(A) Normalized fold changes in the mRNA levels of the indicated genes represented as means ± SEM at indicated time points after 83–85 hr AEL on PDD from wild-type ring glands (n ≥ 3). (B) Bars represent mean fold changes (± SEM) of expression levels of respective ecdysteroid-synthesizing genes as shown in (A) from the ring glands of indicated genotypes at indicated time points (n ≥ 5). Bars with the same alphabet represent statistically indistinguishable groups (one-way ANOVA with a post hoc Tukey’s test p<0.05). (C) Schematics of the neuronal circuit required for pupariation under protein-deprivation in early third instar larvae (80–88 hr AEL). Upon amino acid deprivation, glutamatergic neurons of the mVG are activated by ppk inputs. These glutamatergic neurons activate peptidergic cells in the mNSC to release peptides to further modulate ecdysteroid gene expression. In itpr mutants upon amino acid deprivation, glutamatergic inputs from the mVG to the mNSCs remain silent. (D) Schematic model of the signaling mechanisms observed in the circuit for pupariation under protein-deprived conditions.
Discussion
In this study, we demonstrate that protein-deprivation signals are sensed by Pickpocket-expressing sensory neurons and conveyed to glutamatergic interneurons of the mid-ventral ganglion (mVG). These mVG neurons require mAChR-stimulated intracellular Ca2+ release through the IP3R to signal to downstream peptidergic neurons, including the medial neurosecretory cells. On a protein-deficient diet, these connections stimulate release of neuropeptides, which in turn, regulate expression of genes required for ecdysteroid biosynthesis to allow pupariation (Figure 9D). Calcium responses of mVG glutamatergic neurons differ between the normal and protein-deficient diets, suggesting that nutrient-dependent changes take place in these neurons that affect their cellular signaling properties. Knockdown of either mAChR or itpr in the mVG neurons blocks the functional connectivity between these neurons and the mNSCs (Figure 9C). The loss of this connectivity affects neuropeptide release from the mNSCs that is required for pupariation under protein-deprivation. Glutamatergic signals from the mVG are apparently not essential for pupariation on a normal diet, indicating that the likely function of this circuit is an adaptation to uncertain availability of food in nature.
Neuronal circuit for nutrient sensing
Similar to other insect larvae, the larval phase in Drosophila is dedicated to feeding and attaining a nutritional state ready for metamorphosis (Nijhout, 2003). Feeding and nutrient sensing thus constitute important aspects of larval life. The glutamatergic interneurons identified here exhibit diet-induced plasticity in their response to carbachol, an acetylcholine mimic. Their response appears integral to circuit function, and very likely drives enhanced neuropeptide secretion from the mNSCs and modulates ecdysteroid synthesis in the ring gland. Unlike the central neurons described recently (Bjordal et al., 2014), the glutamatergic interneurons do not sense amino acid levels directly. Instead, they reside in the ventral ganglion and receive inputs from sensory neurons of the class-IV multidendritic type marked by the ppk-GAL4. The precise identity of ppk-positive cells that sense the lack of amino acids needs to be determined.
Vertebrate neurosecretory cells located in the hypothalamus are integral to nutrient-sensing and energy homeostasis (Sternson, 2013) and have been equated to the mNSCs (Hartenstein, 2006). A recent report identified the importance of peripheral inputs to the central brain for maintaining nutritional homeostasis (Zeng et al., 2015). There is thus a remarkable similarity in the nutrient-sensing circuit we describe here to the circuits proposed in mammals. In vertebrates, neuronal circuit perturbation involving peripheral and central circuits remains challenging. The glutamatergic neurons identified here appear to regulate neuropeptide release from the mNSCs and might be equivalent to neuronal regulators of hypothalamic neurons.
Role of IP3R in metabolic adaptation
Intracellular Ca2+ release through the IP3R has been implicated in the regulation of lipid and carbohydrate metabolism in vertebrates and invertebrates (Agrawal et al., 2009; Ozcan et al., 2012; Wang et al., 2012). Vertebrate IP3R is encoded by three genes (Furuichi et al., 1989; Yamamoto-Hino et al., 1994), thus creating the possibility for layered, complex regulation. Mice null for IP3R2 and IP3R3 exhibit digestive defects associated with loss of exocrine secretion from pancreatic β cells and the salivary gland (Futatsugi et al., 2005). Intracellular calcium signaling in the context of neuronal regulation of a systemic response to nutritional cues as described here, remains to be tested in vertebrates. We speculate that IP3R-mediated calcium release in glutamatergic interneurons stimulates glutamate release onto presynaptic terminals of neurosecretory cells. We propose that reducing IP3R function in glutamatergic neurons in the mVG alters their connectivity with peptidergic neurons. Synapse formation induced by glutamate release has been reported (Kwon and Sabatini, 2011). Our data do not have the resolution to distinguish between physical and molecular bases of synaptic dysfunction. Activity-dependent rescue (observed in Figure 4I) restores the connectivity (Figure 5—figure supplement 1H), suggesting that these molecular changes, at least in part affect excitability.
In addition to mAChR, our screen identified eleven other GPCRs that signal through intracellular Ca2+ and whose knockdown in glutamatergic neurons resulted in loss of pupariation on PDD. Although each GPCR leads to the same systemic phenotype, the mechanisms in each case might differ, and each requires further study. Neuropeptide receptors constitute 8 out of 12 of these receptors. Interestingly, the neuropeptide receptors we report here, except SIFaR, have all been implicated in regulating feeding in vertebrates and insects (Caers et al., 2012; Hentze et al., 2015; Sano et al., 2015).
The calcium transients observed in glutamatergic neurons in the mVG upon optogenetic activation of cholinergic inputs were markedly different in larvae on ND and PDD. On PDD, the transients were oscillating, whereas on ND oscillations were either dampened or absent. Moreover, oscillations in the glutamatergic neurons appear to drive oscillations in the mNSCs of larvae on PDD as seen by the increase in neurons that oscillate (Figure 5—figure supplement 1I). Such oscillations are known to cause exocytosis of neuropeptides (Tse et al., 1993) and may underlie enhanced neuropeptide secretion required for pupariation on PDD. The molecular basis of such diet-induced plasticity leading to robust oscillatory activity in the glutamatergic neurons of the mVG needs investigation.
In a recent report, dopaminergic neurons in the larval brain of Drosophila were demonstrated as directly sensing amino acids leading to their activation and consequent changes in food-intake behaviour on an amino acid deficient medium (Bjordal et al., 2014). These findings, however, do not explain the full range of responses to amino acid deprivation. Our results describe a response mechanism that organisms employ to overcome the developmental consequences of protein-deprivation (Chen et al., 2015).
Context-dependent peptide and hormonal control allows pupariation
Higher levels of Dilp2 were observed in the larval mNSCs of IP3R mutants, as well as in larvae with IP3R knockdown in glutamatergic neurons of the ventral ganglion. We attribute the excess Dilp2 to reduced release of Dilp2 from the mNSCs. The absence of up-regulation of dilp2 transcripts in IP3R mutants supports this idea (Figure 8—figure supplement 1). This is, to our knowledge, the first report of Dilp2 regulation by neurons in the ventral ganglion. Environmental nutrients regulating Dilp function has been well documented (Géminard et al., 2009; Kim and Neufeld, 2015; Rajan and Perrimon, 2012). Most of these studies report remote sensing attributed to the fat body (Géminard et al., 2009; Koyama and Mirth, 2016; Rajan and Perrimon, 2012; Sano et al., 2015). The regulation we report here is another layer in the overall regulation of Dilps in Drosophila that seems to be particularly important upon protein-deprivation. Such complex layers of modulation are not surprising given that insulin signaling is important in different aspects of development and growth in Drosophila (Colombani et al., 2005). The Dilps have been speculated as regulators of pupariation (Koyama et al., 2014), and Dilp neurons project to the ring gland where ecdysone production occurs (Cao and Brown, 2001). Further work will be required to understand the regulation of Dilp secretion as a balance between neuronal and fat body signaling. Ultimately, all these layers of regulation seem to depend on the environmental context and developmental stage.
In insects, steroid hormones control developmental transitions (Thummel et al., 1990), including larval moults and metamorphosis. In third-instar larvae, there are ecdysone peaks ranging from several small ones to a bigger commitment peak prior to pupariation (Warren et al., 2006). Ecdysone is the switch for developmental change, hence needs to be tightly regulated through transcriptional control of ecdysteroid genes (McBrayer et al., 2007) and ecdysteroid biosynthesis is reported to be influenced by environmental conditions (Shimada-Niwa and Niwa, 2014). Serotonergic regulation of ecdysone release by changing neurite projections in a nutrient-dependent manner has been reported recently (Shimada-Niwa and Niwa, 2014). Our results do not rule out connectivity between mVG neurons and the supra-oesophageal ganglion in the central brain that could additionally stimulate the ring gland. We propose that the circuit identified here functions as a further layer of regulation, required during either sudden starvation or nutrient deprivation. It is required to make the key developmental decision of whether and when to pupariate. Energy homeostasis at a systemic level involves integrating environmental cues with internal states. The circuit we describe is such an integrator.
Materials and methods
Fly stocks and rearing
Request a detailed protocolDrosophila strains were grown on cornmeal medium supplemented with yeast (ND) at 25°C unless otherwise noted. The protein-deprived diet (PDD) contained 100 mM sucrose with 1% agar. For optogenetic experiments, egg laying was carried out in cornmeal medium supplemented with 200 µM all-trans-retinal (ATR), and larvae were transferred at 84 ± 4 hr onto ND or PDD with 400 µM ATR. Canton S was used as wild-type (WT) throughout. A table of all stocks used is appended as Supplementary file 1. The itpr IR was used with UAS-dicer in all experiments. For the GPCR RNAi screen, RNAi lines were obtained from either VDRC or NIG fly stock centres. Larvae at 84 ± 4 hr post egg laying were transferred to PDD or ND in batches of 25 and were scored for pupariation. At least six independent batches were performed for each genotype on each media. These are reported as percentage pupariation. For experiments involving diet-based rescues, PDD was supplemented either EAA (1x MEM EAA, GIBCO) or growth supplements (5x RPMI 1640 Amino acid solution, Sigma). For rate of pupariation, all genotypes in Figure 1 were monitored every 12 hr after transfer.
Immunohistochemistry
Request a detailed protocolImmunostaining of larval Drosophila brains was performed as described previously (Daniels et al., 2008). Briefly, larval brains were dissected in 1x phosphate buffered saline (PBS) and fixed with 4% Paraformaldehyde or Bouin’s fixative for dvGlut staining. They were washed three to four times with 0.2% phosphate buffer, pH 7.2 containing 0.2% Triton-X 100 (PTX) and blocked with 0.2% PTX containing 5% normal goat serum (NGS) for four hours at 4°C. Respective primary antibodies were incubated overnight (14–16 hr) at 4°C. For dvGlut staining, the brains were incubated for 60–72 hr at 4°C. After washing three to four times with 0.2% PTX at room temperature, they were incubated in the respective secondary antibodies for 2 hr at room temperature. The following primary antibodies were used: rabbit anti-GFP antibody (1:10,000; A6455, Life Technologies, RRID:AB_221570), mouse anti-GFP antibody (1:50; Santa Cruz Biotechnology, RRID:AB_627695), rabbit anti-dsRed (1:500; 632496, Clontech, RRID:AB_10015246) mouse anti-nc82 (anti-brp) antibody (1:50; a kind gift from Erich Buchner, RRID:AB_2314869,), rabbit anti-dvGlut (1:1000; a kind gift from Aaron DiAntonio, RRID:AB_2314346), rat anti-dilp2 (1:400; a kind gift from Pierre Leopold). Secondary antibodies were used at a dilution of 1:400 as follows: anti-rabbit Alexa Fluor 488 (#A11008, Life Technologies, RRID:AB_143165), anti-mouse Alexa Fluor 488 (#A11001, Life Technologies, RRID:AB_141367), anti-mouse Alexa Fluor 568 (#A11004, Life Technologies, RRID:AB_141371), anti-rabbit Alexa Fluor 594 (#A11037, Life Technologies, RRID:AB_10561549) and anti-rat Alexa Fluor 633 (#A21094, Life Technologies, RRID:AB_10561523). Confocal images were obtained on the Olympus Confocal FV1000 microscope (Olympus) with a 40x, 1.3 NA objective or with a 60x, 1.4 NA objective. Images were visualized using either the FV10-ASW 4.0 viewer (Olympus) or Fiji (RRID:SCR_002285) (Schindelin et al., 2012).
Live imaging from larval brains
Request a detailed protocolLarval brains were dissected in hemolymph-like saline (HL3) (70 mM NaCl, 5 mM KCl, 20 mM MgCl2, 10 mM NaHCO3, 5 mM trehalose, 115 mM sucrose, 5 mM HEPES, 1.5 mM Ca2+, pH 7.2), embedded in 0.2% low-melt agarose (Invitrogen), and bathed in HL3. GCaMP6m was used as the genetically encoded calcium sensor. ANF::GFP was expressed genetically to quantify vesicular release. Images were taken as a time series on an XY plane at an interval of 4 s using a 20x objective with an NA of 0.7 on an Olympus FV1000 inverted confocal microscope (Olympus Corp., Japan). For thermogenetic experiments, a heated stage was used to shift the temperature to 30°C to activate TrpA1. For optogenetic stimulation, a 633-nm laser line was used for activation of CsChrimson while simultaneously acquiring images with the 488 nm laser line, and the images were acquired every 1.5 s. For channelrhodopsin activation 488 nm laser line was used. For optogenetic inhibition experiments a green 543-nm laser line was driven simultaneously with image acquisition using the 488 nm laser line. All live imaging experiments were performed with at least five independent brain preparations and the exact number of cells for each experiment are indicated in the figures.
The raw images were extracted using Image J1.48 and regions of interest (ROI) selected using the Time Series Analyser plugin. ∆F/F was calculated using the formula ∆F/F = (Ft-F0)/F0, where Ft is the fluorescence at time t and F0 is baseline fluorescence corresponding to the average fluorescence over the first ten frames. Area under the curve was calculated from the point of stimulation which was considered as 0th second for stimulation up to 300 s using Microsoft Excel (Microsoft) and plotted using BoxPlotR (Spitzer et al., 2014). ∆F/F Release was calculated as (F0-Ft)/F0 where Ft is the fluorescence at time t and F0 is baseline fluorescence corresponding to the average fluorescence over the first 10 frames. Area under the curve was calculated from 0s to 600s using Microsoft Excel (Microsoft), and box plots were plotted using BoxPlotR (Spitzer et al., 2014). For experiments with UAS-Shits, a heated microscopic stage was used.
Quantification of Dilp2 release
Request a detailed protocolLarval brains on ND or PDD were dissected and stained for Dilp2. Image acquisition was performed using similar acquisition settings and were processed using Fiji. Cells and background were marked using an ROI selection plugin and then the intensity across the stacks was measured. Brightest values were obtained using a Max function in Microsoft Excel. Intensity values were calculated for each cell in brains irrespective of ND or PDD, by subtracting background. To then obtain percentage release upon stimulation, intensity of cells were normalized to average intensity on the same diet. At least five independent brain preparations per genotype per condition were used and the exact number of cells are indicated in the figure.
RNA isolation and quantitative PCR
Request a detailed protocolFlies were transferred every 2 hr to obtain larvae that were very tightly staged. Ring glands from larvae of the appropriate genotype and age were dissected in phosphate buffer saline prepared in double distilled water treated with diethyl pyrocarbonate (Sigma). Each sample consisted of five Ring glands or 5 CNS and these were homogenized in 500 µl TRIzol per sample by vortexing immediately after dissection. At least three biological replicate samples were made for each genotype. After homogenization the sample was kept on ice and processed within 30 min or stored at −80°C until processing for up to 4 weeks. RNA was isolated by following manufacturer’s protocol for TRIzol (Ambion, ThermoFischer Scientific). Purity of the isolated RNA was estimated by NanoDrop spectrophotometer (Thermo Scientific) and integrity was checked by running it on a 1% Tris-EDTA agarose gel.
Approximately 100 ng of total RNA was used per sample for cDNA synthesis. DNAse treatment and first strand synthesis were performed as described previously (Pathak et al., 2015). Quantitative real time PCRs (qPCRs) were performed in a total volume of 10 µl with Kapa SYBR Fast qPCR kit (KAPA Biosystems, Wilmington, MA) on an ABI 7500 fast machine operated with ABI 7500 software (Applied Biosystems). Technical duplicates were performed for each qPCR reaction. A melt analysis was performed at the end of the reaction to ensure the specificity of the product. The fold change of gene expression in any experimental condition relative to wild-type was calculated as 2−△△Ct where △△Ct = (Ct (target gene) –Ct (rp49)) Expt. - (Ct (target gene) – Ct (rp49)) Control.
rp49 was used as the internal control and the primer sequences used are provided in Supplementary file 2. Primers for genes of the ecdysteroid biosynthetic pathway have been described previously (Shimada-Niwa and Niwa, 2014).
Generation of transgenic flies
Request a detailed protocolThe dimmed-LexA::p65 construct was created using recombineering techniques based on those of (Warming et al., 2005). 5′ and 3′ homology arms comprising about 200 bases each of NLS::LexA and the HSP70 terminator were amplified from pBPnlsLexA::p65Uw, a gift of Gerald Rubin (Pfeiffer et al., 2010) and inserted into pSK+-rpsL-kana (Wang et al., 2009) to create a selectable generic landing cassette. Primers carrying gene-specific homology arms to target the cassette to the first coding exon of dimmed were used to PCR-amplify this cassette, and the resulting dimmed-flanked marker cassette was recombined into P[acman] BAC clone CH321-46B06 (Venken et al., 2009) (obtained from Children’s Hospital Oakland Research Institute, Oakland, CA), replacing the coding portion of the first dimmed coding exon while leaving intact the endogenous 5′ UTR as well as the following introns and exons (although these are presumably no longer transcribed because of the inserted terminator sequences). The landing-site cassette was then replaced via a second recombination with full-length LexA::p65-HSP70, also amplified from pBPnlsLexA::p65Uw. The recombined regions of the BAC were sequence-verified, and the finished BAC was integrated into attP site VK00033 (Venken et al., 2006) on chromosome arm 3L by Genetic Services, Inc. (Cambridge, MA).
For the VGN6341-LexA, the 505 bp fragment of the dvGlut gene enhancer as in VGN6341-GAL4 (Syed et al., 2016) was PCR amplified from wild-type DNA, the sequence was verified and cloned into pDONR-221-p1-p5r (Invitrogen) to get an entry clone by performing the BP reaction. This entry clone along with the LexA entry clone and the destination vector were combined in an LR reaction to generate VGN6341-LexA.
For the LexAop-ANF::GFP clone, the sequence of ANF:GFP was PCR amplified from DNA isolated from UAS-ANF::GFP flies and cloned into pDONR-221-p5-p2 (Invitrogen) to get an entry clone by performing the BP reaction. This entry clone along with the LexAop entry clone and the destination vector were combined in an LR reaction to generate LexAop-ANF::GFP.
The entry clones pENTR L5-LexAp65-L2 (41437) and pENTR L1-13XLexAop2-R5 (41433) and the destination vector pDESTsvaw (32318) were obtained from Addgene. The BP and LR reactions were performed using the Multisite Gateway Pro cloning kit (Invitrogen, 12537–102) following the half volume protocol described in (Petersen and Stowers, 2011). All primer sequences are listed in Supplementary file 2.
Statistics
All statistical tests are mentioned in the figure legends and were performed using Origin 8.0. Supplementary file 4 has all statistical tests and their p-values.
References
-
Coordination of organ growth: principles and outstanding questions from the world of insectsTrends in Cell Biology 23:336–344.https://doi.org/10.1016/j.tcb.2013.03.005
-
More than two decades of research on insect neuropeptide GPCRs: an overviewFrontiers in Endocrinology 3:151.https://doi.org/10.3389/fendo.2012.00151
-
Unicellular Ca2+ signaling 'toolkit' at the origin of metazoaMolecular Biology and Evolution 25:1357–1361.https://doi.org/10.1093/molbev/msn077
-
Localization of an insulin-like peptide in brains of two fliesCell and Tissue Research 304:317–321.https://doi.org/10.1007/s004410100367
-
Visualizing glutamatergic cell bodies and synapses in Drosophila larval and adult CNSJournal of Comparative Neurology 508:131–152.https://doi.org/10.1002/cne.21670
-
Release of chemical transmitters from cell bodies and dendrites of nerve cellsPhilosophical Transactions of the Royal Society B: Biological Sciences 370:20140181.https://doi.org/10.1098/rstb.2014.0181
-
Muscarinic inhibitory receptors in pulmonary parasympathetic nerves in the guinea-pigBritish Journal of Pharmacology 83:973–978.https://doi.org/10.1111/j.1476-5381.1984.tb16539.x
-
Remote control of insulin secretion by fat cells in DrosophilaCell Metabolism 10:199–207.https://doi.org/10.1016/j.cmet.2009.08.002
-
The neuroendocrine system of invertebrates: a developmental and evolutionary perspectiveJournal of Endocrinology 190:555–570.https://doi.org/10.1677/joe.1.06964
-
Drosophila homologs of two mammalian intracellular Ca(2+)-release channels: identification and expression patterns of the inositol 1,4,5-triphosphate and the ryanodine receptor genesDevelopment 116:967–975.
-
Functional expression of a cloned Drosophila muscarinic acetylcholine receptor in a stable Drosophila cell lineJournal of Experimental Biology 198:1843–1850.
-
Neurobiology of food intake in health and diseaseNature Reviews Neuroscience 15:367–378.https://doi.org/10.1038/nrn3745
-
The control of body size in insectsDevelopmental Biology 261:1–9.https://doi.org/10.1016/S0012-1606(03)00276-8
-
Drosophila neuropeptides in regulation of physiology and behaviorProgress in Neurobiology 92:42–104.https://doi.org/10.1016/j.pneurobio.2010.04.010
-
Transfected muscarinic acetylcholine receptors selectively couple to Gi-type G proteins and Gq/11Molecular Pharmacology 45:890–898.
-
Fiji: an open-source platform for biological-image analysisNature Methods 9:676–682.https://doi.org/10.1038/nmeth.2019
-
Activity-dependent synaptic capture of transiting peptidergic vesiclesNature Neuroscience 9:896–900.https://doi.org/10.1038/nn1719
-
BoxPlotR: a web tool for generation of box plotsNature Methods 11:121–122.https://doi.org/10.1038/nmeth.2811
-
Altered lipid homeostasis in Drosophila InsP3 receptor mutants leads to obesity and hyperphagiaDisease Models & Mechanisms 6:734–744.https://doi.org/10.1242/dmm.010017
-
A new positive/negative selection scheme for precise BAC recombineeringMolecular Biotechnology 42:110–116.https://doi.org/10.1007/s12033-009-9142-3
-
Simple and highly efficient BAC recombineering using galK selectionNucleic Acids Research 33:1–12.https://doi.org/10.1093/nar/gni035
-
Nerve growth cone guidance mediated by G protein-coupled receptorsNature Neuroscience 5:843–848.https://doi.org/10.1038/nn899
-
Cloning and characterization of human type 2 and type 3 inositol 1,4,5-trisphosphate receptorsReceptors & Channels 2:9–22.
-
The GCN2 eIF2alpha kinase is required for adaptation to amino acid deprivation in miceMolecular and Cellular Biology 22:6681–6688.https://doi.org/10.1128/MCB.22.19.6681-6688.2002
Article and author information
Author details
Funding
National Centre for Biological Sciences (Core funding)
- Gaiti Hasan
Council of Scientific and Industrial Research (Graduate fellowship)
- Siddharth Jayakumar
National Centre for Biological Sciences (Graduate fellowship)
- Shlesha Richhariya
The funders had no role in study design, data collection and interpretation, or the decision to submit the work for publication.
Acknowledgements
We thank, Yoshi Aso, Claude Desplan, Amita Sehgal, Pierre Leopold, Aaron DiAntonio for fly stocks and antibodies; the Vienna Drosophila RNAi Center (VDRC), National Institute of Genetics Fly Stock Center and the Bloomington Stock Center (National Institutes of Health P40OD018537) for flies. We thank Steve Stowers for plasmids and Matthias Landgraf for introducing us to them. We also thank the Fly Facility, the Sequencing Facility and the Central Imaging and Flow Cytometry Facility at NCBS.
Copyright
© 2016, Jayakumar et al.
This article is distributed under the terms of the Creative Commons Attribution License, which permits unrestricted use and redistribution provided that the original author and source are credited.
Metrics
-
- 4,535
- views
-
- 732
- downloads
-
- 34
- citations
Views, downloads and citations are aggregated across all versions of this paper published by eLife.
Citations by DOI
-
- 34
- citations for umbrella DOI https://doi.org/10.7554/eLife.17495
Download links
A two-part list of links to download the article, or parts of the article, in various formats.
Downloads (link to download the article as PDF)
Open citations (links to open the citations from this article in various online reference manager services)
Cite this article (links to download the citations from this article in formats compatible with various reference manager tools)
Drosophila larval to pupal switch under nutrient stress requires IP3R/Ca2+ signalling in glutamatergic interneurons
eLife 5:e17495.
https://doi.org/10.7554/eLife.17495


