Peer review process
Revised: This Reviewed Preprint has been revised by the authors in response to the previous round of peer review; the eLife assessment and the public reviews have been updated where necessary by the editors and peer reviewers.
Read more about eLife’s peer review process.Editors
- Reviewing EditorFrederik GrawFriedrich-Alexander-University Erlangen-Nürnberg, Erlangen, Germany
- Senior EditorSatyajit RathNational Institute of Immunology, New Delhi, India
Reviewer #1 (Public review):
Summary:
The objective of this study was to infer the population dynamics (rates of differentiation, division and loss) and lineage relationships of NK cell subsets during an acute immune response and under homeostatic conditions.
Strengths:
A rich dataset and a detailed analysis of a particular class of stochastic models.
Weaknesses: (relating to initial submission)
The stochastic models used are quite simple; each population is considered homogeneous with first-order rates of division, death, and differentiation. In Markov process models such as these there is no dependence of cellular behavior on its history of divisions. In recent years models of clonal expansion and diversification, in the settings of T and B cells, have progressed beyond this picture. So I was a little surprised that there was no mention of the literature exploring the role of replicative history in differentiation (e.g. Bresser Nat Imm 2022), nor of the notion of family 'division destinies' (either in division number, or the time spent proliferating, as described by the Cyton and Cyton2 models developed by Hodgkin and collaborators; e.g. Heinzel Nat Imm 2017). The emerging view is that variability in clone (family) size arises may arise predominantly from the signals delivered at activation, which dictate each precursor's subsequent degree of expansion, rather than from the fluctuations deriving from division and death modeled as Poisson processes.
As you pointed out, the Gerlach and Buchholz Science papers showed evidence for highly skewed distributions of family sizes, and correlations between family size and phenotypic composition. Is it possible that your observed correlations could arise if the propensity for immature CD27+ cells to differentiate into mature CD27- cells increases with division number? The relative frequency of the two populations would then also be impacted by differences in the division rates of each subset - one would need to explore this. But depending on the dependence of the differentiation rate on division number, there may be parameter regimes (and timepoints) at which the more differentiated cells can predominate within large clones even if they divide more slowly than their immature precursors. One might not then be able to rule out the two-state model. I would like to see a discussion or rebuttal of these issues.
Comments on revisions:
The authors have put in a lot of effort to address the reviews and have explored alternative models carefully.
In the sections relating to homeostasis and the endogenous response, as far as I can tell you are estimating net growth rates (the k parameters) throughout - this is to be expected if you're working with just cell numbers and no information relating to proliferation. In these sections there are many places where you refer to proliferation rates and death rates when I think you just mean net positive or net negative growth rates. It's important to be precise about this even if the language can get a bit repetitive. (These net rates of growth or loss relate to clonal rather than cellular dynamics, which may be worth explaining). Later, you do use data relating to dead cells, which in principle can be used to get independent measures of death rates, but these data were not used in the fitting.
There is so much evidence that T and B cell differentiation are often contingent on division that it would be very reasonable to consider it as a possibility for NK cells too. (Differentiation could be asymmetric, as you explored, or simply symmetric with some probability per division). These processes can be cast into simple ODE models but no longer allow you to aggregate division and death rates - so for parameter estimation you need to add measures of proliferation (Ki67 or similar) or death. This may be worth some discussion?
Reviewer #2 (Public review):
Summary:
Wethington et al. investigated the mechanistic principles underlying antigen-specific proliferation and memory formation in mouse natural killer (NK) cells following exposure to mouse cytomegalovirus (MCMV), a phenomenon predominantly associated with CD8+ T cells. Using a stochastic modeling approach, the authors aimed to develop a quantitative model of NK cell clonal dynamics during MCMV infection. Starting from a single immature Ly49+CD27+ NK cell, a two-state linear model (with a death variant) explained the negative correlation between clone size at 8 dpi and the CD27+ fraction, but failed to reproduce the first and second moments of CD27+ and CD27− NK cell populations at 8 dpi. To address this limitation, the authors added an intermediate maturation state, yielding a three-stage model (CD27+Ly6C− → CD27−Ly6C− → CD27−Ly6C+) that fits the first and second moments under two constraints: CD27+ NK cells proliferate faster than CD27− NK cells, and clone size is negatively correlated with the CD27+ fraction (upper bound of −0.2). The model predicts high proliferation in the intermediate state and high death in mature CD27−Ly6C+ cells, and it was validated using Adams et al. (2021) NK reporter mice tracking CD27+/− populations after tamoxifen, allowing discrimination between bone marrow-derived and pre-existing peripheral NK cells. To test the prediction that mature CD27− NK cells have a higher death rate, the authors measured Ly49H+ NK cell viability in the mouse spleen at different time points post-MCMV infection. Data confirmed lower viability of mature (CD27−) than immature (CD27+) cells during days 4-8 post-infection, and a model variant supported that higher CD27− death increases their proportion in the dead cell compartment. Altogether, the authors propose a three-stage quantitative model of antigen-specific expansion and maturation of naïve Ly49H+ NK cells with the trajectory CD27+Ly6C− (immature) → CD27−Ly6C− (mature I) → CD27−Ly6C+ (mature II), highlighting high proliferation in the mature I state and increased death in the mature II state.
Strengths:
Models explaining correlations and first and second moments, supported by analytical investigations, stochastic simulations, and model selection, identify key processes in antigen-specific NK expansion and maturation. The work distinguishes expansion, contraction, and memory in NK cells from CD8+ T cells and informs NK therapy development.
Weaknesses (relating to initial submission):
The conclusions of this paper are largely supported by the available data. However, a comparative analysis with more recent works in the field would be desirable. Clarifications:
(1) Initial Conditions and Grassmann Data: The Grassmann data is used solely as a constraint, while the simulated values of CD27+/CD27− cells could have been directly fitted to the Grassmann data, which assumes a 1:1 ratio of CD27+/CD27− at t = 0. This would allow an alternative initial condition rather than starting from a single CD27+ cell.
(2) Correlation Coefficients in the Three-State Model: Although the parameter scan of the three-stage model (Figure 2) demonstrates the potential for negative correlations between colony size and the fraction of CD27+ cells, the calculated correlation coefficients using the fitted parameter values are not shown. Including these would validate that the fitted parameters lie in the negative-correlation regime.
(3) Viability Dynamics and Adaptive Response: The authors measured the time evolution of CD27+/− dynamics and viability over 30 days post-infection (Figure 4). It would be valuable to test whether the three-state model can reproduce the adaptive response of CD27− cells to MCMV infection, particularly the observed drop in CD27− viability at 5 dpi and its rebound at 8 dpi. Demonstrating this would test whether the model can simultaneously explain viability dynamics and moment dynamics, and would enable sensitivity analysis of CD27− viability with respect to model parameters.
Author response:
The following is the authors’ response to the original reviews.
Reviewer #1 (Public review):
Summary:
The objective of this study was to infer the population dynamics (rates of differentiation, division, and loss) and lineage relationships of clonally expanding NK cell subsets during an acute immune response.
Strengths:
A rich dataset and thorough analysis of a particular class of stochastic models.
We thank the reviewer for the positive comment.
Weaknesses:
The stochastic models used are quite simple; each population is considered homogeneous with first-order rates of division, death, and differentiation. In Markov process models such as these, there is no dependence of cellular behavior on its history of divisions. In recent years models of clonal expansion and diversification, in the settings of T and B cells, have progressed beyond this picture. So I was a little surprised that there was no mention of the literature exploring the role of replicative history in differentiation (e.g. Bresser Nat Imm 2022), nor of the notion of family 'division destinies' (either in division number or the time spent proliferating, as described by the Cyton and Cyton2 models developed by Hodgkin and collaborators; e.g. Heinzel Nat Imm 2017). The emerging view is that variability in clone (family) size may arise predominantly from the signals delivered at activation, which dictate each precursor's subsequent degree of expansion, rather than from the fluctuations deriving from division and death modeled as Poisson processes.
As you pointed out, the Gerlach and Buchholz Science papers showed evidence for highly skewed distributions of family sizes and correlations between family size and phenotypic composition. Is it possible that your observed correlations could arise if the propensity for immature CD27+ cells to differentiate into mature CD27- cells increases with division number? The relative frequency of the two populations would then also be impacted by differences in the division rates of each subset - one would need to explore this. But depending on the dependence of the differentiation rate on division number, there may be parameter regimes (and time points) at which the more differentiated cells can predominate within large clones even if they divide more slowly than their immature precursors. One might not then be able to rule out the two-state model. I would like to see a discussion or rebuttal of these issues.
We thank the reviewer for the insightful comment and drawing our attention to the Cyton models. We have discussed the Cyton models in the Introduction (lines 80-95) and the Discussion (lines 538-553) sections of the revised manuscript and carried out simulations for the variant of the Cyton model suggested by the reviewer. The two-state model showed that for certain parameters it can give rise to a negative correlation between the clone size and the percentage of immature (CD27+) NK cells in the absence of any death suggesting the potential importance of division destiny along with stochastic fluctuations in giving rise to the heterogeneity observed in NK cell clone size distributions in the expansion phase. In addition, we also considered a two-state model where the NK cell activation time in individual cells vary following a log-normal distribution; this two-state model also shows the presence of negative correlations between clone sizes and the percentage of immature NK cells within the clones. We have added new results (Figs. S2-3) and discussed the results (lines 223-232) in the Results and the Discussion (lines 538-553) sections. We believe these additional simulations provide new insights into the results we carried out with our two- and three- state models.
Reviewer #2 (Public review):
Summary:
Wethington et al. investigated the mechanistic principles underlying antigen-specific proliferation and memory formation in mouse natural killer (NK) cells following exposure to mouse cytomegalovirus (MCMV), a phenomenon predominantly associated with CD8+ T cells. Using a rigorous stochastic modeling approach, the authors aimed to develop a quantitative model of NK cell clonal dynamics during MCMV infection.
Initially, they proposed a two-state linear model to explain the composition of NK cell clones originating from a single immature Ly49+CD27+ NK cell at 8 days post-infection (dpi). Through stochastic simulations and analytical investigations, they demonstrated that a variant of the twostate model incorporating NK cell death could explain the observed negative correlation between NK clone sizes at 8 dpi and the percentage of immature (CD27+) NK cells (Page 8, Figure 1e, Supplementary Text 1). However, this two-state model failed to accurately reproduce the first (mean) and second (variance and covariance) moments of the measured CD27+ and CD27- NK cell populations within clones at 8 dpi (Figure 1g).
To address this limitation, the authors increased the model's complexity by introducing an intermediate maturation state, resulting in a three-stage model with the transition scheme: CD27+Ly6C- → CD27-Ly6C- → CD27-Ly6C+. This three-stage model quantitatively fits the first and second moments under two key constraints: (i) immature CD27+ NK cells exhibit faster proliferation than CD27- NK cells, and (ii) there is a negative correlation (upper bound: -0.2) between clone size and the fraction of CD27+ cells. The model predicted a high proliferation rate for the intermediate stage and a high death rate for the mature CD27-Ly6C+ cells.
Using NK cell reporter mice data from Adams et al. (2021), which tracked CD27+/- cell population dynamics following tamoxifen treatment, the authors validated the three-stage model. This dataset allowed discrimination between NK cells originating from the bone marrow and those pre-existing in peripheral blood at the onset of infection. To test the prediction that mature CD27- NK cells have a higher death rate, the authors measured Ly49H+ NK cell viability in the mice spleen at different time points post-MCMV infection. Experimental data confirmed that mature (CD27-) NK cells exhibited lower viability compared to immature (CD27+) NK cells during the expansion phase (days 4-8 post-infection).
Further mathematical analyses using a variant of the three-stage model supported the hypothesis that the higher death rate of mature CD27- cells contributes to a larger proportion of CD27- cells in the dead cell compartment, as introduced in the new variant model.
Altogether, the authors proposed a three-stage quantitative model of antigen-specific expansion and maturation of naïve Ly49H+ NK cells in mice. This model delineates a maturation trajectory: (i) CD27+Ly6C- (immature) → (ii) CD27-Ly6C- (mature I) → (iii) CD27-Ly6C+ (mature II). The findings highlight the highly proliferative nature of the mature I (CD27-Ly6C-) phenotype and the increased cell death rate characteristic of the mature II (CD27-Ly6C+) phenotype.
Strengths:
By designing models capable of explaining correlations, first and second moments, and employing analytical investigations, stochastic simulations, and model selection, the authors identified the key processes underlying antigen-specific expansion and maturation of NK cells. This model distinguishes the processes of antigen-specific expansion, contraction, and memory formation in NK cells from those observed in CD8+ T cells. Understanding these differences is crucial not only for elucidating the distinct biology of NK cells compared to CD8+ T cells but also for advancing the development of NK cell therapies currently under investigation.
We thank the reviewer for the positive comments.
Weaknesses:
The conclusions of this paper are largely supported by the available data. However, a comparative analysis of model predictions with more recent works in the field would be desirable. Moreover, certain aspects of the simulations, parameter inference, and modeling require further clarification and expansion, as outlined below:
(1) Initial Conditions and Grassmann Data: The Grassmann data is used solely as a constraint, while the simulated values of CD27+/CD27- cells could have been directly fitted to the Grassmann data, which assumes a 1:1 ratio of CD27+/CD27- at t = 0. This approach would allow for an alternative initial condition rather than starting from a single CD27+ cell, potentially improving model applicability.
We fit the moments of the cell populations along with the ratio of resulting cells from an initial condition of 1:1 ratio of CD27+/CD27- cells at t=0 in the model. The initial condition agrees with the experimental data. However, this fit produced parameter values that will lead to greater growth of mature CD27- NK cells compared to that of immature CD27+ NK cells. This could result from the equal weights given to the ratio as well as to the different moments, and a realistic parameter estimate could correspond to an unequal weight between the ratio and the moments. Imposing the constraint Δk >0 in the fitting drives the parameter search in the region, which seems to alleviate this issue that produces estimates of the rates consistent with higher growth of immature NK cells. We included Table S6 and accompanying description to show this, as well as an additional section in the Materials and Methods (lines 669-676).
(2) Correlation Coefficients in the Three-State Model: Although the parameter scan of the threestate model (Figure 2) demonstrates the potential for achieving negative correlations between colony size and the fraction of CD27+ cells, the authors did not present the calculated correlation coefficients using the estimated parameter values from fitting the three-state model to the data. Including these simulations would provide additional insight into the parameter space that supports negative correlations and further validate the model.
We have included this figure (Figure 2d) in the revised manuscript.
(3) Viability Dynamics and Adaptive Response: The authors measured the time evolution of CD27+/- dynamics and viability over 30 days post-infection (Figure 4). It would be valuable to test whether the three-state model can reproduce the adaptive response of CD27- cells to MCMV infection, particularly the observed drop in CD27- viability at 5 dpi (prior to the 8 dpi used in the study) and its subsequent rebound at 8 dpi. Reproducing this aspect of the experiment is critical to determine whether the model can simultaneously explain viability dynamics and moment dynamics. Furthermore, this analysis could enable sensitivity analysis of CD27- viability with respect to various model parameters.
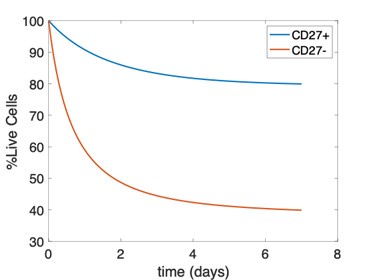
We have compared the expansion kinetics of the adoptively transferred Ly49H+ NK cells (Figure 2) and endogenous Ly49H+ NK cells, where the endogenous NK cells show slower growth rates than their adoptively transferred counterparts (see lines 422-429). The data shown in Figure 4 refer to the relative percentage of the mature and immature endogenous NK cells, thus cannot be explained by the three-state model calibrated by the expansion of the adoptively transferred NK cells. One of the issues with using the viability data for parameter estimation for endogenous cells is the need to assume a model for dead cell clearance. We assume a model where dead cells are cleared according to a first-order decay reaction and vary the rate of this reaction to show that the qualitative results are in line with our model rates. This model cannot recreate the dip and rebound observed in the data, and instead monotonically and asymptotically approaches a percentage of live cells. We have attached a figure showing this behavior below. Rather, we intend to use this model as qualitative validation that the relative viability of mature NK cells is lower than that of immature NK cells. Models that include time-dependence of clearance of dead cells, or models with a higher-order (i.e. second) reaction for clearance of dead cells in which propensity for clearance is lower at early times and greater at later times may be better suited for this purpose but are beyond the scope of our validation.
Author response image 1.
Reviewer #1 (Recommendations for the authors):
I think the manuscript could be improved substantially by exploring alternative models that incorporate replicative history. At the very least it needs a deeper discussion of the literature relating to clonal expansion, putting the existing models in the context of these studies, and arguing convincingly that your conclusions are robust.
We have substantially expanded our explorations with alternative models, in particular we considered a variant of the Cyton model suggested by Reviewer#1, a model where NK cells become activated at different times, and a model with asymmetric NK cell division. We have shown the results (Figs. S2-3) in the Supplementary material and discussed the results in the Results and Discussion sections. Please refer to our response #1 to Reviewer #1 for more details.
Reviewer #2 (Recommendations for the authors):
(1) Possible Typo (Page 12, Line 254):
The phrase: "immature NK cells compared to their immature counterparts" appears to contain a typo. Consider rephrasing for clarity.
Done. Thanks for finding this.
(2) Clarification of Data Source and Computational Procedure:
In the statement: "The NK cell clones reported by Flommersfeld et al. contained mixtures of CD27+ and CD27- NK cells. We evaluated the percentage of CD27+ NK cells in each clone and computed the correlation (Csize-CD27+) of the size of the clone with the percentage of CD27+ NK cells in the clones." Please clarify the data source and computational methodology for evaluating the percentage of CD27+ cells within clones. Additionally, consider including the curated data in the supplementary materials. Since the data originates from different immune compartments, explain which compartments were used. If data from all compartments were included, discuss how the calculated correlation changes when stratifying data from different sources (e.g., spleen and lymph nodes).
We have clarified the data source (spleen) where appropriate.
(3) Figure 1b (Correlation Coefficient):
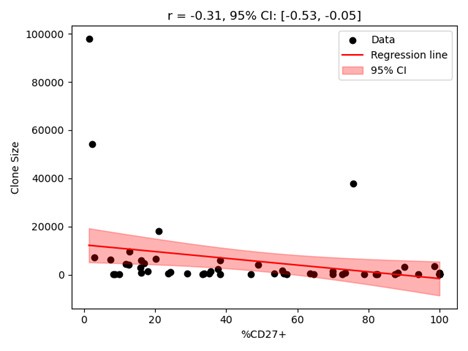
While the correlation coefficient with p-value is mentioned, it would be beneficial to also provide the standard deviation of the correlation coefficient and a 95% confidence band for the fitted line. This is particularly relevant as the authors use -0.2 as the upper bound for the correlation coefficient when fitting the three-stage model.
We have included the CI and the p-value for the correlation shown in Figure 1b. The figure with the 95% confidence band shown in the figure (appended below) where both axes are in normal scale does not appear visually clear as in Figure 1b where the clone sizes are shown in the logscale. Thus, we did not include the confidence band in Figure 1b but display the CI and p-values on the figure. If the reviewer prefers, we can include the figure with the confidence band in the SI.
Author response image 2.
(4) Confidence Intervals in Tables:
If confidence intervals in the tables are calculated using bootstrapping, please mention this explicitly in the table headings for clarity.
Done.
(5) Figure 2d-e (Simulation Method):
Specify the simulation method used (e.g., stochastic simulation algorithm [SSA], as mentioned in the materials and methods). Panel (e) lacks a caption-please provide one. Additionally, it would be interesting to include the correlation between clone size and the fraction of CD27+ cells in the clones (similar to the experimental data from Flommersfeld et al., 2021).
Done.
(6) Figure 3 (Confidence Band):
Include a 95% confidence band for the simulated values to enhance the interpretability of the plots.
Done.
(7) Materials and Methods Section: Include a mathematical formula defining the metrics described, ensuring clarity and precision.
Done. See newly added lines 587-599, as well as existing content in the Supplementary Materials.
(8) Supplementary Text 1 (Numerical Integration and AICc):
The section "Numerical Integration of Master Equation and Calculation of the AICc" is well done. However, given that the master equation involves a system of 106 coupled ODEs, it would be highly appreciated if the authors provided the formulation in matrix representation for better comprehension.
We have included a supplementary text (Supplementary Text I) and a schematic figure within the text to provide the details.
(9) Figure S7b (Three-State Model Validation):
Given that the three-state model fits the data, assess whether it can also fit the first and secondmoment data effectively. This validation would strengthen the robustness of the model.
Although we showed that the best fit of the clonal burst data (moments) vastly overestimates the growth rates of endogenous cells (Figure S9a, previously Figure S7a), we did not fully emphasize the differences in the datasets that make fitting both with the same parameters impossible. We have added additional text in the main text where Figure S9a is located (lines 427-429) to discuss this.


