Peer review process
Not revised: This Reviewed Preprint includes the authors’ original preprint (without revision), an eLife assessment, public reviews, and a provisional response from the authors.
Read more about eLife’s peer review process.Editors
- Reviewing EditorBryan BrysonMassachusetts Institute of Technology, Cambridge, United States of America
- Senior EditorAleksandra WalczakCNRS, Paris, France
Reviewer #1 (Public review):
The authors present exciting new experimental data on the antigenic recognition of 78 H3N2 strains (from the beginning of the 2023 Northern Hemisphere season) against a set of 150 serum samples. The authors compare protection profiles of individual sera and find that the antigenic effect of amino acid substitutions at specific sites depends on the immune class of the sera, differentiating between children and adults. Person-to-person heterogeneity in the measured titers is strong, specifically in the group of children's sera. The authors find that the fraction of sera with low titers correlates with the inferred growth rate using maximum likelihood regression (MLR), a correlation that does not hold for pooled sera. The authors then measure the protection profile of the sera against historical vaccine strains and find that it can be explained by birth cohort for children. Finally, the authors present data comparing pre- and post- vaccination protection profiles for 39 (USA) and 8 (Australia) adults. The data shows a cohort-specific vaccination effect as measured by the average titer increase, and also a virus-specific vaccination effect for the historical vaccine strains. The generated data is shared by the authors and they also note that these methods can be applied to inform the bi-annual vaccine composition meetings, which could be highly valuable.
The following points could be addressed in a revision:
(1) The authors conclude that much of the person-to-person and strain-to-strain variation seems idiosyncratic to individual sera rather than age groups. This point is not yet fully convincing. While the mean titer of an individual may be idiosyncratic to the individual sera, the strain-to-strain variation still reveals some patterns that are consistent across individuals (the authors note the effects of substitutions at sites 145 and 275/276). A more detailed analysis, removing the individual-specific mean titer, could still show shared patterns in groups of individuals that are not necessarily defined by the birth cohort.
(2) The authors show that the fraction of sera with a titer below 138 correlates strongly with the inferred growth rate using MLR. However, the authors also note that there exists a strong correlation between the MLR growth rate and the number of HA1 mutations. This analysis does not yet show that the titers provide substantially more information about the evolutionary success. The actual relation between the measured titers and fitness is certainly more subtle than suggested by the correlation plot in Figure 5. For example, the clades A/Massachusetts and A/Sydney both have a positive fitness at the beginning of 2023, but A/Massachusetts has substantially higher relative fitness than A/Sydney. The growth inference in Figure 5b does not appear to map that difference, and the antigenic data would give the opposite ranking. Similarly, the clades A/Massachusetts and A/Ontario have both positive relative fitness, as correctly identified by the antigenic ranking, but at quite different times (i.e., in different contexts of competing clades). Other clades, like A/St. Petersburg are assigned high growth and high escape but remain at low frequency throughout. Some mention of these effects not mapped by the analysis may be appropriate.
(3) For the protection profile against the vaccine strains, the authors find for the adult cohort that the highest titer is always against the oldest vaccine strain tested, which is A/Texas/50/2012. However, the adult sera do not show an increase in titer towards older strains, but only a peak at A/Texas. Therefore, it could be that this is a virus-specific effect, rather than a property of the protection profile. Could the authors test with one older vaccine virus (A/Perth/16/2009?) whether this really can be a general property?
Reviewer #2 (Public review):
This is an excellent paper. The ability to measure the immune response to multiple viruses in parallel is a major advancement for the field, which will be relevant across pathogens (assuming the assay can be appropriately adapted). I only have a few comments, focused on maximising the information provided by the sera.
Firstly, one of the major findings is that there is wide heterogeneity in responses across individuals. However, we could expect that individuals' responses should be at least correlated across the viruses considered, especially when individuals are of a similar age. It would be interesting to quantify the correlation in responses as a function of the difference in ages between pairs of individuals. I am also left wondering what the potential drivers of the differences in responses are, with age being presumably key. It would be interesting to explore individual factors associated with responses to specific viruses (beyond simply comparing adults versus children).
Relatedly, is the phylogenetic distance between pairs of viruses associated with similarity in responses?
Figure 5C is also a really interesting result. To be able to predict growth rates based on titers in the sera is fascinating. As touched upon in the discussion, I suspect it is really dependent on the representativeness of the sera of the population (so, e.g., if only elderly individuals provided sera, it would be a different result than if only children provided samples). It may be interesting to compare different hypotheses - so e.g., see if a population-weighted titer is even better correlated with fitness - so the contribution from each individual's titer is linked to a number of individuals of that age in the population. Alternatively, maybe only the titers in younger individuals are most relevant to fitness, etc.
In Figure 6, the authors lump together individuals within 10-year age categories - however, this is potentially throwing away the nuances of what is happening at individual ages, especially for the children, where the measured viruses cross different groups. I realise the numbers are small and the viruses only come from a small numbers of years, however, it may be preferable to order all the individuals by age (y-axis) and the viral responses in ascending order (x-axis) and plot the response as a heatmap. As currently plotted, it is difficult to compare across panels
Reviewer #3 (Public review):
The authors use high-throughput neutralisation data to explore how different summary statistics for population immune responses relate to strain success, as measured by growth rate during the 2023 season. The question of how serological measurements relate to epidemic growth is an important one, and I thought the authors present a thoughtful analysis tackling this question, with some clear figures. In particular, they found that stratifying the population based on the magnitude of their antibody titres correlates more with strain growth than using measurements derived from pooled serum data. However, there are some areas where I thought the work could be more strongly motivated and linked together. In particular, how the vaccine responses in US and Australia in Figures 6-7 relate to the earlier analysis around growth rates, and what we would expect the relationship between growth rate and population immunity to be based on epidemic theory.
Author response:
Public Reviews:
Reviewer #1 (Public review):
The authors present exciting new experimental data on the antigenic recognition of 78 H3N2 strains (from the beginning of the 2023 Northern Hemisphere season) against a set of 150 serum samples. The authors compare protection profiles of individual sera and find that the antigenic effect of amino acid substitutions at specific sites depends on the immune class of the sera, differentiating between children and adults. Person-to-person heterogeneity in the measured titers is strong, specifically in the group of children's sera. The authors find that the fraction of sera with low titers correlates with the inferred growth rate using maximum likelihood regression (MLR), a correlation that does not hold for pooled sera. The authors then measure the protection profile of the sera against historical vaccine strains and find that it can be explained by birth cohort for children. Finally, the authors present data comparing pre- and post- vaccination protection profiles for 39 (USA) and 8 (Australia) adults. The data shows a cohort-specific vaccination effect as measured by the average titer increase, and also a virus-specific vaccination effect for the historical vaccine strains. The generated data is shared by the authors and they also note that these methods can be applied to inform the bi-annual vaccine composition meetings, which could be highly valuable.
Thanks for this nice summary of our paper.
The following points could be addressed in a revision:
(1) The authors conclude that much of the person-to-person and strain-to-strain variation seems idiosyncratic to individual sera rather than age groups. This point is not yet fully convincing. While the mean titer of an individual may be idiosyncratic to the individual sera, the strain-to-strain variation still reveals some patterns that are consistent across individuals (the authors note the effects of substitutions at sites 145 and 275/276). A more detailed analysis, removing the individual-specific mean titer, could still show shared patterns in groups of individuals that are not necessarily defined by the birth cohort.
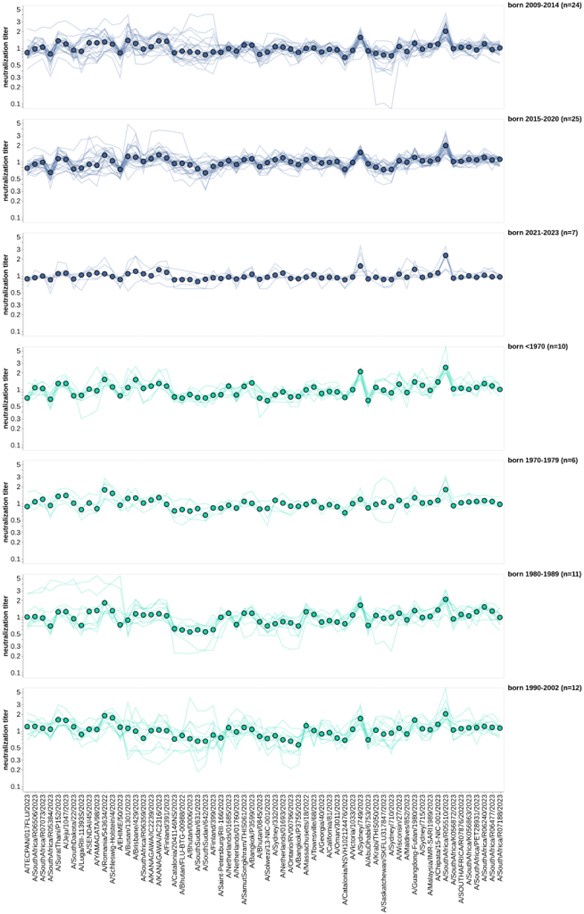
As the reviewer suggests, we normalized the titers for all sera to the geometric mean titer for each individual in the US-based pre-vaccination adults and children. This is only for the 2023-circulating viral strains. We then faceted these normalized titers by the same age groups we used in Figure 6, and the resulting plot is shown below. Although there are differences among virus strains (some are better neutralized than others), there are not obvious age group-specific patterns (eg, the trends in the two facets are similar). To us this suggests that at least for these relatively closely related recent H3N2 strains, the strain-to-strain variation does not obviously segregate by age group. Obviously, it is possible (we think likely) that there would be more obvious age-group specific trends if we looked at a larger swath of viral strains covering a longer time range (eg, over decades of influenza evolution). We plan to add the new plots shown below to a supplemental figure in the revised manuscript.
Author response image 1.
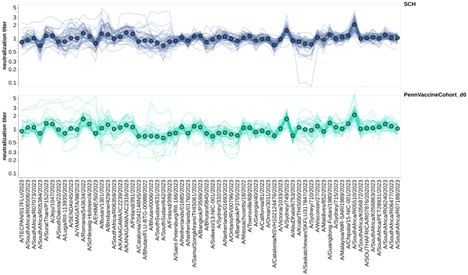
Author response image 2.
(2) The authors show that the fraction of sera with a titer below 138 correlates strongly with the inferred growth rate using MLR. However, the authors also note that there exists a strong correlation between the MLR growth rate and the number of HA1 mutations. This analysis does not yet show that the titers provide substantially more information about the evolutionary success. The actual relation between the measured titers and fitness is certainly more subtle than suggested by the correlation plot in Figure 5. For example, the clades A/Massachusetts and A/Sydney both have a positive fitness at the beginning of 2023, but A/Massachusetts has substantially higher relative fitness than A/Sydney. The growth inference in Figure 5b does not appear to map that difference, and the antigenic data would give the opposite ranking. Similarly, the clades A/Massachusetts and A/Ontario have both positive relative fitness, as correctly identified by the antigenic ranking, but at quite different times (i.e., in different contexts of competing clades). Other clades, like A/St. Petersburg are assigned high growth and high escape but remain at low frequency throughout. Some mention of these effects not mapped by the analysis may be appropriate.
Thanks for the nice summary of our findings in Figure 5. However, the reviewer is misreading the growth charts when they say that A/Massachusetts/18/2022 has a substantially higher fitness than A/Sydney/332/2023. Figure 5a shows the frequency trajectory of different variants over time. While A/Massachusetts/18/2022 reaches a higher frequency than A/Sydney/332/2023, the trajectory is similar and the reason that A/Massachusetts/18/2022 reached a higher max frequency is that it started at a higher frequency at the beginning of 2023. The MLR growth rate estimates differ from the maximum absolute frequency reached: instead, they reflect how rapidly each strain grows relative to others. In fact, A/Massachusetts/18/2022 and A/Sydney/332/2023 have similar growth rates, as shown in Supplementary Figure 6b. Similarly, A/Saint-Petersburg/RII-166/2023 starts at a low initial frequency but then grows even as A/Massachusetts/18/2022 and A/Sydney/332/2023 are declining, and so has a higher growth rate than both of those. In the revised manuscript, we will clarify how viral growth rates are estimated from frequency trajectories, and how growth rate differs from max frequency.
(3) For the protection profile against the vaccine strains, the authors find for the adult cohort that the highest titer is always against the oldest vaccine strain tested, which is A/Texas/50/2012. However, the adult sera do not show an increase in titer towards older strains, but only a peak at A/Texas. Therefore, it could be that this is a virus-specific effect, rather than a property of the protection profile. Could the authors test with one older vaccine virus (A/Perth/16/2009?) whether this really can be a general property?
We are interested in studying immune imprinting more thoroughly using sequencing-based neutralization assays, but we note that the adults in the cohorts we studied would have been imprinted with much older strains than included in this library. As this paper focuses on the relative fitness of contemporary strains with minor secondary points regarding imprinting, these experiments are beyond the scope of this study. We’re excited for future work (from our group or others) to explore these points by making a new virus library with strains from multiple decades of influenza evolution.
Reviewer #2 (Public review):
This is an excellent paper. The ability to measure the immune response to multiple viruses in parallel is a major advancement for the field, which will be relevant across pathogens (assuming the assay can be appropriately adapted). I only have a few comments, focused on maximising the information provided by the sera.
Thanks very much!
Firstly, one of the major findings is that there is wide heterogeneity in responses across individuals. However, we could expect that individuals' responses should be at least correlated across the viruses considered, especially when individuals are of a similar age. It would be interesting to quantify the correlation in responses as a function of the difference in ages between pairs of individuals. I am also left wondering what the potential drivers of the differences in responses are, with age being presumably key. It would be interesting to explore individual factors associated with responses to specific viruses (beyond simply comparing adults versus children).
We’re excited by this idea! We plan to include these analyses in our revised pre-print.
Relatedly, is the phylogenetic distance between pairs of viruses associated with similarity in responses?
As above, we like this idea and our revised pre-print will include this analysis.
Figure 5C is also a really interesting result. To be able to predict growth rates based on titers in the sera is fascinating. As touched upon in the discussion, I suspect it is really dependent on the representativeness of the sera of the population (so, e.g., if only elderly individuals provided sera, it would be a different result than if only children provided samples). It may be interesting to compare different hypotheses - so e.g., see if a population-weighted titer is even better correlated with fitness - so the contribution from each individual's titer is linked to a number of individuals of that age in the population. Alternatively, maybe only the titers in younger individuals are most relevant to fitness, etc.
We’re very interested in these analyses, but suggest they may be better explored in subsequent works that could sample more children, teenagers and adults across age groups. Our sera set, as the reviewer suggests, may be under-powered to perform the proposed analysis on subsetted age groups of our larger age cohorts.
In Figure 6, the authors lump together individuals within 10-year age categories - however, this is potentially throwing away the nuances of what is happening at individual ages, especially for the children, where the measured viruses cross different groups. I realise the numbers are small and the viruses only come from a small numbers of years, however, it may be preferable to order all the individuals by age (y-axis) and the viral responses in ascending order (x-axis) and plot the response as a heatmap. As currently plotted, it is difficult to compare across panels
This is a good suggestion, and a revised pre-print will include heatmaps of the different cohorts, ordered by ages of individuals.
Reviewer #3 (Public review):
The authors use high-throughput neutralisation data to explore how different summary statistics for population immune responses relate to strain success, as measured by growth rate during the 2023 season. The question of how serological measurements relate to epidemic growth is an important one, and I thought the authors present a thoughtful analysis tackling this question, with some clear figures. In particular, they found that stratifying the population based on the magnitude of their antibody titres correlates more with strain growth than using measurements derived from pooled serum data. However, there are some areas where I thought the work could be more strongly motivated and linked together. In particular, how the vaccine responses in US and Australia in Figures 6-7 relate to the earlier analysis around growth rates, and what we would expect the relationship between growth rate and population immunity to be based on epidemic theory.
Thank you for this nice summary. This reviewer also notes that the text related to figures 6 and 7 are more secondary to the main story presented in figures 3-5. The main motivation for including figures 6 and 7 were to demonstrate the wide-ranging applications of sequencing-based neutralization data, and this can certainly be clarified in minor text revisions.


