Peer review process
Revised: This Reviewed Preprint has been revised by the authors in response to the previous round of peer review; the eLife assessment and the public reviews have been updated where necessary by the editors and peer reviewers.
Read more about eLife’s peer review process.Editors
- Reviewing EditorAnne-Florence BitbolEcole Polytechnique Federale de Lausanne (EPFL), Lausanne, Switzerland
- Senior EditorAleksandra WalczakCNRS, Paris, France
Reviewer #1 (Public review):
The authors present an approach that uses the transformer architecture to model epistasis in deep mutational scanning datasets. This is an original and very interesting idea. Applying the approach to 10 datasets they quantify the contribution of higher order epistasis, showing it varies quite extensively.
Comments on revisions:
The authors have addressed my concerns.
Reviewer #2 (Public review):
Summary:
This paper presents a novel transformer-based neural network model, termed the epistatic transformer, designed to isolate and quantify higher-order epistasis in protein sequence-function relationships. By modifying the multi-head attention architecture, the authors claim they can precisely control the order of specific epistatic interactions captured by the model. The approach is applied to both simulated data and ten diverse experimental deep mutational scanning (DMS) datasets, including full-length proteins. The authors argue that higher-order epistasis, although often modest in global contribution, plays critical roles in extrapolation and capturing distant genotypic effects, especially in multi-peak fitness landscapes.
Strengths:
(1) The study tackles a long-standing question in molecular evolution and protein engineering: "how significant are epistatic interactions beyond pairwise effects?" The question is relevant given the growing availability of large-scale DMS datasets and increasing reliance on machine learning in protein design.
(2) The manuscript includes both simulation and real-data experiments, as well as extrapolation tasks (e.g., predicting distant genotypes, cross-ortholog transfer). These well-rounded evaluations demonstrate robustness and applicability.
(3) The code is made available for reproducibility.
Weaknesses:
(1) The paper mainly compares its transformer models to additive models and occasionally to linear pairwise interaction models. However, other strong baselines exist. For example, the authors should compare baseline methods such as "DANGO: Predicting higher-order genetic interactions". There are many works related to pairwise interaction detection, such as: "Detecting statistical interactions from neural network weights", "shapiq: Shapley interactions for machine learning", and "Error-controlled non-additive interaction discovery in machine learning models".
(2) While the transformer architecture is cleverly adapted, the claim that it allows for "explicit control" and "interpretability" over interaction order may be overstated. Although the 2^M scaling with MHA layers is shown empirically, the actual biological interactions captured by the attention mechanism remain opaque. A deeper analysis of learned attention maps or embedding similarities (e.g., visualizations, site-specific interaction clusters) could substantiate claims about interpretability.
(3) The distinction between nonspecific (global) and specific epistasis is central to the modeling framework, yet it remains conceptually underdeveloped. While a sigmoid function is used to model global effects, it's unclear to what extent this functional form suffices. The authors should justify this choice more rigorously or at least acknowledge its limitations and potential implications.
(4) The manuscript refers to "pairwise", "3-4-way", and ">4-way" interactions without always clearly defining the boundaries of these groupings or how exactly the order is inferred from transformer layer depth. This can be confusing to readers unfamiliar with the architecture or with statistical definitions of interaction order. The authors should clarify terminology consistently. Including a visual mapping or table linking a number of layers to the maximum modeled interaction order could be helpful.
Comments for the revision:
I want to thank the authors for their efforts in revising the manuscript. Most of the concerns raised in the initial review have been adequately addressed.
However, one important issue remains. I previously asked the authors to benchmark their method against stronger baselines. The authors declined, arguing that these alternatives are "not directly applicable to the types of analyses." I am not persuaded by this rationale. In my view, these baseline methods target essentially the same underlying problem, and at least some, if not all, should be included in a comparative evaluation (or the manuscript should provide a clearer, more technically grounded explanation of why such comparisons are not feasible or not meaningful).
Reviewer #3 (Public review):
Summary:
Sethi and Zou present a new neural network to study the importance of epistatic interactions in pairs and groups of amino acids to the function of proteins. Their new model is validated on a small simulated data set, and then applied to 10 empirical data sets. Results show that epistatic interactions in groups of amino acids can be important to predict the phenotype of a protein, especially for sequences that are not very similar to the training data.
Strengths:
The manuscript relies on a novel neural network architecture that makes it easy to study specifically the contribution of interactions between 2, 3, 4 or more amino acids. The novel network architecture achieves such a level of interpretability without noticeable performance penalty. The study of 10 different protein families shows that there is variation among protein families in the importance of these interactions, and that higher order interactions are particularly important to predict the phenotypes of distant proteins.
Weaknesses:
The Github repository provides a README file to run a standard pipeline, but a user will need to go through the code to actually know what that pipeline is doing.
Author response:
The following is the authors’ response to the original reviews.
Public Reviews:
Reviewer #1 (Public review):
The authors present an approach that uses the transformer architecture to model epistasis in deep mutational scanning datasets. This is an original and very interesting idea. Applying the approach to 10 datasets, they quantify the contribution of higher-order epistasis, showing that it varies quite extensively.
Suggestions:
(1) The approach taken is very interesting, but it is not particularly well placed in the context of recent related work. MAVE-NN, LANTERN, and MoCHI are all approaches that different labs have developed for inferring and fitting global epistasis functions to DMS datasets. MoCHI can also be used to infer multidimensional global epistasis (for example, folding and binding energies) and also pairwise (and higher order) specific interaction terms (see 10.1186/s13059-024-03444-y and 10.1371/journal.pcbi.1012132). It doesn't distract from the current work to better introduce these recent approaches in the introduction. A comparison of the different capabilities of the methods may also be helpful. It may also be interesting to compare the contributions to variance of 1st, 2nd, and higher-order interaction terms estimated by the Epistatic transformer and MoCHI.
We thank the reviewer for the very thoughtful suggestion.
Although these methods are conceptually related to our method, none of them can be realistically used to perform the type of inference we have done in the paper on most the datasets we used, as they all require explicitly enumerating the large number of interaction terms.
We have included new text (Line 65-74) in the introduction to discuss the advantages and disadvantages of these models. We believe this has made our contribution better placed in the broader context of the field.
(2) https://doi.org/10.1371/journal.pcbi.1004771 is another useful reference that relates different metrics of epistasis, including the useful distinction between biochemical/background-relative and backgroundaveraged epistasis.
We have included this very relevant reference in the introduction. We also pointed out the limitation of these class of methods is that they typically require near combinatorically complete datasets and often have to rely on regularized regression to infer the parameters, making the inferred model parameters disconnected from their theoretical expectations. Line 49-56.
(3) Which higher-order interactions are more important? Are there any mechanistic/structural insights?
We thank the reviewer for pointing out this potential improvement. We have now included a detailed analysis of the GRB2-SH3 abundance landscape in the final section of the results. In particular, we estimated the contribution of individual amino acid sites to different orders (pairwise, 3-4th order, 4-8th order) of epistasis and discuss our finding in the context of the 3D structure of this domain. We also analyzed the sparsity of specific interactions among subsets of sites.
Please see Results section “Architecture of specific epistasis for GRB2-SH3 abundance.”
Reviewer #2 (Public review):
Summary:
This paper presents a novel transformer-based neural network model, termed the epistatic transformer, designed to isolate and quantify higher-order epistasis in protein sequence-function relationships. By modifying the multi-head attention architecture, the authors claim they can precisely control the order of specific epistatic interactions captured by the model. The approach is applied to both simulated data and ten diverse experimental deep mutational scanning (DMS) datasets, including full-length proteins. The authors argue that higher-order epistasis, although often modest in global contribution, plays critical roles in extrapolation and capturing distant genotypic effects, especially in multi-peak fitness landscapes.
Strengths:
(1) The study tackles a long-standing question in molecular evolution and protein engineering: "how significant are epistatic interactions beyond pairwise effects?" The question is relevant given the growing availability of large-scale DMS datasets and increasing reliance on machine learning in protein design.
(2) The manuscript includes both simulation and real-data experiments, as well as extrapolation tasks (e.g., predicting distant genotypes, cross-ortholog transfer). These well-rounded evaluations demonstrate robustness and applicability.
(3) The code is made available for reproducibility.
We thank the reviewer for the positive feedback.
Weaknesses:
(1) The paper mainly compares its transformer models to additive models and occasionally to linear pairwise interaction models. However, other strong baselines exist. For example, the authors should compare baseline methods such as "DANGO: Predicting higher-order genetic interactions." There are many works related to pairwise interaction detection, such as: "Detecting statistical interactions from neural network weights", "shapiq: Shapley interactions for machine learning", and "Error-controlled nonadditive interaction discovery in machine learning models."
We thank the reviewer for this very helpful comment. These references are indeed conceptually quite similar to our framework. Although they are not directly applicable to the types of analyses we performed in this paper (partitioning contribution of epistasis into different interaction orders in terms of variance components), we have included a discussion of these methods in the introduction (Line 70-74). We believe this helps better situate our method within the broader conceptual context of interpreting machine learning models for epistatic interactions.
(2) While the transformer architecture is cleverly adapted, the claim that it allows for "explicit control" and "interpretability" over interaction order may be overstated. Although the 2^M scaling with MHA layers is shown empirically, the actual biological interactions captured by the attention mechanism remain opaque. A deeper analysis of learned attention maps or embedding similarities (e.g., visualizations, site-specific interaction clusters) could substantiate claims about interpretability.
Again, we thank the reviewer for the thoughtful comment. We have addressed this comment together with a related comment by Reviewer1 by including a detailed analysis of the GRB2-SH3 landscape using a marginal epistasis framework, where we quantified the contribution of individual sites to different orders of epistasis as well as the sparsity of epistatic interactions. We also present these results in the context of the structure of this protein. Please see Results section “Architecture of specific epistasis for GRB2-SH3 abundance.”
(3) The distinction between nonspecific (global) and specific epistasis is central to the modeling framework, yet it remains conceptually underdeveloped. While a sigmoid function is used to model global effects, it's unclear to what extent this functional form suffices. The authors should justify this choice more rigorously or at least acknowledge its limitations and potential implications.
We agree that the under parameterization of the simple sigmoid function could be be potentially confounding. We did compare different choices of functional forms for modeling global epistasis. Overall, we found that there is no difference between a simple sigmoid function with four trainable parameters and the more complex version (sum of multiple sigmoid functions, used by popular methods such as MAVENN). Therefore, all results we presented in the paper were based on the model with a single scalable sigmoid function.
We have added relevant text; line 153-158. We have also included side-by-side comparisons of the model performance for the GRB-abundance and the AAV2 dataset to corroborate this claim (Supplemental Figure 1).
(4) The manuscript refers to "pairwise", "3-4-way", and ">4-way" interactions without always clearly defining the boundaries of these groupings or how exactly the order is inferred from transformer layer depth. This can be confusing to readers unfamiliar with the architecture or with statistical definitions of interaction order. The authors should clarify terminology consistently. Including a visual mapping or table linking a number of layers to the maximum modeled interaction order could be helpful.
We thank the reviewer for the thoughtful suggestion. We have rewritten the description of our metrics for measuring the importance of "pairwise", "3-4-way", and ">4-way" interactions; Line 232-239.
We have also added a table to improve clarity, as suggested; Table 2.
Reviewer #3 (Public review):
Summary:
Sethi and Zou present a new neural network to study the importance of epistatic interactions in pairs and groups of amino acids to the function of proteins. Their new model is validated on a small simulated data set and then applied to 10 empirical data sets. Results show that epistatic interactions in groups of amino acids can be important to predict the function of a protein, especially for sequences that are not very similar to the training data.
Strengths:
The manuscript relies on a novel neural network architecture that makes it easy to study specifically the contribution of interactions between 2, 3, 4, or more amino acids. The study of 10 different protein families shows that there is variation among protein families.
Weaknesses:
The manuscript is good overall, but could have gone a bit deeper by comparing the new architecture to standard transformers, and by investigating whether differences between protein families explain some of the differences in the importance of interactions between amino acids. Finally, the GitHub repository needs some more information to be usable.
We thank the reviewer for the thoughtful comments. We have listed our response below in the “Recommendations for the authors” section.
Recommendations for the authors:
Reviewer #1 (Recommendations for the authors):
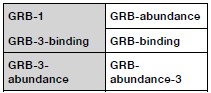
Some of the dataset labels are confusing. For example, GRB is actually the protein GRB2 and more specifically just one of the two SH3 domains from GRB2 (called GRB2-SH3 in Faure et al.).
We thank the reviewer for catching this. Our original naming of the datasets followed the designation of library number in the Faure et al paper (which constructed 3 variant libraries and performed different assays on them). To avoid confusion (and also save space in the figure titles), we have now renamed the datasets using this mapping:
Author response table 1.
Reviewer #3 (Recommendations for the authors):
(1) What is the cost of the interpretability of the model? It would be interesting to evaluate how a standard transformer, complete with its many non-linearities, performs on the simulated 13-position data, using the r2 metric. This is important as the last sentence of the discussion seems to suggest that the model proposed by the authors could be used in other contexts, where perhaps interpretability would be less important.
We thank the reviewer for this suggestion. We have run a generic transformer model on the GRBabundance and AAV2 datasets. Overall, we found minimal difference between the generic model and our interpretable model, suggesting that fitting the interpretable transformer does not incur significant cost in performance.
We have included a side-by-side comparison of the performance of the generic transformer and our three-layer model in Supplemental Figure 5 and a discussion of this finding in Line 256-259.
(2) The 10 data sets analyzed by the authors differ in their behaviour. I was wondering whether the proteins have different characteristics, beyond the number and distribution of mutants in the data sets. For instance, do high-order interactions play a bigger role in longer proteins, in proteins with more secondary structures, in more hydrophobic proteins?
We fully agree that this is a highly relevant question. Unfortunately, the paucity of datasets suitable for the type of analyses we performed in the paper limit our ability to draw general conclusions. Furthermore, the differences in genotype distribution among the 10 datasets may be the main driving factor in the behaviors of the models.
We included our thoughts on this issue in the discussion (Line 477-481).
We will definitely revisit this question if this type of high-order combinatorial DMS data becomes more available in the (hopefully) near future.
(3) Although the code appears to be available in the repository, there is no information about the content of the different folders, about what the different scripts do, or about how to reproduce the article's results. More work should be done to clarify it all.
Thank you for pointing this out. We have substantially improved our github repository and included many annotations for reproducibility.
(4) Typos and minor comments:
(a) p3 "a multi-peak fitness landscapes": landscape.
(b) p3 "Here instead of directly fitting the the regression coefficients in Eq. 2": remove 'the'.
(c) p3 "neural network architectures do not allow us to control the highest order of specific epistasis": a word is missing.
(d) p6 "up to 1,926, 3,014, and 4,102 parameters, respectively-all smaller than the size of the training dataset": it's not very clear what size of the dataset means: number of example sequences?
(e) p6 "This results confirm": This result confirms.
(f) p6 "to the convergence of of the variance components of the model landscape to the ground truth.": remove 'of'.
(g) p7 "to characterize the importance higher-order interactions": the importance of.
(h) p7 "The improvement varies across datasets and range": and ranges.
(i) p9 "over the pairwise model is due to the its ability": remove 'the'.
(j) p13 "This results suggest that pairwise": result suggests.
(k) p13 "although the role assessed by prediction for randomly sampled genotypes seems moderate": sampled. Also, I'm not sure I understand this part of the sentence: what results are used to support this claim? It's not 6b, which is only based on the mutational model.
This is in Supplemental Figure 7.
(l) p13 "potentially by modeling how the these local effects": remove the.
(m) p13 "We first note that the the higher-order models": remove the.
(n) p15 "M layers of MHA leads to a models that strictly": lead to a model.
(o) Supp Figure 1: "Solid lines shows the inverse": show.
(p) Supp p 10 "on 90% of randomly sample data": sampled.
(q) Supp p11 "Next, assume that Eq. 5 is true for m > 0. We need to show that Eq. 5 is also true for m + 1.": shouldn't it be m>=0 ? It seems important to start the recursive argument.
Good catch.
(r) Supp p11 "Since the sum in line 9 run through subsets": runs.
(s) Supp p11 "we can further simplify Eq. 11 it to": remove it.
We have fixed all these problems. We very much appreciate the reviewer’s attention.


