Peer review process
Not revised: This Reviewed Preprint includes the authors’ original preprint (without revision), an eLife assessment, public reviews, and a provisional response from the authors.
Read more about eLife’s peer review process.Editors
- Reviewing EditorHugo BellenBaylor College of Medicine, Houston, United States of America
- Senior EditorMa-Li WongState University of New York Upstate Medical University, Syracuse, United States of America
Reviewer #1 (Public review):
Summary:
This manuscript by Lin et al. presents a timely, technically strong study that builds patient-specific midbrain-like organoids (MLOs) from hiPSCs carrying clinically relevant GBA1 mutations (L444P/P415R and L444P/RecNcil). The authors comprehensively characterize nGD phenotypes (GCase deficiency, GluCer/GluSph accumulation, altered transcriptome, impaired dopaminergic differentiation), perform CRISPR correction to produce an isogenic line, and test three therapeutic modalities (SapC-DOPS-fGCase nanoparticles, AAV9-GBA1, and SRT with GZ452). The model and multi-arm therapeutic evaluation are important advances with clear translational value.
My overall recommendation is that the work undergo a major revision to address the experimental and interpretive gaps listed below.
Strengths:
(1) Human, patient-specific midbrain model: Use of clinically relevant compound heterozygous GBA1 alleles (L444P/P415R and L444P/RecNcil) makes the model highly relevant to human nGD and captures patient genetic context that mouse models often miss.
(2) Robust multi-level phenotyping: Biochemical (GCase activity), lipidomic (GluCer/GluSph by UHPLC-MS/MS), molecular (bulk RNA-seq), and histological (TH/FOXA2, LAMP1, LC3) characterization are thorough and complementary.
(3) Use of isogenic CRISPR correction: Generating an isogenic line (WT/P415R) and demonstrating partial rescue strengthens causal inference that the GBA1 mutation drives many observed phenotypes.
(4) Parallel therapeutic testing in the same human platform: Comparing enzyme delivery (SapC-DOPS-fGCase), gene therapy (AAV9-GBA1), and substrate reduction (GZ452) within the same MLO system is an elegant demonstration of the platform's utility for preclinical evaluation.
(5) Good methodological transparency: Detailed protocols for MLO generation, editing, lipidomics, and assays allow reproducibility
Weaknesses:
(1) Limited genetic and biological replication
(a) Single primary disease line for core mechanistic claims. Most mechanistic data derive from GD2-1260 (L444P/P415R); GD2-10-257 (L444P/RecNcil) appears mainly in therapeutic experiments. Relying primarily on one patient line risks conflating patient-specific variation with general nGD mechanisms.
(b) Unclear biological replicate strategy. It is not always explicit how many independent differentiations and organoid batches were used (biological replicates vs. technical fields of view).
(c) A significant disadvantage of employing brain organoids is the heterogeneity during induction and potential low reproducibility. In this study, it is unclear how many independent differentiation batches were evaluated and, for each test (for example, immunofluorescent stain and bulk RNA-seq), how many organoids from each group were used. Please add a statement accordingly and show replicates to verify consistency in the supplementary data.
(d) Isogenic correction is partial. The corrected line is WT/P415R (single-allele correction); residual P415R complicates the interpretation of "full" rescue and leaves open whether the remaining pathology is due to incomplete correction or clonal/epigenetic effects.
(e) The authors tested week 3, 4, 8, 15, and 28 old organoids in different settings. However, systematic markers of maturation should be analyzed, and different maturation stages should be compared, for example, comparing week 8 organoids to week 28 organoids, with immunofluorescent marker staining and bulk RNAseq.
(f) The manuscript frequently refers to Wnt signaling dysregulation as a major finding. However, experimental validation is limited to transcriptomic data. Functional tests, such as the use of Wnt agonist/inhibitor, are needed to support this claim (see below).
(g) Suggested fixes/experiments
Add at least one more independent disease hiPSC line (or show expanded analysis from GD2-10-257) for key mechanistic endpoints (lipid accumulation, transcriptomics, DA markers)
Generate and analyze a fully corrected isogenic WT/WT clone (or a P415R-only line) if feasible; at minimum, acknowledge this limitation more explicitly and soften claims.
Report and increase independent differentiations (N = biological replicates) and present per-differentiation summary statistics.
(2) Mechanistic validation is insufficient
(a) RNA-seq pathways (Wnt, mTOR, lysosome) are not functionally probed. The manuscript shows pathway enrichment and some protein markers (p-4E-BP1) but lacks perturbation/rescue experiments to link these pathways causally to the DA phenotype.
(b) Autophagy analysis lacks flux assays. LC3-II and LAMP1 are informative, but without flux assays (e.g., bafilomycin A1 or chloroquine), one cannot distinguish increased autophagosome formation from decreased clearance.
(c) Dopaminergic dysfunction is superficially assessed. Dopamine in the medium and TH protein are shown, but no neuronal electrophysiology, synaptic marker co-localization, or viability measures are provided to demonstrate functional recovery after therapy.
(d) Suggested fixes/experiments
Perform targeted functional assays:
(i) Wnt reporter assays (TOP/FOP flash) and/or treat organoids with Wnt agonists/antagonists to test whether Wnt modulation rescues DA differentiation.
(ii)Test mTOR pathway causality using mTOR inhibitors (e.g., rapamycin) or 4E-BP1 perturbation and assay effects on DA markers and autophagy.
Include autophagy flux assessment (LC3 turnover with bafilomycin), and measure cathepsin activity where relevant.
Add at least one functional neuronal readout: calcium imaging, MEA recordings, or synaptic marker quantification (e.g., SYN1, PSD95) together with TH colocalization.
(3) Therapeutic evaluation needs greater depth and standardization
(a) Short windows and limited durability data. SapC-DOPS and AAV9 experiments range from 48 hours to 3 weeks; longer follow-up is needed to assess durability and whether biochemical rescue translates into restored neuronal function.
(b) Dose-response and biodistribution are under-characterized. AAV injection sites/volumes are described, but transduction efficiency, vg copies per organoid, cell-type tropism quantification, and SapC-DOPS penetration/distribution are not rigorously quantified.
(c) Specificity controls are missing. For SapC-DOPS, inclusion of a non-functional enzyme control (or heat-inactivated fGCase) would rule out non-specific nanoparticle effects. For AAV, assessment of off-target expression and potential cytotoxicity is needed.
(d) Comparative efficacy lacking. It remains unclear which modality is most effective in the long term and in which cellular compartments.
(e) Suggested fixes/experiments
Extend follow-up (e.g., 6+ weeks) after AAV/SapC dosing and evaluate DA markers, electrophysiology, and lipid levels over time.
Quantify AAV transduction by qPCR for vector genomes and by cell-type quantification of GFP+ cells (neurons vs astrocytes vs progenitors).
Include SapC-DOPS control nanoparticles loaded with an inert protein and/or fluorescent cargo quantitation to show distribution and uptake kinetics.
Provide head-to-head comparative graphs (activity, lipid clearance, DA restoration, and durability) with statistical tests.
(4) Model limitations not fully accounted for in interpretation
(a) Absence of microglia and vasculature limits recapitulation of neuroinflammatory responses and drug penetration, both of which are important in nGD. These absences could explain incomplete phenotypic rescues and must be emphasized when drawing conclusions about therapeutic translation.
(b) Developmental vs degenerative phenotype conflation. Many phenotypes appear during differentiation (patterning defects). The manuscript sometimes interprets these as degenerative mechanisms; the distinction must be clarified.
(c) Suggested fixes
Tone down the language throughout (Abstract/Results/Discussion) to avoid overstatement that MLOs fully recapitulate nGD neuropathology.
Add plans or pilot data (if available) for microglia incorporation or vascularization to indicate how future work will address these gaps.
(5) Statistical and presentation issues
(a) Missing or unclear sample sizes (n). For organoid-level assays, report the number of organoids and the number of independent differentiations.
(b) Statistical assumptions not justified. Tests assume normality; where sample sizes are small, consider non-parametric tests and report exact p-values.
(c) Quantification scope. Many image quantifications appear to be from selected fields of view, which are then averaged across organoids and differentiations.
(d) RNA-seq QC and deposition. Provide mapping rates, batch correction details, and ensure the GEO accession is active. Include these in Methods/Supplement.
(e) Suggested fixes
Add a table summarizing biological replicates, technical replicates, and statistical tests used for each figure panel.
Recompute statistics where appropriate (non-parametric if N is small) and report effect sizes and confidence intervals.
(6) Minor comments and clarifications
(a) The authors should validate midbrain identity further with additional regional markers (EN1, OTX2) and show absence/low expression of forebrain markers (FOXG1) across replicates.
(b) Extracellular dopamine ELISA should be complemented with intracellular dopamine or TH+ neuron counts normalized per organoid or per total neurons.
(c) For CRISPR editing: the authors should report off-target analysis (GUIDE-seq or targeted sequencing of predicted off-targets) or at least in-silico off-target score and sequencing coverage of the edited locus.
(d) It should be clarified as to whether lipidomics normalization is to total protein per organoid or per cell, and include representative LC-MS chromatograms or method QC.
(e) Figure legends should be improved in order to state the number of organoids, the number of differentiations, and the exact statistical tests used (including multiple-comparison corrections).
(f) In the title, the authors state "reveal disease mechanisms", but the studies mainly exhibit functional changes. They should consider toning down the statement.
(7) Recommendations
This reviewer recommends a major revision. The manuscript presents substantial novelty and strong potential impact but requires additional experimental validation and clearer, more conservative interpretation. Key items to address are:
(a) Strengthening genetic and biological replication (additional lines or replicate differentiations).
(b) Adding functional mechanistic validation for major pathways (Wnt/mTOR/autophagy) and providing autophagy flux data.
(c) Including at least one neuronal functional readout (calcium imaging/MEA/patch) to demonstrate functional rescue.
(d) Deepening therapeutic characterization (dose, biodistribution, durability) and including specificity controls.
(e) Improving statistical reporting and explicitly stating biological replicate structure.
Reviewer #2 (Public review):
Sun et al. have developed a midbrain-like organoid (MLO) model for neuronopathic Gaucher disease (nGD). The MLOs recapitulate several features of nGD molecular pathology, including reduced GCase activity, sphingolipid accumulation, and impaired dopaminergic neuron development. They also characterize the transcriptome in the MLO nGD model. CRISPR correction of one of the GBA1 mutant alleles rescues most of the nGD molecular phenotypes. The MLO model was further deployed in proof-of-principle studies of investigational nGD therapies, including SapC-DOPS nanovesicles, AAV9-mediated GBA1 gene delivery, and substrate-reduction therapy (GZ452). This patient-specific 3D model provides a new platform for studying nGD mechanisms and accelerating therapy development. Overall, only modest weaknesses are noted.
Reviewer #3 (Public review):
Summary:
In this study, the authors describe modeling of neuronopathic Gaucher disease (nGD) using midbrain-like organoids (MLOs) derived from hiPSCs carrying GBA1 L444P/P415R or L444P/RecNciI variants. These MLOs recapitulate several disease features, including GCase deficiency, reduced enzymatic activity, lipid substrate accumulation, and impaired dopaminergic neuron differentiation. Correction of the GBA1 L444P variant restored GCase activity, normalized lipid metabolism, and rescued dopaminergic neuronal defects, confirming its pathogenic role in the MLO model. The authors further leveraged this system to evaluate therapeutic strategies, including: (i) SapC-DOPS nanovesicles for GCase delivery, (ii) AAV9-mediated GBA1 gene therapy, and (iii) GZ452, a glucosylceramide synthase inhibitor. These treatments reduced lipid accumulation and ameliorated autophagic, lysosomal, and neurodevelopmental abnormalities.
Strengths:
This manuscript demonstrates that nGD patient-derived MLOs can serve as an additional platform for investigating nGD mechanisms and advancing therapeutic development.
Comments:
(1) It is interesting that GBA1 L444P/P415R MLOs show defects in midbrain patterning and dopaminergic neuron differentiation (Figure 3). One might wonder whether these abnormalities are specific to the combination of L444P and P415R variants or represent a general consequence of GBA1 loss. Do GBA1 L444P/RecNciI (GD2-10-257) MLOs also exhibit similar defects?
(2) In Supplementary Figure 3, the authors examined GCase localization in SapC-DOPS-fGCase-treated nGD MLOs. These data indicate that GCase is delivered to TH⁺ neurons, GFAP⁺ glia, and various other unidentified cell types. In fruit flies, the GBA1 ortholog, Gba1b, is only expressed in glia (PMID: 35857503; 35961319). Neuronally produced GluCer is transferred to glia for GBA1-mediated degradation. These findings raise an important question: in wild-type MLOs, which cell type(s) normally express GBA1? Are they dopaminergic neurons, astrocytes, or other cell types?
(3) The authors may consider switching Figures 2 and 3 so that the differentiation defects observed in nGD MLOs (Figure 3) are presented before the analysis of other phenotypic abnormalities, including the various transcriptional changes (Figure 2).
Author response:
Public Reviews:
Reviewer #1 (Public review):
Summary:
This manuscript by Lin et al. presents a timely, technically strong study that builds patientspecific midbrain-like organoids (MLOs) from hiPSCs carrying clinically relevant GBA1 mutations (L444P/P415R and L444P/RecNcil). The authors comprehensively characterize nGD phenotypes (GCase deficiency, GluCer/GluSph accumulation, altered transcriptome, impaired dopaminergic differentiation), perform CRISPR correction to produce an isogenic line, and test three therapeutic modalities (SapC-DOPS-fGCase nanoparticles, AAV9GBA1, and SRT with GZ452). The model and multi-arm therapeutic evaluation are important advances with clear translational value.
My overall recommendation is that the work undergo a major revision to address the experimental and interpretive gaps listed below.
Strengths:
(1) Human, patient-specific midbrain model: Use of clinically relevant compound heterozygous GBA1 alleles (L444P/P415R and L444P/RecNcil) makes the model highly relevant to human nGD and captures patient genetic context that mouse models often miss.
(2) Robust multi-level phenotyping: Biochemical (GCase activity), lipidomic (GluCer/GluSph by UHPLC-MS/MS), molecular (bulk RNA-seq), and histological (TH/FOXA2, LAMP1, LC3) characterization are thorough and complementary.
(3) Use of isogenic CRISPR correction: Generating an isogenic line (WT/P415R) and demonstrating partial rescue strengthens causal inference that the GBA1 mutation drives many observed phenotypes.
(4) Parallel therapeutic testing in the same human platform: Comparing enzyme delivery (SapC-DOPS-fGCase), gene therapy (AAV9-GBA1), and substrate reduction (GZ452) within the same MLO system is an elegant demonstration of the platform's utility for preclinical evaluation.
(5) Good methodological transparency: Detailed protocols for MLO generation, editing, lipidomics, and assays allow reproducibility
Weaknesses:
(1) Limited genetic and biological replication
(a) Single primary disease line for core mechanistic claims. Most mechanistic data derive from GD2-1260 (L444P/P415R); GD2-10-257 (L444P/RecNcil) appears mainly in therapeutic experiments. Relying primarily on one patient line risks conflating patient-specific variation with general nGD mechanisms.
We thank the reviewer for highlighting the importance of genetic and biological replication. An additional patient-derived iPSC line was included in the manuscript, therefore, our study includes two independent nGD patient-derived iPSC lines, GD2-1260 (GBA1L444P/P415R) and GD2-10-257 (GBA1L444P/RecNcil), both of which carry the severe mutations associated with nGD. These two lines represent distinct genetic backgrounds and were used to demonstrate the consistency of key disease phenotypes (reduced GCase activity, elevated substrate, impaired dopaminergic neuron differentiation, etc.) across different patient’s MLOs. Major experiments (e.g., GCase activity assays, substrate, immunoblotting for DA marker TH, and therapeutic testing with SapC-DOPS-fGCase, AAV9-GBA1) were performed using both patient lines, with results showing consistent phenotypes and therapeutic responses (see Figs. 2-6, and Supplementary Figs. 4-5). To ensure clarity and transparency, a new Supplementary Table 2 summarizes the characterization of both the GD2-1260 and GD2-10-257 lines.
(b) Unclear biological replicate strategy. It is not always explicit how many independent differentiations and organoid batches were used (biological replicates vs. technical fields of view).
Biological replication was ensured in our study by conducting experiments in at least 3 independent differentiations per line, and technical replicates (multiple organoids/fields per batch) were averaged accordingly. We have clarified biological replicates and differentiation in the figure legends.
(c) A significant disadvantage of employing brain organoids is the heterogeneity during induction and potential low reproducibility. In this study, it is unclear how many independent differentiation batches were evaluated and, for each test (for example, immunofluorescent stain and bulk RNA-seq), how many organoids from each group were used. Please add a statement accordingly and show replicates to verify consistency in the supplementary data.
In the revision, we have clarified biological replicates and differentiation in the figure legend in Fig.1E; Fig.2B,2G; Fig.3F, 3G; Fig.4B-C,E,H-J, M-N; Fig.6D; and Fig.7A-C, I.
(d) Isogenic correction is partial. The corrected line is WT/P415R (single-allele correction); residual P415R complicates the interpretation of "full" rescue and leaves open whether the remaining pathology is due to incomplete correction or clonal/epigenetic effects.
We attempted to generate an isogenic iPSC line by correcting both GBA1 mutations (L444P and P415R). However, this was not feasible because GBA1 overlaps with a highly homologous pseudogene (PGBA), which makes precise editing technically challenging. Consequently, only the L444P mutation was successfully corrected, and the resulting isogenic line retains the P415R mutation in a heterozygous state. Because Gaucher disease is an autosomal recessive disorder, individuals carrying a single GBA1 mutation (heterozygous carriers) do not develop clinical symptoms. Therefore, the partially corrected isogenic line, which retains only the P415R allele, represents a clinically relevant carrier model. Consistent with this, our results show that GCase activity was restored to approximately 50% of wild-type levels (Fig.4B-C), supporting the expected heterozygous state. These findings also make it unlikely that the remaining differences observed are due to clonal variation or epigenetic effects.
(e) The authors tested week 3, 4, 8, 15, and 28 old organoids in different settings. However, systematic markers of maturation should be analyzed, and different maturation stages should be compared, for example, comparing week 8 organoids to week 28 organoids, with immunofluorescent marker staining and bulk RNAseq.
We agree that a systematic analysis of maturation stages is essential for validating the MLO model. Our data integrated a longitudinal comparison across multiple developmental windows (Weeks 3 to 28) to characterize the transition from progenitors to mature/functional states for nGD phenotyping and evaluation of therapeutic modalities: 1) DA differentiation (Wks 3 and 8 in Fig. 3): qPCR analysis demonstrated the progression of DA-specific programs. We observed a steady increase in the mature DA neuron marker TH and ASCL1. This was accompanied by a gradual decrease in early floor plate/progenitor markers FOXA2 and PLZF, indicating a successful differentiation path from progenitors to differentiated/mature DA neurons. 2) Glycosphingolipid substrates accumulation (Wks 15 and 28 in Fig 2): To assess late-stage nGD phenotyping, we compared GluCer and GluSph at Week 15 and Week 28. This comparison highlights the progressive accumulation of substrates in nGD MLOs, reflecting the metabolic consequences of the disease at different mature stage. 3) Organoid growth dynamics (Wks 4, 8, and 15 in new Fig. 4): The new Fig. 4 tracks physical maturation through organoid size and growth rates across three key time points, providing a macro-scale verification of consistent development between WT and nGD groups. By comparing these early (Wk 3-8) and late (Wk 15-28) stages, we confirmed that our MLOs transition from a proliferative state to a post-mitotic, specialized neuronal state, satisfied the requirement for comparing distinct maturation stages.
(f) The manuscript frequently refers to Wnt signaling dysregulation as a major finding. However, experimental validation is limited to transcriptomic data. Functional tests, such as the use of Wnt agonist/inhibitor, are needed to support this claim (see below).
We agree that the suggested experiments could provide additional mechanistic insights into this study and will consider them in future work.
(g) Suggested fixes / experiments
Add at least one more independent disease hiPSC line (or show expanded analysis from GD2-10-257) for key mechanistic endpoints (lipid accumulation, transcriptomics, DA markers).
Additional line iPSC GD2-10-257 derived MLO was included in the manuscript. This was addressed above [see response to Weaknesses (1)-a].
Generate and analyze a fully corrected isogenic WT/WT clone (or a P415R-only line) if feasible; at minimum, acknowledge this limitation more explicitly and soften claims.
We attempted to generate an isogenic iPSC line by correcting both GBA1 mutations (L444P and P415R). However, this was unsuccessful because the GBA1 gene overlaps with a pseudogene (PGBA) located 16 kb downstream of GBA1, which shares 96-98% sequence similarity with GBA1 (Ref#1, #2), which complicates precise editing. GBA1 is shorter (~5.7 kb) than PGBA (~7.6 kb). The primary exonic difference between GBA1 and PGBA is a 55-bp deletion in exon 9 of the pseudogene. As a result, the isogenic line we obtained carries only the P415R mutation, and L444P was corrected to the normal sequence. We have included this limitation in the Methods as “This gene editing strategy is expected to also target the GBA1 pseudogene due to the identical target sequence, which limits the gene correction on certain mutations (e.g., P415R)”.
References:
(1) Horowitz M., Wilder S., Horowitz Z., Reiner O., Gelbart T., Beutler E. The human glucocerebrosidase gene and pseudogene: structure and evolution. Genomics (1989). 4, 87–96. doi:10.1016/0888-7543(89)90319-4
(2) Woo EG, Tayebi N, Sidransky E. Next-Generation Sequencing Analysis of GBA1: The Challenge of Detecting Complex Recombinant Alleles. Front Genet. (2021). 12:684067. doi:10.3389/fgene.2021.684067. PMCID: PMC8255797.
Report and increase independent differentiations (N = biological replicates) and present per-differentiation summary statistics.
This was addressed above [see response to Weaknesses (1)-b, (1)-c].
(2) Mechanistic validation is insufficient
(a) RNA-seq pathways (Wnt, mTOR, lysosome) are not functionally probed. The manuscript shows pathway enrichment and some protein markers (p-4E-BP1) but lacks perturbation/rescue experiments to link these pathways causally to the DA phenotype.
(b) Autophagy analysis lacks flux assays. LC3-II and LAMP1 are informative, but without flux assays (e.g., bafilomycin A1 or chloroquine), one cannot distinguish increased autophagosome formation from decreased clearance.
(c) Dopaminergic dysfunction is superficially assessed. Dopamine in the medium and TH protein are shown, but no neuronal electrophysiology, synaptic marker co-localization, or viability measures are provided to demonstrate functional recovery after therapy.
(d) Suggested fixes/experiments
Perform targeted functional assays:
(i) Wnt reporter assays (TOP/FOP flash) and/or treat organoids with Wnt agonists/antagonists to test whether Wnt modulation rescues DA differentiation.
(ii) Test mTOR pathway causality using mTOR inhibitors (e.g., rapamycin) or 4E-BP1 perturbation and assay effects on DA markers and autophagy.
Include autophagy flux assessment (LC3 turnover with bafilomycin), and measure cathepsin activity where relevant.
Add at least one functional neuronal readout: calcium imaging, MEA recordings, or synaptic marker quantification (e.g., SYN1, PSD95) together with TH colocalization.
We thank the reviewer for these valuable suggestions. We agree that the suggested experiments could provide additional mechanistic insights into this study and will consider them in future work. Importantly, the primary conclusions of our manuscript, that GBA1 mutations in nGD MLOs resulted in nGD pathologies such as diminished enzymatic function, accumulation of lipid substrates, widespread transcriptomic changes, and impaired dopaminergic neuron differentiation, which can be corrected by several therapeutic strategies in this study, are supported by the evidence presented. The suggested experiments represent an important direction for future research using brain organoids.
(3) Therapeutic evaluation needs greater depth and standardization
(a) Short windows and limited durability data. SapC-DOPS and AAV9 experiments range from 48 hours to 3 weeks; longer follow-up is needed to assess durability and whether biochemical rescue translates into restored neuronal function.
We agree with the reviewer. Because this is a proof-of-principle study, the treatment was designed within a short time window. Long-term studies with more comprehensive outcome assessments will be conducted in future work.
(b) Dose-response and biodistribution are under-characterized. AAV injection sites/volumes are described, but transduction efficiency, vg copies per organoid, cell-type tropism quantification, and SapC-DOPS penetration/distribution are not rigorously quantified.
We appreciate the reviewer’s concerns. This study was intended to demonstrate the feasibility and initial response of MLOs to AAV therapy. A comprehensive evaluation of AAV biodistribution will be considered in future studies.
The penetration and distribution of SapC-DOPS have been extensively characterized in prior studies. In vivo biodistribution of SapC–DOPS coupled CellVue Maroon, a fluorescent cargo, was examined in mice bearing human tumor xenografts using real-time fluorescence imaging, where CellVue Maroon fluorescence in tumor remained for 48 hours (Ref. #3: Fig. 4B, mouse 1), 100 hours (Ref. #4: Fig. 5), up to 216 hours (Ref. #5: Fig. 3). Uptake kinetics were also demonstrated in cells, with flow cytometry quantification showing that fluorescent cargo coupled SapC-DOPS nanovesicles, were incorporated into human brain tumor cell membranes within minutes and remained stably incorporated into the cells for up to one hour (Ref. # 6: Fig. 1a and Fig. 1b). Building on these findings, the present study focuses on evaluating the restoration of GCase function rather than reexamining biodistribution and uptake kinetics.
References:
(3) X. Qi, Z. Chu, Y.Y. Mahller, K.F. Stringer, D.P. Witte, T.P. Cripe. Cancer-selective targeting and cytotoxicity by liposomal-coupled lysosomal saposin C protein. Clin. Cancer Res. (2009) 15, 5840-5851. PMID: 19737950.
(4) Z. Chu, S. Abu-Baker, M.B. Palascak, S.A. Ahmad, R.S. Franco, and X. Qi. Targeting and cytotoxicity of SapC-DOPS nanovesicles in pancreatic cancer. PLOS ONE (2013) 8, e75507. PMID: 24124494.
(5) Z. Chu, K. LaSance, V.M. Blanco, C.-H. Kwon, B., Kaur, M., Frederick, S., Thornton, L., Lemen, and X. Qi. Multi-angle rotational optical imaging of brain tumors and arthritis using fluorescent SapC-DOPS nanovesicles. J. Vis. Exp. (2014) 87, e51187, 17. PMID: 24837630.
(6) J. Wojton, Z. Chu, C-H. Kwon, L.M.L. Chow, M. Palascak, R. Franco, T. Bourdeau, S. Thornton, B. Kaur, and X. Qi. Systemic delivery of SapC-DOPS has antiangiogenic and antitumor effects against glioblastoma. Mol. Ther. (2013) 21, 1517-1525. PMID: 23732993.
(c) Specificity controls are missing. For SapC-DOPS, inclusion of a non-functional enzyme control (or heat-inactivated fGCase) would rule out non-specific nanoparticle effects. For AAV, assessment of off-target expression and potential cytotoxicity is needed.
Including inactive fGCase would confound the assessment of fGCase in MLOs by immunoblot and immunofluorescence; therefore, saposin C–DOPS was used as the control instead.
We agree that assessment of Off-target expression and potential cytotoxicity for AAV is important; this will be included in future studies.
(d) Comparative efficacy lacking. It remains unclear which modality is most effective in the long term and in which cellular compartments.
To address this comment, we have added a new table (Supplementary Table 2) comparing the four therapeutic modalities and summarizing their respective outcomes. While this study focused on short-term responses as a proof-of-principle, future work will explore long-term therapeutic effects.
(e) Suggested fixes/experiments
Extend follow-up (e.g., 6+ weeks) after AAV/SapC dosing and evaluate DA markers, electrophysiology, and lipid levels over time.
We appreciate the reviewer’s suggestions. The therapeutic testing in patient-derived MLOs was designed as a proof-of-principle study to demonstrate feasibility and the primary response (rescue of GCase function) to the treatment. A comprehensive, long-term therapeutic evaluation of AAV and SapC-DOPS-fGCase is indeed important for a complete assessment; however, this represents a separate therapeutic study and is beyond the scope of the current work.
Quantify AAV transduction by qPCR for vector genomes and by cell-type quantification of GFP+ cells (neurons vs astrocytes vs progenitors).
For the AAV-treated experiments, we agree that measuring AAV copy number and GFP expression would provide additional information. However, the primary goal of this study was to demonstrate the key therapeutic outcome, rescue of GCase function by AAV-delivered normal GCase, which is directly relevant to the treatment objective.
Include SapC-DOPS control nanoparticles loaded with an inert protein and/or fluorescent cargo quantitation to show distribution and uptake kinetics.
As noted above [see response to Weakness (3)-c], using inert GCase would confound the assessment of fGCase uptake in MLOs; therefore, it was not suitable for this study. See response above for the distribution and uptake kinetics of SapC-DOPS [see response to Weaknesses (3)-b].
Provide head-to-head comparative graphs (activity, lipid clearance, DA restoration, and durability) with statistical tests.
We have added a new table (Supplementary Table 2) providing a head-to-head comparison of the treatment effects.
(4) Model limitations not fully accounted for in interpretation
(a) Absence of microglia and vasculature limits recapitulation of neuroinflammatory responses and drug penetration, both of which are important in nGD. These absences could explain incomplete phenotypic rescues and must be emphasized when drawing conclusions about therapeutic translation.
We agree that the absence of microglia and vasculature in midbrain-like organoids represents a limitation, as we have discussed in the manuscript. In this revision, we highlighted this limitation in the Discussion section and clarified that it may contribute to incomplete phenotyping and phenotypic rescue observed in our therapeutic experiments. Additionally, we have outlined future directions to incorporate microglia and vascularization into the organoid system to better recapitulate the in vivo environment and improve translational relevance (see 7th paragraph in the Discussion).
(b) Developmental vs degenerative phenotype conflation. Many phenotypes appear during differentiation (patterning defects). The manuscript sometimes interprets these as degenerative mechanisms; the distinction must be clarified.
We appreciate the reviewer’s comments. In the revised manuscript, we have clarified that certain abnormalities, such as patterning defects observed during early differentiation, likely reflect developmental consequences of GBA1 mutations rather than degenerative processes. Conversely, phenotypes such as substrate accumulation, lysosomal dysfunction, and impaired dopaminergic maturation at later stages are interpreted as degenerative features. We have updated the Results and Discussion sections to avoid conflating developmental defects with neurodegenerative mechanisms.
(c) Suggested fixes
Tone down the language throughout (Abstract/Results/Discussion) to avoid overstatement that MLOs fully recapitulate nGD neuropathology.
The manuscript has been revised to avoid overstatements.
Add plans or pilot data (if available) for microglia incorporation or vascularization to indicate how future work will address these gaps.
The manuscript now includes further plans to address the incorporation of microglia and vascularization, described in the last two paragraphs in the Discussion. Pilot study of microglia incorporation will be reported when it is completed.
(5) Statistical and presentation issues
(a) Missing or unclear sample sizes (n). For organoid-level assays, report the number of organoids and the number of independent differentiations.
We have clarified biological replicates and differentiation in the figure legend [see response to Weaknesses (1)-b, (1)-c].
(b) Statistical assumptions not justified. Tests assume normality; where sample sizes are small, consider non-parametric tests and report exact p-values.
We have updated Statistical analysis in the methods as described below:
“For comparisons between two groups, data were analyzed using unpaired two-tailed Student’s t-tests when the sample size was ≥6 per group and normality was confirmed by the Shapiro-Wilk test. When the normality assumption was not met or when sample sizes were small (n < 6), the non-parametric Mann-Whitney U test was used instead. For comparisons involving three or more groups, one-way ANOVA followed by Tukey’s multiple comparison test was applied when data were normally distributed; otherwise, the nonparametric Dunn’s multiple comparison test was used. Exclusion of outliers was made based on cut-offs of the mean ±2 standard deviations. All statistical analyses were performed using GraphPad Prism 10 software. Exact p-values are reported throughout the manuscript and figures where feasible. A p-value < 0.05 was considered statistically significant.”
(c) Quantification scope. Many image quantifications appear to be from selected fields of view, which are then averaged across organoids and differentiations.
In this work, quantitative immunofluorescence analyses (e.g., cell counts for FOXP1+, FOXG1+, SOX2+ and Ki67+ cells, as well as marker colocalization) were performed on at least 3–5 randomly selected non-overlapping fields of view (FOVs) per organoid section, with a minimum of 3 organoids per differentiation batch. Each FOV was imaged at consistent magnification (60x) and z-stack depth to ensure comparable sampling across conditions. Data from individual FOVs were first averaged within each organoid to obtain an organoid-level mean, and then biological replicates (independent differentiations, n ≥ 3) were averaged to generate the final group mean ± SEM. This multilevel averaging approach minimizes bias from regional heterogeneity within organoids and accounts for variability across differentiations. Representative confocal images shown in the figures were selected to accurately reflect the quantified data. We believe this standardized quantification strategy ensures robust and reproducible results while appropriately representing the 3D architecture of the organoids.
In the revision, we have clarified the method used for image analysis of sectioned MLOs as below:
“Quantitative immunofluorescence analyses (e.g., cell counts for FOXP1+, FOXG1+, SOX2+ and Ki67+ cells, as well as marker colocalization) were performed using ImageJ (NIH) on at least 3–5 randomly selected non-overlapping fields of view (FOVs) per organoid section, with a minimum of 3 organoids per differentiation batch. Each FOV was imaged at consistent magnification (60x) and z-stack depth to ensure comparable sampling across conditions. Data from individual FOVs were first averaged within each organoid to obtain an organoid-level mean, and then biological replicates (independent differentiations, n ≥ 3) were averaged to generate the final group mean ± SEM.”
(d) RNA-seq QC and deposition. Provide mapping rates, batch correction details, and ensure the GEO accession is active. Include these in Methods/Supplement.
RNA-seq data are from the same batch. The mapping rate is >90%. GEO accession will be active upon publication. These were included in the Methods.
(e) Suggested fixes
Add a table summarizing biological replicates, technical replicates, and statistical tests used for each figure panel.
We have revised the figure legends to include replicates for each figure and statistical tests [see response in weaknesses (1)-b, (1)-c].
Recompute statistics where appropriate (non-parametric if N is small) and report effect sizes and confidence intervals.
Statistical analysis method is provided in the revision [see response in Weaknesses (5)-b].
(6) Minor comments and clarifications
(a) The authors should validate midbrain identity further with additional regional markers (EN1, OTX2) and show absence/low expression of forebrain markers (FOXG1) across replicates.
We validated the MLO identity by 1) FOXG1 and 2) EN1. FOXG1 was barely detectable in Wk8 75.1_MLO but highly present in ‘age-matched’ cerebral organoid (CO), suggesting our culturing method is midbrain region-oriented. In nGD MLO, FOXG1 expression is significantly higher than 75.1_MLO, indicating that there was aberrant anterior-posterior brain specification, consistent with the transcriptomic dysregulation observed in our RNA-seq data.
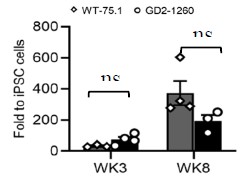
To further confirm midbrain identity, we examined the expression of EN1, an established midbrain-specific marker. Quantitative RT-PCR analysis demonstrated that EN1 expression increased progressively during differentiation in both WT-75.1 and nGD2-1260 MLOs at weeks 3 and 8 (Author response image 1). EN1 reached 34-fold and 373-fold higher levels than in WT-75.1 iPSCs at weeks 3 and 8, respectively, in WT-75.1 MLOs. In nGD MLOs, although EN1 expression showed a modest reduction at week 8, the levels were not significantly different from those observed in age-matched WT-75.1 MLOs (p > 0.05, ns).
Author response image 1.
qRT-PCR quantification of midbrain progenitor marker EN1 expression in WT-75.1 and GD2-1260 MLOs at Wk3 and Wk8. Data was normalized to WT-75.1 hiPSC cells and presented as mean ± SEM (n = 3-4 MLOs per group).ns, not significant.
(b) Extracellular dopamine ELISA should be complemented with intracellular dopamine or TH+ neuron counts normalized per organoid or per total neurons.
We quantified TH expression at both the mRNA level (Fig. 3F) and the protein level (Fig. 3G/H) from whole-organoid lysates, which provides a more consistent and integrative measure across samples. These TH expression levels correlated well with the corresponding extracellular (medium) dopamine concentrations for each genotype. In contrast, TH⁺ neuron counts may not reliably reflect total cellular dopamine levels because the number of cells captured on each organoid section varies substantially, making normalization difficult. Measuring intracellular dopamine is an alternative approach that will be considered in future studies.
(c) For CRISPR editing: the authors should report off-target analysis (GUIDE-seq or targeted sequencing of predicted off-targets) or at least in-silico off-target score and sequencing coverage of the edited locus. (off-target analysis (GUIDE-seq or targeted sequencing of predicted off-targets) or at least in-silico off-target score and sequencing coverage of the edited locus).
The off-target effect was analyzed during gene editing and the chance to target other off-targets is low due to low off-target scores ranked based on the MIT Specificity Score analysis. The related method was also updated as stated below:
“The chance to target other Off-targets is low due to low Off-target scores ranked based on the MIT Specificity Score analysis (Hsu, P., Scott, D., Weinstein, J. et al. DNA targeting specificity of RNA-guided Cas9 nucleases. Nat Biotechnol 31, 827–832 (2013).https://doi.org/10.1038/nbt.2647).”
(d) It should be clarified as to whether lipidomics normalization is to total protein per organoid or per cell, and include representative LC-MS chromatograms or method QC.
The normalization was to the protein of the organoid lysate. This was clarified in the Methods section in the revision as stated below:
“The GluCer and GluSph levels in MLO were normalized to total MLO protein (mg) that were used for glycosphingolipid analyses. Protein mass was determined by BCA assay and glycosphingolipid was expressed as pmol/mg protein. Additionally, GluSph levels in the culture medium were quantified and normalized to the medium volume (pmol/mL).”
Representative LC-MS chromatograms for both normal and GD MLOs have been included in a new figure, Supplementary Figure 2.
(e) Figure legends should be improved in order to state the number of organoids, the number of differentiations, and the exact statistical tests used (including multiplecomparison corrections).
This was addressed above [see response to Weaknesses (1)-b and (5)-b].
(f) In the title, the authors state "reveal disease mechanisms", but the studies mainly exhibit functional changes. They should consider toning down the statement.
The title was revised to: Patient-Specific Midbrain Organoids with CRISPR Correction Recapitulate Neuronopathic Gaucher Disease Phenotypes and Enable Evaluation of Novel Therapies
(7) Recommendations
This reviewer recommends a major revision. The manuscript presents substantial novelty and strong potential impact but requires additional experimental validation and clearer, more conservative interpretation. Key items to address are:
(a) Strengthening genetic and biological replication (additional lines or replicate differentiations).
This was addressed above [see response to Weaknesses (1)-a, (1)-b, (1)-c].
(b) Adding functional mechanistic validation for major pathways (Wnt/mTOR/autophagy) and providing autophagy flux data.
(c) Including at least one neuronal functional readout (calcium imaging/MEA/patch) to demonstrate functional rescue.
As addressed above [see response to Weaknesses (2)], the suggested experiments in b) and c) would provide additional insights into this study and we will consider them in future work.
(d) Deepening therapeutic characterization (dose, biodistribution, durability) and including specificity controls.
This was addressed above [see response to Weaknesses (3)-a to e].
(e) Improving statistical reporting and explicitly stating biological replicate structure.
This was addressed above [see response to Weaknesses (1)-b, (5)-b].
Reviewer #2 (Public review):
Sun et al. have developed a midbrain-like organoid (MLO) model for neuronopathic Gaucher disease (nGD). The MLOs recapitulate several features of nGD molecular pathology, including reduced GCase activity, sphingolipid accumulation, and impaired dopaminergic neuron development. They also characterize the transcriptome in the MLO nGD model. CRISPR correction of one of the GBA1 mutant alleles rescues most of the nGD molecular phenotypes. The MLO model was further deployed in proof-of-principle studies of investigational nGD therapies, including SapC-DOPS nanovesicles, AAV9-mediated GBA1 gene delivery, and substrate-reduction therapy (GZ452). This patient-specific 3D model provides a new platform for studying nGD mechanisms and accelerating therapy development. Overall, only modest weaknesses are noted.
We thank the reviewer for the supportive remarks.
Reviewer #3 (Public review):
Summary:
In this study, the authors describe modeling of neuronopathic Gaucher disease (nGD) using midbrain-like organoids (MLOs) derived from hiPSCs carrying GBA1 L444P/P415R or L444P/RecNciI variants. These MLOs recapitulate several disease features, including GCase deficiency, reduced enzymatic activity, lipid substrate accumulation, and impaired dopaminergic neuron differentiation. Correction of the GBA1 L444P variant restored GCase activity, normalized lipid metabolism, and rescued dopaminergic neuronal defects, confirming its pathogenic role in the MLO model. The authors further leveraged this system to evaluate therapeutic strategies, including: (i) SapC-DOPS nanovesicles for GCase delivery, (ii) AAV9-mediated GBA1 gene therapy, and (iii) GZ452, a glucosylceramide synthase inhibitor. These treatments reduced lipid accumulation and ameliorated autophagic, lysosomal, and neurodevelopmental abnormalities.
Strengths:
This manuscript demonstrates that nGD patient-derived MLOs can serve as an additional platform for investigating nGD mechanisms and advancing therapeutic development.
Comments:
(1) It is interesting that GBA1 L444P/P415R MLOs show defects in midbrain patterning and dopaminergic neuron differentiation (Figure 3). One might wonder whether these abnormalities are specific to the combination of L444P and P415R variants or represent a
general consequence of GBA1 loss. Do GBA1 L444P/RecNciI (GD2-10-257) MLOs also exhibit similar defects?
We observed reduced dopaminergic neuron marker TH expression in GBA1 L444P/RecNciI (GD2-10-257) MLOs, suggesting that this line also exhibits defects in dopaminergic neuron differentiation. These data are provided in a new Supplementary Fig. 4E, and are summarized in new Supplementary Table 2 in the revision.
(2) In Supplementary Figure 3, the authors examined GCase localization in SapC-DOPSfGCase-treated nGD MLOs. These data indicate that GCase is delivered to TH⁺ neurons, GFAP⁺ glia, and various other unidentified cell types. In fruit flies, the GBA1 ortholog, Gba1b, is only expressed in glia (PMID: 35857503; 35961319). Neuronally produced GluCer is transferred to glia for GBA1-mediated degradation. These findings raise an important question: in wild-type MLOs, which cell type(s) normally express GBA1? Are they dopaminergic neurons, astrocytes, or other cell types?
All cell types in wild-type MLOs are expected to express GBA1, as it is a housekeeping gene broadly expressed across neurons, astrocytes, and other brain cell types. Its lysosomal function is essential for cellular homeostasis and is therefore not restricted to any specific lineage. (https://www.proteinatlas.org/ENSG00000177628GBA1/brain/midbrain).
(3) The authors may consider switching Figures 2 and 3 so that the differentiation defects observed in nGD MLOs (Figure 3) are presented before the analysis of other phenotypic abnormalities, including the various transcriptional changes (Figure 2).
We appreciate the reviewer’s suggestion; however, we respectfully prefer to retain the current order of Figures 2 and 3, as we believe this structure provides the clearest narrative flow. Figure 2 establishes the core biochemical hallmarks: reduced GCase activity, substrate accumulation, and global transcriptomic dysregulation (1,429 DEGs enriched in neural development, WNT signaling, and lysosomal pathways), which together provide essential molecular context for studying the specific cellular differentiation defects presented in Figure 3. Presenting the broader disease landscape first creates a coherent mechanistic link to the subsequent analyses of midbrain patterning and dopaminergic neuron impairment.
To enhance readability, we have added a brief transitional sentence at the start of the Figure 3 paragraph: “Building on the molecular and transcriptomic hallmarks of GCase deficiency observed in nGD MLOs (Figure 2), we next investigated the impact on midbrain patterning and dopaminergic neuron differentiation (Figure 3).”


