
Peer review process
Revised: This Reviewed Preprint has been revised by the authors in response to the previous round of peer review; the eLife assessment and the public reviews have been updated where necessary by the editors and peer reviewers.
Read more about eLife’s peer review process.Editors
- Reviewing EditorAriel AmirWeizmann Institute of Science, Rehovot, Israel
- Senior EditorAleksandra WalczakCNRS, Paris, France
Reviewer #1 (Public review):
Summary:
Garcia-Alcala, Kratz and Cluzel investigate to what extent our understanding of bacterial physiology in bulk experiments can be applied to single-cell observations. They find that intrinsic noise may be powerful enough to even inverse the trends found in the bulk. The authors hypothesize that asymmetric distribution of ribosomes to daughter cells during the cell division plays the dominant role in the intrinsic noise and is able to generate the observed phenomenon. They do not show it directly, but the data and its agreement with the model suffice to support this claim.
Strengths:
The experimental part is convincing: the positive correlation between the elongation rate and promoter activity of unnecessary protein is clear, as well as the negative correlation between the mean values while changing the promoter strength. This was demonstrated in both rich and poor media. The causality between the growth rate and the promoter activity was shown using the negative lag time of the cross-correlation function. A simple, reasonable model accounts well for the data. This paper demonstrates an interesting phenomenon and provides a plausible theory for it, advancing our understanding of bacterial physiology on the single-cell level.
Weaknesses:
(1) Mean-reversion timescales were assumed to be longer than the simulation time and much longer than the cell cycle time. It is not clear whether the results robust in case mean-reversion timescales become of the order of cell cycle or smaller. If not, is there an argument for such practically infinite reversion timescales?
(2) It is not easy to understand the simulation part unless one reads Ref. [14]. Is k(t) assumed to follow Eq. (1) from ref. [14]? Is this crucial that the ribosome noise appears only at the division? The ribosome noise strength \sigma_R=0.06 - is it lower or higher than the naively expected binomial division?
Also, more intuitive explanation of the Simpson paradox would help the reader.
(3) It would be useful for the reader to see the raw data and not only the filtered one to appreciate the measurement noise level.
(4) Negative lag time of the cross-correlation function is visible, but consider adding statistical test for it.
(5) Can you make similar cross-correlation plots using the model? Can you infer using it whether the data agrees better with the assumption that ribosomes noise appear only at division or continuous fluctuations during the cell cycle?
Comments on revised version:
The authors addressed the five comments listed above.
Reviewer #2 (Public review):
Summary:
The manuscript by Garcia-Alcala et al. reports an interesting paradox: the cost of gene expression slows the population-average growth rate, whereas at the single-cell level, expression levels from these genes positively correlate with the growth rate. The effect is observed in the expression of flagellar genes and a gene under a synthetic promoter in E. coli. The findings are explained by the inheritance of growth factors, including ribosomes, during asymmetric division.
Strengths:
(1) The manuscript adds strength to an emerging body of literature showing that the population-level bacterial growth laws do not match correlations based on single-cell data. The evidence presented here is more striking than in previous works (such as Pavlou et al., Nat. Commun. 2025), as the trends in population-level data and single-cell data are reversed.
(2) A relatively simple model correctly explains the trends in the data.
Weaknesses:
(1) The differing behavior of the MG1655 and MC4100 strains remains a lingering question concerning the generality of the conclusions. It appears unlikely that ribosomes or other growth factors partition significantly differently in the MC4100 strain than in the MG1655 strain. Furthermore, based on Fig. S15, it is still unclear to what extent MC4100 exhibits growth-rate fluctuations, as stated in the text, rather than primarily size fluctuations, as shown in the figure. It is also unclear why such very slow fluctuations would lead to qualitatively different behavior, given that the proposed mechanism appears to be rather fundamental. It would be helpful for the authors to discuss these two points.
(2) It is unclear what fraction of the total proteome mVenus represents in different measurements. Adding this information would strengthen the conclusions.
Author response:
The following is the authors’ response to the original reviews.
Public Reviews:
Reviewer #1 (Public review):
Summary:
Garcia-Alcala, Kratz and Cluzel investigate to what extent our understanding of bacterial physiology in bulk experiments can be applied to single-cell observations. They find that intrinsic noise may be powerful enough to even inverse the trends found in the bulk. The authors hypothesize that the asymmetric distribution of ribosomes to daughter cells during cell division plays the dominant role in the intrinsic noise and is able to generate the observed phenomenon. They do not show it directly, but the data and its agreement with the model are sufficient to support this claim.
Strengths:
The experimental part is convincing: the positive correlation between the elongation rate and promoter activity of unnecessary protein is clear, as well as the negative correlation between the mean values while changing the promoter strength. This was demonstrated in both rich and poor media. The causality between the growth rate and the promoter activity was shown using the negative lag time of the cross-correlation function. A simple, reasonable model accounts well for the data. This paper demonstrates an interesting phenomenon and provides a plausible theory for it, advancing our understanding of bacterial physiology on the single-cell level.
Weaknesses:
(1) Mean-reversion timescales were assumed to be longer than the simulation time and much longer than the cell cycle time. It is not clear whether the results are robust in case mean reversion timescales become of the order of the cell-cycle or smaller. If not, is there an argument for such practically infinite reversion timescales?
Due to an error in the simulation code, the incorrect mean-reversion timescales were reported in the manuscript and have now been corrected. Instead of 1000 h and 100 h for 𝜏R and 𝜏U, respectively, they are 6.25 h and 0.0625 h, which are both much shorter than the total simulation time (75 h). The error had no effect on simulation results and was purely a timescale conversion mistake. We appreciate the referee’s careful review of the manuscript which allowed us to catch this error.
Given the correct values, 𝜏U is well within the cell-cycle time, as is expected since we assume the source of noise in unnecessary protein expression is from stochastic gene expression. In contrast, 𝜏U is still significantly longer than the cell-cycle time and needs to be in order to generate the experimentally observed behavior (i.e., the increase in growth rate with an increase in unnecessary protein expression at the single-cell level). This is consistent with our biological hypothesis that some cells inherit ribosomal surpluses from their mothers which enable bursts in protein production. 𝜏U less than the cell-cycle time would correspond to a case where ribosomal composition quickly decays to the population average, meaning that daughter cells would never have time to capitalize on the benefit of receiving a ribosome surplus. Furthermore, 𝜏U being longer than the cell-cycle is biologically justifiable as proteins such as ribosomes are passed from mother to daughter at division, thus allowing for memory to persist over longer timescales than a single generation.
(2) It is not easy to understand the simulation part unless one reads Ref [14]. k(t) is assumed Equation (1) from Reference [14]? Is it crucial that the ribosome noise appears only at the division? The ribosome noise strength σR =0.06 - is it lower or higher than the naively expected binomial division? Also, a more intuitive explanation of the Simpson paradox would help the reader.
𝜅(𝑡) is indeed Eq. (1) from Ref. [14]. To make the computational results clearer, the methods section has been updated to include the full set of equations used to perform the simulations, and the code used to produce the computational figures is now on GitHub. The relative standard deviation expected by modeling ribosome distribution at division by a binomial distribution with equal probability of being inherited by either daughter cell is in the range of 1-3% (0.01-0.03), assuming N~103-104 ribosomes. Thus, 0.06 is reasonable as it is in the same order of magnitude as what is predicted by binomial division. Furthermore, if clustering is present as already demonstrated in [39, 40, 43], we would expect the relative standard deviation to increase as clustering reduces the effective number of proteins which are distributed between daughters.
(3) It would be useful for the reader to see the raw data and not only the filtered one to appreciate the measurement noise level.
We have included the direct calculations of cell size and promoter activity in the time-lapse plots in Fig. 1. In addition, we included Fig. S2, which shows typical time traces of Class-2 activity and elongation rate, displaying both the direct measurements and the corresponding smoothed traces for the flagellar reporter strains.
(4) Negative lag time of the cross-correlation function is visible, but consider adding a statistical test for it.
We have included a statistical analysis of the lags of maximum correlation of elongation rate and activity for the flagellar reporter strains in Fig. S10. For each strain, we now show an overlay of the cross-correlation functions for all lineages and the distribution of the lag corresponding to the maximum correlation. In addition, we have added a section in Materials and Methods describing in detail how the cross-correlation and the strain-averaged lag were computed.
(5) Can you make similar cross-correlation plots using the model? Can you infer by using it, whether the data agrees better with the assumption that ribosomal noise appears only at division or continuous fluctuations during the cell cycle?
The model in its current form is unable to capture the observed cross-correlation (the correlation is sharply peaked at zero). This is because the model coarse-grains transcription and translation into one process of protein production and thus lacks any delay or memory mechanisms which would make a significant positive or negative correlation.
Both continuous fluctuations and noise from division could in principle contribute to our observation of Simpson’s paradox. We are unable to use the model in its present form to dissect the contributions from both mechanisms. However, our model simulations clearly show that noise at division by itself is sufficient to explain the observed effect with parameter values that are biologically plausible. As Chao et al., [40] has previously shown experimentally that a significant source of ribosomal noise comes from unequal distribution at division, which is the hypothesis we retained for the model.
Reviewer #2 (Public review):
Summary:
The manuscript by Garcia-Alcala et al. reports an interesting paradox: the cost of gene expression slows the population-average growth rate, whereas at the single-cell level, expression levels from these genes positively correlate with the growth rate. The effect is observed in the expression of flagellar genes and a gene under a synthetic promoter in E. coli. The findings are explained by the inheritance of growth factors, including ribosomes, during asymmetric division.
Strengths:
(1) The manuscript adds strength to an emerging body of literature showing that the population-level bacterial growth laws do not match correlations based on single-cell data. The evidence presented here is more striking than in previous works (such as Pavlou et al., Nat. Commun. 2025), as the trends in population-level data and single-cell data are reversed.
(2) A relatively simple model correctly explains the trends in the data.
Weaknesses:
(1) It is not clear whether flagellar proteins are expressed proportionally to the reporter signal. Furthermore, it is questionable if E. coli bacteria in the mother machine channels are flagellated. If they are, they could potentially swim out of the channels, which is not the case when they do not carry the MotA E98K mutation. The authors should provide some evidence that E. coli expresses the actual filament proteins in the channels.
We agree that it is important to demonstrate that our reporter reflects the production of functional flagellar structures under our experimental conditions. To this end, we first tested the swimming capabilities of our strains before introducing the MotA E98K mutation, using a standard soft‑agar motility assay. For strains in which only the Class‑1 promoter was modified (Pro2, Pro4, Pro5), after 12 h of inoculation, the diameters of the swarming rings followed the expected order based on promoter strength: Pro2 showed the smallest ring, followed by Pro4, WT, and Pro5. In contrast, control strains carrying Pro4 together with either MotA E98K (non‑rotating motors) or ΔfliC (no flagellin filament) did not form rings, consistent with their inability to swim. We also included an MG1655 strain carrying an IS5 insertion upstream of the Class‑1 promoter, which is known to enhance flagellar expression [56]; this strain showed a larger ring, as expected. A qualitative summary of ring diameters for all strains is provided in Author response table 1. We have included the figure and section “Experimental validation of functional flagella expression in reporter strains” on Supplementary Material.
Author response table 1.
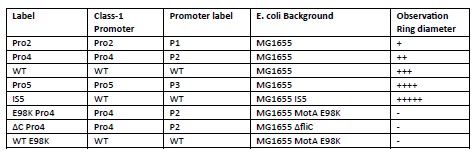
We also tested whether cells assemble functional flagella on the mother‑machine. We compared MG1655 WT and MG1655 carrying the MotA E98K mutation under identical microfluidic growth conditions. Many WT cells left the channels during the experiment (∼35% of lineages over ~20 h after the onset of exponential growth inside the device), consistent with active swimming, whereas the non‑motile MotA E98K strain did not leave the channels. Because the only difference between these two strains is the MotA E98K mutation, which disables motor rotation but not flagellar assembly, this result indicates that (i) cells do express functional filaments and motors in the mother‑machine environment, and (ii) the strain used for our main experiments is immobilized by MotA E98K.
Both experiments are included in the Supplementary Information section “Experimental validation of functional flagella expression in reporter strains” and Fig. S3.
(2) It is unclear what fraction of the total proteome mVenus represents in different measurements. Some quantification is needed (for example, using the Coomassie staining). Using f_U as high as 14.4% in simulations is questionable.
We agree that we do not currently know the exact fraction of the proteome occupied by mVenus in our experiments, as we only quantified fluorescence and did not perform Coomassie staining or proteomics. The primary goal of our simulations is not to reproduce exact experimental conditions, but to illustrate how unequal ribosome partitioning affects daughter cells across a range of protein synthesis burdens. Consequently, our use of values up to FU = 14.4% in the simulations was intended as an exploratory upper range rather than as a direct estimate of the experimental condition.
To put our experimental burden in context, we compare our growth-rate reduction to a well– characterized high-burden case in the literature. In the study by T. Hwa’s group [6], overexpression of β–galactosidase such that it constituted approximately 27% of the total proteome led to a 67% reduction in growth rate for E. coli growing in a medium similar to ours (differing only in the carbon source: glucose in their case, glycerol in ours). In our system, overexpression of mVenus from a plasmid result in a substantially smaller growth–rate reduction of 9% relative to the non–expressing control, and this is observed on the poorer carbon source (glycerol), under which burden effects are typically less pronounced [6].
Although we cannot convert our fluorescence measurements into an exact proteome fraction, the much smaller growth defect compared to the 27% β‑galactosidase case strongly suggests that mVenus does not approach such an extreme fraction of the proteome under our conditions. Under the simplifying assumption that the qualitative relationship between unnecessary‑protein fraction and growth‑rate reduction is similar in the two systems, our data are therefore consistent with a modest fraction of unnecessary protein and make it unlikely that mVenus reaches very high fractions such as 27%. This gives us confidence that exploring FU values up to 14.4% in the simulations represents a conservative upper range relative to our experimental burden, rather than an underestimate.
(3) The data from the MC4100 strain does not directly match the trends of MG1655. The justification for filtering out the low-frequency components of MC4100 is not particularly convincing. It appears unlikely that ribosomes or other growth factors partition significantly differently in the MC4100 strain than in the MG1655 strain. Further discussion and a plot similar to Figure 1 (Left) for this strain are warranted.
We thank the reviewer for this helpful suggestion. We agree that the filtering analysis from the initial manuscript was not clear enough to be used as robust supplementary information, and we therefore removed it. Instead, we carried out with the ‘unfiltered’ MC4100 strain, the same single-cell analyses as with MG1655, including the binning analysis of instantaneous elongation rate versus Class-2 promoter activity, and a cross-correlation analysis between such measurements.
Both analyses did not reveal a significant correlation between growth and flagellar promoter activity in MC4100. We now present these results in the revised manuscript (Fig. S15), where we explicitly show the lack of association in a plot directly comparable to Fig. 1.
While ribosomes partition mechanism is likely to be the same between these two strains, MC4100 is known to exhibit very long oscillations of growth rate over 10 generations, which are absent in MG1655.
We now present MC4100 as an explicit counterexample to highlight that the positive correlation between short timescale growth fluctuations and flagellar expression observed in MG1655 is not universal across all E. coli strains, especially in strains like MC4100 whose growth rate fluctuations are dominated by long timescales, much longer than the division time. In MC4100 these slow modes are largely decoupled from flagellar gene regulation. We have also revised the text to clarify this point.
(4) The model needs to be described in more detail. A closed set of equations that have been simulated must be presented, along with all values of the model parameters and their sources. The authors should consider depositing their code on GitHub or another publicly accessible repository.
The methods section has now been updated to include the full set of equations used to perform the simulations along with all parameter values and their sources. Additionally, the code used to produce the computational figures is now on GitHub. For a full derivation and biological justification of each model component, we still refer readers to ref [14] where this model was first published.
Recommendations for the authors:
Reviewer #1 (Recommendations for the authors):
(1) The first paragraph of Results still belongs to the Introduction Section, I feel.
Thank you for the recommendation, we agreed with the change.
(2) Figure 1, left, is after some filter (Savitzky-Golay)? It might be useful to see the raw points.
We have included the direct calculations of cell size and promoter activity in the time-lapse plots in Fig. 1. In addition, we included Fig. S2, which shows typical time traces of Class-2 activity and elongation rate, displaying both the raw (direct) measurements and the corresponding smoothed traces for the flagellar reporter strains.
Reviewer #2 (Recommendations for the authors):
(1) Is there a statistically significant positive slope in single-cell data of the elongation rate as a function of Class-2 activity? There should be an analysis of statistical significance for the slopes in Figure 1 (Right) and Figure 4A, including both population-average and single-cell data.
Thank you for your recommendation. We have now added statistical analyses of the correlations between activity and elongation rate at both the single-cell and population levels. The results for the flagellar strains are presented in Fig. S5, S6, and S7. Also, the corresponding analysis for constitutive Venus expression is shown in Fig. S16.
(2) How does FlhC-YFP data compare with the CFP signal in the first set of measurements? What would Figure 1, Left look like for this signal?
At the single‑cell level, the relationship between Class‑1 promoter activity and elongation rate within each strain is still positive, but clearly weaker than for Class‑2, as shown in Fig. S8. When we bin the data, we can observe that the binned averages don’t display a clear positive trend, even though the Pearson correlation for each flagellar reporter strain is still positive. We think this is because Class‑1 controls a much smaller part of the proteome (it only encodes the two subunits of FlhDC) while Class‑2 promoters drive many structural and export proteins. So, changes in Class‑2 activity more directly reflect shifts in global translational capacity and are more tightly linked to growth, whereas Class‑1 activity adds only a small translational load.
(3) The information from the ER-Activity cross-correlation functions is interesting but has not been interpreted or compared with the model. Which signal precedes the other? What can explain the observed lag time on the order of Tdiv? Why do some cross-correlations show negative values in Fig. S9 while others are positive (as they should)? Can the model explain the experimentally observed cross-correlation function?
In our cross‑correlation analysis, a negative lag at the maximum means that fluctuations in elongation rate (ER) precede fluctuations in promoter activity (A) by that lag. We now describe this explicitly in Materials and Methods and quantify lag distributions for all reporter strains in Fig. S10.
In Fig. 13 (previously Fig. 9), we mainly observe positive correlations between ER and PA with negative or near zero peak lags, i.e., ER tends to lead PA by a lag by about a division time. The reason governing the negative lags is not immediately clear, but it is consistent with a resource driven mechanism: cells that inherit more growth factors (e.g. ribosomes) at division, use them to prioritize housekeeping processes and thus increase growth rate first, and only subsequently use these extra resources to increase flagellar promoter activity.
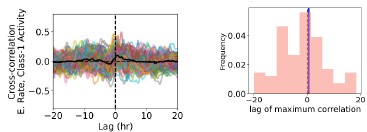
As for Class–1 activity, the correlation with growth is much weaker as it was already observed in Kim et al. Averaging the cross–correlations across all lineages yields a modest peak (mean correlation 0.10, SD 0.12; see Author response image 1) at a small positive lag of 0.5 h (while average division time is Tdiv ~ 1.7h). This indicates a weak but real positive correlation between Class 1 activity and ER at short lags. However, the lags of the individual maxima are widely distributed (SD ≈ 9 h; mean −1.8 h, median −0.28 h, mode ≈ 0), with only ~53% of the cells showing a negative time lag. Thus, delays are roughly symmetrically spread around zero with only a slight negative bias.
Author response image 1.
Left: cross−correlation between elongation rate and Class−1 activity for each lineage (N = 96, colored lines), and their average as a function of lag (black line). Right: distribution of the lags at which each lineage’s cross−correlation attains its maximum. The dashed line indicates zero lag, and the full line marks the lag of the peak of the mean cross correlation.
An in-depth analysis about the sign and magnitude of the lag would require measurements from a broader set of promoters. The lag is likely to depend on what genes the promoter controls (e.g. stress response, housekeeping, or large structural modules), on its strength and regulation, and on growth conditions.
The model in its current form is unable to capture the observed cross-correlation (the correlation is sharply peaked at zero). This is because the model coarse-grains transcription and translation into one single process of protein production and thus lacks any delay or memory mechanism that could generate a phase shift.
Nonetheless, this memory-free formulation shows that stochastic redistribution of growth factors at division is by itself sufficient to generate the Simpson’s paradox behavior. Capturing the experimentally observed lag time would require including explicit transcription/translation delays and additional regulatory dynamics between housekeeping and flagellar genes whose information we do not have.
(4) Figure 3, Left - it is not clear what this plot shows. Red and blue are scattered over the whole plot. How have daughter 1 and daughter 2 been assigned? Perhaps choosing one of the daughters with a higher growth rate and then plotting the data could reveal some trends.
We agree that the original left panel of Fig. 3 was difficult to follow. In the original version, the daughter labels were assigned as “Daughter–1” for the cell at the closed end of the channel and “Daughter–2” for the cell closest to the open side. After discussing this with Dr Camilla Ulla Rang (whom we now acknowledge in the manuscript), we relabeled the daughters as “new–pole daughter” and “old–pole daughter,” following the convention used in studies of aging and ribosome distribution in E. coli.
We now show the class–2 promoter activity comparison between new pole vs old pole, and in a separate panel, we plot the mean ratios of elongation rate, and class–1/class–2 promoter activities between the new–pole and old–pole daughters. These ratios show that the new–pole daughter tends to have both greater growth rate and flagellar gene activity than the old–pole daughter. Importantly, this new plot is in line with Rang and colleagues who demonstrated that new–pole daughters have greater ribosome density and faster growth rates than their old–pole sisters. Together, these results further support our hypothesis that excesses of ribosomes inherited at division underlies the observed growth boosts.
(5) Flagellar activity -> activity of flagellar gene synthesis (presumably no flagellar activity in these cells).
We corrected the terms used to reference the flagellar gene activity.
(6) Page 7: "The strain MC4100, known to exhibit slow, long period oscillations in growth ..." - some reference is- needed here.
We placed the reference some lines after, as such paper also includes the information of MG1655 short-term oscillations. Now the reference is [44]: Tanouchi, Y., et al., A noisy linear map underlies oscillations in cell size and gene expression in bacteria. Nature, 2015
(7) Page 7: Figure S11B - is Figure S11C perhaps meant?
The correct panel indeed was Fig. S11C, and we have now corrected and updated the figure label and text accordingly.
(8) Page 11: Savitsky-Golay filter.
We have corrected it, thank you.



