
Peer review process
Not revised: This Reviewed Preprint includes the authors’ original preprint (without revision), an eLife assessment, public reviews, and a provisional response from the authors.
Read more about eLife’s peer review process.Editors
- Reviewing EditorTimothy StasevichColorado State University, Fort Collins, United States of America
- Senior EditorLori SusselUniversity of Colorado Anschutz Medical Campus, Aurora, United States of America
Reviewer #1 (Public review):
Summary:
During erythroid differentiation, hematopoietic progenitors relinquish multipotency and activate lineage programs. The switch from GATA2 to GATA1 is particularly important in this process, yet GATA2 chromatin‑binding kinetics remain undefined. The authors investigated GATA2-chromatin interaction dynamics during erythroid differentiation in three different cell systems using single‑molecule live‑cell imaging, and they also used CUT&Tag to profile GATA2 chromatin occupancy.
By single‑molecule imaging, the authors report two interaction modes for GATA2: short‑lived (<1 s) and long‑lived (>5 s) binding. The proportion of long‑lived molecules, the number of binding events, and the duration of long‑lived binding change (or are maintained) during differentiation. Notably, long‑lived chromatin engagement by GATA2 increases during early erythroid differentiation and decreases at the late stage. CUT&Tag identifies regulatory elements selectively occupied by GATA2 during the early transition stage. Together, these results support a model in which transcription factor kinetics form a dynamic chromatin‑engagement profile that characterizes the GATA2‑to‑GATA1 transition.
Strengths:
(1) Characterizing transcription‑factor binding kinetics during the GATA2->GATA1 transition addresses a fundamental mechanism in erythroid differentiation.
(2) Combining single‑molecule live imaging with CUT&Tag provides both dynamic and locus‑specific perspectives.
(3) Single-molecule analysis across three different cell systems strengthens the potential generalizability of the findings and highlights biological variability.
Weaknesses:
I agree that single‑molecule imaging is a powerful approach for investigating GATA2 kinetics, but the single‑molecule data are the most important part of the paper and need improvement. The analyses focus on three measures: (i) duration of long binding, (ii) proportion of short‑ and long‑binding molecules, and (iii) total binding events. However, several methodological and control issues limit confidence in the kinetic interpretations. The authors should address the following major concerns.
(1) Two binding states: justification and controls
The authors propose two states of GATA2 binding. Are there only two states? Studies that separate short‑ and long‑lived binding (e.g., Chen et al., 2014, PMID: 25342811) address two states of transcriptional factors very carefully. Some long‑binding duration distributions here are very long‑tailed (e.g., Figure 2D middle), suggesting a possible third state. The authors must explain how they determined that two states provide the "best fit" to the data and how they classified "short" versus "long" binding.
Controls should be included for long‑lived and short‑lived binding (e.g., histone proteins, HaloTag‑NLS, or a binding‑deficient GATA2 mutant) as in other studies. These controls are essential to exclude alternative explanations (see points below).
(2) Exclude photophysical and focal‑plane artifacts
The authors should exclude contributions from (i) photobleaching, (ii) blinking, and (iii) Z‑axis motion (disappearance from the focal plane). Although photobleaching correction is mentioned in the Methods, no details are provided. Describe and quantify the photobleaching correction and demonstrate that it was applied across all cell types and conditions.
Some spots in the supplementary movies appear to blink or to move substantially between frames. Provide analyses or controls that distinguish true dissociation events from photophysical blinking/bleaching or axial motion.
(3) HILO illumination and nuclear region sampled
HILO is powerful but sensitive to illumination angle: slight changes sample different nuclear regions (e.g., nuclear interior versus periphery). The nuclear periphery is enriched in heterochromatin and may bias binding statistics. Explain how the authors controlled the HILO angle and confirmed that comparable nuclear regions were imaged across cells and conditions.
(4) Quantification of event counts and long‑binding durations
The number of binding events and measured long‑binding durations are strongly affected by imaging conditions (labeling/staining, bleaching, nucleus size, cell cycle state, focal plane, spot detectability, etc.). Imaging clarity appears to differ among cells/conditions in the supplementary movie. Provide more careful analysis describing how these variables were controlled or corrected for, and assess the sensitivity of results to choices in detection and tracking parameters.
(5) Evidence that spots are single molecules
The authors state that spots represent single molecules but do not provide supporting evidence. Spot brightness varies considerably in the movies. Brightness differences may reflect axial position. Provide evidence supporting single‑molecule assignment (e.g., single‑step photobleaching traces, brightness distributions compared to a known single‑molecule control, or photon count analysis).
(6) Description of spot‑analysis pipeline
The manuscript lacks a sufficient description of the spot‑analysis method. I reviewed the STRAP pipeline paper cited (Haque and Coleman 2025 bioRxiv) and the GitHub code, but the Methods in the current manuscript should include a detailed STRAP pipeline. This would enable readers to evaluate and reproduce the analyses.
(7) Differences among cell systems
The three cell systems yield notably different results (e.g., Figure 2C vs 4C and Figure 2D/3D vs 4D). Provide a more detailed explanation for these differences and discuss how biological variability, technical differences, or imaging biases might account for the discrepancies.
Reviewer #2 (Public review):
In this study, the authors address the molecular mechanism underlying the transcriptional changes during erythroid differentiation from hematopoietic progenitor cells. The authors combine single-molecule live cell imaging and CUT&RUN to analyze the chromatin binding properties of the GATA2 transcription factor prior to and after initiation of differentiation into the erythroid cell lineage. Using three distinct cellular systems, the authors demonstrate that the chromatin binding of GATA2 is transiently increased early in the differentiation process, as evidenced by increased chromatin binding residence time and the emergence of new genomic binding sites identified by CUT&RUN. The strength of the study lies in the combination of single-molecule imaging, which reports on binding dynamics but is agnostic of the binding site, with CUT&RUN, which reports on the binding sites but does not provide dynamic information. The authors clearly demonstrate that chromatin binding of GATA2 is altered early in the differentiation process and is later displaced as cells switch to expression of GATA1, which has been previously observed. The use of three distinct cell lines, in particular the GATA2-SNAP mouse model, is a strength in principle; however, the results are not fully consistent between the different cell systems. A key difference is that the G1E-ER4 and HPC7 cell line models express HaloTagged GATA2 in addition to the endogenous GATA2 protein. The authors go through great lengths to control GATA2-HaloTag expression levels, but they use polyclonal cell lines and do not analyze expression levels of the GATA2-HaloTag transgene, which is a key variable in interpreting their experimental results. Finally, a key variable determined in their single-molecule analysis is the number of binding events observed during the distinct differentiation changes. The number of binding events observed is influenced by the expression level of the tagged protein, which in turn is controlled by the Shield-1 ligand, and the fraction of molecules labeled with the HaloTag ligand. Since transgene protein levels and the labeling efficiency were not determined, it is hard to assess how reliable the measurements of the number of binding events are across all cell lines.
To address the weaknesses summarized above the authors could take the following steps:
(1) Determine the expression levels of the GATA2-HaloTag transgene over the course of differentiation under the conditions used for single-molecule imaging. This will not only allow them to determine the expression of the transgene but also the endogenous untagged protein with which the GATA2-HaloTag fusion proteins compete for binding sites.
(2) To determine the fraction of molecules labeled during imaging, the authors could carry out a titration of the HaloTag ligand and compare the amount of labeled protein under single-molecule imaging conditions to that of saturating labeling of the HaloTag. This approach will ensure that the number of labeled molecules per cell is comparable across experimental conditions and allow the authors to draw more solid conclusions regarding the number of binding events.
(3) The analysis of residence times using single-molecule imaging requires robust single-particle tracking without gaps or interruptions of trajectories. The authors should show images of their particle trajectories to demonstrate that their tracking is robust. Or even better, movies superimposing the trajectories onto the imaging data.
Reviewer #3 (Public review):
Hobbs et al. use live-cell single-molecule tracking (SMT) of HaloTag- and SNAP-tagged GATA2 combined with CUT&Tag chromatin profiling to examine how GATA2 chromatin engagement evolves during erythroid differentiation. Across three complementary systems, G1E-ER4 cells, HPC7 cells, and primary bone marrow progenitors from a new Gata2-SNAP knock-in mouse, they report a transient strengthening of long-lived GATA2 chromatin binding at the "Early" (2 h) erythroid stage, manifested either as increased residence time (G1E-ER4) or expansion of the long-lived bound fraction (HPC7, primary cells). CUT&Tag identifies 1,167 Early-restricted GATA2 peaks partitioning into GATA2-only (promoter-proximal, GATA/RUNX motifs) and GATA2+GATA1 co-bound (distal, GATA/E-box motifs) subclasses. The authors propose that this kinetic phase represents a previously unappreciated dimension of the GATA switch.
This is a strong study with a genuinely novel finding-the non-monotonic kinetic behavior of GATA2 during erythroid priming, supported by complementary measurements in three biological systems. The issues below are largely clarifications, additional analyses of existing data, and modest refinements to the discussion. With these addressed, the manuscript will make a valuable contribution. I recommend a minor revision.
Specific points:
(1) Clarify the photobleaching correction and report per-cell bleach lifetimes.
The long-lived residence time claim in G1E-ER4 cells depends on careful accounting for photobleaching, which the Methods indicate was done via a right-censoring model. For reviewer and reader confidence, the authors should report the per-stage (or per-cell distribution of) photobleaching lifetimes and the photobleach-corrected residence time values alongside the apparent values in Figure 2D. If feasible, including a brief supplementary analysis with an H2B-Halo or similar long-lived control under matched conditions would further solidify the quantitative claims. This is an analysis of existing data and should not require new imaging.
(2) Unify or explicitly discuss the mechanistic differences across systems.
The three systems show qualitatively different signatures: residence time change in G1E-ER4, bound fraction expansion in HPC7, and primary cells. The authors currently group these under "enhanced engagement," but these signatures imply different underlying mechanisms (koff decrease vs. increased kon or increased specific-binding-competent pool). The Discussion partially addresses this by noting engineered vs. native differences, but a more explicit framing in both Results and Discussion would help readers. Specifically, reporting an on-rate proxy (for example, binding events per unit time normalized to detectable molecule number) alongside koff would let readers see how the mechanistic pieces fit together. I do not think this changes the central message; it sharpens it.
(3) Per-cell GATA2 concentration would strengthen the "uncoupling" claim.
A central claim of the Figure 6 model is that chromatin engagement is uncoupled from protein abundance. The ectopic Shield-1 stabilization system is a reasonable design choice, but quantifying total nuclear GATA2-Halo signal (for example, from the pre-bleach frame or a brief high-power acquisition) on a per-cell basis across stages would directly support the interpretation. For the primary cells, where the biological claim is strongest, a western blot or quantitative immunofluorescence on the flow-sorted populations would make the uncoupling argument much more defensible. I recognize this may be one additional experiment, but it is a high-value one.
(4) Additional single-cell distribution analysis.
Figure 1E and Figures 2 to 4 show substantial cell-to-cell heterogeneity, and the Early populations in particular look potentially bimodal. Given that the authors cite Wheat et al. and Palii et al. on probabilistic hematopoietic transitions, a brief supplementary analysis using distribution-based statistics (K-S test, or mixture model) rather than, or alongside, mean-based ANOVA would align the analysis with this conceptual framing and may reveal whether the Early state represents a subpopulation transition rather than a uniform shift. This is purely an analysis of existing data.
(5) Quantitative integration of CUT&Tag with SMT.
The manuscript presents SMT and CUT&Tag as complementary but does not attempt to quantitatively connect them. A back-of-the-envelope calculation of whether a 21% increase in residence time (G1E-ER4), or the fraction expansion in other systems, is consistent with the acquisition of the 1,167 Early-restricted sites, given plausible site affinities, would substantially strengthen integration. Even if the calculation is approximate, framing it explicitly would help readers appreciate that the two datasets reinforce each other.
(6) Short-lived kinetic interpretation and tracking parameters.
The 1.5 s gap allowance in tracking is long relative to the 0.55 to 0.73 s short-lived residence times reported in primary cells (Figure Supplement 1F), which could affect the interpretation of the "slowing of target search" claim. A brief sensitivity analysis with tighter gap parameters in the supplement would reassure readers that this effect is robust. Additionally, please clarify how the inferred slowing of search, which should reduce kon, is reconciled with the increased number of binding events per cell at the Early stage.
(7) CUT&Tag peak definition.
The Early-restricted peak set is defined by presence and absence at q less than 0.01, which can be sensitive to near-threshold peaks. Please report either (a) the CUT&Tag signal intensity distribution at the 1,167 sites across all three stages as a quantitative scatter or density plot, beyond the heatmap in Figure 5C, or (b) the result of a differential binding analysis (for example, DESeq2 on read counts in a union peak set) as a supplementary confirmation. Please also state the number of CUT&Tag replicates per stage and the overlap of Early-restricted sets across replicates.
(8) Knock-in mouse validation.
The Gata2-SNAP allele is a valuable new tool, and it would benefit from slightly more quantitative validation in the supplement. A brief characterization of basic hematopoietic parameters in homozygotes (CBC, LSK/HSPC frequencies, or colony assays) would confirm that the tagged allele is truly physiological and would serve the community that will want to use this mouse going forward. If this has been done, please include it; if not, a statement about what was checked would suffice.
Author response:
We are writing to provide our provisional response to the public reviews. We note that the reviewers’ comments focus primarily on strengthening technical rigor and quantitative interpretation. We have designed the planned revisions to directly address the reviewers’ major concerns and to strengthen the study’s evidentiary basis. We plan to submit a revised manuscript for the final Version of Record.
For clarity, we summarize below the major new experiments and analyses that address the reviewers’ primary concerns:
(1)Validation of Tracking Parameters (Reviewers 1 & 3): We will re-analyze our single molecule tracking data with tighter gap-time allowances (0 seconds) to demonstrate the robustness of our interpretations of short- and long-lived kinetics. We will also generate a supplementary movie with binding trajectories superimposed directly on detected molecules to visually confirm tracking robustness.
(2) Photobleaching & Two-State Controls (Reviewers 1 & 3): We will report per-cell photobleaching lifetimes derived from our global fluorescence decay. To strengthen this analysis, we will include supplementary measurements using a H2B-HaloTag control under matched imaging conditions and perform single-molecule tracking of GATA2 zinc-finger deletion mutants (N-terminal, C-terminal, and double) as a binding-deficient functional control.
(3) Protein Expression & Labeling Efficiency (Reviewers 1 & 2): To address concerns about transgene expression and competition with endogenous proteins, we will quantify Halo-GATA2 levels in G1E-ER4 and HPC7 cells and SNAP-GATA2 levels in primary cells using standardized titration methods with established Halo-CTCF and SNAP-RPB1 reference systems.
(4) Integration of SMT and CUT&Tag (Reviewer 3): We have conducted a quantitative foldchange analysis of our existing CUT&Tag dataset to complement our single-molecule kinetics.
However, as detailed in our specific response below (R3 point 5), we emphasize that directly integrating population-level genomic occupancy measurements with single-cell kinetic measurements is not straightforward. We will therefore frame the relationship between these datasets as a conceptual consistency check rather than a strict quantitative integration. This quantitative analysis supports and refines the Early-restricted peak set, identifying a high confidence strict subset consistent with the broader presence/absence-defined set described in Figure 5 of the manuscript (see Author response images 1–3 and our response to R3 point 7).
(5) Characterization of the GATA2-SNAP Mouse (Reviewer 3): We have characterized hematopoietic populations in the homozygous knock-in mouse, including lymphoid (CD3+/CD4+/CD8+/B220+/CD19+), myeloid (CD11b+/Gr1+), and erythroid (Ter119+) compartments. These data, presented in Author response image 4, indicate that normal mature hematopoietic output is preserved across genotypes. Statistical caveats are described in the corresponding figure legend and in our response to R3 point 8.
Public Reviews:
Reviewer 1 (Public review):
(1) Two binding states: justification and controls
The authors propose two states of GATA2 binding. Are there only two states? Some longbinding duration distributions here are very long-tailed (e.g., Figure 2D middle), suggesting a possible third state. The authors must explain how they determined that two states provide the best fit and how they classified short versus long binding. Controls should be included for long-lived and short-lived binding (e.g., histone proteins, HaloTag-NLS, or a binding-deficient GATA2 mutant).
Agreed in part; we will attempt the requested binding-deficient control using existing GATA2 deletion constructs, complemented by GRID and H2B-HaloTag controls.
We will clarify that the two-state framework is an operational model rather than a claim that GATA2 can occupy only two physical states. This approach is widely used in SMT studies of chromatin-associated transcription factors and transcription machinery (Gebhardt et al., 2013; Liu et al., 2014; Hansen et al., 2017; Kenworthy et al., 2022). In particular, Ling et al. (Science, 2026) recently used two-exponential survival-probability fitting across 58 Halotagged transcription-associated proteins to distinguish transient and stable chromatin-binding populations, while explicitly noting that the simplified two-state model provides a tractable framework even when the underlying physical behavior may be more heterogeneous.
We agree that our current two-state model may under-represent the diversity of GATA2 chromatin-binding populations in single cells. However, even within this simplified framework, the existing analysis already indicates increased upper-tail dispersion of kinetic measurements (e.g., residence time and/or percentage of stable events) at the single-cell level in early erythroid cells. To support the goodness-of-fit metrics from our two-state fitting, as Reviewer 3 recommends, we will provide a supplementary table containing confidence intervals for the rate parameters and an F-test metric describing the differences between one- and two-state fits.
To determine whether additional binding states exist, we will perform GRID (Genuine Rate Identification from Distributions), which does not bias the model toward a particular number of states and, in our experience across multiple proteins, yields fits with 3-5 binding populations. However, we have found that in many cases, GRID requires aggregating binding events from multiple cells to achieve consistently robust fits for the populations of relatively rare, long-lived (>~30 sec) binding events. Therefore, GRID will assess whether additional populations exist, but we will lose the ability to analyze changes in the cell populations at the single-cell level.
We will include the multi-state analysis as a new supplementary figure. We will additionally clarify in the Results and Methods exactly how short- and long-lived binding events are classified (1-second threshold consistent with prior single-molecule frameworks for transcription-factor chromatin interactions; Gebhardt et al., 2013; Liu et al., 2014; Kenworthy et al., 2022) and direct the reviewer to these passages.
For the requested controls, we will include H2B-HaloTag imaging under matched conditions as a long-lived reference for both photobleaching correction and as a positive control for stable chromatin association, addressing R1 point 2 and R3 point 1 simultaneously.
We will also attempt to address the reviewer’s request for a binding-deficient control. We have lentiviral constructs in hand that encode GATA2 with a C-terminal zinc-finger deletion (which removes the primary DNA-binding domain), an N-terminal zinc-finger deletion, and a double deletion. We will perform single-molecule tracking of these mutants in the engineered cell systems and test whether removing GATA2’s specific DNA-binding capacity produces the predicted reduction in long-lived chromatin engagement, providing a functional perturbation control. The interpretation of these experiments will depend on the mutants expressing and localizing appropriately, which we will validate before drawing kinetic conclusions. We note that an analogous binding-deficient mutant cannot be examined in the physiological context of the Gata2SNAP knock-in mouse, and we will frame the cell-line mutant analyses accordingly. Together with GRID and the H2B-HaloTag control, these mutants provide complementary lines of validation for the two-state kinetic framework.
(2) Photophysical and focal-plane artifacts
The authors should exclude contributions from (i) photobleaching, (ii) blinking, and (iii) Z-axis motion. Describe and quantify the photobleaching correction. Provide analyses or controls that distinguish true dissociation events from photophysical blinking/bleaching or axial motion.
Agreed.
We will substantially expand the methodological description and provide three new pieces of supplementary analysis:
- Photobleaching: A per-cell photobleaching-rate distribution will be plotted for each cell type and differentiation stage, and photobleach-corrected residence-time values will be reported alongside apparent values in the relevant figures. We will also perform H2B-HaloTag imaging under matched illumination, exposure, and dye conditions in each cell line as a longlived chromatin-bound reference, establishing per-cell-type bleach lifetimes to which the GATA2 measurements can be referenced. This approach follows recent SMT precedent in which H2B decay was used to correct residence-time measurements for photobleaching, chromatin and nuclear motion, microscope drift, defocalization, and dye photophysics (Ling et al., Science 2026). The right-censoring photobleach-correction model used in our analysis will be described in detail in the revised Methods, including parameter values and per-cell handling.
- Blinking: The STRAP single-particle tracking pipeline already accommodates fluorophore blinking when linking trajectories across successive frames, following the multiple-targettracing framework of Sergé et al. (Nature Methods, 2008). This use of short gap-frame allowances to avoid artificially splitting trajectories due to fluorophore blinking or transient defocalization is consistent with recent live-cell SMT studies of chromatin-associated factors (Ling et al., Science 2026). We will add an explicit statement to the Methods describing how blinking-tolerant linkage parameters are set, and we will reanalyze representative datasets
with stricter maximum off-frame settings to ensure this parameter does not drive our conclusions (also addressing R3 point 6).
- Z-axis motion: Given our 500-ms exposure and the ~500-nm axial detection range of the HiLo configuration, axial loss is expected to be a minor contributor. We will quantify this indirectly by plotting, as a supplementary analysis, the maximum in-plane 2D spatial exploration of each binding trajectory, defined as the long-axis diameter of the 2D trajectory envelope. Although this does not directly measure z-position, it serves as a control for large apparent displacements that could reflect molecules moving out of the HiLo detection volume and demonstrates that observed dissociation events are not dominated by axial drift.
Representative photobleaching traces from individual cells (lowest, highest, and median bleach rates) will be included to support the single-molecule interpretation (also addresses R1 point 5).
(3) HILO illumination and nuclear region sampled
HiLo is sensitive to illumination angle: slight changes sample different nuclear regions. Explain how the HiLo angle was controlled and confirmed comparable across cells and conditions.
Agreed.
We will add a Methods subsection describing our HiLo illumination procedure. In brief, we started at a TIRF-supercritical angle and reduced it toward epifluorescence just enough to achieve high imaging depth while minimizing out-of-focus background signal. Within each biological system (cell line or primary cells), the TIRF angle was held constant across Basal, Early, and Late conditions to ensure direct comparability of kinetic measurements across stages.
(4) Quantification of event counts and long-binding durations
The number of binding events and the duration of long-binding events are influenced by imaging conditions. Provide a more detailed analysis of how these variables were controlled and assess the sensitivity of the results to detection and tracking parameters.
Agreed.
We will (i) normalize per-cell binding-event counts to nuclear cross-sectional area (extracted from the segmented nuclear masks already in the STRAP pipeline) to control for differences in nuclear size; (ii) report the tracking-parameter sensitivity sweep described above; and (iii) confirm in the revised Methods that all imaging conditions (laser power, exposure, dye concentration, sample preparation) were held constant across stages and cell types, consistent with the existing manuscript text. Per the Reviewing Editor’s guidance, the planned labeling-efficiency and absolute-molecule-quantification experiments will further constrain the interpretation of binding-event counts across conditions.
(5) Evidence that spots are single molecules
Provide evidence that spots represent single molecules.
Agreed.
We will include a small number of per-event intensity traces from our STRAP tracking output, selected to illustrate the single-step photobleaching behavior characteristic of single-molecule emission (intensity remains approximately constant during the binding event and then drops to background in a single step). The nuclear-fluorescence measurements from the planned labeling-titration experiment will also allow us to confirm that bound-spot densities are consistent with single-molecule occupancy at the labeled fraction used for tracking.
(6) Description of the spot-analysis pipeline
The Methods should include a detailed STRAP pipeline description.
Partially agreed; the existing STRAP reference is appropriate, but the Methods will be expanded.
STRAP (Haque & Coleman, 2025) is a consolidated, automated implementation of two well-established, previously published frameworks: SLIMfast / multipletarget tracing (Sergé et al., 2008) and evalSPT (Normanno et al., 2015), both of which are cited in the original manuscript. We will expand the Methods to describe the parameter set used in our analysis (detection thresholds, linking radii, gap-frame allowance, photobleaching correction model) so that readers can assess the analysis without referring exclusively to the STRAP manuscript and code repository, while preserving the cited STRAP reference for the full algorithmic description. We respectfully suggest that a complete pipeline description duplicating Haque & Coleman (2025) would not be appropriate in a primary research article.
(7) Differences among cell systems
The three cell systems yield notably different results. Provide a more detailed explanation for these differences.
Agreed.
We will also explicitly describe the caveats of the engineered systems versus the native GATA2-SNAP primary-cell system, in which endogenous GATA2-SNAP remains under physiological regulation. Specifically, we will discuss how variables such as the GATA1null background, ectopic forced nuclear import of GATA1-ERT, and ectopic GATA2-Halo in G1E-ER4 cells, as well as ectopic GATA2-Halo, endogenous GATA1, and cytokine signaling in HPC7 cells, likely contribute to the observed differences in signatures.
Reviewer 2 (Public review):
(1) Expression levels of the GATA2-HaloTag transgene
Determine the expression levels of the GATA2-HaloTag transgene over the course of differentiation under the conditions used for single-molecule imaging.
Agreed.
This is the central concern flagged by the Reviewing Editor. For each cell line (G1E-ER4 and HPC7), we will (i) measure total nuclear GATA2-Halo fluorescence per cell under matched acquisition conditions and (ii) convert this fluorescence intensity to absolute molecules per cell using a Halo-CTCF/U2OS reference standard (Cattoglio et al., 2019; absolute CTCF abundance quantification applied previously by our group). This will provide per-cell GATA2Halo molecule counts at each differentiation stage (Basal, Early, Late). For the primary GATA2SNAP cells, we will perform the analogous comparison against a SNAP-RPB1/U2OS standard.
(2) Fraction of molecules labeled
Carry out a titration of the HaloTag ligand and compare the amount of labeled protein under single-molecule imaging conditions to that of saturating labeling.
Agreed.
We will perform HaloTag-ligand and SNAP-tag-ligand titrations in each cell type, comparing nuclear fluorescence under the limiting-label conditions used for single-molecule tracking with that under saturating labeling. This will yield a per-cell-type labeled fraction and allow us to confirm that comparisons of binding-event counts across conditions are not confounded by differences in labeling efficiency. The labeled-fraction values will be reported in a new supplementary figure and incorporated into our quantification of binding-event rates.
(3) Robust single-particle tracking
Show images of particle trajectories or movies superimposing trajectories on imaging data.
Agreed.
We will generate visualizations of selected long-lived binding events with single-particle trajectories overlaid on the imaging data — using a multi-frame color overlay (e.g., five sequential frames in distinct colors superimposed) so that linkage of the spot across frames is visually unambiguous — and include them as a new supplementary figure or movie. Examples will be drawn from each cell system to demonstrate consistent tracking quality.
Reviewer 3 (Public review):
(1) Photobleaching correction; per-cell bleach lifetimes
Report the per-stage (or per-cell) photobleaching lifetimes and the photobleachcorrected residence time values alongside apparent values, ideally with an H2B-Halo control.
Agreed.
Addressed by the photobleach-rate distribution and H2B-HaloTag control analyses described under R1 point 2. The supplementary figure will explicitly compare per-cell bleach lifetimes across stages, report photobleach-corrected residence-time values alongside apparent values and include H2B-HaloTag controls under matched conditions in each cell line.
(2) Mechanistic differences across systems
The three systems show qualitatively different signatures: residence time change in G1EER4, bound fraction expansion in HPC7 and primary cells. Reporting an on-rate proxy alongside k_off would help.
Agreed.
Addressed by the cross-system kinetic framing described under R1 point 7 and by the GRID state-spectrum analysis described under R1 point 1. We will explicitly frame the three systems in terms of underlying kinetic mechanism in both Results and Discussion, following the conceptual distinction emphasized by Ling et al. (Science 2026) in which residence time reports binding stability once engaged, whereas changes in bound fraction or event frequency can indicate altered association/recruitment efficiency. In this framework, the G1E-ER4 residencetime signature is consistent with reduced dissociation (a longer-lived bound state), while the longlived-fraction expansion in HPC7 and primary cells is consistent with an increased target-search efficiency or specific-binding-competent pool. Alongside the GRID-derived state-spectrum analysis, we will report an apparent engagement-rate proxy calculated as binding events per unit imaging time normalized to detectable molecule number; this proxy is an approximation, not a direct k_on measurement, as accurate determination of k_on from single-molecule tracking requires concentration-dependent on-rate experiments that are outside the scope of the present study. We thank the reviewer for this suggestion, which we agree sharpens rather than alters the central message.
(3) Per-cell GATA2 concentration and the uncoupling claim
Quantify total nuclear GATA2-Halo signal per cell across stages; for primary cells, a western blot or quantitative immunofluorescence on flow-sorted populations would make the uncoupling argument more defensible.
Agreed.
For the cell lines, the per-cell nuclear GATA2-Halo quantification described in our response to R2 point 1 addresses this point.
For primary cells, where the biological claim is strongest, we will exploit the endogenous Gata2SNAP knock-in itself as a quantitative reporter of total GATA2 protein. Specifically, we will label flow-sorted CD71/Ter119 populations from Gata2-SNAP mouse bone marrow with SNAP-Cell 647-SiR at saturating concentration in a parallel acquisition to the limiting-label single-molecule tracking experiment. Total nuclear SNAP-GATA2 fluorescence at saturating labeling provides a measure of endogenous GATA2 abundance per cell at each erythroid stage, in the same chemistry used for our single-molecule measurements, and will be benchmarked against a SNAPRPB1/U2OS reference standard for absolute molecule counting. This approach (i) measures the protein of interest in the labeling chemistry already established in this study; (ii) avoids reliance on quantitative immunofluorescence, which we have not been able to validate under our flowsorted-cell conditions; and (iii) extends the same analytical framework — saturating versus limiting labeling, with U2OS reference standards — across cell lines and primary cells. Quantitative western blotting on flow-sorted populations remains an alternative we will consider if specifically requested by the reviewers.
(4) Single-cell distribution analysis
Distribution-based statistics (K-S test, mixture model) rather than (or alongside) meanbased ANOVA, particularly for the Early populations, which look potentially bimodal.
Agreed.
We will perform Kolmogorov–Smirnov and Gaussian mixture model analyses of the single-cell long-lived fraction and residence-time distributions across stages, reporting these alongside the existing Welch ANOVA results in a new supplementary figure. This analysis is consistent with the conceptual framework cited in the manuscript (Wheat et al., 2020; Palii et al., 2019) for probabilistic hematopoietic transitions and may reveal subpopulation structure underlying the Early-stage signal. The GRID analysis further complements this by formally testing whether multi-state mixture models are statistically preferred at each stage. However, GRID analysis requires aggregating binding events across cells, which limits our ability to monitor changes in population dispersion at the single-cell level.
(5) Quantitative integration of CUT&Tag with SMT
Attempt a back-of-the-envelope calculation of whether the residence-time or fraction changes are quantitatively consistent with the acquisition of the 1,167 Early-restricted sites.
Partially agreed; will attempt an order-of-magnitude framing.
We thank the reviewer for this thoughtful suggestion. We agree that more explicit framing of the quantitative relationship between the two datasets will strengthen the integration. We will add a paragraph to the Discussion presenting an order-of-magnitude calculation linking the observed residence-time and long-lived-fraction changes to the steady-state occupancy increase predicted at competent regulatory sites, with explicit caveats regarding (i) the inherently semi-quantitative nature of CUT&Tag signal and (ii) the assumptions required to translate population-averaged occupancy into the genome-wide site count observed. For the G1EER4 cells, we observe relatively minor shifts in population-mean behavior as single-cell dispersion increases. Therefore, it may be difficult to directly link population-based measurements (e.g. CUT&Tag) with single-cell kinetic measurements (SPT). This distinction between occupancy and dynamics is consistent with recent systematic SMT analysis of the eukaryotic transcription machinery, in which factors appearing persistently associated in ensemble genomic assays were shown to exchange on second-scale timescales in living cells (Ling et al., Science 2026), emphasizing that population genomic occupancy and single-molecule residence time are complementary but not directly interchangeable measurements. Closing this gap rigorously is a major hurdle for the field and will require substantial technology development on quantitative single-cell CUT&Tag occupancy measurements. We will therefore frame our analysis as a consistency check rather than a strict quantitative integration. The reviewer notes that this analysis “does not change the central message; it sharpens it,” and we agree.
(6) Short-lived kinetic interpretation and tracking parameters
The 1.5 s gap allowance is long relative to the short-lived residence times in primary cells. A sensitivity analysis with tighter gap parameters would help. Also clarify how slowing of search reconciles with increased binding events at Early.
Agreed.
Addressed by the tracking-parameter sensitivity analysis described under R1 point 2. We apologize for the lack of clarity in our original description of the gap allowance. Our current maximum off-frame parameter is set to 2 frames, corresponding to a 0.5-s gap allowance. We will rerun the tracking analysis on representative datasets using a maximum off-frame parameter of 1, corresponding to no missed frames, and will report the resulting residence-time distributions alongside the original analysis to demonstrate robustness. We will also clarify in the Results and Discussion how changes in short-lived binding kinetics are reconciled with the increase in detectable binding events at the Early stage, drawing on the apparent engagement-rate proxy interpreted alongside the GRID-derived state-spectrum analysis.
(7) CUT&Tag peak definition and quantitative analysis
Report (a) signal intensity distribution at the 1,167 sites across stages (scatter or density plot beyond the heatmap) or (b) differential binding analysis (e.g., DESeq2). State replicate count and overlap of Early-restricted sets across replicates.
Agreed; normalized fold-change analysis completed, with replicate-aware differential binding analysis planned if additional replicates are generated.
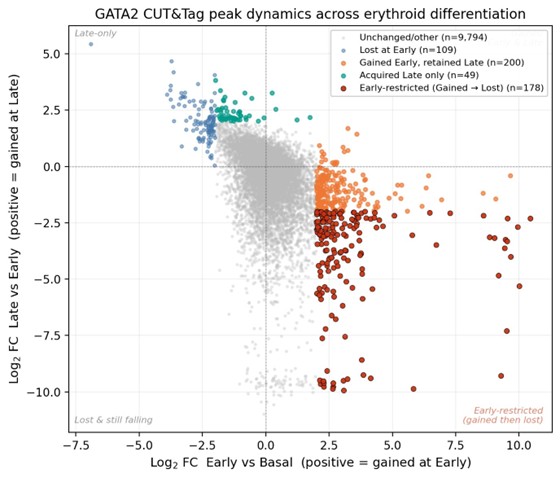
We have performed a normalized count-based fold-change analysis of the union peak set from the existing GATA2 CUT&Tag dataset (14,468 peaks) using the goodpeaks framework previously used in our group, yielding per-peak log2 fold-change values and discrete dynamicstatus calls (Gained / Lost / Unchanged at |log2FC| ≥ 2) for each of the two transitions (Basal → Early at 0 vs 2 h, and Early → Late at 2 vs 24 h). This provides a conservative quantitative complement to the presence/absence peak-calling analysis presented in Figure 5; if additional replicate data are generated, we will perform replicate-aware differential binding analysis (DiffBind/DESeq2; Love et al., 2014; Stark & Brown, 2011) and report replicate overlap. This analysis addresses option (b) of the reviewer’s request and also enables the visualization requested in option (a) as a cross-stage scatter (Author response image 1). We present the quantitative analysis as a supplement to the presence/absence-defined Early-restricted set in Figure 5 of the manuscript, providing two orthogonal lines of evidence for the same biology. We note that the CUT&Tag experiments were initially performed as a validation step to confirm that the tagged GATA2-Halo constructs recapitulate endogenous chromatin-binding behavior, including appropriate genomic localization and expected GATA switch dynamics. This validation supports the conclusion that the observed single-molecule kinetics reflect physiologically relevant GATA2 engagement. Having established this, we subsequently extended the dataset to perform the quantitative analyses presented here.
Quantitative findings.
- 384 peaks were Gained (|log2FC| ≥ 2) at the Basal → Early transition.
- 1,006 peaks were Lost over the same transition.
- 178 peaks were Gained at Basal → Early and subsequently Lost at Early → Late, defining the strict differentially-restricted Early set (Author response image 1, red points). This set represents the higher-confidence subset of the manuscript’s broader presence/absence-defined Earlyrestricted set (n = 1,167; defined as MACS2 peaks at q < 0.01 present at Early but absent at Basal and Late).
- 200 peaks were Gained at Early and retained at Late, indicating stable acquisition.
- 49 peaks were acquired only at the Late stage.
The discrepancy between the broader presence/absence set (1,167) and the strict differential set (178) reflects the analytical choice the reviewer raised: presence/absence calls based on a peaksignificance threshold are sensitive to near-threshold peaks, whereas differential analysis with a fold-change cutoff captures only sites with quantitatively pronounced stage-restricted enrichment. We interpret these as two complementary definitions: the broader set captures all peaks meeting a stage-specific peak-calling criterion, and the strict subset isolates the most quantitatively dynamic core of that population.
Importantly, the three named example loci shown in Figure 5D of the manuscript — Nono (promoter-proximal), Nr3c1 (intron 2), and Gata3 (distal intergenic) — all survive the strict differential criterion (each shows |log2FC| ≥ 2 in both transitions, consistent with a clean Gainedthen-Lost signature). The published example panel therefore represents the high-confidence intersection of both definitions, supporting the robustness of the manuscript’s selected illustrative cases.
We will explicitly state the number of CUT&Tag replicates per stage in the revised Methods and figure legends. Where the differential analysis is currently based on a single replicate per stage, we will explicitly note this and treat the strict subset as a conservative confirmatory analysis. An additional replicate is under consideration for the full revision, and if performed, overlap of Earlyrestricted calls across replicates will be reported.
Motif cross-validation against a matched-GC background using HOMER and/or MEME-ChIP is planned for the strict differential subset and will be reported alongside the original SeqPos analysis in the revised Figure 5F or its supplement.
Author response image 1.
Cross-stage log2 fold-change scatter for GATA2 CUT&Tag peaks. Each point represents a single peak in the union peak set (n = 14,468). The x-axis shows the log2 fold change from Basal (0 h) to Early (2 h); the y-axis shows the log2 fold change from Early (2 h) to Late (24 h). The sign convention follows the field-standard direction (positive log2FC = increased signal at the later time point). Peaks are colored by dynamic-status classification: unchanged/other (gray; n = 9,794); Lost at Early (blue; n = 109); Gained at Early and retained at Late (orange; n = 200); acquired only at Late (teal; n = 49); and Early-restricted, defined as Gained at Early and Lost at Late with |log2FC| ≥ 2 in both transitions (red; n = 178). The Early-restricted population occupies the lower-right quadrant, consistent with a transient kinetic peak of GATA2 binding.
Author response image 2.
Density representation of GATA2 CUT&Tag peak dynamics with Early-restricted peaks highlighted.
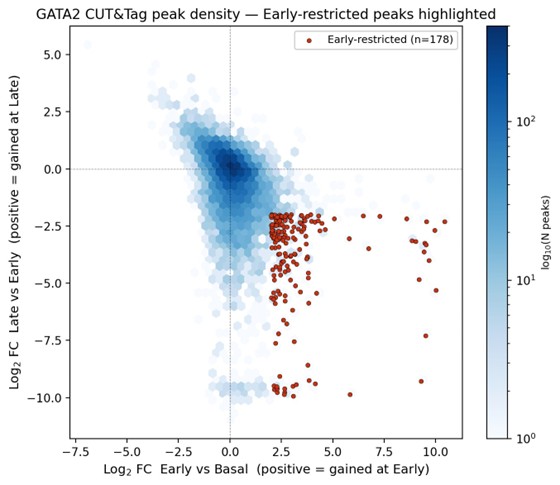
Author response image 2 is shown for illustrative reference and is not annotated with a separate legend; it presents the same data as Author response image 1 in a hexbin density format to emphasize the bulk of unchanged peaks at the origin and the spatial separation of the Early-restricted set.
Author response image 3.
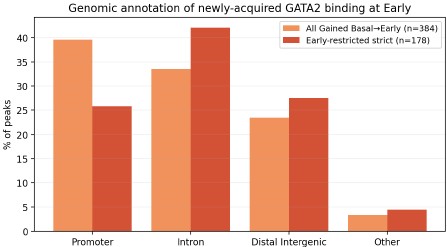
Genomic-annotation comparison of newly acquired GATA2 binding at Early. Stacked-bar comparison of genomic annotations (ChIPseeker classification) for two definitions of the newly acquired GATA2 peaks at the Early erythroid stage: all peaks Gained at Basal → Early (orange; n = 384) and the strict Early-restricted subset (Gained then Lost; red; n = 178). Annotation categories shown: Promoter (≤1 kb of TSS), Intron, Distal Intergenic, and Other (Exon, 5′/3′ UTR, Downstream). Both peak sets contain substantial promoter-proximal and distal/intronic components, consistent with the two-subclass model described in Figure 5E–G of the manuscript (GATA2-only promoter-proximal peaks with GATA/RUNX motifs, and GATA2/GATA1 cobound distal peaks with composite GATA/E-box motifs). The strict subset shows a higher proportion of intronic and distal-intergenic sites and a lower proportion of promoter-proximal sites than the full Gained set; this difference will be discussed transparently in the revised Results. Motif analysis (HOMER/MEME-ChIP, planned for the full revision) will be performed on both peak sets to confirm that the GATA/RUNX and GATA/E-box subclass signatures are preserved.
(8) Knock-in mouse hematopoietic validation
A brief characterization of basic hematopoietic parameters in homozygotes (CBC, LSK/HSPC frequencies, or colony assays) would confirm the tagged allele is physiological.
Agreed; data acquired and analyzed.
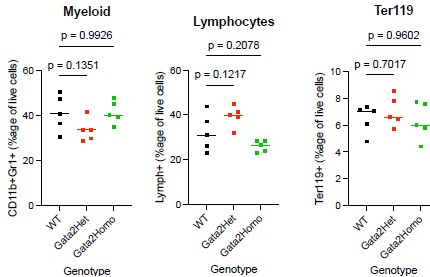
We have characterized mature trilineage hematopoietic populations in whole bone marrow from wild-type, heterozygous (Gata2Het), and homozygous (Gata2Homo) Gata2-SNAP knock-in mice (n = 5 per genotype). Bone marrow cells were stained for myeloid (CD11b+ Gr1+), lymphoid (CD3+/CD4+/CD8+/B220+/CD19+), and erythroid (Ter119+) markers and analyzed by flow cytometry. Lineage frequencies are shown as percentages of live bone marrow cells in a new Figure Supplement in the revised manuscript.
For myeloid and erythroid populations, omnibus one-way ANOVA detected no significant differences across genotypes (Myeloid: F(2,12) = 2.616, P = 0.1140; Erythroid: F(2,12) = 0.4943, P = 0.6219). Dunnett’s multiple-comparisons test against the WT control did not detect significant pairwise differences for either knock-in genotype (Myeloid: WT vs Het P = 0.1351, WT vs Homo P = 0.9926; Erythroid: WT vs Het P = 0.7017, WT vs Homo P = 0.9602).
For the lymphoid compartment, although the omnibus ANOVA reached significance (F(2,12) = 6.690, P = 0.0112), no pairwise comparison against WT remained significant after multiplecomparisons correction (Dunnett’s adjusted P values: WT vs Het = 0.1217; WT vs Homo = 0.2078). We therefore interpret this result conservatively. Brown-Forsythe and Bartlett’s tests showed no significant differences in variance across genotypes (P = 0.1423 and P = 0.0908), so the result is not attributable to unequal variances. We do not interpret these data as indicating an unambiguous lymphoid phenotype in either heterozygous or homozygous Gata2-SNAP mice; this interpretation is consistent with the broader pattern across all three lineages, in which no pairwise comparison against WT survives multiple-comparisons correction. We will note in the figure legend and in the Results text that more granular HSPC-compartment analysis (LSK, MPP, lineage-restricted progenitor frequencies) and a complete blood count (CBC) remain valuable directions for future characterization of this resource and will be considered for the full revision if specifically requested.
Author response image 4.
Bone marrow trilineage frequencies in Gata2-SNAP knock-in mice. Bone marrow was harvested from the femurs and tibias of wild-type (WT), heterozygous (Gata2Het), and homozygous (Gata2Homo) Gata2-SNAP knock-in mice (n = 5 per genotype; mixed sex; 12–14 weeks). After ACK lysis, cells were stained for myeloid (CD11b+ Gr1+), lymphoid (CD3+/CD4+/CD8+/B220+/CD19+), and erythroid (Ter119+) markers and analyzed by flow cytometry. Each dot represents one mouse, and horizontal bars indicate genotype means. Statistical results: Myeloid: ANOVA F(2,12) = 2.616, P = 0.1140; Dunnett’s adjusted P values WT vs Het = 0.1351, WT vs Homo = 0.9926. Lymphoid: ANOVA F(2,12) = 6.690, P = 0.0112 (omnibus); Dunnett’s adjusted P values WT vs Het = 0.1217, WT vs Homo = 0.2078. Erythroid: ANOVA F(2,12) = 0.4943, P = 0.6219; Dunnett’s adjusted P values WT vs Het = 0.7017, WT vs Homo = 0.9602. Brown-Forsythe and Bartlett’s tests for unequal variance were non-significant in all three lineages. Although the lymphoid omnibus ANOVA reached nominal significance, no pairwise comparison with WT remained significant after multiple-comparison correction; we therefore interpret this result conservatively (see response to R3 point 8).
Summary
We thank the editors and the three reviewers for the constructive and detailed assessment. The planned revisions consist of:
- Four new experiments [planned] (HaloTag/SNAP labeling efficiency and absolute molecule counts via U2OS reference standards; H2B-HaloTag photobleaching reference; percell quantification of total endogenous GATA2 in flow-sorted primary Gata2-SNAP populations via saturating SNAP-tag labeling, benchmarked against a SNAP-RPB1/U2OS reference standard; single-molecule tracking of GATA2 N-terminal, C-terminal, and double zinc-finger deletion mutants in the engineered cell systems as a binding-deficient functional control).
- Six analyses of existing data (GRID multi-state fitting [planned]; per-cell bleach-rate distributions and photobleach-corrected residence times [planned]; tracking-parameter sensitivity [planned]; nuclear-area normalization and total-displacement controls [planned]; normalized fold-change CUT&Tag analysis [completed; motif cross-validation planned], presented in Author response images 1–3; distribution-based single-cell statistics [planned]).
- One previously-acquired dataset [completed] (trilineage hematopoietic flow cytometry of homozygous Gata2-SNAP knock-in mice; presented in Author response image 4 with full statistical detail).
- Substantial revisions to text and figures [planned] to address statistical reporting, methodological description, mechanistic framing of cross-system differences, and refinement of the Figure 6 schematic.
With respect to the requested binding-deficient single-molecule control, we will attempt to address this directly using sequence-validated lentiviral constructs in hand encoding GATA2 mutants lacking the C-terminal zinc finger, the N-terminal zinc finger, or both. These mutant analyses will be complemented by GRID multi-state analysis and H2B-HaloTag controls, providing converging lines of validation for the two-state kinetic framework. We note that an analogous mutant cannot be examined in the physiological context of the Gata2-SNAP knock-in mouse, and we will frame the cell-line mutant analyses accordingly.
We believe these revisions directly address the editors’ specific guidance regarding labeling efficiency and methodological clarification. We thank the editors and reviewers for their time and look forward to submitting the revised manuscript.
References cited in this response:
References listed below are cited in this provisional response in support of the planned analyses and methodology.
Cattoglio, C., Pustova, I., Walther, N., Ho, J. J., Hantsche-Grininger, M., Inouye, C. J., Hossain, M. J., Dailey, G. M., Ellenberg, J., Darzacq, X., Tjian, R., & Hansen, A. S. (2019). Determining cellular CTCF and cohesin abundances to constrain 3D genome models. eLife, 8, e40164. https://doi.org/10.7554/eLife.40164
Gebhardt, J. C. M., Suter, D. M., Roy, R., Zhao, Z. W., Chapman, A. R., Basu, S., Maniatis, T., & Xie, X. S. (2013). Single-molecule imaging of transcription factor binding to DNA in live mammalian cells. Nature Methods, 10(5), 421–426. https://doi.org/10.1038/nmeth.2411
Hansen, A. S., Pustova, I., Cattoglio, C., Tjian, R., & Darzacq, X. (2017). CTCF and cohesin regulate chromatin loop stability with distinct dynamics. eLife, 6, e25776. https://doi.org/10.7554/eLife.25776
Haque, N., & Coleman, R. A. (2025). Dynamic transcription pre-initiation complex assembly governs initiation efficiency. bioRxiv. https://doi.org/10.1101/2025.05.07.652662
Heinz, S., Benner, C., Spann, N., Bertolino, E., Lin, Y. C., Laslo, P., Cheng, J. X., Murre, C., Singh, H., & Glass, C. K. (2010). Simple combinations of lineage-determining transcription factors prime cis-regulatory elements required for macrophage and B cell identities. Molecular Cell, 38(4), 576–589. https://doi.org/10.1016/j.molcel.2010.05.004
Kaya-Okur, H. S., Wu, S. J., Codomo, C. A., Pledger, E. S., Bryson, T. D., Henikoff, J. G., Ahmad, K., & Henikoff, S. (2019). CUT&Tag for efficient epigenomic profiling of small samples and single cells. Nature Communications, 10(1), 1930. https://doi.org/10.1038/s41467-019-09982-5
Kenworthy, C. A., Haque, N., Liou, S.-H., Chandris, P., Wong, V., Dziuba, P., Lavis, L. D., Liu, W.-L., Singer, R. H., & Coleman, R. A. (2022). Bromodomains regulate dynamic targeting of the PBAF chromatin-remodeling complex to chromatin hubs. Biophysical Journal, 121(9), 1738–1752. https://doi.org/10.1016/j.bpj.2022.03.027
Ling, Y. H., Liang, C., Wang, S., & Wu, C. (2026). Live-cell single-molecule dynamics of eukaryotic RNA polymerase machineries. Science, 391, eads0960. https://doi.org/10.1126/science.ads0960
Liu, Z., Legant, W. R., Chen, B.-C., Li, L., Grimm, J. B., Lavis, L. D., Betzig, E., & Tjian, R. (2014). 3D imaging of Sox2 enhancer clusters in embryonic stem cells. eLife, 3, e04236. https://doi.org/10.7554/eLife.04236
Loeffler, D., Wang, W., Hopf, A., Hilsenbeck, O., Bourgine, P. E., Rudolf, F., Martin, I., & Schroeder, T. (2018). Mouse and human HSPC immobilization in liquid culture by CD43- or CD44-antibody coating. Blood, 131(13), 1425–1429. https://doi.org/10.1182/blood-2017-07-794131
Love, M. I., Huber, W., & Anders, S. (2014). Moderated estimation of fold change and dispersion for RNAseq data with DESeq2. Genome Biology, 15(12), 550. https://doi.org/10.1186/s13059-014-0550-8
Machanick, P., & Bailey, T. L. (2011). MEME-ChIP: motif analysis of large DNA datasets. Bioinformatics, 27(12), 1696–1697. https://doi.org/10.1093/bioinformatics/btr189
Normanno, D., Boudarène, L., Dugast-Darzacq, C., Chen, J., Richter, C., Proux, F., Bénichou, O., Voituriez, R., Darzacq, X., & Dahan, M. (2015). Probing the target search of DNA-binding proteins in mammalian cells using TetR as model searcher. Nature Communications, 6, 7357. https://doi.org/10.1038/ncomms8357
Palii, C. G., Cheng, Q., Gillespie, M. A., Shannon, P., Mazurczyk, M., Napolitani, G., Price, N. D., Ranish, J. A., Morrissey, E., Higgs, D. R., & Brand, M. (2019). Single-cell proteomics reveal that quantitative changes in co-expressed lineage-specific transcription factors determine cell fate. Cell Stem Cell, 24(5), 812–825.e5. https://doi.org/10.1016/j.stem.2019.02.016
Sergé, A., Bertaux, N., Rigneault, H., & Marguet, D. (2008). Dynamic multiple-target tracing to probe spatiotemporal cartography of cell membranes. Nature Methods, 5(8), 687–694. https://doi.org/10.1038/nmeth.1233
Stark, R., & Brown, G. D. (2011). DiffBind: Differential binding analysis of ChIP-Seq peak data. Bioconductor. http://bioconductor.org/packages/release/bioc/html/DiffBind.html
Taylor, S. J., Stauber, J., Bohorquez, O., Tatsumi, G., Kumari, R., Chakraborty, J., Bartholdy, B. A., Schwenger, E., Sundaravel, S., Farahat, A. A., Dutta, A., Koche, R. P., Steidl, U., & Wheat, J. C. (2024). Pharmacological restriction of genomic binding sites redirects PU.1 pioneer transcription factor activity. Nature Genetics, 56(10), 2213–2227. https://doi.org/10.1038/s41588-024-01911-7
Wheat, J. C., Salsman, J., Reekie, I., Mathhwala, A., Black, K. L., Tiedt, R., Shroff, H., & Steidl, U. (2020). Single-molecule imaging of transcription dynamics in somatic stem cells. Nature, 583(7816), 431– 436. https://doi.org/10.1038/s41586-020-2432-4



