Author Response
The following is the authors’ response to the previous reviews.
We appreciate the reviewers for their insightful feedback, which has substantially improved our manuscript. Following the suggestions of the reviewers, we have undertaken the following major revisions:
a. Concerning data transformation, we have adjusted the methodology in Figures 2 and 3. Instead of normalizing c-Fos density to the whole brain c-Fos density as initially described, we now normalize to the c-Fos density of the corresponding brain region in the control group.
b. We have substituted the PCA approach with hierarchical clustering in Figures 2 and 3.
c. In the discussion section, we added a subsection on study limitations, focusing on the variations in drug administration routes and anesthesia depth.
Enclosed are our detailed responses to each of the reviewer's comments.
Reviewer #1:
1a. The addition of the EEG/EMG is useful, however, this information is not discussed. For instance, there are differences in EEG/EMG between the two groups (only Ket significantly increased delta/theta power, and only ISO decreased EMG power). These results should be discussed as well as the limitation of not having physiological measures of anesthesia to control for the anesthesia depth.
1b. The possibility that the differences in fos observed may be due to the doses used should be discussed.
1c. The possibility that the differences in fos observed may be due kinetic of
anesthetic used should be discussed.
Thank you for your suggestions. We have now discussed EEG/EMG result, limitation of not having physiological measures of anesthesia to control for the anesthesia depth, The possibility that the differences in fos observed may be due to the doses, The possibility that the differences in Fos observed may be due kinetic of anesthetic in the revised manuscript (Lines 308-331, also shown below).
Lines 308-331: "...Our findings indicate that c-Fos expression in the KET group is significantly elevated compared to the ISO group, and the saline group exhibits notably higher c-Fos expression than the home cage group, as seen in Supplementary Figures 2 and 3. Intraperitoneal saline injections in the saline group, despite pre-experiment acclimation with handling and injections for four days, may still evoke pain and stress responses in mice. Subtle yet measurable variations in brain states between the home cage and saline groups were observed, characterized by changes in normalized EEG delta/theta power (home cage: 0.05±0.09; saline: -0.03±0.11) and EMG power (home cage: -0.37±0.34; saline: 0.04±0.13), as shown in Supplementary Figure 1. These changes suggest a relative increase in overall brain activity in the saline group compared to the home cage group, potentially contributing to the higher c-Fos expression. Although the difference in EEG power between the ISO group and the home cage control was not significant, the increase in EEG power observed in the ISO group was similar to that of KET (0.47 ± 0.07 vs 0.59 ± 0.10), suggesting that both agents may induce loss of consciousness in mice. Regarding EMG power, ISO showed a significant decrease in EMG power compared to its control group. In contrast, the KET group showed a lesser reduction in EMG power (ISO: -1.815± 0.10; KET: -0.96 ± 0.21), which may partly explain the higher overall c-Fos expression levels in the KET group. This is consistent with previous studies where ketamine doses up to 150 mg/kg increase delta power while eliciting a wakefulness-like pattern of c-Fos expression across the brain [1]. Furthermore, the observed differences in c-Fos expression may arise in part from the dosages, routes of administration, and their distinct pharmacokinetic profiles. This variation is compounded by the lack of detailed physiological monitoring, such as blood pressure, heart rate, and respiration, affecting our ability to precisely assess anesthesia depth. Future studies incorporating comprehensive physiological monitoring and controlled dosing regimens are essential to further elucidate these relationships and refine our understanding of the effects of anesthetics on brain activity"
- Lu J, Nelson LE, Franks N, Maze M, Chamberlin NL, Saper CB: Role of endogenous sleep-wake and analgesic systems in anesthesia. J Comp Neurol 2008, 508(4):648-662.
2b. I am confused because Fig 2C seems to show significant decrease in %fos in the hypothalamus, midbrain and cerebellum after KET, while the author responded that " in our analysis, we did not detect regions with significant downregulation when comparing anesthetized mice with controls." Moreover the new figure in the rebuttal in response to reviewer 2 suggests that Ket increases Fos in almost every single region (green vs blue) which is not the conclusion of the paper.
Your concern regarding the apparent discrepancy is well-founded. The inconsistency arose due to an inappropriate data transformation, which affected the interpretation. We have now rectified this by adjusting the data transformation in Figures 2 and 3. Specifically, we have recalculated the log relative c-Fos density values relative to the control group for each brain region. This revision has resolved the issue, confirming that our analysis did not detect any regions with significant downregulation in the anesthetized mice compared to controls. We have also updated the results, discussion, and methods sections of Figures 2 and 3 to accurately reflect these changes and ensure consistency with our findings.
Author response image 1.
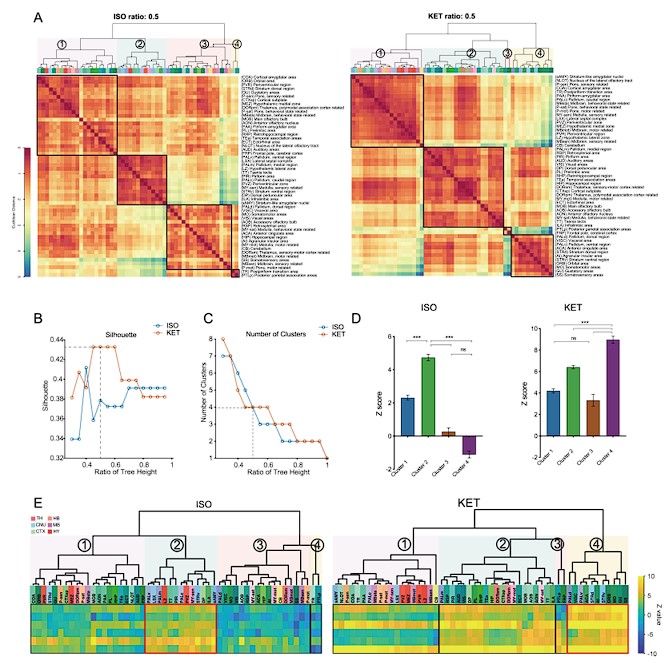
Figure 2. Whole-brain distributions of c-Fos+ cells induced by ISO and KET. (A) Hierarchical clustering was performed on the log relative c-Fos density data for ISO and KET using the complete linkage method based on the Euclidean distance matrix, with clusters identified by a dendrogram cut-off ratio of 0.5. Numerical labels correspond to distinct clusters within the dendrogram. (B) Silhouette values plotted against the ratio of tree height for ISO and KET, indicating relatively higher Silhouette values at 0.5 (dashed line), which is associated with optimal clustering. (C) The number of clusters identified in each treatment condition at different ratios of the dendrogram tree height, with a cut-off level of 0.5 corresponding to 4 clusters for both ISO and KET (indicated by the dashed line). (D) The bar graph depicts Z scores for clusters in ISO and KET conditions, represented with mean values and standard errors. One-way ANOVA with Tukey's post hoc multiple comparisons. ns: no significance; ***P < 0.001. (E) Z-scored log relative density of c-Fos expression in the clustered brain regions. The order and abbreviations of the brain regions and the numerical labels correspond to those in Figure 2A. The red box denotes the cluster with the highest mean Z score in comparison to other clusters. CTX: cortex; TH: thalamus; HY: hypothalamus; MB: midbrain; HB: hindbrain.
Author response image 2.
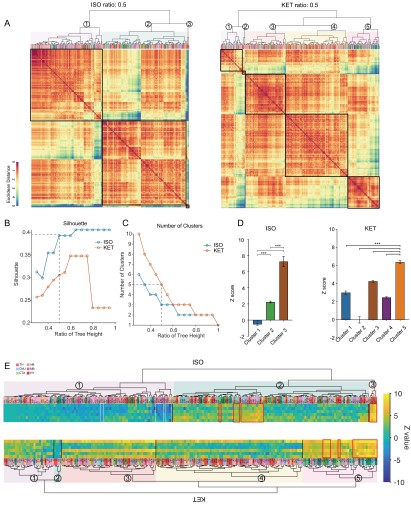
Figure 3. Similarities and differences in ISO and KET activated c-Fos brain areas. (A) Hierarchical clustering was performed on the log-transformed relative c-Fos density data for ISO and KET using the complete linkage method based on the Euclidean distance matrix, with clusters identified by a dendrogram cut-off ratio of 0.5. (B) Silhouette values are plotted against the ratio of tree height from the hierarchical clustered dendrogram in Figure 3A. (C) The relationship between the number of clusters and the tree height ratio of the dendrogram for ISO and KET, with a cut-off ratio of 0.5 resulting in 3 clusters for ISO and 5 for KET (indicated by the dashed line). (D) The bar graph depicts Z scores for clusters in ISO and KET conditions, represented with mean values and standard errors. One-way ANOVA with Tukey's post hoc multiple comparisons. ns: no significance; ***P < 0.001. (E) Z-scored log relative density of c-Fos expression within the identified brain region clusters. The arrangement, abbreviations of the brain regions, and the numerical labels are in accordance with Figure 3A. The red boxes highlight brain regions that rank within the top 10 percent of Z score values. The white boxes denote brain regions with an Z score less than -2.
- There are still critical misinterpretations of the PCA analysis. For instance, it is mentioned that " KET is associated with the activation of cortical regions (as evidenced by positive PC1 coefficients in MOB, AON, MO, ACA, and ORB) and the inhibition of subcortical areas (indicated by negative coefficients) " as well as " KET displays cortical activation and subcortical inhibition, whereas ISO shows a contrasting preference, activating the cerebral nucleus (CNU) and the hypothalamus while inhibiting cortical areas. To reduce inter-individual variability." These interpretations are in complete contradiction with the answer 2b above that there was no region that had decreased Fos by either anesthetic.
Thank you for bringing this to our attention. In response to your concerns, we have made significant revisions to our data analysis. We have updated our input data to incorporate log-transformed relative c-Fos density values, normalized against the control group for each brain region, as illustrated in Figures 2 and 3. Instead of PCA, we have applied this updated data to hierarchical clustering analysis. The results of these analyses are consistent with our original observation that neither anesthetic led to a decrease in Fos expression in any region.
- I still do not understand the rationale for the use of that metric. The use of a % of total Fos makes the data for each region dependent on the data of the other regions which wrongly leads to the conclusion that some regions are inhibited while they are not when looking at the raw data. Moreover, the interdependence of the variable (relative density) may affect the covariance structure which the PCA relies upon. Why not using the PCA on the logarithm of the raw data or on a relative density compared to the control group on a region-per-region basis instead of the whole brain?
Thank you for your insightful suggestion. Following your advice, we have revised our approach and now utilize the logarithm of the relative density compared to the control group on a region-by-region basis. We attempted PCA analyses using the logarithm of the raw data, the logarithm of the Z-score, and the logarithm of the relative density compared to control, but none yielded distinct clusters.
Author response image 3.
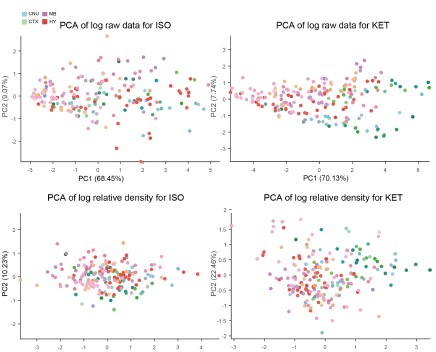
As a result, we employed hierarchical cluster analysis. We then examined the Z-scores of the log-transformed relative c-Fos densities (Figures 2E and 3E) to assess expression levels across clusters. Our analysis revealed that neither ISO nor KET treatments led to a significant suppression of c-Fos expression in the 53 brain regions examined. In the ISO group alone, there were 10 regions that demonstrated relative suppression (Z-score < -2, indicated by white boxes) as shown in Figure 3.
Fig. 2B: it's unclear to me why the regions are connected by a line. Such representation is normally used for time series/within-subject series. What is the rationale for the order of the regions and the use of the line? The line connecting randomly organized regions is meaningless and confusing.
Thank you for your suggestion. We have discontinued the use of PCA calculations and have removed this figure.
Fig 6A. The correlation matrices are difficult to interpret because of the low resolution and arbitrary order of brain regions. I recommend using hierarchical clustering and/or a combination of hierarchical clustering and anatomical organization (e.g. PMID: 31937658). While it is difficult to add the name of the regions on the graph I recommend providing supplementary figures with large high-resolution figures with the name of each brain region so the reader can actually identify the correlation between specific brain regions and the whole brain, Rationale for Metric Choice: Note that I do not dispute the choice of the log which is appropriate, it is the choice of using the relative density that I am questioning.
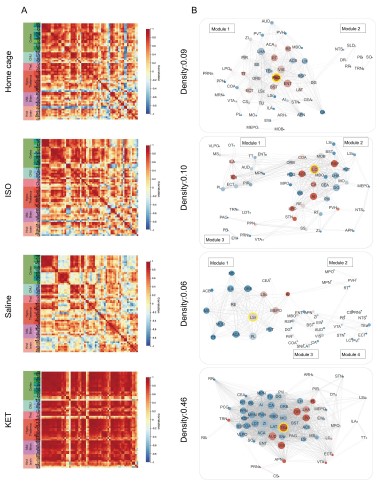
Thank you for your constructive feedback. In line with your suggestion, we have implemented hierarchical clustering combined with anatomical organization as per the referenced literature. Additionally, we have updated the vector diagrams in Figure 6A to present them with greater clarity.
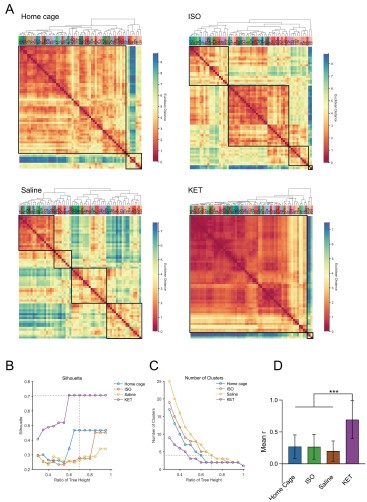
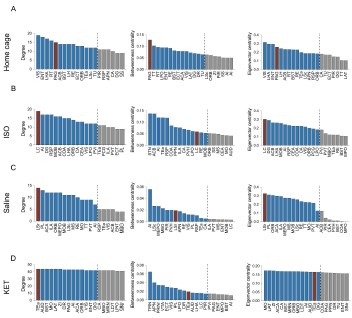
Furthermore, we have revised our network modular division method based on cited literature recommendations. We used hierarchical clustering with correlation coefficients to segment the network into modules, illustrated in Figure 6—figure supplement 1. Due to the singular module structure of the KET network and the sparsity of intermodular connections in the home cage and saline networks, the assessment of network hub nodes did not employ within-module degree Z-score and participation coefficients, as these measures predominantly underscore the importance of connections within and between modules. Instead, we used degree, betweenness centrality, and eigenvector centrality to detect the hub nodes, as detailed in Figure 6—figure supplement 2. With this new approach, the hub node for the KET condition changed from SS to TeA. Corresponding updates have been made to the results section for Figure 6, as well as to the related discussions and the abstract of our paper.
Author response image 4.
Figure 6. Generation of anesthetics-induced networks and identification of hub regions. (A) Heatmaps display the correlations of log c-Fos densities within brain regions (CTX, CNU, TH, HY, MB, and HB) for various states (home cage, ISO, saline, KET). Correlations are color-coded according to Pearson's coefficients. The brain regions within each anatomical category are organized by hierarchical clustering of their correlation coefficients. (B) Network diagrams illustrate significant positive correlations (P < 0.05) between regions, with Pearson’s r exceeding 0.82. Edge thickness indicates correlation magnitude, and node size reflects the number of connections (degree). Node color denotes betweenness centrality, with a spectrum ranging from dark blue (lowest) to dark red (highest). The networks are organized into modules consistent with the clustering depicted in Supplementary Figure 8. Figure 6—figure supplement 1
Author response image 5.
Figure 6—figure supplement 1. Hierarchical clustering of brain regions under various conditions: home cage, ISO, saline, and KET. (A) Heatmaps show the relative distances among brain regions assessed in naive mice. Modules were identified by sectioning each dendrogram at a 0.7 threshold. (B) Silhouette scores plotted against the dendrogram tree height ratio for each condition, with optimal cluster definition indicated by a dashed line at a 0.7 ratio. (C) The number of clusters formed at different cutoff levels. At a ratio of 0.7, ISO and saline treatments result in three clusters, whereas home cage and KET conditions yield two clusters. (D) The mean Pearson's correlation coefficient (r) was computed from interregional correlations displayed in Figure 6A. Data were analyzed using one-way ANOVA with Tukey’s post hoc test, ***P < 0.001.
Author response image 6.
Figure 6—figure supplement 2. Hub region characterization across different conditions: home cage (A), ISO (B), saline (C), and KET (D) treatments. Brain regions are sorted by degree, betweenness centrality, and eigenvector centrality, with each metric presented in separate bar graphs. Bars to the left of the dashed line indicate the top 20% of regions by rank, highlighting the most central nodes within the network. Red bars signify regions that consistently appear within the top rankings for both degree and betweenness centrality across the metrics.
- I am still having difficulties understanding Fig. 3.
Panel A: The lack of identification for the dots in panel A makes it impossible to understand which regions are relevant.
Panel B: what is the metric that the up/down arrow summarizes? Fos density? Relative density? PC1/2?
Panel C: it's unclear to me why the regions are connected by a line. Such representation is normally used for time series/within-subject series. What is the rationale for the order of the regions?
Thank you for your patience and for reiterating your concerns regarding Figure 3.
a. In Panel A, we have substituted the original content with a display of hierarchical clustering results, which now clearly marks each brain region. This change aids readers in identifying regions with similar expression patterns and facilitates a more intuitive understanding of the data.
a. Acknowledging that our analysis did not reveal any significantly inhibited brain regions, we have decided to remove the previous version of Panel B from the figure.
b. We have discontinued the use of PCA calculations and have removed this figure to avoid any confusion it may have caused. Our revised analysis focuses on hierarchical clustering, which are presented in the updated figures.
Reviewer #2:
- Aside from issues with their data transformation (see below), (a) I think they have some interesting Fos counts data in Figures 4B and 5B that indicate shared and distinct activation patterns after KET vs. ISO based anesthesia. These data are far closer to the raw data than PC analyses and need to be described and analyzed in the first figures long before figures with the more abstracted PC analyses. In other words, you need to show the concrete raw data before describing the highly transformed and abstracted PC analyses. (b) This gets to the main point that when selecting brain areas for follow up analyses, these should be chosen based on the concrete Fos counts data, not the highly transformed and abstracted PC analyses.
Thank you for your suggestions.
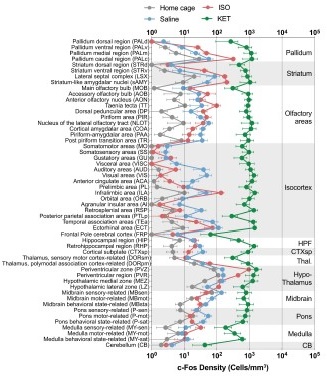
a. We have added the original c-Fos cell density distribution maps for Figures 2, 3, 4, and 5 in Supplementary Figures 2 and 3 (also shown below). To maintain consistency across the document, we have updated both the y-axis label and the corresponding data in Figures 4B and 5B from 'c-Fos cell count' to 'c-Fos density'.
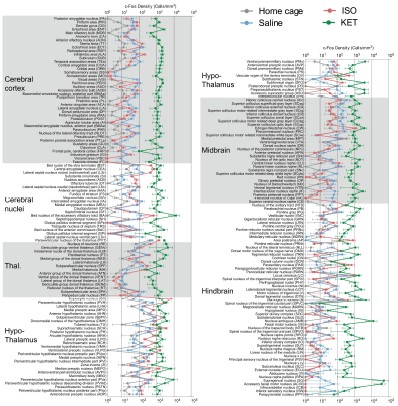
b. The analyses in Figures 2 and 3 include all brain regions. Figures 4 and 5 present the brain regions with significant differences as shown in Figure 3—figure supplement 1.
Author response image 7.
Figure 2—figure supplement 1. The c-Fos density in 53 brain areas for different conditions. (home cage, n = 6; ISO, n = 6 mice; saline, n = 8; KET, n = 6). Each point represents the c-Fos density in a specific brain region, denoted on the y-axis with both abbreviations and full names. Data are shown as mean ± SEM. Brain regions are categorized into 12 brain structures, as indicated on the right side of the graph.
Author response image 8.
Figure 3—figure supplement 1. c-Fos density visualization across 201 distinct brain regions under various conditions. The graph depicts the c-Fos density levels for each condition, with data presented as mean and standard error. Brain regions with statistically significant differences are featured in Figures 4 and 5. Brain regions are organized into major anatomical subdivisions, as indicated on the left side of the graph.
- Now, the choice of data transformation for Fos counts is the most significant problem. First, the authors show in the response letter that not using this transformation (region density/brain density) leads to no clustering. However, they also showed the region-densities without transformation (which we appreciate) and it looks like overall Fos levels in the control group Home (ISO) are a magnitude (~10-fold) higher than those in the control group Saline (KET) across all regions shown. This large difference seems unlikely to be due to a biologically driven effect and seems more likely to be due to a technical issue, such as differences in staining or imaging between experiments. Was the Homecage-ISO experiment or at least the Fos labeling and imaging performed at the same time as for the Saline-Ketamine experiment? Please state the answer to this question in the Results section one way or the other.
a. “Home (ISO) are a magnitude (~10-fold) higher than those in the control group saline (KET) across all regions shown.” We believe you might be indicating that compared to the home cage group (gray), the saline group (blue) shows a 10-fold higher expression (Supplementary Figure 2/3). Indeed, we observed that the total number of c-Fos cells in the home cage group is significantly lower than in the saline group. This difference may be due to reduced sleep during the light-on period (ZT 6- ZT 7.5) in the saline mice or the pain and stress response caused by intraperitoneal injection of saline. We have explained this discrepancy in the discussion section.Line 308-317(also see below)
“…Our findings indicate that c-Fos expression in the KET group is significantly elevated compared to the ISO group, and the saline group exhibits notably higher c-Fos expression than the home cage group, as seen in Supplementary Figures 2 and 3. Intraperitoneal saline injections in the saline group, despite pre-experiment acclimation with handling and injections for four days, may still evoke pain and stress responses in mice. Subtle yet measurable variations in brain states between the home cage and saline groups were observed, characterized by changes in normalized EEG delta/theta power (home cage: 0.05±0.09; saline: -0.03±0.11) and EMG power (home cage: -0.37±0.34; saline: 0.04±0.13), as shown in Figure 1—figure supplement 1. These changes suggest a relative increase in overall brain activity in the saline group compared to the home cage group, potentially contributing to the higher c-Fos expression…”
b. Drug administration and tissue collection for both Homecage-ISO and Saline-Ketamine groups were consistently scheduled at 13:00 and 14:30, respectively. Four mice were administered drugs and had tissues collected each day, with two from the experimental group and two from the control group, to ensure consistent sampling. The 4% PFA fixation time, sucrose dehydration time, primary and secondary antibody concentrations and incubation times, staining, and imaging parameters and equipment (exposure time for VS120 imaging was fixed at 100ms) were all conducted according to a unified protocol.
We have included the following statement in the results section: Line 81-83, “Sample collection for all mice was uniformly conducted at 14:30 (ZT7.5), and the c-Fos labeling and imaging were performed using consistent parameters throughout all experiments. ”
- Second, they need to deal with this large difference in overall staining or imaging for these two (Home/ISO and Saline/KET) experiments more directly; their current normalization choice does not really account for the large overall differences in mean values and variability in Fos counts (e.g. due to labeling and imaging differences).
3a. I think one option (not perfect but I think better than the current normalization choice) could be z-scoring each treatment to its respective control. They can analyze these z-scored data first, and then in later figures show PC analyses of these data and assess whether the two treatments separate on PC1/2. And if they don't separate, then they don't separate, and you have to go with these results.
3b. Alternatively, they need to figure out the overall intensity distributions from the different runs (if that the main reason of markedly different counts) and adjust their thresholds for Fos-positive cell detection based on this. I would expect that the saline and HC groups should have similar levels of activation, so they could use these as the 'control' group to determine a Fos-positive intensity threshold that gets applied to the corresponding 'treatment' group.
3c. If neither 3a nor 3b is an option then they need to show the outcomes of their analysis when using the untransformed data in the main figures (the untransformed data plots in their responses to reviewer are currently not in the main or supplementary figs) and discuss these as well.
a. Thank you very much for your valuable suggestion. We conducted PCA analysis on the ISO and KET data after Z-scoring them with their respective control groups and did not find any significant separation.
Author response image 9.
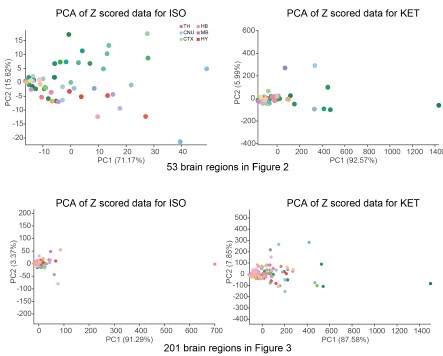
As mentioned in our response to reviewer #1, we have reprocessed the raw data. Firstly, we divided the ISO and KET data by their respective control brain regions and then performed a logarithmic transformation to obtain the log relative c-Fos density. The purpose of this is to eliminate the impact of baseline differences and reduce variability. We then performed hierarchical clustering, and finally, we Z-scored the log relative c-Fos density data. The aim is to facilitate comparison of ISO and KET on the same data dimension (Figure 2 and 3).
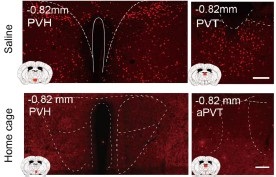
b. We appreciate your concerns regarding the detection thresholds for Fos-positive cells. The enclosed images, extracted from supplementary figures for Figures 4 and 5, demonstrate notable differences in c-Fos expression between saline and home cage groups in specific brain regions. These regions exhibit a discernible difference in staining intensity, with the saline group showing enhanced c-Fos expression in the PVH and PVT regions compared to the home cage group. An examination of supplementary figures for Figures 4 and 5 shows that c-Fos expression in the home cage group is consistently lower than in the saline group. This comparative analysis confirms that the discrepancies in c-Fos levels are not due to varying detection thresholds.
Author response image 10.
b. We have added the corresponding original data graphs to Supplementary Figures 2 and 3, and discussed the potential reasons for the significant differences between these groups in the discussion section (also shown below).
Lines 308-317: "...Our findings indicate that c-Fos expression in the KET group is significantly elevated compared to the ISO group, and the saline group exhibits notably higher c-Fos expression than the home cage group, as seen in Supplementary Figures 2 and 3. Intraperitoneal saline injections in the saline group, despite pre-experiment acclimation with handling and injections for four days, may still evoke pain and stress responses in mice. Subtle yet measurable variations in brain states between the home cage and saline groups were observed, characterized by changes in normalized EEG delta/theta power (home cage: 0.05±0.09; saline: -0.03±0.11) and EMG power (home cage: -0.37±0.34; saline: 0.04±0.13), as shown in Figure 3—figure supplement 1. These changes suggest a relative increase in overall brain activity in the saline group compared to the home cage group, potentially contributing to the higher c-Fos expression.…”


