Peer review process
Revised: This Reviewed Preprint has been revised by the authors in response to the previous round of peer review; the eLife assessment and the public reviews have been updated where necessary by the editors and peer reviewers.
Read more about eLife’s peer review process.Editors
- Reviewing EditorLynne-Marie PostovitQueens University, Kingston, Canada
- Senior EditorWafik El-DeiryBrown University, Providence, United States of America
Reviewer #1 (Public review):
Summary:
Tian et al. describes how TIPE regulates melanoma progression, stemness, and glycolysis. The authors link high TIPE expression to increased melanoma cell proliferation and tumor growth. TIPE causes dimerization of PKM2, as well as translocation of PKM2 to the nucleus, thereby activating HIF-1alpha. TIPE promotes the phosphorylation of S37 on PKM2 in an ERK-dependent manner. TIPE is shown to increase stem-like phenotype markers. The expression of TIPE is positively correlated with the levels of PKM2 Ser37 phosphorylation in murine and clinical tissue samples. Taken together, the authors demonstrate how TIPE impacts melanoma progression, stemness, and glycolysis through dimeric PKM2 and HIF-1alpha crosstalk.
The authors manipulated TIPE expression using both shRNA and overexpression approaches throughout the manuscript. Using these models, they provide strong evidence of the involvement of TIPE in mediating PKM2 Ser37 phosphorylation and dimerization. The authors also used mutants of PKM2 at S37A to block its interaction with TIPE and HIF-1alpha. In addition, an ERK inhibitor (U0126) was used to block the phosphorylation of Ser37 on PKM2. The authors show how dimerization of PKM2 by TIPE causes nuclear import of PKM2 and activation of HIF-1alpha and target genes. Pyridoxine was used to induce PKM2 dimer formation, while TEPP-46 was used to suppress PKM2 dimer formation. TIPE maintains stem cell phenotypes by increasing expression of stem-like markers. Furthermore, the relationship between TIPE and Ser37 PKM2 was demonstrated in murine and clinical tissue samples.
The evaluation of how TIPE causes metabolic reprogramming can be better assessed using isotope tracing experiments and improved bioenergetic analysis.
Reviewer #2 (Public review):
In this article, Tian et al present a convincing analysis of the molecular mechanisms underpinning TIPE-mediated regulation of glycolysis and tumor growth in melanoma. The authors begin by confirming TIPE expression in melanoma cell lines and identify "high" and "low" expressing models for functional analysis. They show that TIPE depletion slows tumour growth in vivo, and using both knockdown and over expression approaches, show that this is associated with changes in glycolysis in vitro. Compelling data using multiple independent approaches is presented to support an interaction between TIPE and the glycolysis regulator PKM2, and over-expression of TIPE promoted nuclear translocation of PKM2 dimers. Mechanistically, the authors also demonstrate that PKM2 is required for TIPE-mediated activation of HIF1a transcriptional activity, as assessed using an HRE-promoter reporter assay, and that TIPE-mediated PKM2 dimerization is p-ERK dependent. Finally, the dependence of TIPE activity on PKM2 dimerization was demonstrated on tumor growth in vivo and in regulation of glycolysis in vitro, and ectopic expression of HIF1a could rescue inhibition of PKM2 dimerization in TIPE overexpressing cells and reduced induction of general cancer stem cell markers, showing a clear role for HIF1a in this pathway.
The detailed mechanistic analysis of TIPE mediated regulation of PKM2 to control aerobic glycolysis and tumor growth is a major strength of the study and provides new insights into the molecular mechanisms that underpin the Warburg effect in melanoma cells. The main conclusions of this paper are well supported by data, however further investigation of a potential oncogenic effect of TIPE in melanoma patients is warranted to support the tumor promoting role of TIPE identified in the experimental models. Analysis of patient samples showed a significant increase in TIPE protein levels in primary melanoma compared to benign skin tumours, and a further increase upon metastatic progression. Moreover, TIPE levels correlate with proliferation (Ki67) and hypoxia gene sets in the TCGA melanoma patient dataset. However, the authors note in the discussion that high TIPE expression associates with better survival outcomes in the TCGA melanoma patients and these data should be included in this paper. Further investigation of how TIPE-mediated regulation of glycolysis contributes to melanoma progression is warranted to confirm the authors claims of a potential oncogenic function. Regardless, the new insights into the molecular mechanisms underpinning TIPE-mediated aerobic glycolysis in melanoma are convincing and will likely generate interest in the cancer metabolism field.
Author response:
The following is the authors’ response to the original reviews.
Reviewer #1 (Public Review):
Summary:
Tian et al. describe how TIPE regulates melanoma progression, stemness, and glycolysis. The authors link high TIPE expression to increased melanoma cell proliferation and tumor growth. TIPE causes dimerization of PKM2, as well as translocation of PKM2 to the nucleus, thereby activating HIF-1alpha. TIPE promotes the phosphorylation of S37 on PKM2 in an ERK-dependent manner. TIPE is shown to increase stem-like phenotype markers. The expression of TIPE is positively correlated with the levels of PKM2 Ser37 phosphorylation in murine and clinical tissue samples. Taken together, the authors demonstrate how TIPE impacts melanoma progression, stemness, and glycolysis through dimeric PKM2 and HIF-1alpha crosstalk.
Strengths:
The authors manipulated TIPE expression using both shRNA and overexpression approaches throughout the manuscript. Using these models, they provide strong evidence of the involvement of TIPE in mediating PKM2 Ser37 phosphorylation and dimerization. The authors also used mutants of PKM2 at S37A to block its interaction with TIPE and HIF-1alpha. In addition, an ERK inhibitor (U0126) was used to block the phosphorylation of Ser37 on PKM2. The authors show how dimerization of PKM2 by TIPE causes nuclear import of PKM2 and activation of HIF-1alpha and target genes. Pyridoxine was used to induce PKM2 dimer formation, while TEPP-46 was used to suppress PKM2 dimer formation. TIPE maintains stem cell phenotypes by increasing the expression of stem-like markers. Furthermore, the relationship between TIPE and Ser37 PKM2 was demonstrated in murine and clinical tissue samples.
Weaknesses:
The evaluation of how TIPE causes metabolic reprogramming can be better assessed using isotope tracing experiments and improved bioenergetic analysis.
Thank you very much for your suggestions. Unfortunately, we cannot complete the isotope tracing experiments due to the lack of instruments, nor with the help of the company after consulting several companies. We are very sorry for this imperfect experiment, and we have discussed this disadvantage in our manuscripts. Moreover, due to our negligence, there was only three metabolites were presented in the previous manuscripts. However, we have performed the routine untargeted metabolomics to demonstrate how TIPE causes metabolic reprogramming. We have added the detailed results as a new figure named as Figure S3, in which, the glycolysis pathway particularly pyruvate and lactic acid is decreased after TIPE interference.
Reviewer #2 (Public Review):
In this article, Tian et al present a convincing analysis of the molecular mechanisms underpinning TIPE-mediated regulation of glycolysis and tumor growth in melanoma. The authors begin by confirming TIPE expression in melanoma cell lines and identify "high" and "low" expressing models for functional analysis. They show that TIPE depletion slows tumour growth in vivo, and using both knockdown and over-expression approaches, show that this is associated with changes in glycolysis in vitro. Compelling data using multiple independent approaches is presented to support an interaction between TIPE and the glycolysis regulator PKM2, and the over-expression of TIPE-promoted nuclear translocation of PKM2 dimers. Mechanistically, the authors also demonstrate that PKM2 is required for TIPE-mediated activation of HIF1a transcriptional activity, as assessed using an HRE-promoter reporter assay, and that TIPE-mediated PKM2 dimerization is p-ERK dependent. Finally, the dependence of TIPE activity on PKM2 dimerization was demonstrated on tumor growth in vivo and in the regulation of glycolysis in vitro, and ectopic expression of HIF1a could rescue the inhibition of PKM2 dimerization in TIPE overexpressing cells and reduced induction of general cancer stem cell markers, showing a clear role for HIF1a in this pathway. The main conclusions of this paper are well supported by data, but some aspects of the experiments need clarification and some data panels are difficult to read and interpret as currently presented.
The detailed mechanistic analysis of TIPE-mediated regulation of PKM2 to control aerobic glycolysis and tumor growth is a major strength of the study and provides new insights into the molecular mechanisms that underpin the Warburg effect in cancer cells. However, despite these strengths, some weaknesses were noted, which if addressed will further strengthen the study.
(1) The analysis of patient samples should be expanded to more directly measure the relationship between TIPE levels and melanoma patient outcome and progression (primary vs metastasis), to build on the association between TIPE levels and proliferation (Ki67) and hypoxia gene sets that are currently shown.
Thanks for your suggestions, we have added the relationship between TIPE levels and progression (non-lymph node metastasis vs lymph node metastasis). In addition, we added the association between TIPE and Ki67 or LDH levels as your advised, as shown in Figure 7.
However, the relationship between TIPE levels and melanoma patient outcome is not presented in this article. One reason is that the tissue microarray lack of the survival data. Interestingly, the TCGA dataset showed that the higher TIPE expression has a favorable prognosis for melanoma. We are also very curious about this. Our following study indicated that TIPE might serve as a positive regulator of PD-L1. Therefore, the higher expression of TIPE presents more sensitive tendency to immunotherapy, resulting in a favorable prognosis in melanoma. The detailed mechanisms will be discussed in our following article, and we hope that it might as a continuous research topic for TIPE in melanoma.
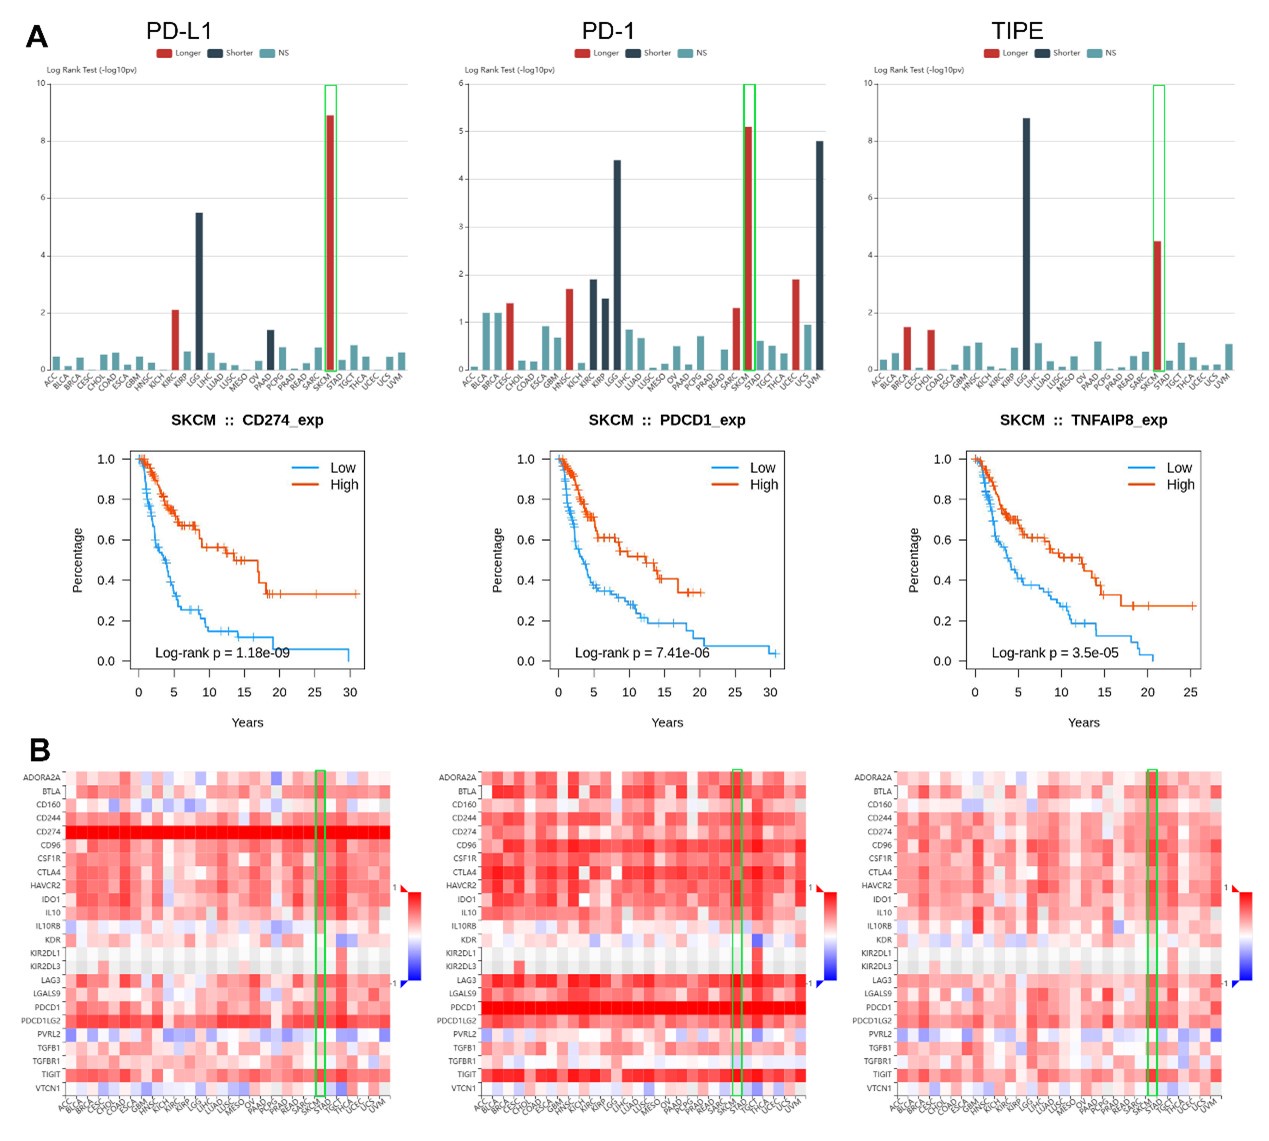
We just only disclose a little information that TIPE has a similar survival and immune signature to PD-L1 and PD-1 in melanoma as following:
Author response image 1.
(2) The duration of the in vivo experiments was not clearly defined in the figures, however, it was clear from the tumor volume measurements that they ended well before standard ethical endpoints in some of the experiments. A rationale for this should be provided because longer-duration experiments might significantly change the interpretation of the data. For example, does TIPE depletion transiently reduce or lead to sustained reductions in tumor growth?
Thanks for your suggestions. Actually, we have performed a pre-experiment before the formal experiments, and all the time points were referred to this. Furthermore, we have added the detailed time points into the figure legends as you suggested.
(3) The analysis of general cancer stem cell markers is solid and interesting, however inclusion of neural crest stem cell markers that are more relevant to melanoma biology would greatly strengthen this aspect of the study.
Thanks for your advices. We have selected two neural crest stem cell markers including Nestin and Sox10 to test their expression after overexpression of TIPE in G361 cells or interference of TIPE in A375 cells.
(4) The authors should take care that all data panels are clearly readable in the figures to facilitate appropriate interpretation by the reader.
Thanks for your suggestions. We have amended the data panels according to you advises to ensure it is clear and professionally presented.
Recommendations for the authors:
Reviewer #1 (Recommendations For The Authors):
Major points
(1) In Figure 1D, glucose, pyruvate, and lactate were measured at a steady state. However, metabolites at steady state do not accurately depict changes in pathway activity. An isotope tracing experiment (i.e., using labelled 13C glucose) can be used to study glucose catabolism into pyruvate, as well as tracing into lactate or into the TCA cycle following changes in TIPE expression. In addition, although the authors point towards changes in metabolic reprogramming, only three metabolites were measured. The use of isotope tracing to monitor metabolites from more than one pathway would be suggested to support the claim that metabolism is being reprogrammed due to TIPE.
Thank you very much for your suggestions. Unfortunately, we cannot complete the isotope tracing experiments due to the lack of instruments, nor with the help of the company after consulting several companies. We are very sorry for this imperfect experiment, and we have discussed this disadvantage in our manuscripts. Moreover, due to our negligence, there was only three metabolites were presented in the previous manuscripts. However, we have performed the routine untargeted metabolomics to demonstrate how TIPE causes metabolic reprogramming. We have added the detailed results as a new figure named as Figure S3, in which, the glycolysis pathway particularly pyruvate and lactic acid is decreased after TIPE interference.
(2) In Figure 1H, extracellular acidification was used to determine glycolytic activity. However, bicarbonate secretion can also greatly affect pH, and should be considered (PMID 25449966). Although total ATP content was measured, the contribution of ATP from glycolysis can be also determined (see PMID 28270511) to provide a more accurate representation of glycolytic ATP production.
Thanks for your suggestions again. As described at the above, we will improve our measurement methods in the future, and we have discussed our weakness in the manuscripts.
(3) On page 5, lines 108-111, the authors show that "This process represents an important regulator of the TIPE family switching between oxidative phosphorylation and aerobic glycolysis, paving the way for cancer-specific metabolism in response to low-oxygen challenge." However, there is no data on oxidative phosphorylation. What is the effect of TIPE on oxygen consumption?
Thanks for your careful and professional advices. We have conducted a thorough review of the manuscript for language accuracy and corrected this term to eliminate confusion and ensure the text is clear and professionally presented.
Minor points
(1) On page 3, line 68, it is unclear what is increasing lactate levels, as lactate can be transported inside of cells.
Thanks for your suggestions, we have corrected this misdescription to improve the overall quality and readability of the manuscript.
(2) In Figure 1B, RNA sequencing was performed on TIPE overexpressing G361 cells. The "ribosome" pathway has the highest count and lowest p-value. However, there is no mention of this in the text.
Thanks for your suggestions, we selected aerobic glycolysis as our major story comprehensively according to the transcriptomics, metabolomics and the Co-IP/MS results. Anyway, the "ribosome" pathway as you pointed might is our next research topic in the future.
(3) It would be helpful to include the cell line in Figure S1B-C as well as in the figure legend.
Thanks for your suggestions, we have added the cell line into Figure S1B-C as well as in the figure legend.
(4) Concerning supplementary figures, it would be helpful to include the panel numbers when referring to them in the main text (see line 120 or 122 as an example).
Thanks for your suggestions, we have added the panel numbers when referring to them in the main text.
(5) The sentence on lines 127-131 is very confusing.
Thanks for your suggestions, we have corrected the improper descriptions as you mentioned.
(6) In Figure S3, qPCR is misspelled in the figure legend. Also, it would be helpful to include what is meant by "relative expression" on the y-axis of Figure S3A.
Thanks for your suggestions, we have corrected the errors as you pointed. Due to the y-axis represents the expression both of TIPE and HIF-1α, the present description might be more suitable.
(7) There is an extra space on line 196.
Thanks for your suggestions, we have corrected as you pointed.
(8) In Figure 7E LDH staining was performed. Which isoform of LDH was detected?
Actually, we stained total LDH in Figure 7E.
(9) On line 931, Warburg is misspelled.
Thanks for your suggestion, we have corrected all mentioned typos, including " Warburg " in lines 931.
Reviewer #2 (Recommendations For The Authors):
Major comments:
- Supplementary Figure 2G. Unit of time measurement for tumor growth panel needs to be defined. If this refers to days, 5 days is a relatively short period to assess tumor growth differences in vivo, and indeed, 1000-1200mm3 is a standard ethical end-point for these types of models, and this experiment was concluded well before reaching these tumor sizes. Can the authors explain why they ended this experiment at this timepoint?
Thanks for your suggestions. As you suggested, we have added the detailed time points into the figure legends. Actually, we have performed a pre-experiment before the formal experiments, and all the time points were referred to this.
- Supplementary Figure 2j - Correlation analysis between TIPE expression and overall survival outcome in melanoma patients is more relevant to support the experimental observations described in the paper than the correlation with Ki67. This analysis should also be provided. In addition, is there any difference in TIPE expression between primary and metastatic melanoma patients which would then more directly link TIPE with melanoma progression in patients?
The relationship between TIPE levels and melanoma patient outcome is not presented in this article. One reason is that the tissue microarray lack of the survival data. Interestingly, the TCGA dataset showed that the higher TIPE expression has a favorable prognosis for melanoma. We are also very curious about this. Our following study indicated that TIPE might serve as a positive regulator for PD-L1. Therefore, the higher expression of TIPE presents more sensitive tendency to immunotherapy, resulting in a favorable prognosis in melanoma. The detailed mechanisms will be discussed in our following article, and we hope that it might as a continuous research topic for TIPE in melanoma.
Furthermore, we have added the relationship between TIPE levels and progression (non-lymph node metastasis vs lymph node metastasis), and Ki67 in Figure 7.
- Figure 2 - The A2 domain protein represents a substantial reduction in the size of PKM2, which would likely have other structural effects that could affect interactions with TIPE. This should be discussed by the authors because, in this reviewer's opinion, the data presented do not shed light on the specific TIPE domain requirements for the interaction with PKM2.
Thanks for your suggestions. We have discussed this phenomenon in our manuscripts.
- Figure 4: The authors show that PKM2 recruitment to the promoters of GLUT1 and LDHA is induced by TIPE expression. Is HIF1a recruitment also induced by TIPE? This is a key gap in the detailed molecular analysis provided by the authors.
Thanks for your suggestions. This phenomenon you mentioned is very interesting, however, the expression of GLUT1 and LDHA was completely decreased when we overexpression of TIPE and PKM2 (S37A) compared to overexpression of TIPE and wild PKM2. Therefore, we believe that the higher expression of GLUT1 and LDHA was primarily promoted by TIPE-induced PKM2 recruitment.
- Figure 6: The authors present nice data for general pluripotency/stem cell markers however given melanocytes arise from the neural crest, and neural crest markers are expressed during melanoma initiation and response to therapies, analysis of neural crest stem cell markers would be appropriate to include in this analysis. For example, Sox10, Pax3, NGFR, and AQP2 have all been identified as neural crest stem cell markers expressed in both melanoma patients and experimental models.
Thanks for your advices. We have selected two neural crest stem cell markers including Nestin and Sox10 to test their expression after overexpression of TIPE in G361 cells or interference of TIPE in A375 cells.
Minor comments:
- All Figure and Supplementary Figure legends should indicate how many replicate experiments the data represents, and all error bars should be defined (StDev vs SEM).
We have added as you suggested.
- Supplementary Figure S1C - can the authors confirm the densitometry values on the western, as the band looks to be considerably larger than 1.6 fold higher compared to the control?
We redone the densitometry measurement by ImageJ. However, the result still the same.
- FACs panels in Supplementary Figure 2C-D are unreadable and should be enlarged.
- Supplementary Figure S2i - quantification of Ki67 images appears warranted.
- Supplementary Figure S2j - The text in the figure panel is too small and needs to be increased so the data can be interpreted accurately. Also, the authors should confirm the data is specifically from melanoma patients in the figure legend.
We have improved the quality of the figures and revised their descriptions for greater clarity and coherence, ensuring that they effectively highlight the key results of our study.
- Figure 1A - text on the heat map cannot be read. Gene-level information can be removed, and sample labels should be made larger. In panel D, no statistical analysis is shown for the metabolomics analysis. These should be added, or the authors should modify the text when referring to these data.
We have improved the quality of the figures and revised their descriptions for greater clarity and coherence, ensuring that they effectively highlight the key results of our study.
- Line 127: RNAseq data does not indicate a change in metabolites; text should be changed to say "TIPE dramatically promoted expression of genes...".
We have corrected as you suggested.
- Supplementary Figure S3c - Labels and correlation values are not readable.
- Figure 2A - The text and details in the figure are difficult to read.
- Figure S4 D-H - text in figure panels too small to read.
Thank you for above three questions, we have carefully reviewed the entire document to ensure all figures are clear and correctly cited, preventing any confusion and maintaining the integrity of our research findings.
- Figure 3 - the legend restates the major observations and interpretations of the figure, however does not contain enough information about what the data represents or how it was generated. The interpretation of the data should be made in the main text. For example, in panel 3. F-G the number of individual cells quantified for the analysis should be stated. In addition, given the data are generated from two completely independent cell lines, it would be more appropriate to have separate graphs for the A375 cells and G361 cells. The signal levels in the respective controls at baseline are very different, and plotted together without clear labels, making the reader question the validity of the data when this just reflects different basal signals in different cell models.
We have separated the graphs for the A375 cells and G361 cells.
- Figure 4 B-C - IgG controls are missing in Co-IP experiments.
We have added the IgG controls as you suggested.
- Figure 5F - The unit of measure of time should be indicated on the axes; is this days?
We measured the tumor volumes for 7 times every 5 days. We have added the detailed description in the materials and methods section.
- Line 348: error in text, mammosphere which should presumably be tumorsphere if from melanoma cells.
Thanks for your suggestions, we have corrected this term to "tumorsphere" and conducted a thorough language and grammar review of the manuscript to ensure its professional presentation.
- Methods: more experimental details for the transcriptomic, mass spec, and metabolomics studies should be provided. There are insufficient details if readers wish to repeat these experiments.
Thanks for your suggestions, we have corrected as you advised.


