Peer review process
Not revised: This Reviewed Preprint includes the authors’ original preprint (without revision), an eLife assessment, public reviews, and a provisional response from the authors.
Read more about eLife’s peer review process.Editors
- Reviewing EditorJason LerchUniversity of Oxford, Oxford, United Kingdom
- Senior EditorPanayiota PoiraziFORTH Institute of Molecular Biology and Biotechnology, Heraklion, Greece
Reviewer #1 (Public Review):
Summary:
In this manuscript, the authors describe a new pipeline to measure changes in vasculature diameter upon opt-genetic stimulation of neurons.
The work is interesting and the topic is quite relevant to better understand the hemodynamic response on the graph/network level.
Strengths:
The manuscript provides a pipeline that allows for the detection of changes in the vessel diameter as well as simultaneously allowing for the location of the neurons driven by stimulation.
The resulting data could provide interesting insights into the graph-level mechanisms of regulating activity-dependent blood flow.
The interesting findings include that vessel radius changes depend on depth from the cortical surface and that dilations on average happen closer to the activated neurons.
Weaknesses:
The utility of a pipeline depends on the generalization properties.
While the proposed pipeline seems to work for the data the authors acquired, it is unclear if this pipeline will actually generalize to novel data sets possibly recorded by a different microscope (e.g. different brand), or different imagining conditions (e.g. illumination or different imagining artifacts) or even to different brain regions or animal species, etc.
The authors provide a 'black-box' approach that might work well for their particular data sets and image acquisition settings but it is left unclear how this pipeline is actually widely applicable to other conditions as such data is not provided.
In my experience, without well-defined image pre-processing steps and without training on a wide range of image conditions pipelines typically require significant retraining, which in turn requires generating sufficient amounts of training data, partly defying the purpose of the pipeline.
It is unclear from the manuscript, how well this pipeline will perform on novel data possibly recorded by a different lab or with a different microscope.
Analysis
Some of the chosen analysis results seem to not fully match the shown data, or the visualization of the data is hard to interpret in the current form. Additionally, some measures seem not fully adapted to the current situation (e.g. the efficiency measure does not consider possible sources or sinks). Thus, some additional analysis work might be required to account for this.
Reviewer #2 (Public Review):
Summary:
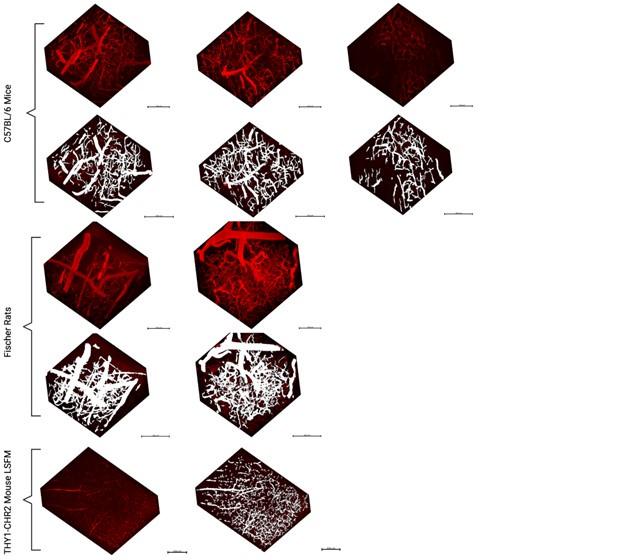
The authors develop a highly detailed pipeline to analyze hemodynamic signals from in vivo two-photon fluorescence microscopy. This includes motion correction, segmentation of the vascular network, diameter measurements across time, mapping neuronal position relative to the vascular network, and analyzing vascular network properties (interactions between different vascular segments). For the segmentation, the authors use a Convolution Neural Network to identify vessel (or neural) and background pixels and train it using ground truth images based on semi-automated mapping followed by human correction/annotation. Considerable processing was done on the segmented images to improve accuracy, extract vessel center lines, and compute frame-by-frame diameters. The model was tested with artificial diameter increases and Gaussian noise and proved robust to these manipulations.
Network-level properties include Assortativity - a measure of how similar a vessel's response is to nearby vessels - and Efficiency - the ease of flow through the network (essentially, the combined resistance of a path based on diameter and vessel length between two points).
Strengths:
This is a very powerful tool for cerebral vascular biologists as many of these tasks are labor intensive, prone to subjectivity, and often not performed due to the complexity of collecting and managing volumes of vascular signals. Modelling is not my specialty so I cannot speak too specifically, but the model appears to be well-designed and robust to perturbations. It has many clever features for processing the data.
The authors rightly point out that there is a real lack in the field of knowledge of vascular network activity at single-vessel resolution. Network anatomy has been studied, but hemodynamics are typically studied either with coarse resolution or in only one or a few vessels at a time. This pipeline has the potential to change that.
Weaknesses:
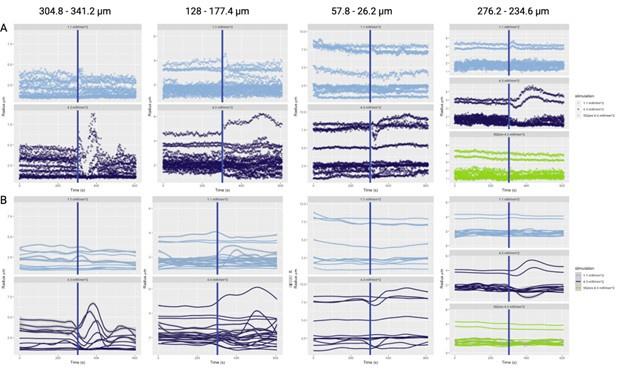
The authors apply their method to in vivo data. However, there are some weaknesses in the design that make it hard to accept many of the conclusions and even to see that the method could yield much useful data with this type of application. Primarily, the acquisition of a large volume of tissue is very slow. In order to obtain a network of vascular activity, large volumes are imaged with high resolution. However, the volumes are scanned once every 42 seconds following stimulation. Most vascular responses to neuronal activation have come and gone in 42 seconds so each vessel segment is only being sampled at a single time point in the vascular response. So all of the data on diameter changes are impossible to compare since some vessels are sampled during the initial phase of the vascular response, some during the decay, and many probably after it has already returned to baseline. The authors attempt to overcome this by alternating the direction of the scan (from surface to deep and vice versa). But this only provides two sample points along the vascular response curve and so the problem still remains.
A second problem is the use of optogenetic stimulation to activate the tissue. First, it has been shown that blue light itself can increase blood flow (Rungta et al 2017). The authors note the concern about temperature increases but that is not the same issue. The discussion mentions that non-transgenic mice were used to control for this with "data not shown". This is very important data given these earlier reports that have found such effects and so should be included. Secondly, there doesn't seem to be any monitoring of neural activity following the photo-stimulation. The authors repeatedly mention "activated" neurons and claim that vessel properties change based on distance from "activated" neurons. But I can't find anything to suggest that they know which neurons were active versus just labeled. Third, the stimulation laser is focused at a single depth plane. Since it is single-photon excitation, there is likely a large volume of activated neurons. But there is no way of knowing the spatial arrangement of neural activity and so again, including this as a factor in the analysis of vascular responses seems unjustified.
The study could also benefit from more clear illustration of the quality of the model's output. It is hard to tell from static images of 3-D volumes how accurate the vessel segmentation is. Perhaps some videos going through the volume with the masks overlaid would provide some clarity. Also, a comparison to commercial vessel segmentation programs would be useful in addition to benchmarking to the ground truth manual data.
Another useful metric for the model's success would be the reproducibility of the vessel responses. Seeing such a large number of vessels showing constrictions raises some flags and so showing that the model pulled out the same response from the same vessels across multiple repetitions would make such data easier to accept.
A number of findings are questionable, at least in part due to these design properties.
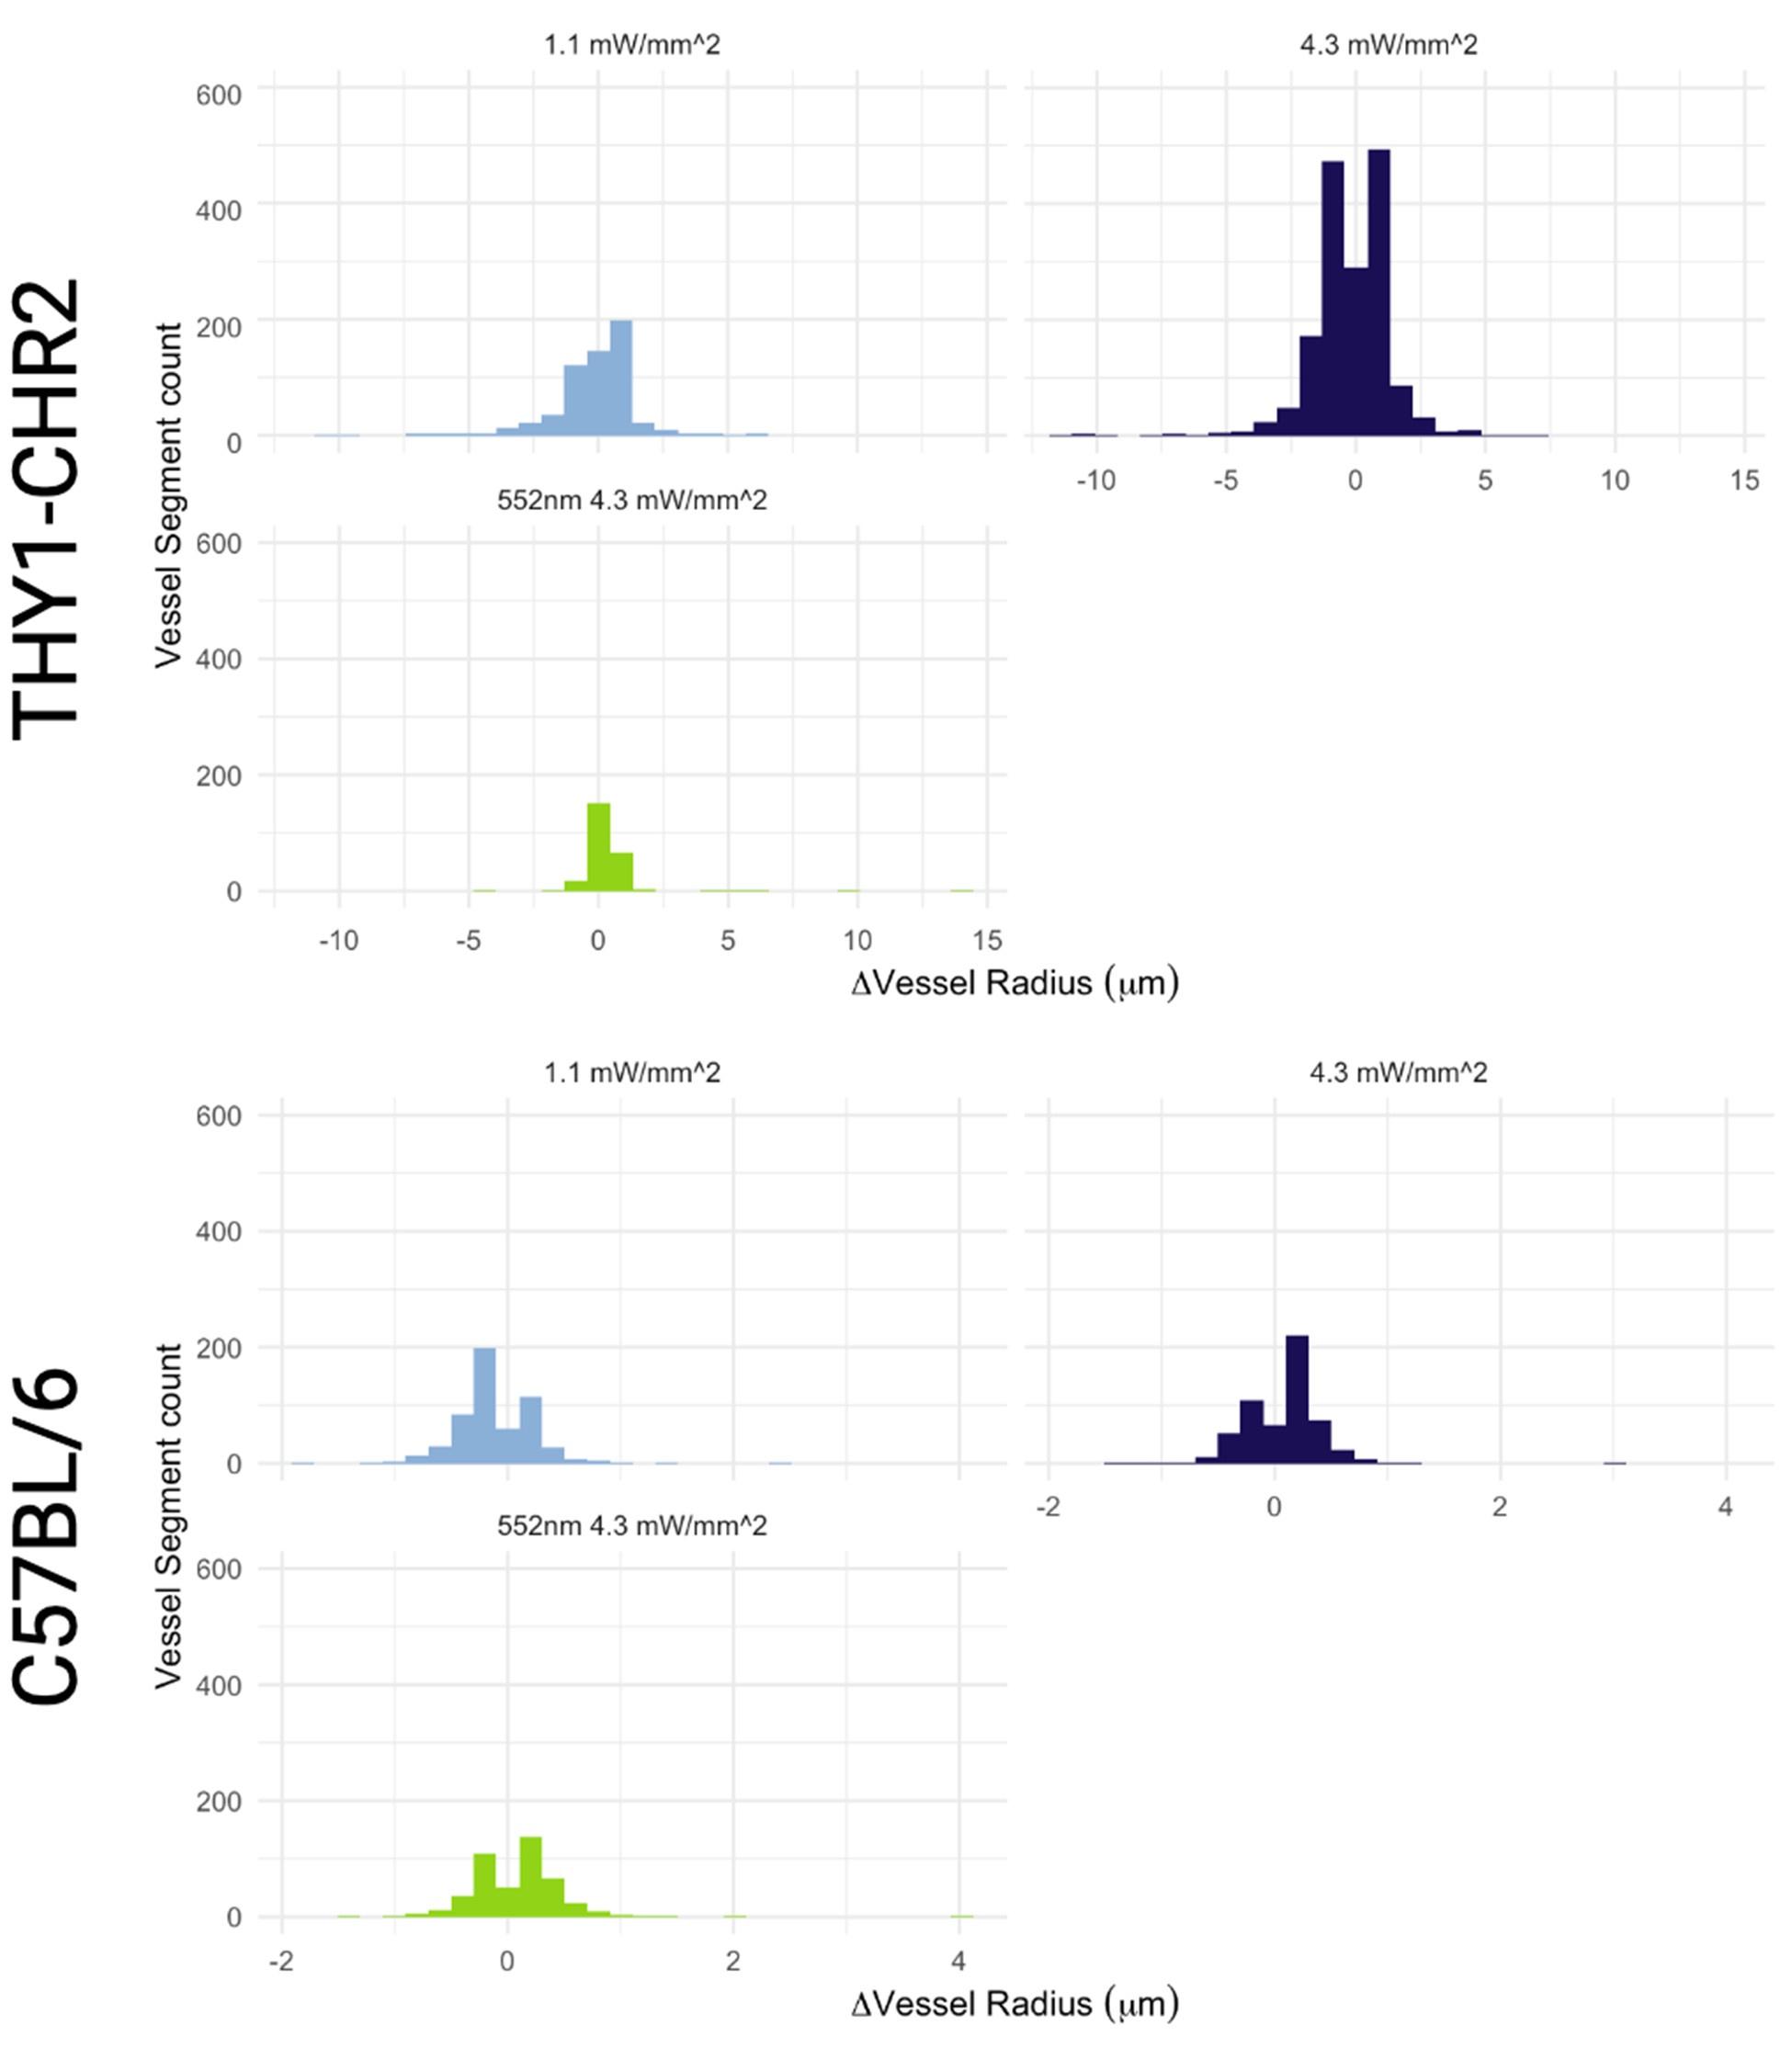
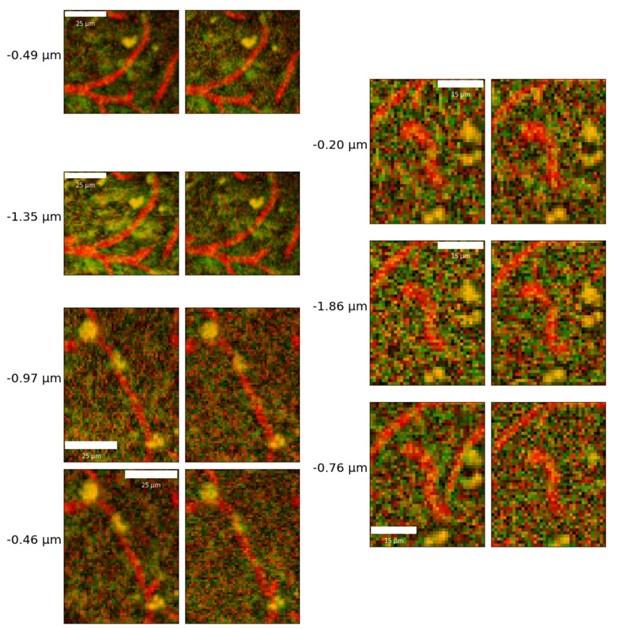
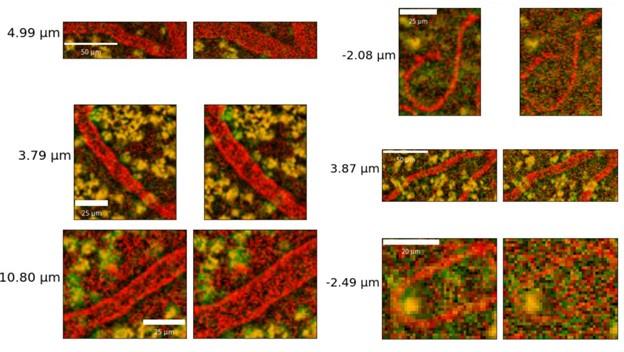
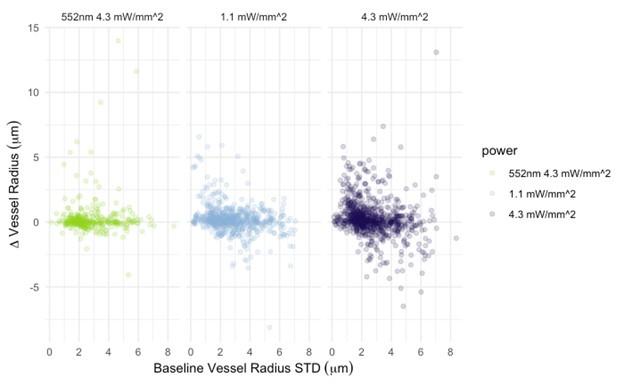
There are unrealistically large dilations and constrictions indicated. These are likely due to artifacts of the automated platform. Inspection of these results by eye would help understand what is going on.
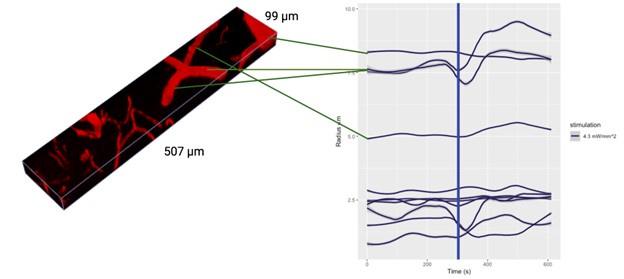
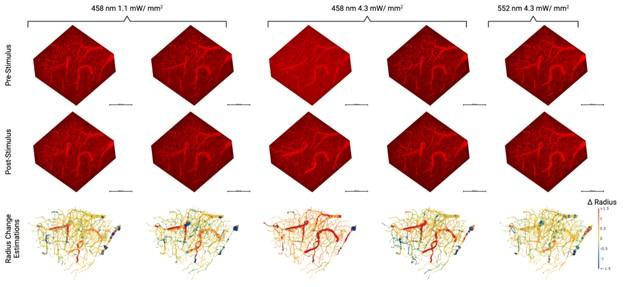
In Figure 6, there doesn't seem to be much correlation between vessels with large baseline level changes and vessels with large stimulus-evoked changes. It would be expected that large arteries would have a lot of variability in both conditions and veins much less. There is also not much within-vessel consistency. For instance, the third row shows what looks like a surface vessel constricting to stimulation but a branch coming off of it dilating - this seems biologically unrealistic.
As mentioned, the large proportion of constricting capillaries is not something found in the literature. Do these happen at a certain time point following the stimulation? Did the same vessel segments show dilation at times and constriction at other times? In fact, the overall proportion of dilators and constrictors is not given. Are they spatially clustered? The assortativity result implies that there is some clustering, and the theory of blood stealing by active tissue from inactive tissue is cited. However, this theory would imply a region where virtually all vessels are dilating and another region away from the active tissue with constrictions. Was anything that dramatic seen?
As mentioned, the claims about distance to active neurons are not meaningful if there is no measure of which neurons were active and which weren't. But even still, the claim is overly strong as the average distance to the nearest neuron for dilators was ~17 microns and for constrictors it was ~22 microns - about a half a neuronal soma difference.
The distance to the nearest neuron likely will depend on depth as well - neurons are quite sparse superficially and very dense in layer 4. The capillary network varies much less (see Blinder et al 2016 Nature Neuroscience). So the distance of a neuron to the nearest capillary may not vary much with depth, but the distance from the capillary to the nearest neuron might vary quite a lot.
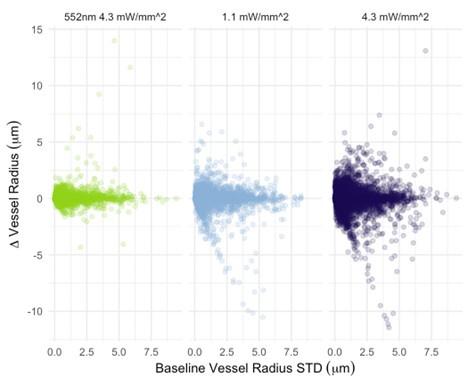
Why were nearly all vessels > 5um diameter not responding >2SD above baseline? Did they have highly variable baselines or small responses? Usually, bigger vessels respond strongly to local neural activity.
