Peer review process
Revised: This Reviewed Preprint has been revised by the authors in response to the previous round of peer review; the eLife assessment and the public reviews have been updated where necessary by the editors and peer reviewers.
Read more about eLife’s peer review process.Editors
- Reviewing EditorXiaorong LiuUniversity of Virginia, Charlottesville, United States of America
- Senior EditorLois SmithBoston Children's Hospital, Boston, United States of America
Reviewer #1 (Public Review):
Summary:
Wang, Y. et al. used a silicone wire embolus to definitively and acutely clot the pterygopalatine ophthalmic artery in addition to carotid artery ligation to completely block blood supply to the mouse inner retina, which mimic clinical acute retinal artery occlusion. A detailed characterization of this mouse model determined the time course of inner retina degeneration and associated functional deficits, which closely mimic human patients. Whole retina transcriptome profiling and comparison revealed distinct features associated with ischemia, reperfusion, and different model mechanisms. Interestingly and importantly, this team found a sequential event including reperfusion-induced leukocyte infiltration from blood vessels, residual microglial activation, and neuroinflammation that may lead to neuronal cell death.
Strengths:
Clear demonstration of the surgery procedure with informative illustrations, images, and superb surgical videos.
Two time points of ischemia and reperfusion were studied with convincing histological and in vivo data to demonstrate the time course of various changes in retinal neuronal cell survivals, ERG functions, and inner/outer retina thickness.
The transcriptome comparison among different retinal artery occlusion models provides informative evidence to differentiate these models.
The potential applications of the in vivo retinal ischemia-reperfusion model and relevant readouts demonstrated by this study will certainly inspire further investigation of the dynamic morphological and functional changes of retinal neurons and glial cell responses during disease progression and before and after treatments.
Weaknesses:
It would be beneficial to the manuscript and the readers if the authors could improve the English of this manuscript by correcting obvious grammar errors, eliminating many of the acronyms that are not commonly used by the field, and providing a reason why this complicated but clever surgery procedure was designed and a summary table with time course of all the morphological, functional, cellular, and transcriptome changes associated with this model.
Reviewer #2 (Public Review):
Summary:
The authors of this manuscript aim to develop a novel animal model to accurately simulate the retinal ischemic process in retinal artery occlusion (RAO). A unilateral pterygopalatine ophthalmic artery occlusion (UPOAO) mouse model was established using silicone wire embolization combined with carotid artery ligation. This manuscript provided data to show the changes of major classes of retinal neural cells and visual dysfunction following various durations of ischemia (30 minutes and 60 minutes) and reperfusion (3 days and 7 days) after UPOAO. Additionally, transcriptomics was utilized to investigate the transcriptional changes and elucidate changes in the pathophysiological process in the UPOAO model post-ischemia and reperfusion. Furthermore, the authors compared transcriptomic differences between the UPOAO model and other retinal ischemic-reperfusion models, including HIOP and UCCAO, and revealed unique pathological processes.
Strengths:
The UPOAO model represents a novel approach for studying retinal artery occlusion. The study is very comprehensive.
Weaknesses:
Originally, some statements were incorrect and confusing. However, the authors have made clarifications in the revised manuscript to avoid confusion.
Author response:
The following is the authors’ response to the original reviews.
eLife assessment:
The manuscript establishes a sophisticated mouse model for acute retinal artery occlusion (RAO) by combining unilateral pterygopalatine ophthalmic artery occlusion (UPOAO) with a silicone wire embolus and carotid artery ligation, generating ischemia-reperfusion injury upon removal of the embolus. This clinically relevant model is useful for studying the cellular and molecular mechanisms of RAO. The data overall are solid, presenting a novel tool for screening pathogenic genes and promoting further therapeutic research in RAO.
Thank you for recognizing the sophistication and clinical relevance of our mouse model for acute retinal artery occlusion. We are grateful for your supportive feedback.
Public reviews:
(1) Response to Reviewer #1:
Summary:
Wang, Y. et al. used a silicone wire embolus to definitively and acutely clot the pterygopalatine ophthalmic artery in addition to carotid artery ligation to completely block the blood supply to the mouse inner retina, which mimics clinical acute retinal artery occlusion. A detailed characterization of this mouse model determined the time course of inner retina degeneration and associated functional deficits, which closely mimic human patients. Whole retina transcriptome profiling and comparison revealed distinct features associated with ischemia, reperfusion, and different model mechanisms. Interestingly and importantly, this team found a sequential event including reperfusion-induced leukocyte infiltration from blood vessels, residual microglial activation, and neuroinflammation that may lead to neuronal cell death.
Strengths:
Clear demonstration of the surgery procedure with informative illustrations, images, and superb surgical videos.
Two-time points of ischemia and reperfusion were studied with convincing histological and in vivo data to demonstrate the time course of various changes in retinal neuronal cell survivals, ERG functions, and inner/outer retina thickness.
The transcriptome comparison among different retinal artery occlusion models provides informative evidence to differentiate these models.
The potential applications of the in vivo retinal ischemia-reperfusion model and relevant readouts demonstrated by this study will certainly inspire further investigation of the dynamic morphological and functional changes of retinal neurons and glial cell responses during disease progression and before and after treatments.
We sincerely appreciate your detailed and positive feedback. These evaluations are invaluable in highlighting the significance and impact of our work. Thank you for your thoughtful and supportive review.
Weaknesses:
It would be beneficial to the manuscript and the readers if the authors could improve the English of this manuscript by correcting obvious grammar errors, eliminating many of the acronyms that are not commonly used by the field, and providing a reason why this complicated but clever surgery procedure was designed and a summary table with the time course of all the morphological, functional, cellular, and transcriptome changes associated with this model.
Thank you for your thorough review of the manuscript. We sincerely apologize for any grammatical errors resulting from our English language proficiency and have taken the necessary steps to polish the article. Additionally, we have heeded your advice and reduced the use of field-specific acronyms to enhance readability for both the manuscript and its readers.
Regarding the rationale behind the design of the UPOAO model, we have provided a description in Introduction section. Our group focuses on the research of pathogenesis and clinical treatment for RAO. The absence of an accurate mouse model simulating the retinal ischemic process has hampered progress in developing neuroprotective agents for RAO. To better simulate the retinal ischemic process and possible ischemia-reperfusion injury following RAO, we developed a novel vascular-associated mouse model called the unilateral pterygopalatine ophthalmic artery occlusion (UPOAO) model. We drew inspiration from the widely employed middle cerebral artery occlusion (MCAO) model, commonly used in cerebral ischemic injury research, which guided the development of the UPOAO model.
We appreciate your valuable suggestion regarding the inclusion of a summary table outlining the time course of morphological, functional, cellular, and transcriptome changes associated with this model. To address this, we intend to include a supplementary table at the end of the article (Table. S2 Summary Table), which will offer a comprehensive overview of the experimental results, thereby aiding in clarity and interpretation.
Once again, we thank you for your insightful comments and suggestions, which have greatly contributed to the improvement of our manuscript.
(2) Response to Reviewer #2:
Summary:
The authors of this manuscript aim to develop a novel animal model to accurately simulate the retinal ischemic process in retinal artery occlusion (RAO). A unilateral pterygopalatine ophthalmic artery occlusion (UPOAO) mouse model was established using silicone wire embolization combined with carotid artery ligation. This manuscript provided data to show the changes in major classes of retinal neural cells and visual dysfunction following various durations of ischemia (30 minutes and 60 minutes) and reperfusion (3 days and 7 days) after UPOAO. Additionally, transcriptomics was utilized to investigate the transcriptional changes and elucidate changes in the pathophysiological process in the UPOAO model post-ischemia and reperfusion. Furthermore, the authors compared transcriptomic differences between the UPOAO model and other retinal ischemic-reperfusion models, including HIOP and UCCAO, and revealed unique pathological processes.
Strengths:
The UPOAO model represents a novel approach to studying retinal artery occlusion. The study is very comprehensive.
We greatly appreciate your positive assessment of our work and are encouraged by your recognition of its significance.
Weaknesses:
Some statements are incorrect and confusing. It would be helpful to review and clarify these to ensure accuracy and improve readability.
We sincerely appreciate your meticulous review of the manuscript. Taking into account your valuable feedback, we will thoroughly address the inaccuracies identified in the revised version. Additionally, we will commit to polishing the article to ensure improved readability. We apologize for any confusion caused by these inaccuracies and genuinely thank you for bringing them to our attention.
Recommendations For The Authors:
Reviewer #1:
(1) Response to comment:
The conclusions of this paper are mostly well supported by clear images and convincing data analysis, but some aspects of image presentation and additional data analysis may be needed to strengthen the manuscript.
We sincerely appreciate your positive assessment of our work and your recognition of the clear images and convincing data analysis supporting our conclusions. Your constructive feedback on enhancing the clarity of our manuscript's image presentation and additional data analysis is highly valued. In response to your suggestions, we have taken steps to improve readability by removing or correcting uncommon acronyms from certain images. We have also conducted further data analysis to provide more comprehensive insights. Thank you for your guidance in improving the quality of our manuscript.
(2) Response to recommendation (1):
In Results 3.1 or in Method 2.2: please explain why this combination of silicone wire embolization and carotid artery ligation was chosen to replace previous models such as UCCAO? What are the advantages? And why the silicone wire embolus was inserted through ECA instead of inserting into CCA directly? The cleverly designed surgical procedure is very impressive but the reasoning behind it is not obvious and needs more explanation.
Thank you for your valuable feedback.
In the introduction, we briefly describe the rationale for developing the UPOAO model to simulate acute ischemia-reperfusion of retinal artery occlusion (RAO). Previous common retinal ischemia model had certain shortcomings. For example, in the HIOP model, which is often used for simulating glaucoma, the ischemic factor of interrupted retinal blood flow may be amplified due to the dual effects of IOP-induced mechanical stress [1, 2] and vascular ischemia due to normal saline perfusion in the anterior chamber. In the UCCAO model, recanalization is performed after ligation of the carotid blood vessels, and the retina communicates with the blood vessels in the brain, resulting in retinal hypoperfusion. The retina ischemia in UCCAO is a chronical process, for example, the retina became thinner at week 10 and week 15 [3], while RAO is an acute total retinal ischemic disease. Therefore, it is critically important to develop a simple mouse model that can simulate acute retinal ischemia and reperfusion injury in RAO patients.
Various models have been developed for ischemic stroke research, with the endoluminal suture model being the most employed method for middle cerebral artery occlusion (MCAO). In this model, filaments are introduced through either the external or internal carotid artery and advanced into the middle cerebral artery, causing temporary blood flow blockage for a specific duration. This method has been extensively employed in studies involving transient occlusion [4]. Among the MCAO models, the Koizumi method (occlusion from the common carotid artery (CCA) to the middle cerebral artery (MCA)) and the Longa method (occlusion from the external carotid artery (ECA) to the MCA) are frequently used. Among these two methods, the Longa method is more widely utilized in research studies. The Longa method has a much lower mortality rate post-surgery (26%) than that of the Koizumi (44%) [5]. The MCAO model induces substantial infarct areas and significantly contributes to advancements in stroke research, including investigations into blood-brain barrier disruption and inflammatory responses to ischemia.
RAO is considered a form of ocular stroke. Inspired by the MCAO model, we have employed a silicone wire embolus to induce acute interruption of blood flow to the retina. This approach enables the investigation of pathophysiological processes associated with RAO, providing valuable insights into the understanding of this condition. We have clarified these points in the revised manuscript (line 129).
The reasoning behind inserting the silicone wire embolus through the ECA instead of directly into the CCA is twofold:
(1) Convenience and avoidance of heavy bleeding and mortality. Inserting the silicone wire embolus requires creating an opening in the artery, which then needs to be ligated at both ends after the silicone wire embolus is removed to prevent excessive bleeding. The ECA's ability to form a straight line with the ICA after folding makes it more convenient for the entry and removal of the silicone wire embolus. This procedure is more convenient to perform on the ECA. The blood flow to the CCA can be restored after the plug is removed from ECA, ensuring that the blood supply to the brain through the CCA is not affected.
(2) Preservation of reperfusion process. If the silicone wire embolus were inserted directly into the CCA, the ends of the CCA opening would need to be ligated after the silicone wire embolus is removed. This would result in a lack of reperfusion process after retinal ischemia. To enable the reperfusion process, the decision was made to open the ECA instead.
We have clarified these points in the revised manuscript to better explain the rationale behind our methodology (line 139). Thank you for prompting this important clarification, which we believe will enhance the understanding of our readers.
(3) Response to recommendation (2):
Did the UPOPA actually block OA, including both the retinal (CRA) and choroidal (SPCA and LPCA) blood supply? If so, why does it seem only the inner retina was affected but not the outer retina?
Thank you for your question. We agree with you that the UPOAO model blocks OA, which includes retinal and choroidal vessels. Our experimental results primarily indicate damage to the inner retinal layer within 7 days of reperfusion. For example, OCT and HE staining showed significant thinning of the inner retina after 60 minutes of ischemia followed by 7 days of reperfusion (Figure 4). At the same time, the b-wave amplitudes were decreases, usually indicating damage to the inner layer of the retina. However, the outer retina was seemed not affected by 60 minutes of ischemia based on the results of OCT, HE and immunofluorescence.
Inner layer of the retina was known to show the highest sensitivity to hypoxic challenges [6], whereas the outer retinal layer was more resistant to hypoxic stress [7]. The possible reason for these results was that the outer layer like photoreceptors is more tolerant against ischemia than inner layer of the retina. Previous studies of retinal ischemia-reperfusion models supported this assumption. In the UCCAO model, the b-wave was more affected than the a-wave. Decreases in the amplitudes of OPs, scotopic b-wave, and photopic b-wave were consistently observed on week 4 after UCCAO, while the amplitude of scotopic a-wave did not dramatically change [8]. Prolonged ischemia, such as permanent ischemia, led to photoreceptor cell degradation, as seen in Stevens et al.'s report of photoreceptors loss 3 months after permanent ligation of both common carotid arteries in bilateral common carotid artery occlusion (BCCAO) [9]. In the HIOP model, the GCL and INL reacted sensitively to ischemic processes. A significant thinning of the GCL as early as 6 hours after 60 minutes of ischemia [10]. Horizontal cells and photoreceptors remained mostly unaffected, while most RGCs and several amacrine cell subtypes disappear [11, 12].
Our study revealed the changes that occurred within 60 minutes of ischemia and the first 7 days of reperfusion in the UPOAO model. One possibility was that the ischemia duration in our model was not long enough to affect the outer retinal cells. Furthermore, the observation time point for reperfusion was not long enough to see the structure damage and visual dysfunctions in the outer retinal layer. As we have explained in the manuscript, further exploration is needed to understand changes induced by longer ischemia duration and reperfusion periods. Revealing the damage to retinal structure and function during longer ischemia time will be an emphasis direction for our further research.
(4) Response to recommendation (3):
Better to only use well-accepted acronyms and remove those that are rarely seen in other publications, such as IMRL, MRL, HIOP, TRT, etc.
Thank you for your valuable feedback. In our manuscript, we utilized the Spectralis HRA+OCT device (Heidelberg) to capture the retinal images. However, the resulting image layering did not adequately distinguish each retinal layer clearly. To address this limitation, we referred to a clinical OCT stratification approach in RVO and divided the retina into the inner, middle, and outer layers [16]. We acknowledge that this hierarchical description is not commonly used and have therefore followed your recommendation to remove these rare acronyms and instead employ the layer structure abbreviation along with the plus sign. The methods and results have been revised accordingly (line 213, line 368, Figure 4 and Figure S2).
In addition, for the HIOP model, it is also known as the IR or RIRI model [17-19], and the pathophysiological process of retinal ischemia-reperfusion injury (IRI) is usually used to represent this type of anterior chamber perfusion model. To avoid confusion between the pathophysiological process of ischemia-reperfusion studied in this paper and the common model of high intraocular pressure, we have consistently referred to it as the HIOP model, an abbreviation that is cited in many references [20-22].
Thanks again for the suggestion. We apologize for any confusion caused by the use of abbreviations and have made the necessary corrections in the manuscript. We have also strengthened the details of OCT layering in the images to enhance readability for our audience.
(5) Response to recommendation (4):
Figure 3F, G: What do the OP changes mean? What retina cell dysfunction leads to OP changes? Is there RGC-relevant visual function readout to correlate with RGC death?
Oscillatory potentials (OPs) are important components of the electroretinogram (ERG). While the precise origin of OPs remains unclear, they are generally believed to be generated from the inner retinal layer, specifically involving bipolar cells, amacrine cells and ganglion cells [23]. OPs are sensitive indicators of retinal ischemic effects and can detect dysfunction before alterations in the b-waves occur [24-26] (We have added these statements at line 358). In this research, the reduction of OPs indicated dysfunction in the inner retinal layer and retinal ischemia.
The function of RGCs can be non-invasively assessed by using various ERG technique that emphasize the activity of inner retina neurons, including OPs of multifocal ERG (mfERG), photopic negative response (PhNR) in mfERG, pattern electroretinogram (PERG), negative Scotopic Threshold Response (nSTR) [27]. Among these indicators, the PERG appears to be more specifically related to the presence of functional RGCs. However, the complexity of electrophysiological sources and species-specific differences in RGCs characteristics should also be considered. In addition, visual evoked potentials (VEP) can assess the function of visual signaling in the whole visual pathway from RGC axons to the visual cortex of the brain [28, 29]. Unfortunately, due to the unavailability of specific equipment required for evaluating RGCs function, we encountered limitations in conducting a comprehensive assessment in this study. This limitation emphasizes the importance of future studies incorporating RGCs evaluation to provide a more comprehensive understanding of visual pathway functionality and its implications, considering indicators such as PERG and PhNR.
Thank you for your careful review and insightful questions.
(6) Response to recommendation (5):
Figure 4B: RNFL/GCL/IPL normally called GCC (ganglion cell complex).
We appreciate your helpful recommendation regarding the abbreviation GCC (ganglion cell complex) for the combination of RNFL, GCL, and IPL. We have updated this terminology in the revised manuscript (line 213 and Figure 4).
(7) Response to recommendation (6):
Figure 4 A-F: Normally a circular OCT image surrounding the optic nerve head is preferred to measure retina thickness. If in these figures, all the OCT images are from the same location, it may be acceptable, but need to provide imaging details on how these OCT planes are selected and what has been done to make sure the same locations were selected for comparison.
We agree with your comment on OCT imaging that the retina is usually captured OCT images surrounding the optic nerve head. In this study, our goal was to assess both the thickness of the peripheral retina and the retina near the optic nerve head. To achieve this, we considered the optic nerve head as the apex of the selected field of view (left upper region of panel A in Figure 4). For each mouse, we obtained OCT images of the superior nasal (SN), superior temporal (ST), inferior nasal (IN), and inferior temporal (IT) fields of the optic nerve. We then averaged the thicknesses from these four fields. In each field, we measured and statistically evaluated the retinal thickness at distances of 1.5, 3, and 4.5 papillae diameters (PD) from the optic nerve head.
This approach allowed us to ensure that the same locations were selected for comparison and provided a comprehensive assessment of retinal thickness across different regions. We have detailed this methodology in the revised manuscript to clarify the imaging process and the consistency of the selected locations.
Thank you for your insightful feedback.
Reviewer #2:
Addressing the following concerns is necessary to improve the manuscript.
(1) Response to recommendation (1):
The manuscript contains many grammatical errors and should be carefully reviewed for corrections. For example: In the title, "Silicone Wire Embolization-induced Acute Retinal Artery Ischemia and Reperfusion Model in Mouse: Gene Expression Provide Insight into Pathological Processes". It should be "Provides" instead of "Provide". In the Abstract, "The resident microglia within the retina and peripheral leukocytes which access to the retina were pronounced increased on reperfusion periods." It should be "pronouncedly" or "markedly" instead of " pronounced".
Thank you for your careful reading and pointing out the grammatical errors in the manuscript. We apologize for these mistakes and have since revised and polished the article with the assistance of native English speakers. Ensuring accurate and clear language usage in scientific writing is crucial, and we appreciate your help in improving the quality of our manuscript. Thank you for bringing these errors to our attention.
(2) Response to recommendation (2):
Video 2: the video content from "30s-47s" and "50s-67s" is repeatedly shown.
Thank you for your careful review of the video. In the process of preparing the external carotid artery for silicone wire embolus insertion, we first ligated the distal end with a square knot and then tied a loose knot at the proximal end. In the video content from "30s-47s" and "50s-67s", we are tying a square knot. We apologize for any confusion caused by these repeated video clips.
(3) Response to recommendation (3):
Figure 1: The ConA staining (H-I) and FFA (J-K) were performed before the removal of silicone wire embolus. It would be beneficial to clarify this in the figure legend too. Additionally, the label 'Post. Sup. Alveolar art.: Posterior superior alveolar artery' is not present in Figure 1L."
Thank you for your thorough review of the manuscript and the valuable suggestions regarding Figure 1. We have updated the figure legend of Figure 1 to clarify that ConA staining (H-I) and FFA (J-K) were performed before the removal of the silicone wire embolus (line 868 and line 873). Additionally, we have included the label 'Post. Sup. Alveolar art' in Figure 1L as you pointed out. We appreciate your careful attention to detail, and we have ensured that these omissions have been rectified in the revised version of the manuscript.
(4) Response to recommendation (4):
Figure 2: only representative images of RGCs at the peripheral retina were shown. It is not clear if only RGCs in the peripheral retina were quantified. Is there RGC loss in the central and middle retina in the UPOAO model as well? How many fields of RGCs were quantified for each retina?
Thank you for your meticulous review of the manuscript. The quantification method of RGCs is described in detail as follows:
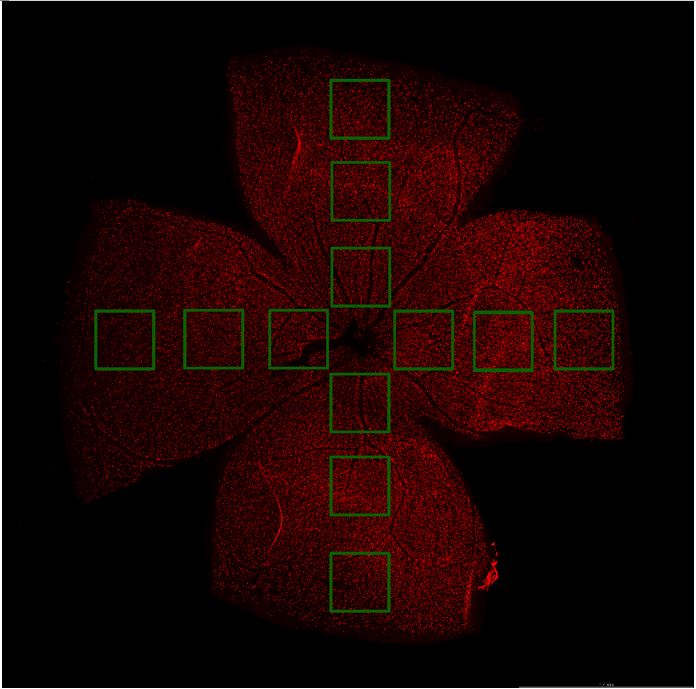
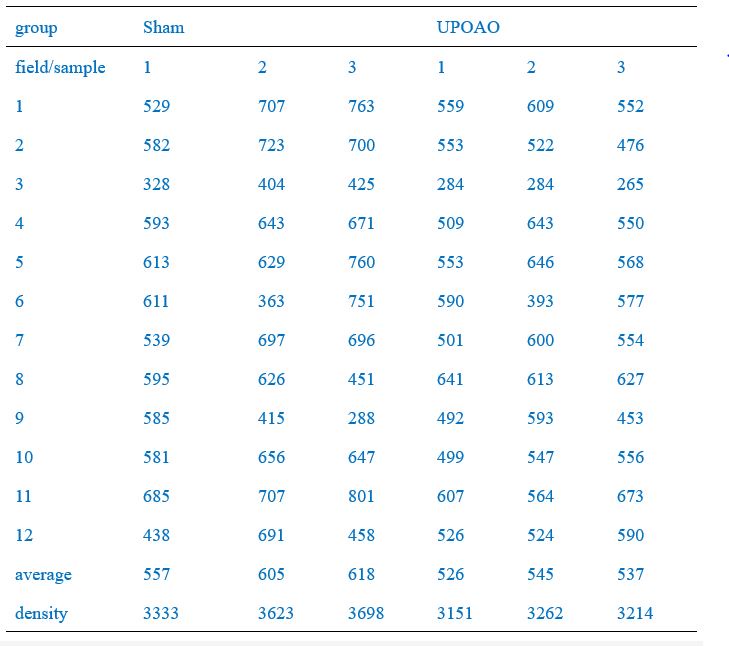
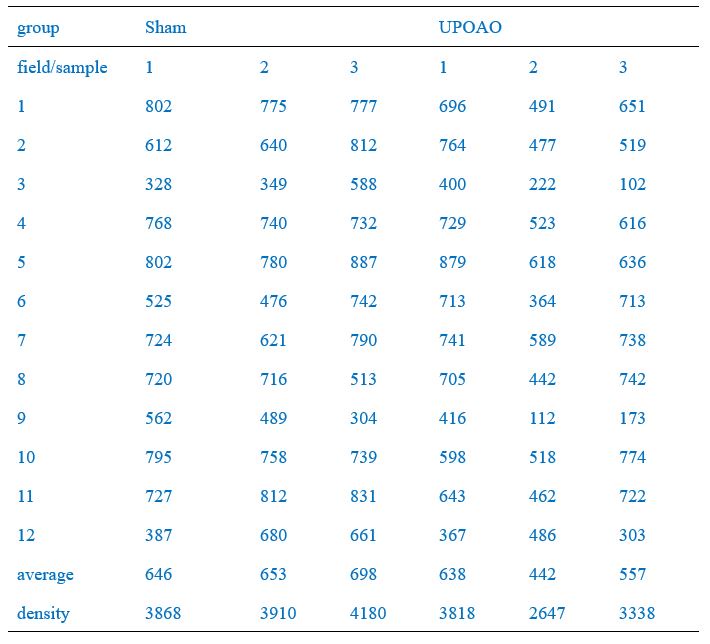
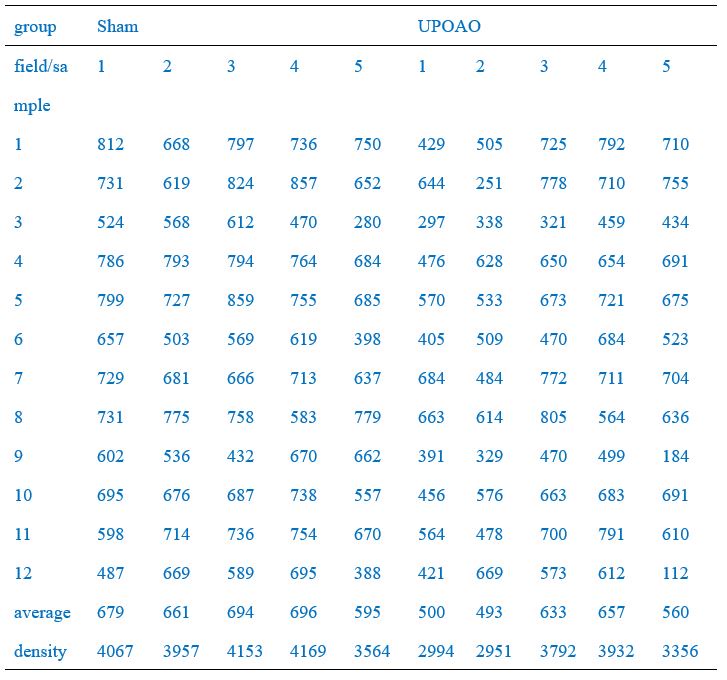
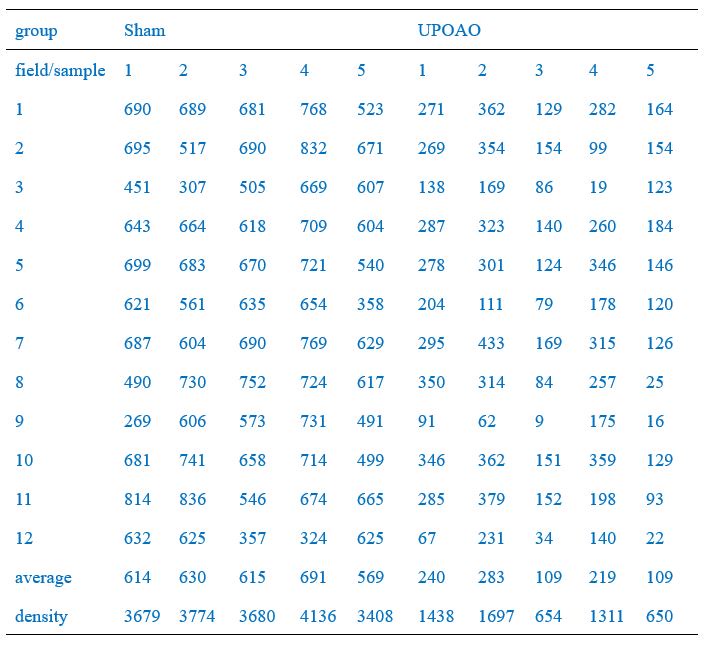
Four radial incisions were made in the retina and flattened on a glass slide to create a "four-leaf clover" shape. Retina was photographed using a fluorescence microscope (BX63, Olympus, Japan). We captured images from three different regions of each retinal quadrant: 0.1 mm-0.5 mm (central region, field numbers: 1, 4, 7, 10), 0.9 mm-1.3 mm (middle region, field numbers: 2, 5, 8, 11), and 1.7 mm-2.1 mm (peripheral region, field numbers: 3, 6, 9, 12) from the optic nerve head, respectively, as shown in Author response image 1.
Of these, the peripheral field changes were the most noticeable, so we used the Leica SP8 confocal microscope (20X) to capture peripheral field RGCs as a demonstration (Figure 2A, C, E, G). RGC counts of twelve fields of each retina were quantified and the average density of RGCs in twelve fields per retina was shown in Figure 2B, D, F, K. RGC counts in the central (field number: 1, 4, 7, 10), middle (field number: 2, 5, 8, 11), and peripheral (field number: 3, 6, 9, 12) visual fields were shown in Author response table 1-4.We have included this detailed methodology in the revised manuscript to clarify the quantification process and to address the presence of RGCs loss in both the central and middle retina in the UPOAO model. Thank you for pointing out the need for this clarification.
Author response image 1.
Schematic diagram of field selection. Scale bar=1.4 mm. Each retinal petal has three distinct visual fields (the area circled by the green line) that radiate from the optic nerve head to the periphery, in that order, the central, middle, and peripheral visual fields.
Author response table 1.
RGCs counts in each field of each retina (30-minute ischemia and 3-day reperfusion)
Author response table 2.
RGCs counts in each field of each retina (30-minute ischemia and 7-day reperfusion)
Author response table 3.
RGCs counts in each field of each retina (60-minute ischemia and 3-day reperfusion)
Author response table 4.
RGCs counts in each field of each retina (60-minute ischemia and 7-day reperfusion)
(5) Response to recommendation (5):
Figure 3: The representative wave lines in panels A (60min_3d, 60min_7d) and F do not reflect the statistical analysis presented in panels D, E, and G, especially for the amplitudes of b waves and OPs.
Thank you for your careful review of the manuscript. We've added labels for a-waves, b-waves, and improved the presentation of OPs to make the details of the amplitude more visible (Figure 3). In the previous version, due to incorrect settings, we did not adjust the ordinate spacing when fitting curves of representative wave lines in four groups, resulting in the curves being compressed vertically to the same height. We have now adjusted the curves to be fitted under the same scale bar (shown in the bottom right corner of Figure. 3A). What’s else, we removed the baseline wave of the OPs wave and adjusted the abscissa scale to highlight the N waves and P waves for easy reading (Figure 3F).
(6) Response to recommendation (6):
There are two different Supplementary Figure 1 and no Supplementary Figure 3, resulting in misaligned references to Supplementary Figures 1, 2, and 3 in the text.
Thank you for your careful review of the manuscript. We have reviewed the manuscript again and identified errors in uploading the supplementary figures, which resulted in duplicate Supplementary Figure 1 and the absence of Supplementary Figure 3. We have corrected these issues and realigned the references to Supplementary Figures 1, 2, and 3 in the text to ensure consistency. We appreciate your attention to detail and your reminder to address this issue.
(7) Response to recommendation (7):
There is confusion about the definition of ORL (outer retina layer). In Lines 208-209, ORL was defined as the combined thickness of the rest to the retinal pigment epithelium (RPE). It seems the ONL is included in ORL. But in lines 358-359, 907-908, "the ORL encompassed the region from the inner segment/outer segment (IS/OS) to the RPE". Please make the definition consistent. In addition, it is hard to distinguish the regions marked by the green lines in Fig. 4A (sham image) after Line 902.
Thank you for your careful review of the manuscript. We have addressed the confusion regarding the definition of the outer retinal layer (ORL). The Heidelberg OCT device does not distinguish the layers of the mouse retina well, so we divided it into three broader layers:
(1) Ganglion Cell Complex (GCC) layer, which encompasses RNFL+GCL+IPL.
(2) Middle Retinal Layer, which includes INL+OPL.
(3) Outer Retinal Layer (ORL), which includes ONL+IS/OS+RPE.
We apologize for the inconsistency and have revised the errors in the manuscript and figure legends accordingly. Additionally, we have removed rare domain-specific acronyms and replaced them with more commonly understood abbreviations, as suggested, to avoid confusion.
Furthermore, we have enlarged parts of the OCT images to better display the layers, hoping to meet the readers' requirements and improve clarity. Thank you for your valuable feedback.
(8) Response to recommendation (8):
Figure 4 (Panels H-J, L-M) incorporated with the text (Line 902) differs from the high-resolution version of Figure 4 included later in the manuscript. In Figure 4 (Panels H-J, L-M) merged with the text (Line 902), the quantification of the IPL and INL thickness is incorrect, and the scale bar is inaccurate. However in the high-resolution version of Figure 4 provided later, the thickness of the RNFL+GCL is incorrect.
Thank you for your careful review of the manuscript. The quantification of the IPL and INL thickness in Figure 4 (Panels H-J, L-M) incorporated with the text has been revised to ensure accurate measurements and scale bars (Figure 4 and line 924). The high-resolution version of Figure 4 provided later has been updated to correct the thickness measurements of the RNFL+GCL. We have ensured that the ordinate in the high-resolution version of Figure 4 now correctly represents length units, consistent with the equal proportional conversion used in the integrated text figures.
Thank you for your valuable feedback and for pointing out these errors. We have made the necessary corrections to align the figures accurately with the manuscript.
(9) Response to recommendation (9):
Line 384-386: the statement "Notably, a-waves in ERG and the thickness of the outer retinal layers in both OCT and HE remained unchanged." is not accurate, since a-waves in ERG is not changed in 3 days but changed in 7 days, and the thickness of the outer retinal layers in HE is either not measured or not shown in Figure 4.
Thank you for your careful review of the manuscript. We apologize for this error and have revised it.
We aimed to convey that the amplitude of the a-waves, which represent the function of the photoreceptors, does not show significant variation, which is consistent with the thickness of the outer retinal layer observed in OCT and HE images. Our results indicated that at 7 days post-injury, the amplitude of the a-waves in ERG was statistically different only at stimulus light intensity of 0.3, 3.0 and 10.0 cd.s/m2. In contrast, the b-wave amplitude was reduced by half compared to sham eyes at almost all stimulus light intensities. At the same time, the immunofluorescence staining results of photoreceptor cells showed no significant change at 7-days. Therefore, we consider the change in a-wave amplitudes were not significant compared to the significant decrease in b-wave amplitude. We have clarified this in the revised manuscript.
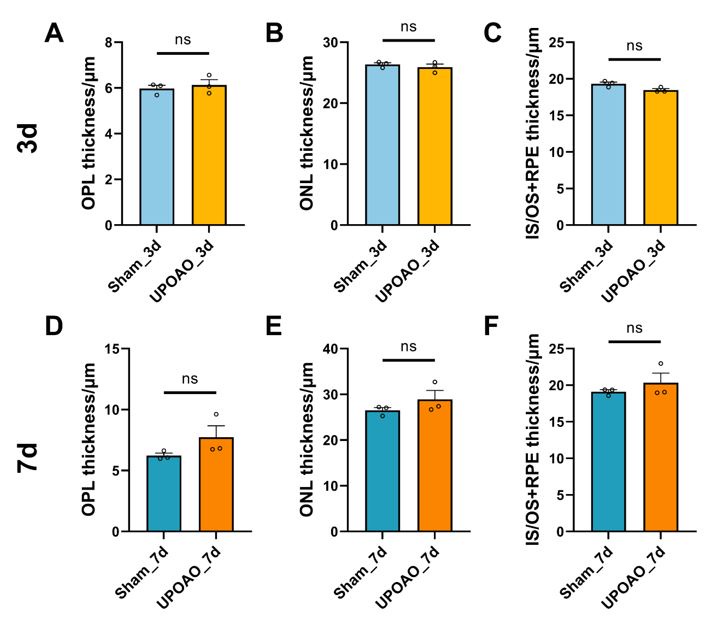
We also analyzed the thickness of the outer retinal layers in HE and found it to be consistent with OCT results, showing no significant changes (shown in below Author response image 2).
Thank you for your valuable feedback, which has helped improve the accuracy and clarity of our manuscript.
Author response image 2.
Thickness of OPL, ONL, IS/OS+RPE in HE staining. n=3; ns: no significance (p>0.05).
(10) Response to recommendation (10):
Figure 5 and Figure S3: Quantification data from different sections of the same retina should be averaged to represent one single sample (one data point) for statistical analysis. * in images of Fig. 5E, F, I, J is not defined in the figure legend. It would be easier for readers to follow if the GCL, IPL, INL, and OPL were labeled in retinal sections.
Thank you for your careful review of the manuscript and recommendation. We have reperformed the statistical analysis and updated the results in Figure 5 and Figure S3. In the UPOAO experimental eyes, no no significant change in the number of HCs (Calbindin) was observed during the 3-days reperfusion period, while a notable reduction was observed after 7 days (Figure 5). Additionally, we have added the definition of the asterisks (*) in the figure legend to clarify their significance. We have also labeled the retinal layers, including the GCL, IPL, INL, OPL, and ONL, in the images to make it easier for readers to follow and understand the data.
Thank you for helping us improve the clarity and accuracy of our manuscript.
(11) Response to recommendation (11):
Lines 407-409, the statement "which aligns with the a-waves observed in ERG (Figure 3D, E) and the changes seen in the outer retinal layers in OCT (Fig S2C, D)" is confusing. No changes were observed by OCT in Fig S2D.
Thank you for your review and we are sorry about the confusion. The overall trend of the amplitude of the a-wave in ERG at 7-days did not change significantly, which is consistent with the immunofluorescence staining results of the photoreceptor cells. Based on these observations, we consider that the change in the amplitude of the a-wave was not significant. As you pointed out in recommendation 9,since a-waves in ERG were changed in 7-days at the stimulus light intensity of 0.3, 3.0 and 10.0 cd.s/m2, our description on the a-waves in 7-days was not accurate. We have clarified this point in the revised manuscript to ensure it accurately reflects the data presented.
(12) Response to recommendation (12):
In Figure S4, panel C shows lymphocyte-mediated immunity, and panel D shows leukocyte-mediated immunity. Please adjust the figure legend accordingly to reflect the figures.
Thank you for your careful review of the manuscript. We have modified the figure legend of Figure S4.
(13) Response to recommendation (13):
Lines 440-442 state "These results suggested early ischemic processions such as cell migration and potential collateral vessel formation." It is not clear why and how "potential collateral vessel formation" is suggested by Figure 6 and Figure S4. Please clarify this in the text.
Thank you for your careful review of the manuscript and we have deleted this sentence due to insufficient evidence. We have corrected this sentence: "These results suggested that in the early stage of retinal ischemic injury, leukocytes from the microvasculature may infiltrate retinal tissue. More experimental validation will be performed to confirm this hypothesis."(line 448). We will be more cautious in drawing conclusions in the future. Thank you for your reminder.
(14) Response to recommendation (14):
For the figure legend of Figure 6 "In each heatmap, upper box showed the top 10 up-regulated genes, and the below one showed the top 10 down-regulated genes." Is this correct? It appears that the upper box shows the top 10 down-regulated genes, and the lower box shows the top 10 up-regulated genes.
Thank you for your careful review of the manuscript and we have modified the figure legend of Figure 6. In the heatmaps, the upper box showed the top 10 down-regulated genes, and the below one showed the top 10 up-regulated genes (line 977).
(15) Response to recommendation (15):
For the figure legend of Figure 7, the statement 'Data points are from retinal sections of four animals' is incorrect, as these data were obtained from whole retinas instead of retinal sections. Please revise the legend to reflect this accurately. The scale bar was absent in the images of Figure 7. Asterisk in Figure 7H and 7I was not defined.
Thank you for your careful review of the manuscript and we have revised the errors. We have added the scale bar (Figure 7D). The white asterisks in Figure 7H and 7I indicate the activated microglial cells and we have added this definition in the legend of Figure7 (line 981).
(16) Response to recommendation (16):
It would be better to switch the order of Figure S7 and Figure S8 to align with their descriptions in the text.
Thank you for your recommendation and we have switched the order of Figure S7 and Figure S8.
(17) Response to recommendation (17):
The gene names in Figure S8 should be written consistently with those listed in Table S1.
Thank you for your recommendation and we have corrected the gene names.
(18) Response to recommendation (18):
In Figure 9, it is not clear why amacrine cells were not included in the UPOAO model, as amacrine cells were also injured as shown in Figure 5I-L.
Thank you for your careful review of the manuscript and we have added amacrine cells in Figure 9.
References
(1) Yang, H., et al., The connective tissue phenotype of glaucomatous cupping in the monkey eye - Clinical and research implications. Prog Retin Eye Res, 2017. 59: p. 1-52.
(2) Pavlatos, E., et al., Regional Deformation of the Optic Nerve Head and Peripapillary Sclera During IOP Elevation. Invest Ophthalmol Vis Sci, 2018. 59(8): p. 3779-3788.
(3) Lee, D., et al., A mouse model of retinal hypoperfusion injury induced by unilateral common carotid artery occlusion. Experimental Eye Research, 2020. 201: p. 108275.
(4) Barthels, D. and H. Das, Current advances in ischemic stroke research and therapies. Biochim Biophys Acta Mol Basis Dis, 2020. 1866(4): p. 165260.
(5) Smith, H.K., et al., Critical differences between two classical surgical approaches for middle cerebral artery occlusion-induced stroke in mice. J Neurosci Methods, 2015. 249: p. 99-105.
(6) Janáky, M., et al., Hypobaric hypoxia reduces the amplitude of oscillatory potentials in the human ERG. Doc Ophthalmol, 2007. 114(1): p. 45-51.
(7) Tinjust, D., H. Kergoat, and J.V. Lovasik, Neuroretinal function during mild systemic hypoxia. Aviat Space Environ Med, 2002. 73(12): p. 1189-94.
(8) Lee, D., et al., Retinal Degeneration in a Murine Model of Retinal Ischemia by Unilateral Common Carotid Artery Occlusion. Biomed Res Int, 2021. 2021: p. 7727648.
(9) Yamamoto, H., et al., Complex neurodegeneration in retina following moderate ischemia induced by bilateral common carotid artery occlusion in Wistar rats. Exp Eye Res, 2006. 82(5): p. 767-79.
(10) Palmhof, M., et al., From Ganglion Cell to Photoreceptor Layer: Timeline of Deterioration in a Rat Ischemia/Reperfusion Model. Front Cell Neurosci, 2019. 13: p. 174.
(11) Adachi, M., et al., High intraocular pressure-induced ischemia and reperfusion injury in the optic nerve and retina in rats. Graefes Arch Clin Exp Ophthalmol, 1996. 234(7): p. 445-51.
(12) Jehle, T., et al., Quantification of ischemic damage in the rat retina: a comparative study using evoked potentials, electroretinography, and histology. Invest Ophthalmol Vis Sci, 2008. 49(3): p. 1056-64.
(13) Hayreh, S.S., H.E. Kolder, and T.A. Weingeist, Central retinal artery occlusion and retinal tolerance time. Ophthalmology, 1980. 87(1): p. 75-8.
(14) Luo, X., et al., Hypoglycemia induces general neuronal death, whereas hypoxia and glutamate transport blockade lead to selective retinal ganglion cell death in vitro. Invest Ophthalmol Vis Sci, 2001. 42(11): p. 2695-705.
(15) Schmid, H., et al., Loss of inner retinal neurons after retinal ischemia in rats. Invest Ophthalmol Vis Sci, 2014. 55(4): p. 2777-87.
(16) Furashova, O. and E. Matthè, Hyperreflectivity of Inner Retinal Layers as a Quantitative Parameter of Ischemic Damage in Acute Retinal Vein Occlusion (RVO): An Optical Coherence Tomography Study. Clin Ophthalmol, 2020. 14: p. 2453-2462.
(17) Pang, Y., et al., CD38 Deficiency Protects Mouse Retinal Ganglion Cells Through Activating the NAD+/Sirt1 Pathway in Ischemia-Reperfusion and Optic Nerve Crush Models. Invest Ophthalmol Vis Sci, 2024. 65(5): p. 36.
(18) Feng, Y., et al., GSK840 Alleviates Retinal Neuronal Injury by Inhibiting RIPK3/MLKL-Mediated RGC Necroptosis After Ischemia/Reperfusion. Invest Ophthalmol Vis Sci, 2023. 64(14): p. 42.
(19) Zeng, S., et al., CREG Protects Retinal Ganglion Cells loss and Retinal Function Impairment Against ischemia-reperfusion Injury in mice via Akt Signaling Pathway. Mol Neurobiol, 2023. 60(10): p. 6018-6028.
(20) Rosenbaum, D.M., et al., The role of the p53 protein in the selective vulnerability of the inner retina to transient ischemia. Invest Ophthalmol Vis Sci, 1998. 39(11): p. 2132-9.
(21) Zhang, Y., et al., Melatonin Alleviates Pyroptosis of Retinal Neurons Following Acute Intraocular Hypertension. CNS Neurol Disord Drug Targets, 2021. 20(3): p. 285-297.
(22) Zhu, J., et al., Protective effects of Erigeron breviscapus Hand.- Mazz. (EBHM) extract in retinal neurodegeneration models. Mol Vis, 2018. 24: p. 315-325.
(23) Wachtmeister, L., Oscillatory potentials in the retina: what do they reveal. Prog Retin Eye Res, 1998. 17(4): p. 485-521.
(24) Cao, W., et al., Dextromethorphan attenuates the effects of ischemia on rabbit electroretinographic oscillatory potentials. Documenta Ophthalmologica, 1993. 84(3): p. 247-256.
(25) Xu, J., et al., Pregabalin Mediates Retinal Ganglion Cell Survival From Retinal Ischemia/Reperfusion Injury Via the Akt/GSK3β/β-Catenin Signaling Pathway. Invest Ophthalmol Vis Sci, 2022. 63(12): p. 7.
(26)Takács, B., et al., Electroretinographical Analysis of the Effect of BGP-15 in Eyedrops for Compensating Global Ischemia-Reperfusion in the Eyes of Sprague Dawley Rats. Biomedicines, 2024. 12(3).
(27) Porciatti, V., Electrophysiological assessment of retinal ganglion cell function. Exp Eye Res, 2015. 141: p. 164-70.
(28) Ridder, W.H. and S. Nusinowitz, The visual evoked potential in the mouse—Origins and response characteristics. Vision Research, 2006. 46(6): p. 902-913.
(29) Liu, S., et al., An optimized procedure to record visual evoked potential in mice. Exp Eye Res, 2022. 218: p. 109011.


