Phosphorylation-mediated PTEN conformational closure and deactivation revealed with protein semisynthesis
- Johns Hopkins University School of Medicine, United States
- University of California, San Diego, United States
Figures
Figure 1 with 3 supplements
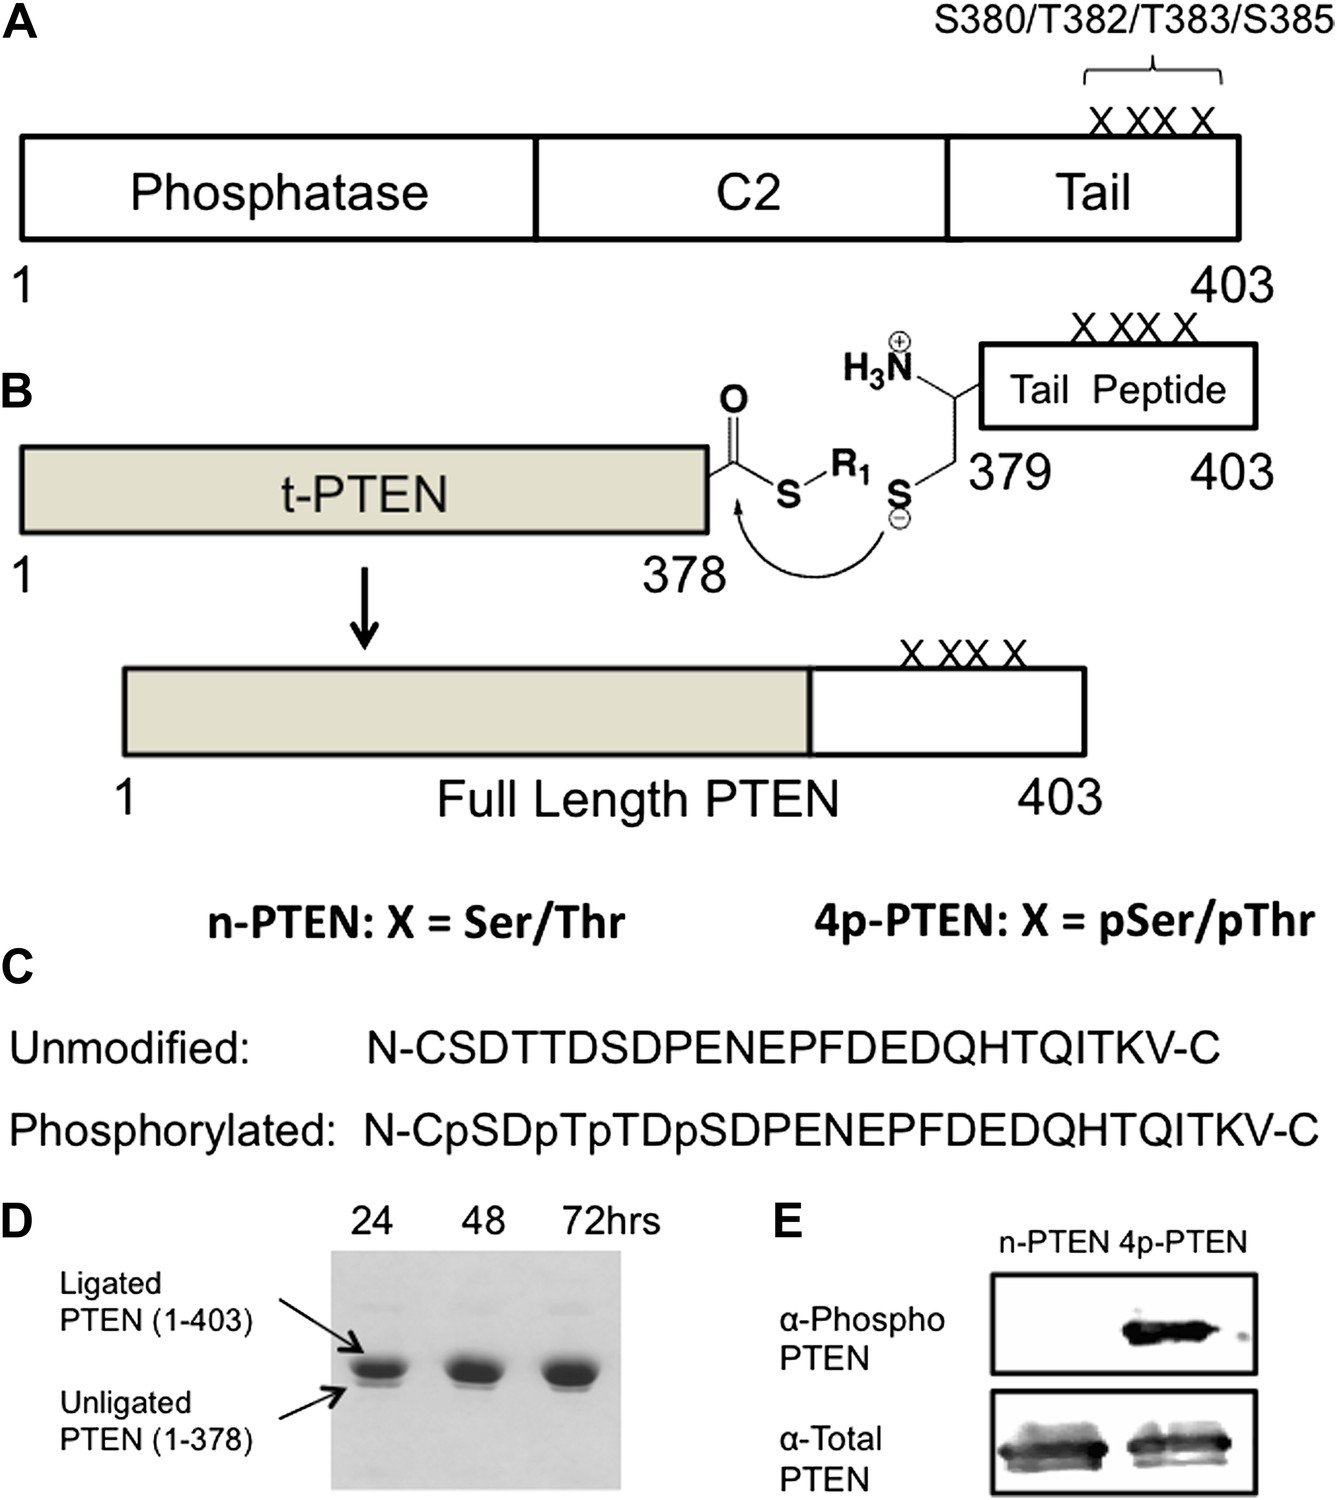
Generation of semisynthetic PTEN proteins.
(A) PTEN is composed of phosphatase domain, a C2 domain, and a C-terminal tail that is phosphorylated multiple times within a cluster of Ser and Thr residues (S380/T382/T383/S385). (B) C-terminally truncated PTEN containing an intein generated thioester at its C-terminus is ligated to a synthetic PTEN tail peptide with or without phosphorylation at the S380/T382/T383/S385 cluster. The final product is full length PTEN in the phosphorylated (4p-PTEN) or unphosphorylated (n-PTEN) form. (C) C-terminal tail peptides were synthesized in the unphosphorylated form or phosphorylated at S380/T382/T383/S385. Note that the N-Cys replaces a natural Tyr in PTEN. (D) The ligation reaction precedes smoothly over 72 hr. (E) Western blot with an anti-phospho PTEN antibody reveals 4p-PTEN but not n-PTEN is phosphorylated.
Figure 1—figure supplement 1

Schematic views of n-PTEN, 4p-PTEN and t-PTEN.
n-PTEN and 4p-PTEN are full length semisynthetic proteins and contain the Tyr 379 to Cys mutation to facilitate the native chemical ligation reaction. t-PTEN contains amino acids 1–378.
Figure 1—figure supplement 2
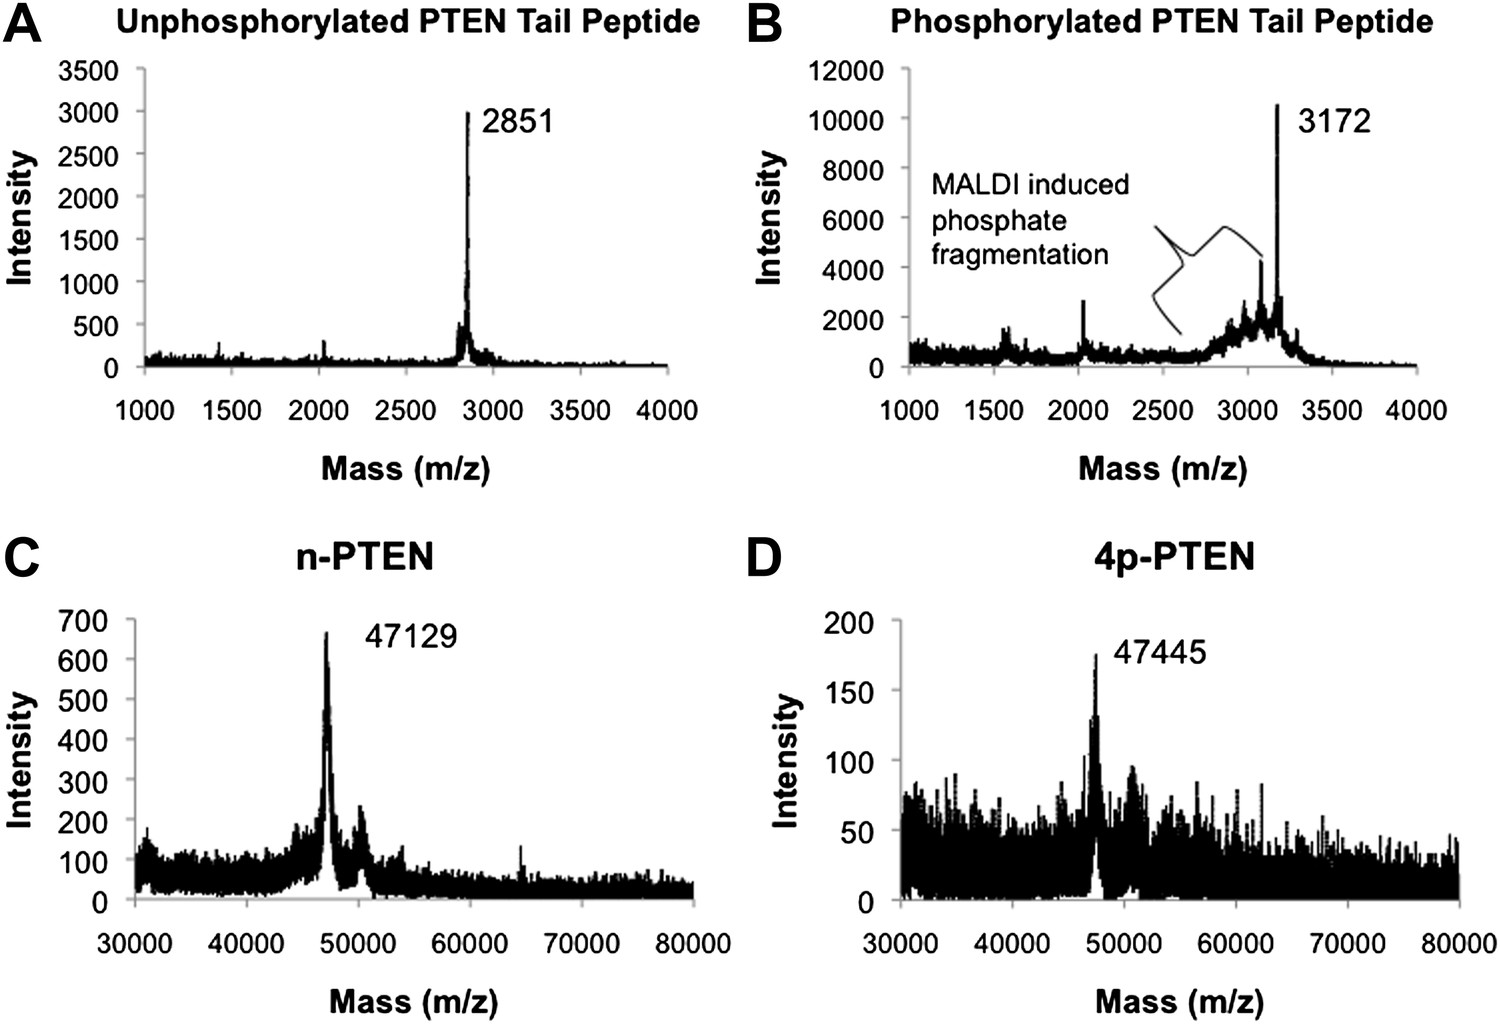
MALDI spectra for PTEN tail peptides and semisynthetic PTEN proteins.
(A) Unphosphorylated PTEN tail peptide (expected mass: m/z 2852). (B) Phosphorylated PTEN tail peptide (expected mass: m/z 3172). (C) Unphosphorylated semisynthetic PTEN (n-PTEN) (expected mass: m/z 47,106.2). (D) Phosphorylated semisynthetic PTEN (4p-PTEN) (expected mass: m/z 47,426.2). The spectra for C and D were normalized to the external reference bovine serum albumin. The approximate accuracy for the mass spectrometric measurements of these protein masses is ±50 Da.
Figure 1—figure supplement 3

Size exclusion chromatography, Y379C enzymatic characterization and autophosphatase activity of PTEN.
The chromatograms and elution volumes of (A) n-PTEN and (B) 4p-PTEN purified by FPLC on a size exclusion column. (C) The chromatogram of protein standards on a size exclusion column (Peak A: Thyroglobulin, MW = 670,000, elution volume = 8.7 ml; Peak B: gamma globulin, MW = 158,000, elution volume = 9.7 ml; Peak C: Ovalbumin, MW = 44,000, elution volume = 14.6 ml; Peak D: Myoglobin, MW = 17,000, elution volume = 16.3 ml; Peak E: Vitamin B12, MW = 1350, elution volume = 19.5 ml). (D) Phosphatase assays using diC6 PIP3 for WT GST-PTEN and Y379C GST-PTEN purified from E. coli. Data are reported as the mean ± the SEM of three experiments performed in duplicate. (E) Generation of 4p-PTEN by expressed protein ligation in the presence or absence of 25 μM VO-OHpic, a potent PTEN inhibitor monitored by western blot. (F) 50 ng of 4p-PTEN treated with 2 μM n-PTEN (left) or 1 μM CIP (right). Dephosphorylation of the phospho-tail is monitored by western blot.
Figure 2 with 3 supplements
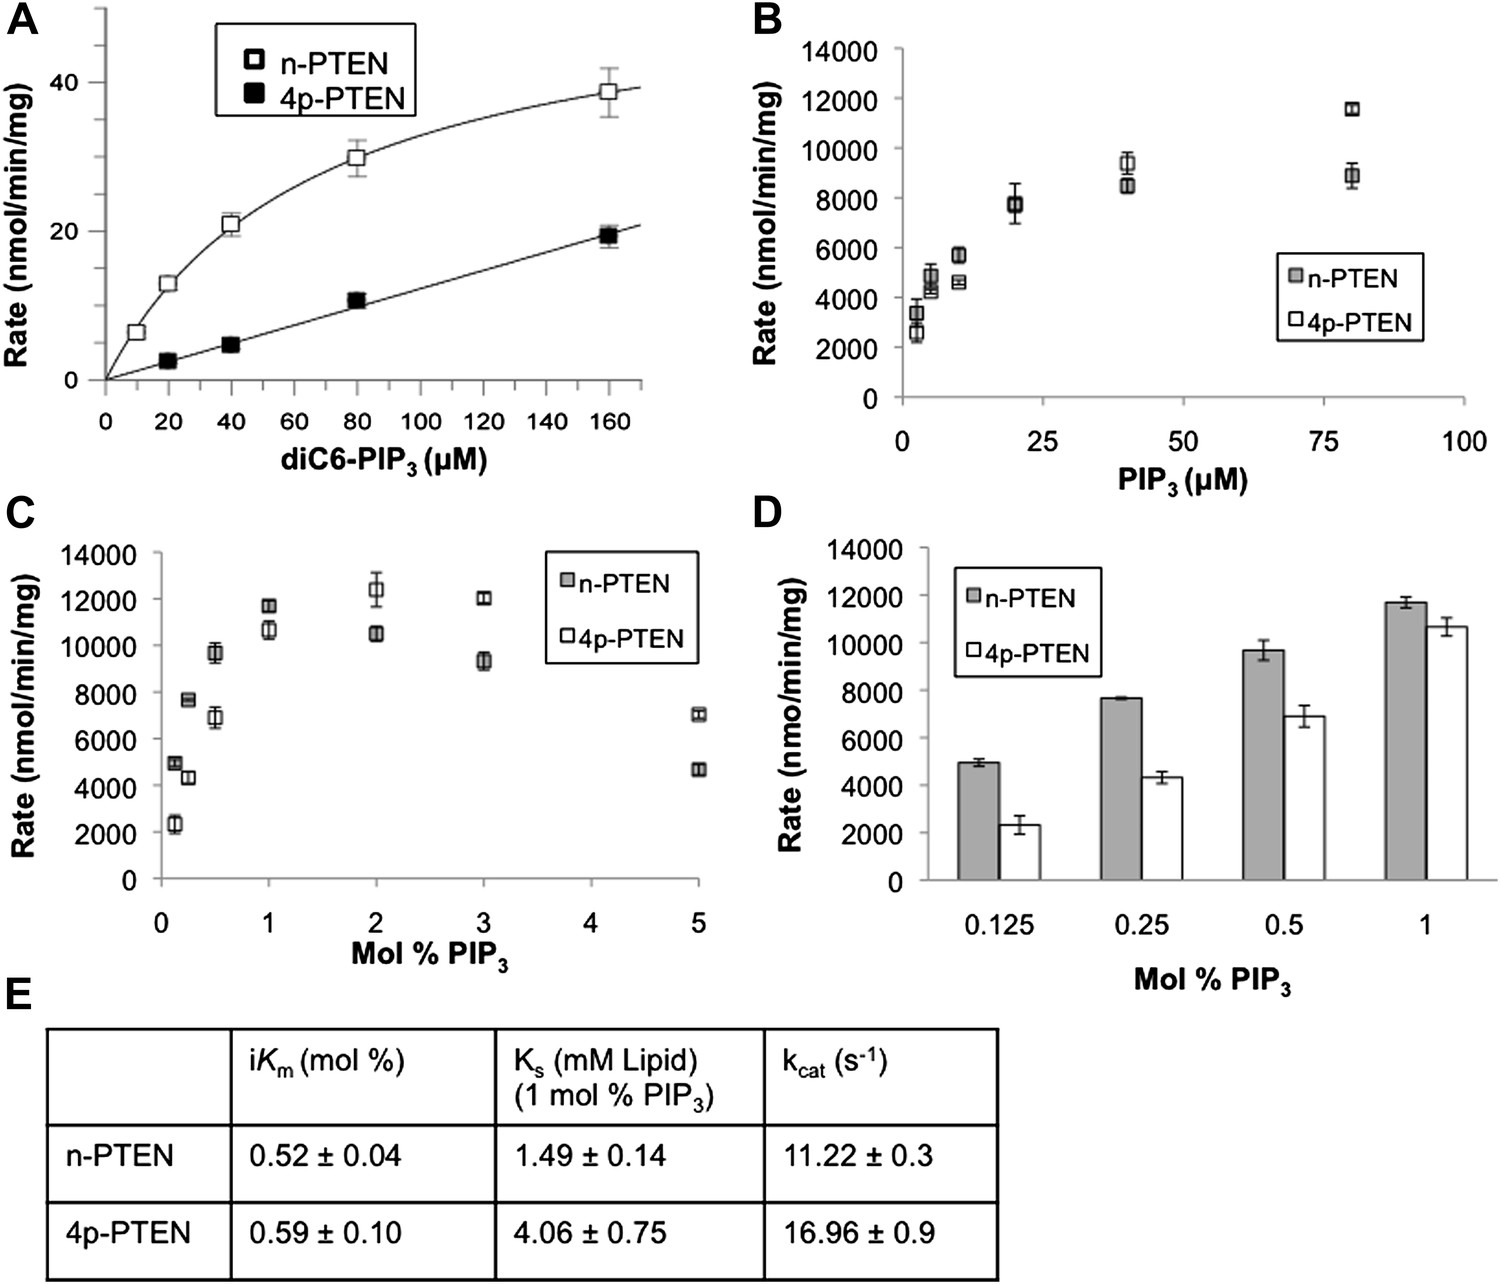
Soluble substrate activity and Interfacial kinetic analysis of semisynthetic PTEN.
(A) PTEN activity to a soluble substrate, diC6-PIP3. (n-PTEN: kcat = 2.6 ± 0.1 min−1, Km = 67 ± 4.2 μM, kcat/Km = 0.038 ± 0.001 min−1μM−1; 4p-PTEN: kcat/Km = 0.005 ± 0.0002 min−1μM−1) (B and C) PTEN activity to palmitoyl PIP3 incorporated into phosphatidylcholine vesicles. In the bulk dilution experiment (B) enzymatic activity for n-PTEN and 4p-PTEN was measured at a fixed surface concentration of 1% PIP3 while the bulk concentration was varied. In the surface dilution experiment (C) activity was measured at a fixed bulk concentration of 50 μM PIP3 while the surface concentration was varied. (D) 4p-PTEN has lower activity than n-PTEN only at low PIP3 concentrations. (E) Summary of the interfacial kinetic analysis of n-PTEN and 4p-PTEN. Data are reported as the mean ± the SEM from three experiments performed in duplicate. Apparent Vmax values were obtained from the best fit curves from the first four points of the surface dilution experiments.
Figure 2—figure supplement 1
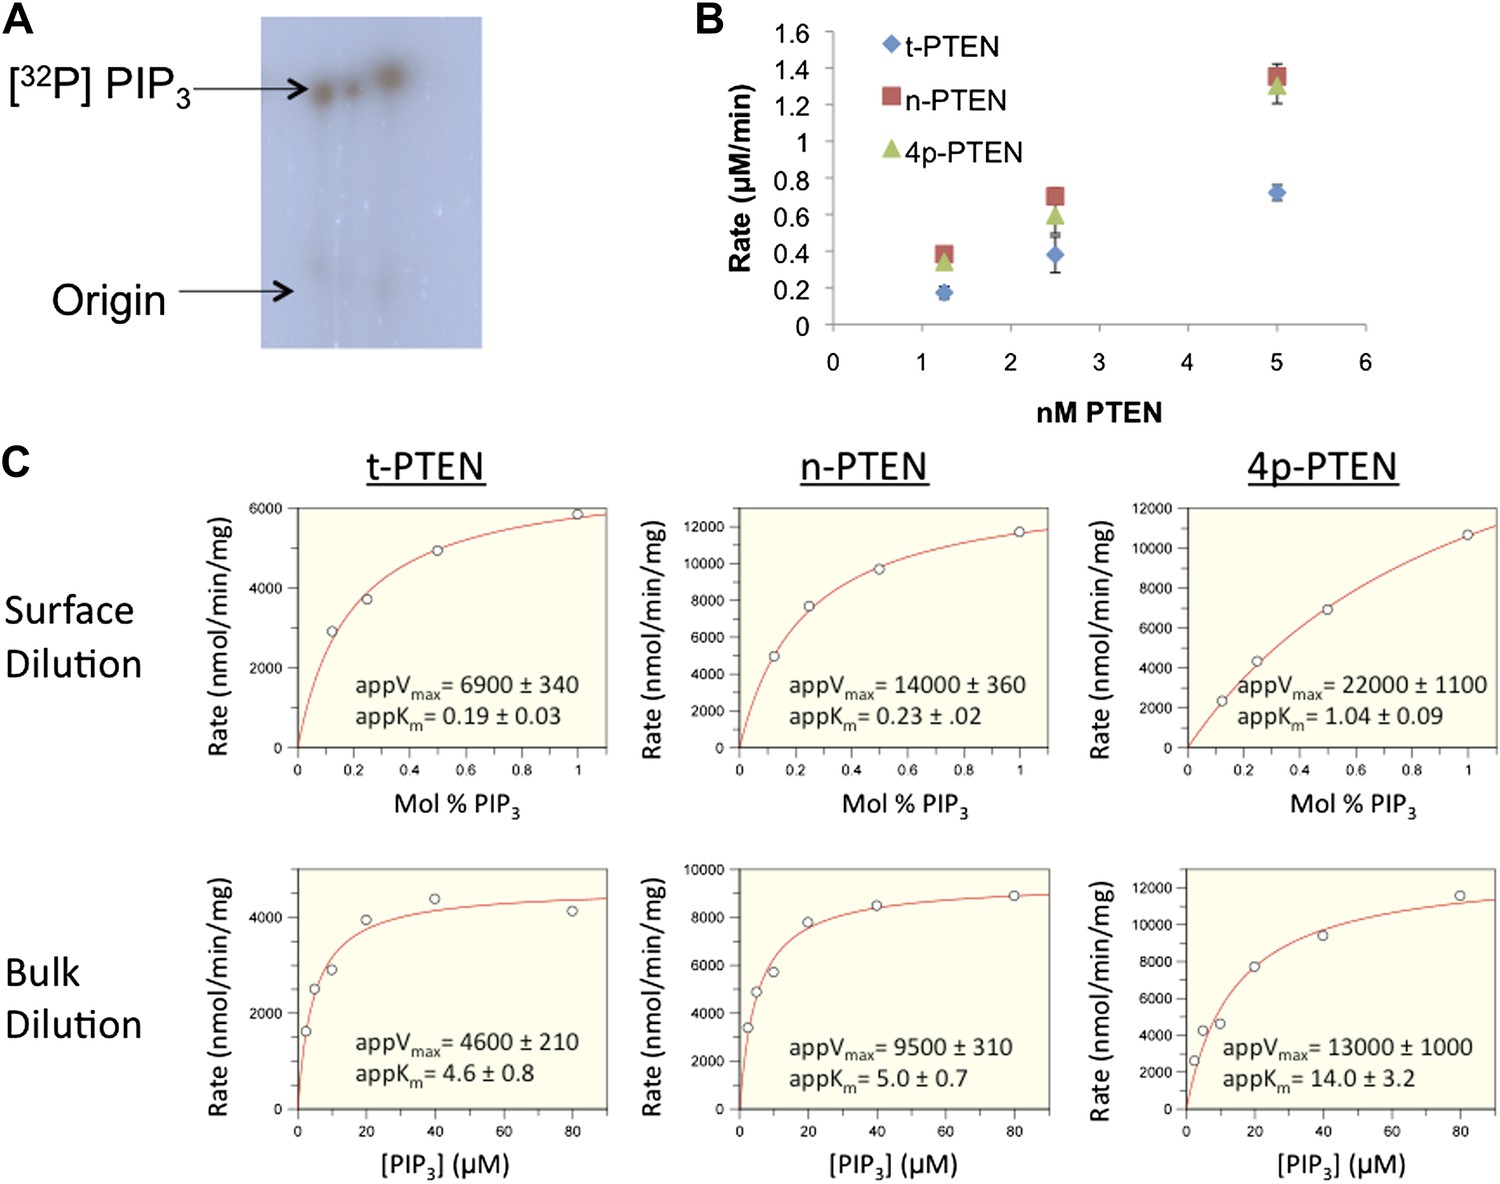
Interfacial kinetic analysis of semisynthetic PTENs.
(A) 32P labeled PIP3 was generated as outlined in the ‘Materials and methods’ section. (B) PTEN activity to radiolabled palmitoyl PIP3 incorporated into phosphatidylcholine vesicles is linear with respect to enzyme concentration. (C) Apparent kcat and apparent Km values were obtained by nonlinear regression analysis for each form of PTEN for surface dilution experiments (top row) and bulk dilution experiments (bottom row). Apparent kcat and apparent Km values were then fit to the equations in the ‘Materials and methods’ section to obtain the interfacial kinetic parameters in tabulated in Figure 2E and Figure 2—figure Supplement 2
Figure 2—figure supplement 2
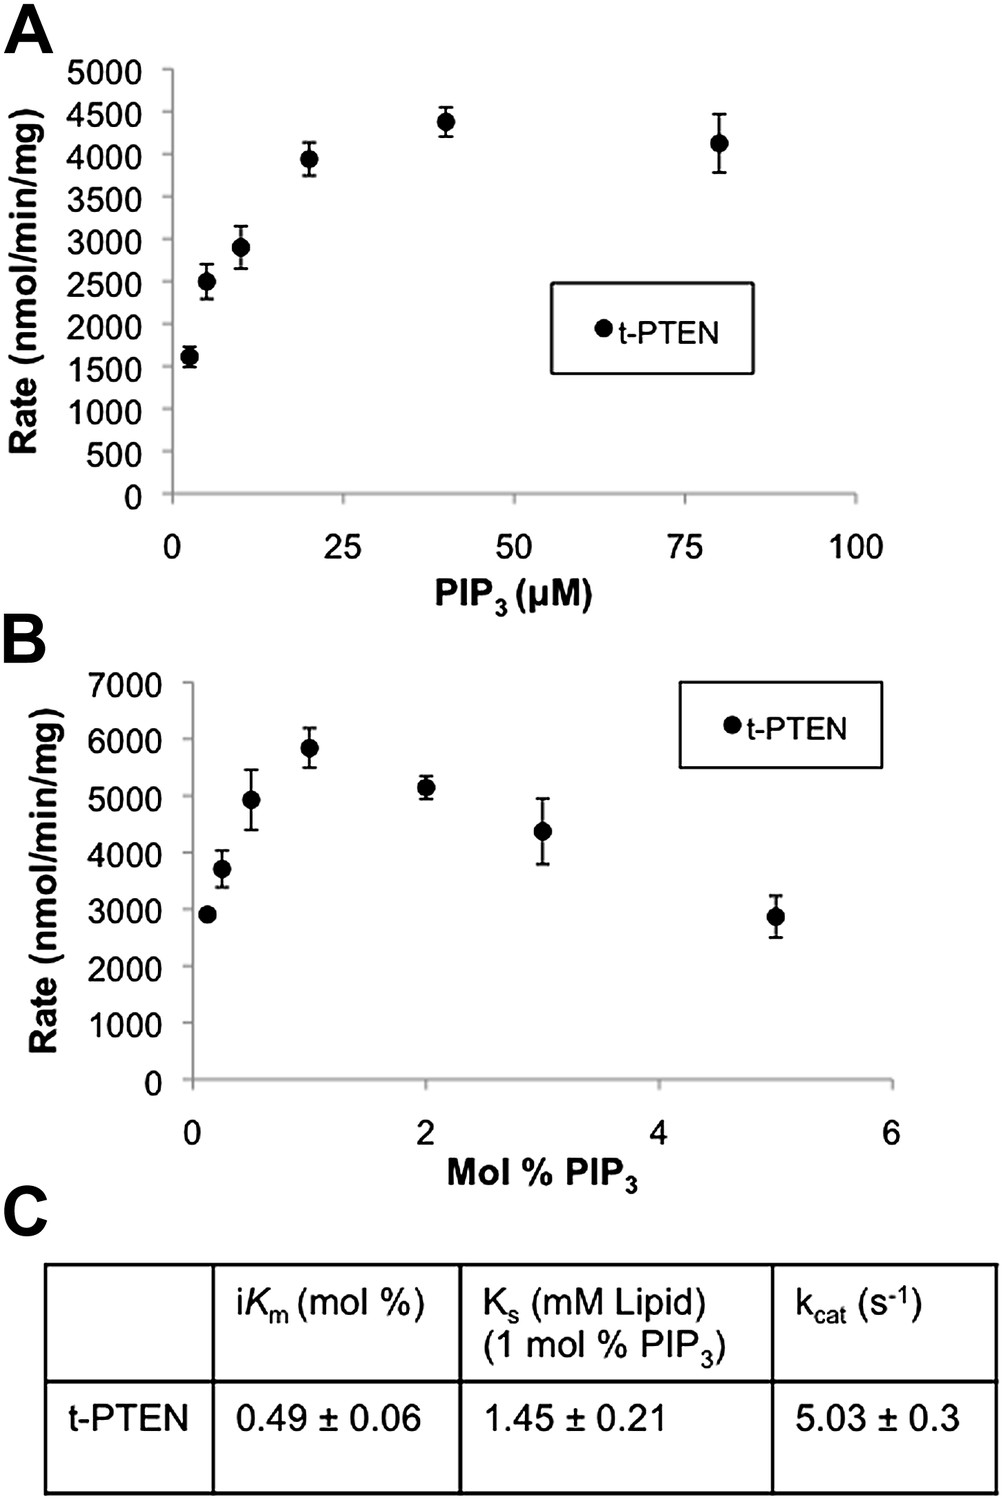
Bulk and surface dilution curves of t-PTEN.
(A) In the bulk dilution experiment enzymatic activity for t-PTEN was measured at a fixed surface concentration of 1% PIP3 while the bulk concentration was varied. (B) In the surface dilution experiment activity was measured at a fixed bulk concentration of 50 µM PIP3 while the surface concentration was varied. Data a represented as the mean ± the SEM of three experiments performed in duplicate. (C) Summary of the interfacial kinetic analysis of t-PTEN. Data are reported as the mean ± the SEM from three experiments performed in duplicate. Apparent Vmax values were obtained from the best fit curves from the first four points of the surface dilution experiments.
Figure 2—figure supplement 3
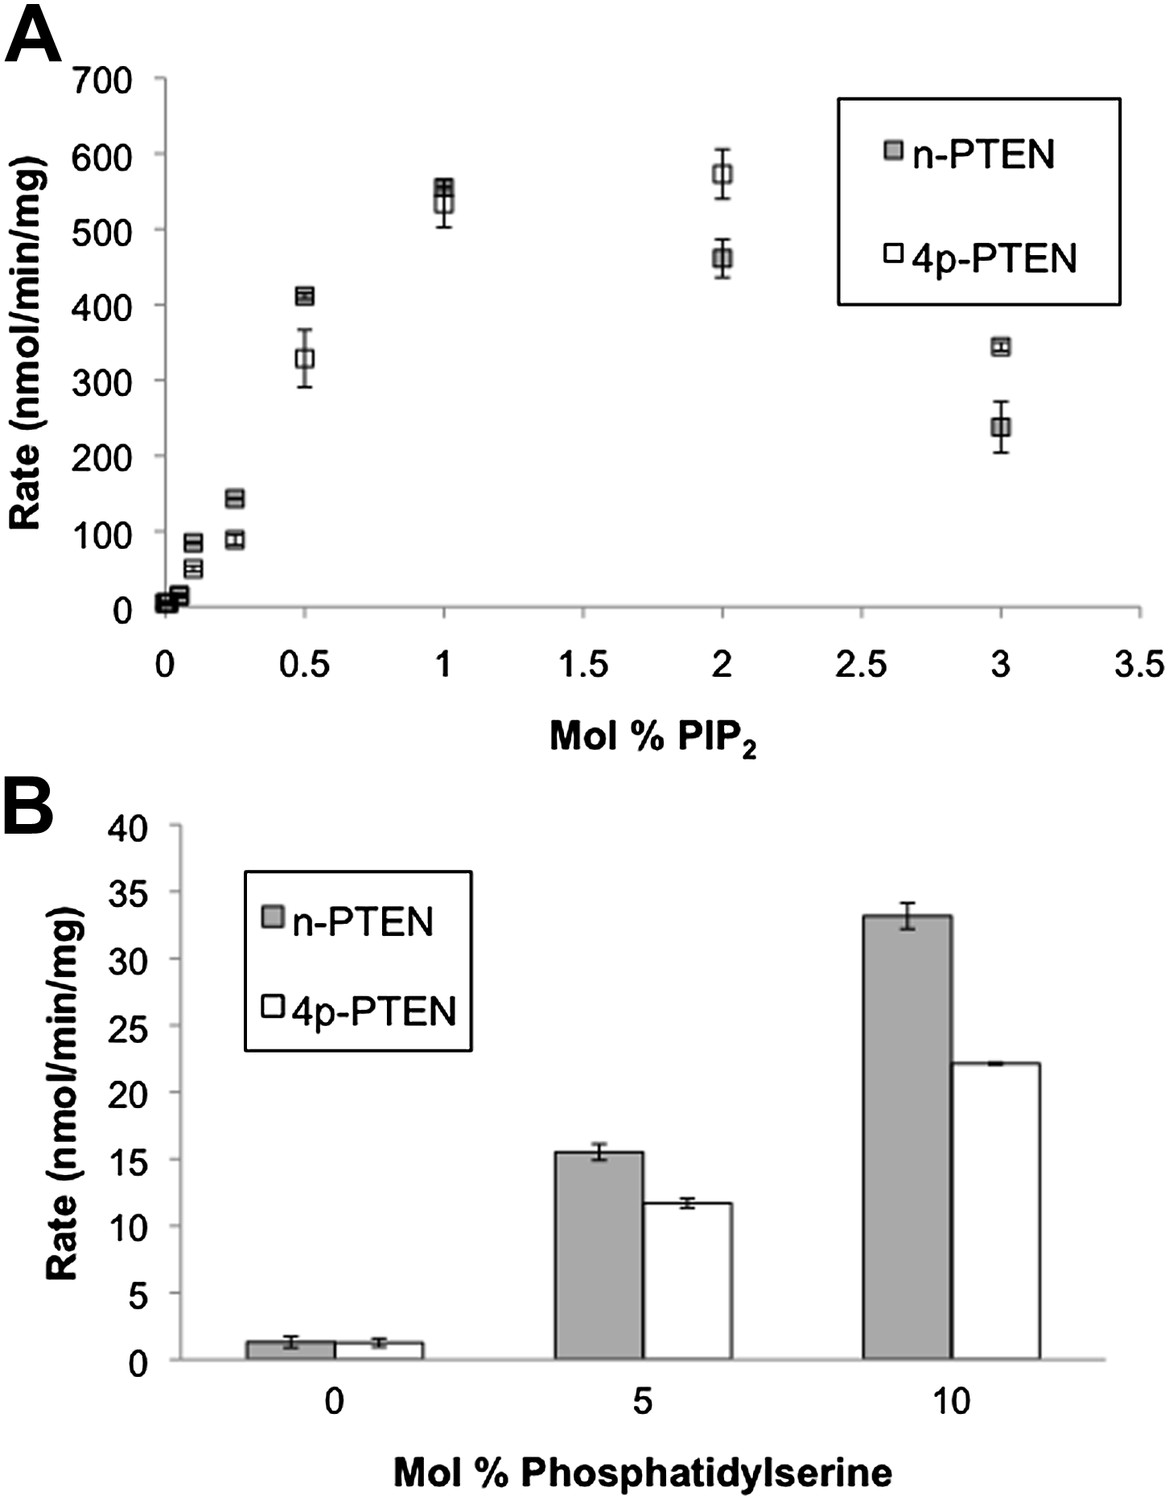
Anionic lipid stimulation of n-PTEN and 4p-PTEN.
At a low surface concentration of PIP3 (0.01%) incorporated vesicles, (A) PIP2 and (B) Phosphatidylserine stimulate the enzymatic activity of n-PTEN and 4p-PTEN. Data are reported as the mean ± the SEM of three experiments performed in duplicate.
Figure 3 with 1 supplement
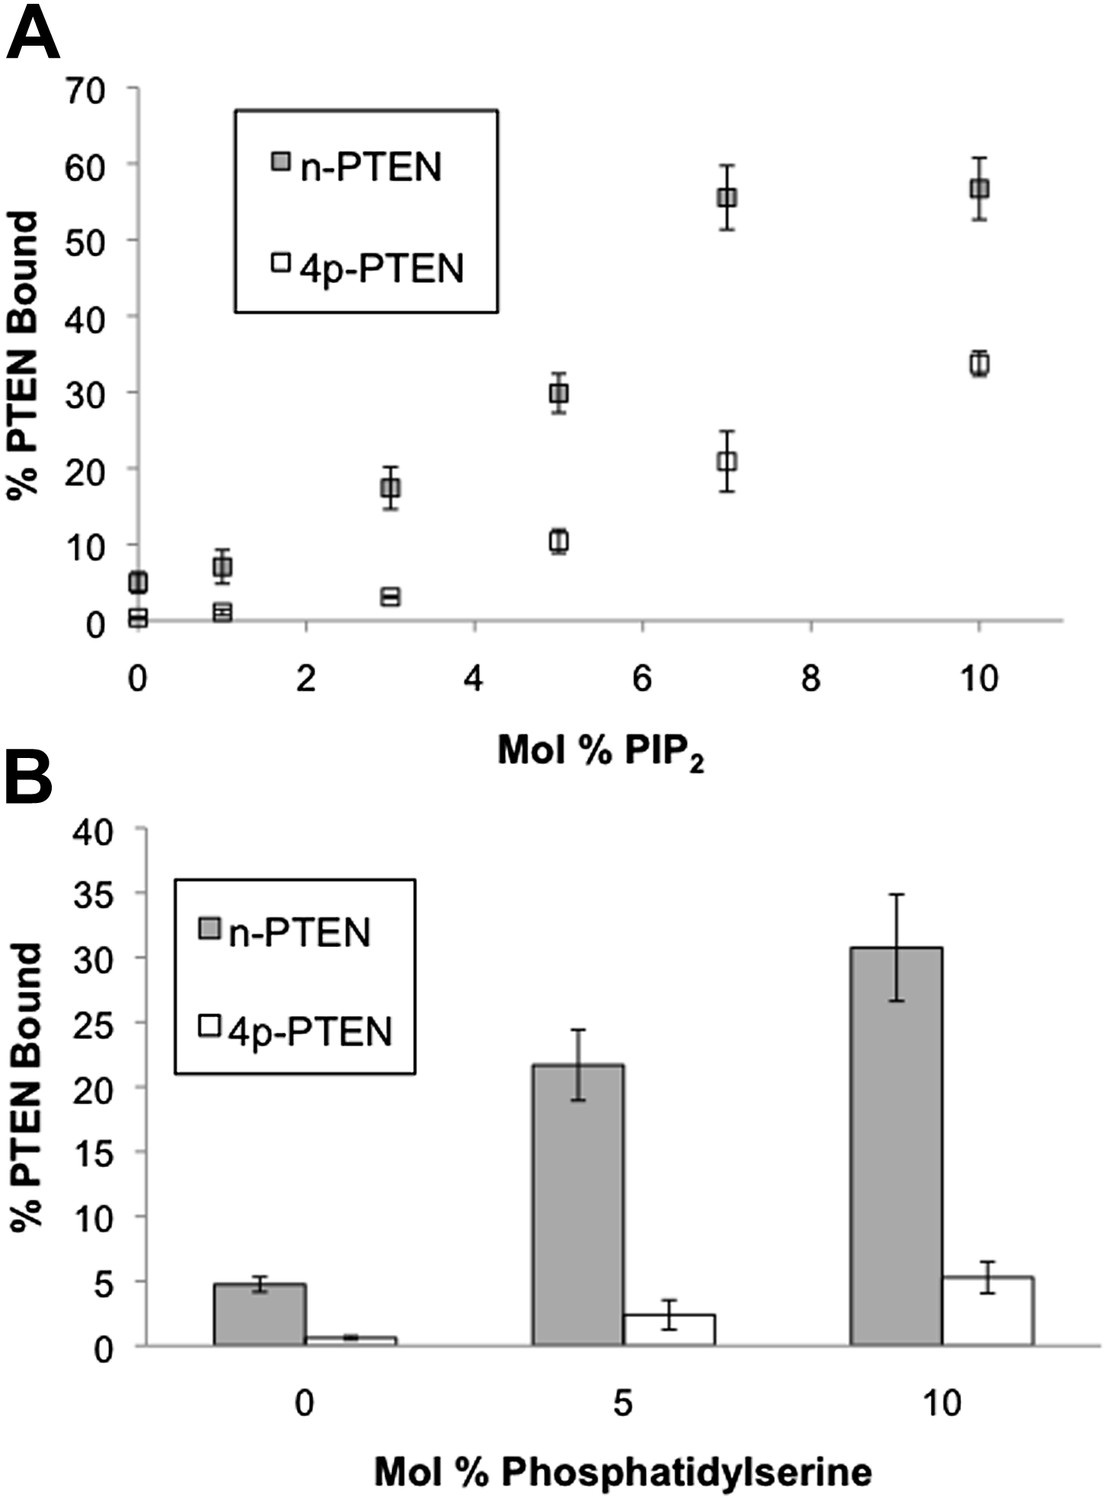
n-PTEN and 4p-PTEN binding to large multilamellar vesicles (LMVs).
The percent of n-PTEN and 4p-PTEN bound to sedimented phosphatidylcholine LMVs incorporated with (A) PIP2 or (B) phosphatidylserine was determined by quantification of western blot bands. Data are reported as the mean ± the SEM of three separate experiments.
Figure 3—figure supplement 1
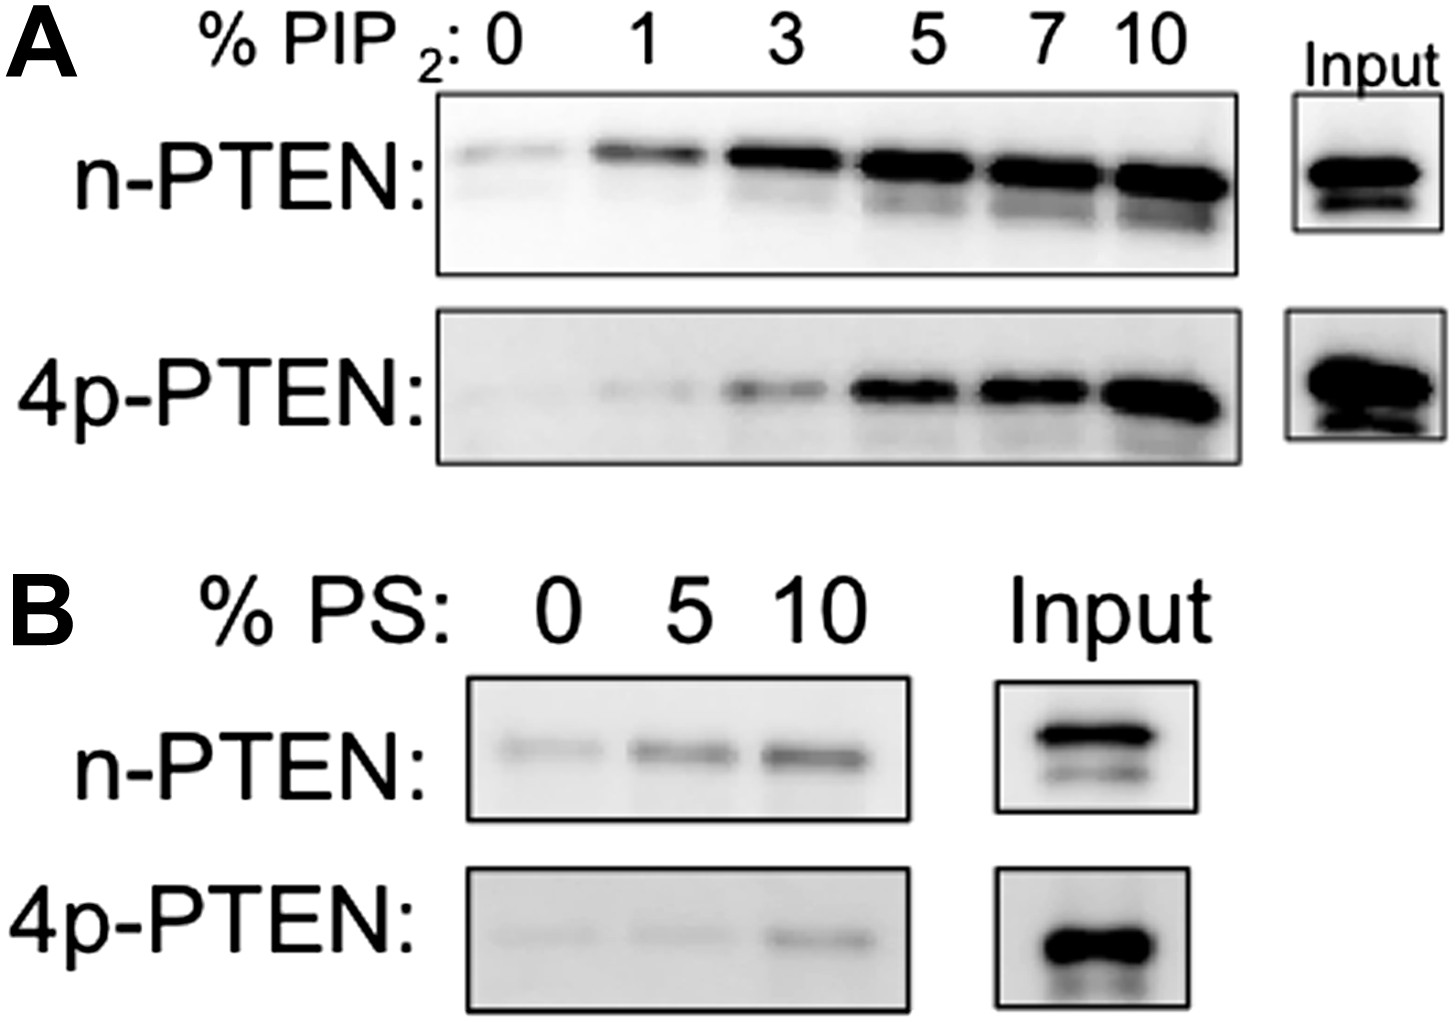
n-PTEN and 4p-PTEN binding to large multilamellar vesicles (LMVs).
Representative blots of the percent of n-PTEN and 4p-PTEN bound to sedimented phosphatidylcholine LMVs incorporated with (A) PIP2 or (B) phosphatidylserine.
Figure 4 with 2 supplements
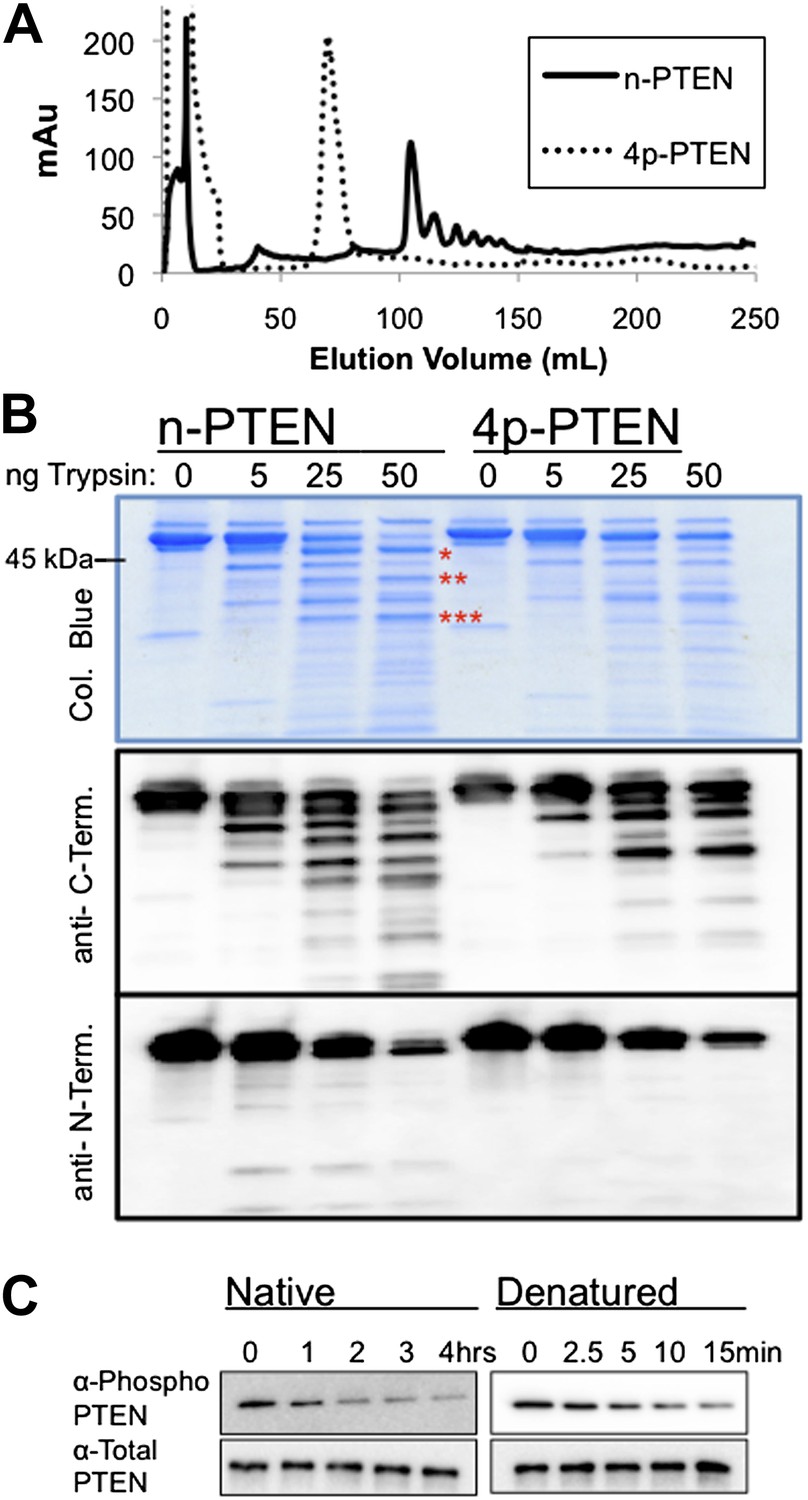
Conformational changes associated with PTEN phosphorylation.
(A) With a gradient of 0–50% NaCl over 250 ml on an anion exchange column, 4p-PTEN elutes at ∼70 ml while n-PTEN elutes at ∼100 ml. (B) 2 μg of n-PTEN and 4p-PTEN were digested with varying amounts of trypsin then visualized by colloidal blue staining or by western blot with an antibody to the N- or C-terminus of PTEN. Asterisks denote bands that are in higher abundance in the digestion of n-PTEN compared to 4p-PTEN. N-terminal sequencing of these bands identifies the cleavage sites as (*) R15, (**) R84 and (***) R161. (C) Denatured 4p-PTEN treated with 0.5 μM alkaline phosphatase is significantly more sensitive to dephosphorylation of the tail phosphocluster compared to the native form of 4p-PTEN treated with 1 μM alkaline phosphatase.
Figure 4—figure supplement 1

Non-tail cluster phosphorylation of PTEN expressed in High Five insect cells.
(A) The elution pattern on anion exchange of t-PTEN is similar to that of n-PTEN (Figure 4A). (B) Western blot with an antibody to phospho T366/S370 shows phosphorylation at these sites is removed by mutation to alanine. X-mutant contains T366A/S370A as defined in Figure 6—figure supplement 1.
Figure 4—figure supplement 2
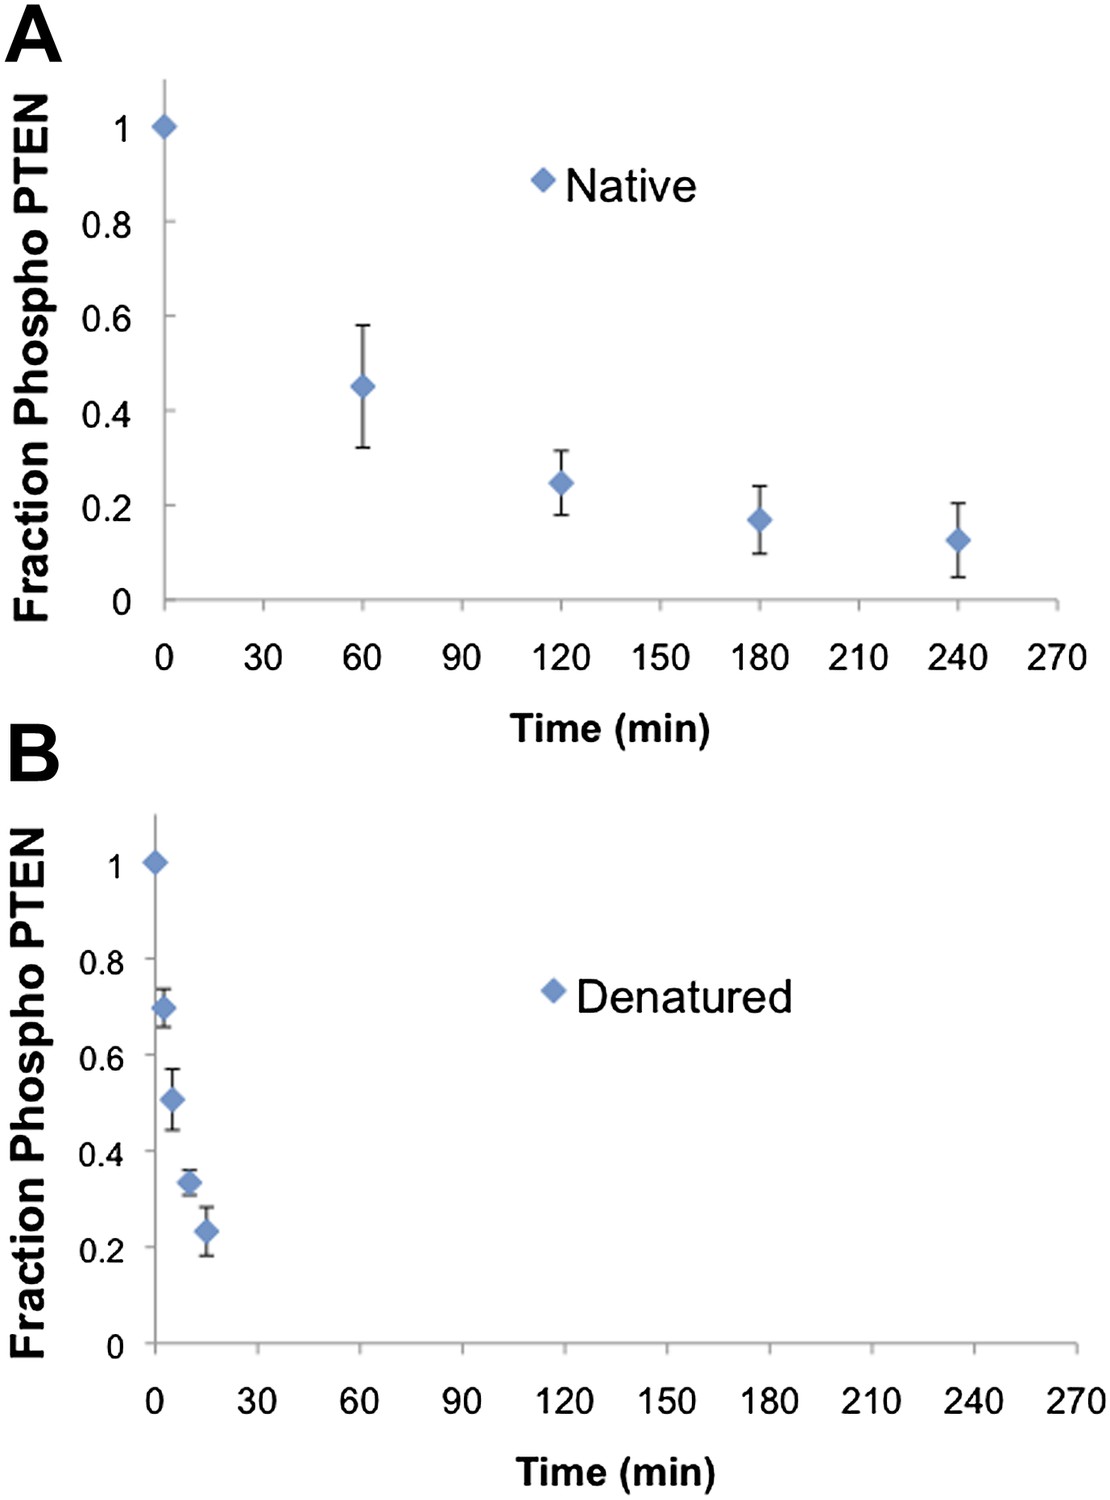
Native and denatured 4p-PTEN sensitivity to alkaline phosphatase.
(A) Native folded 4p-PTEN treated with 1 μM alkaline phosphatase. (B) 4p-PTEN denatured by repeated freeze thaw cycles treated with 0.5 μM alkaline phosphatase. Removal of tail phosphorylation was monitored by western blot with an antibody to the tail phospho cluster. Data are represented as the mean ± the SEM of three experiments.
Figure 5 with 1 supplement
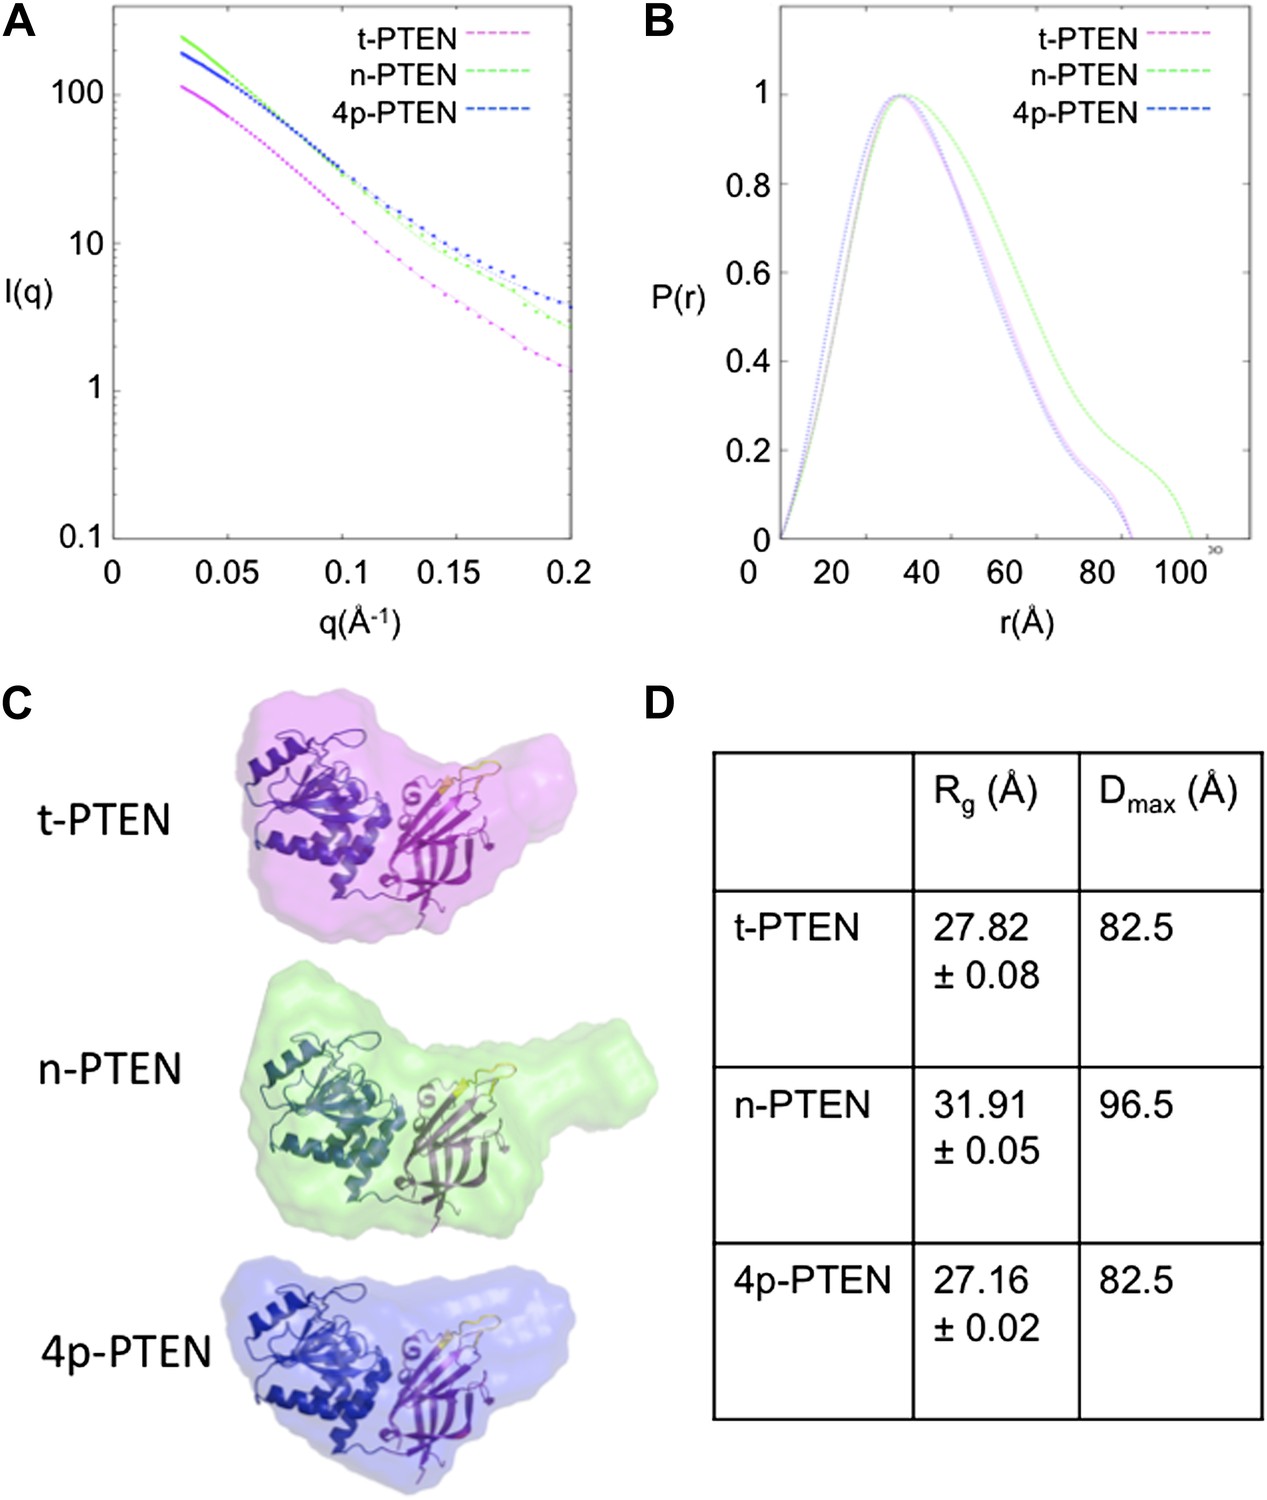
SAXS analysis for t-PTEN, n-PTEN and 4p-PTEN.
(A) Scattering diagrams and (B) pair distribution function (Pofr) plots for t-PTEN, n-PTEN, and 4p-PTEN. (C) The molecular envelopes for t-PTEN, n-PTEN, and 4p-PTEN overlaid with the tailless crystal structure containing the phosphatase domain (blue), C2 domain (magenta), and CBRIII loop (yellow). (D) Summary of Rg and Dmax values for t-PTEN, n-PTEN, and 4p-PTEN.
Figure 5—figure supplement 1
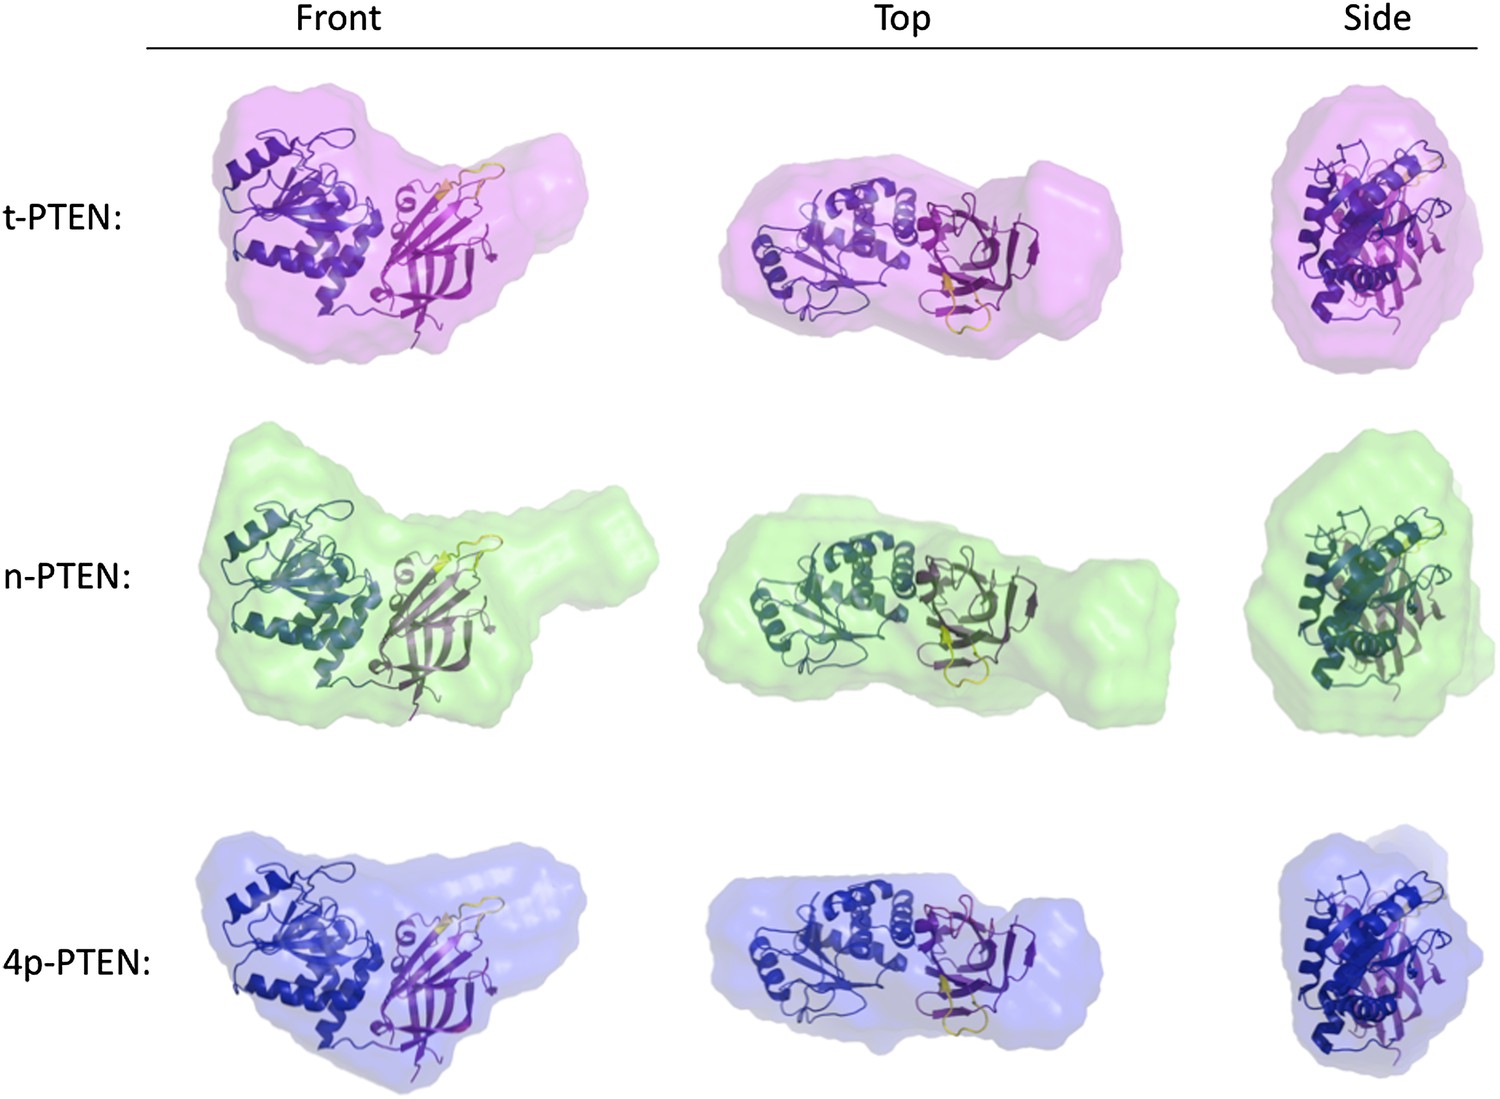
Molecular envelopes of t-PTEN, n-PTEN and 4p-PTEN obtained from SAXS analysis.
Molecular envelopes of t-PTEN, n-PTEN, and 4p-PTEN were generated from SAXS scattering data using the ab initio modeling program DAMMIN. Outputs from ten DAMMIN runs were averaged for each protein using DAMAVER and are shown overlaid with the tailless crystal structure with phosphatase domain shown in blue, the C2 domain shown in magenta and the CBRIII loop shown in yellow. Front, side and top views are shown for each protein.
Figure 6 with 5 supplements
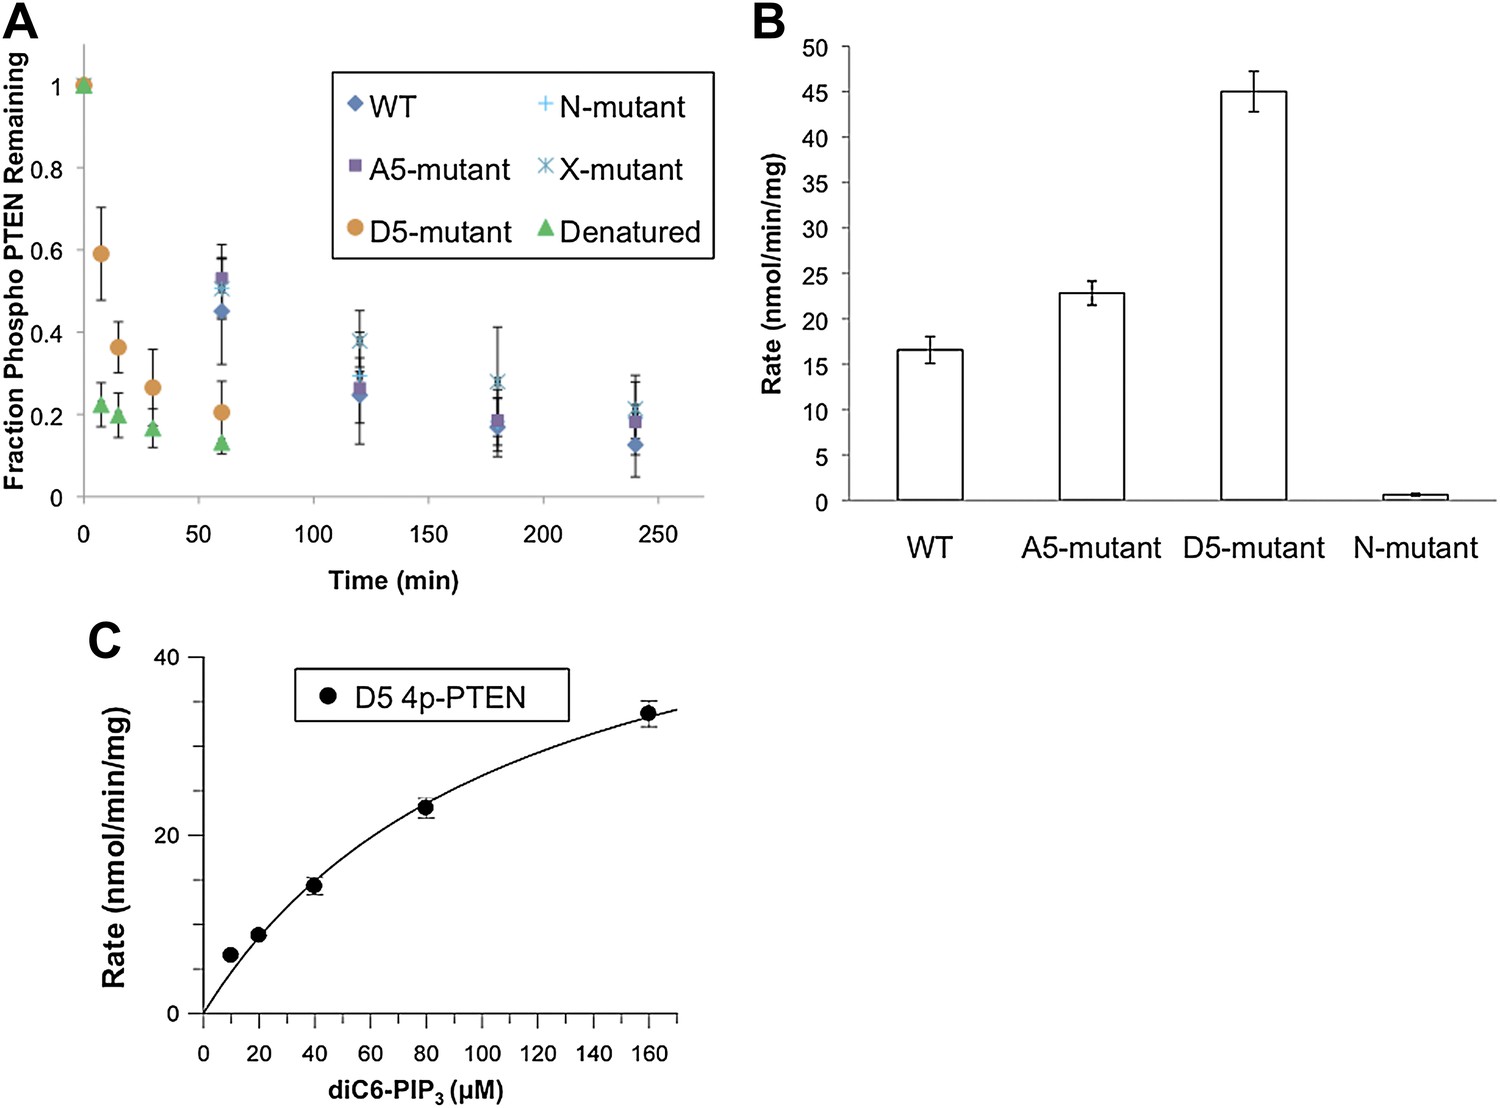
Phosphatase sensitivity and activity of 4p-PTEN and its mutants.
(A) The rate of dephosphorylation of 4p-PTEN and its mutants was measured by quantification of bands from western blot analysis after treatment of the PTEN protein with 1 μM alkaline phosphatase. Data points are shown as the mean ± the SEM of three experiments. (B) PTEN activity was measured against 160 μM diC6-PIP3 substrate. (C) Km curve of D5 4p-PTEN mutant (kcat = 3.0 ± 0.3 min−1, Km = 112 ± 22 μM, kcat/Km = 0.027 ± 0.003 min−1μM−1). Data points are shown as the mean ± the SEM of three experiments performed in duplicate.
Figure 6—figure supplement 1

Schematic view of semisynthetic PTEN mutants.
PTEN mutants were generated analogously to n-PTEN and 4p-PTEN semisynthetic proteins as outlined in the ‘Materials and method’ section.
Figure 6—figure supplement 2
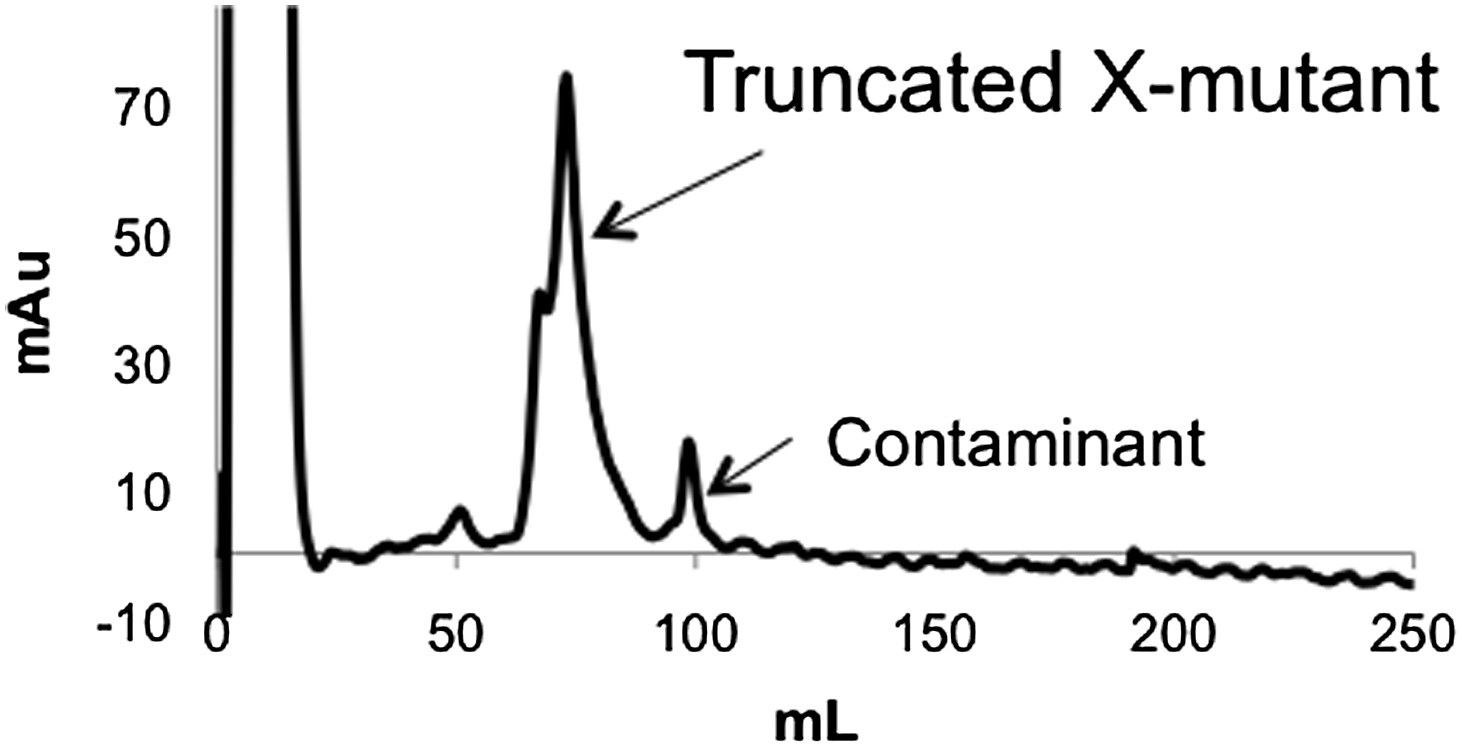
Anion exchange elution pattern of the PTEN X-mutant.
Mutating T366 and S370 to alanine in the unligated (C-terminally truncated) X-mutant removes the observance of multiple peaks in the anion exchange chromatogram.
Figure 6—figure supplement 3

Alkaline phosphatase sensitivity of 4p-PTEN and mutant forms.
4p-PTEN and its mutants were treated with 1 μM alkaline phosphatase. Dephosphorylation of the phospho-tail cluster was monitored by western blot with an antibody to the phospho-tail.
Figure 6—figure supplement 4
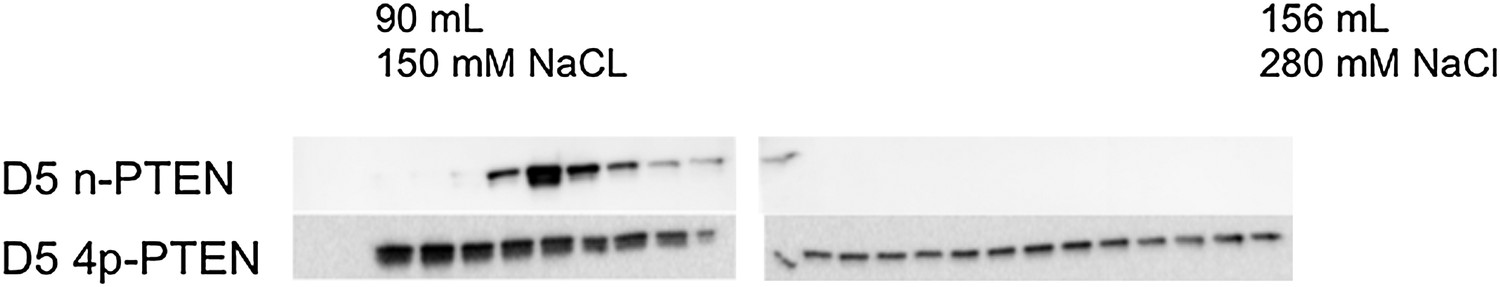
Anion exchange chromatography elution profiles of phosphorylated and unphosphorylated D5 PTEN.
(Top) D5 n-PTEN elutes as a sharp peak around 100 ml. (Bottom) D5 4p-PTEN elutes as a broad peak starting at 90 ml and finishing past 156 ml.
Figure 6—figure supplement 5
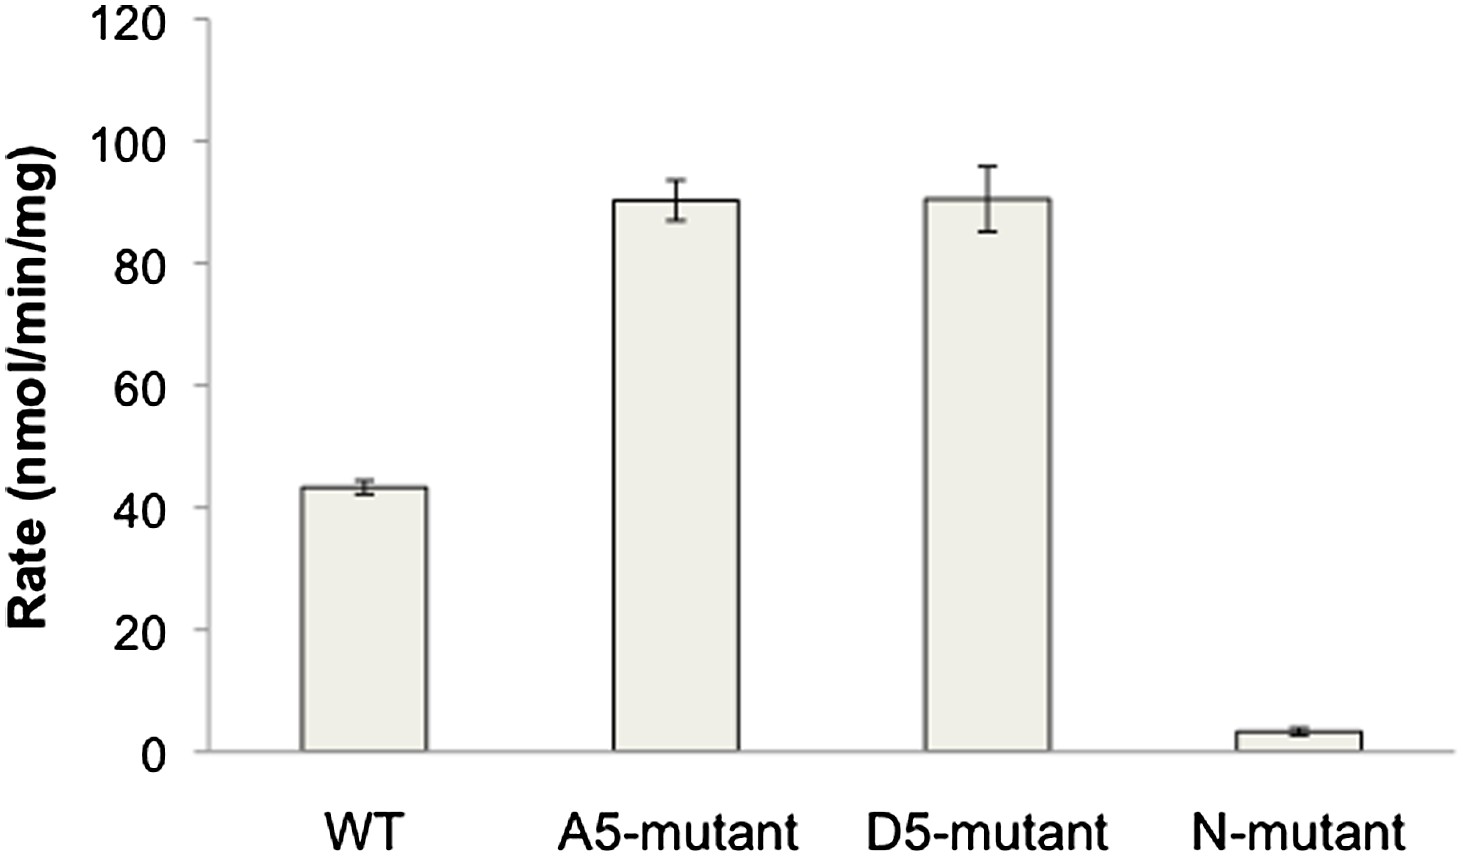
PTEN activity to diC6 PIP3.
n-PTEN and its mutants activity was measured with 160 μM soluble diC6 PIP3. Phosphate release was monitored by Malachite green detection. Data are represented as the mean ± the SEM of three experiments preformed in duplicate.
Figure 7
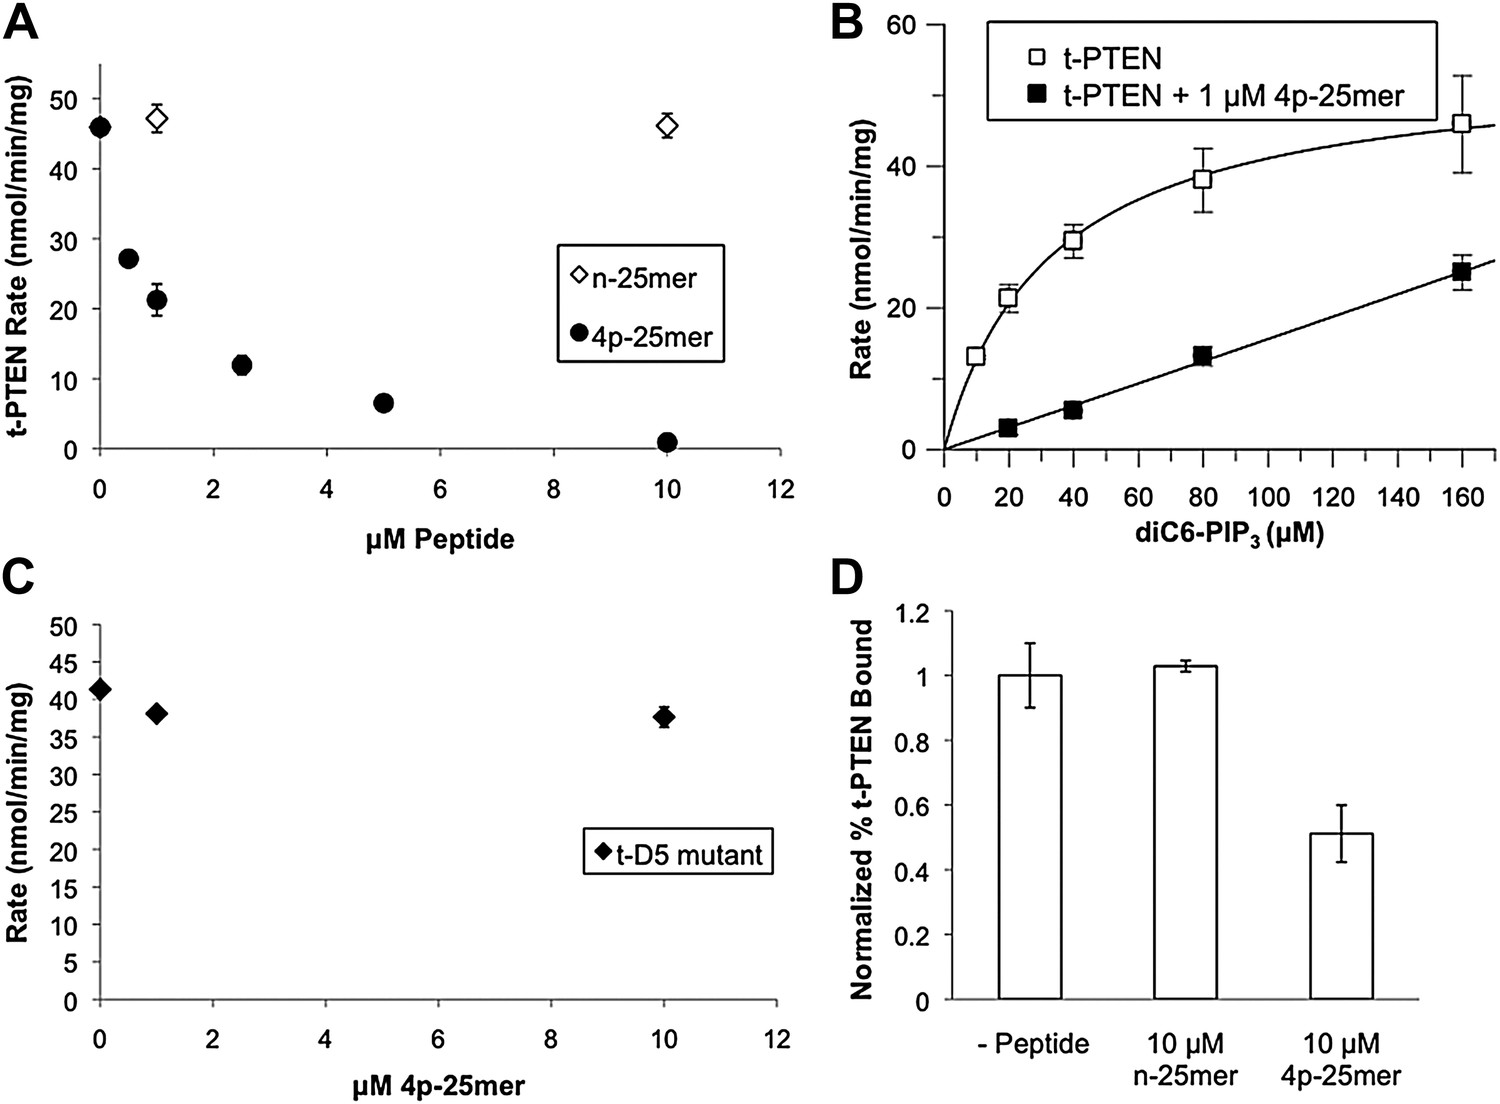
In trans peptide inhibition and binding of PTEN.
(A) Tail peptide inhibition of t-PTEN with either n-25mer or 4p-25mer. (B) Km curve of t-PTEN in the absence (kcat = 2.9 ± 0.1 min−1; Km = 33 ± 2.1 μM, kcat/Km = 0.088 ± 0.004 min−1μM−1) or presence (kcat/Km = 0.006 ± 0.0003 min−1μM−1) of 1 μM 4p-25mer phosphopeptide. (C) Reduced inhibition of D5 t-PTEN mutant in the presence of 4p-25mer peptide. (D) Vesicle sedimentation of t-PTEN in absence and presence of 10 μM tail peptides. Data points are shown as the mean ± the SEM of three experiments performed in duplicate.
Figure 8
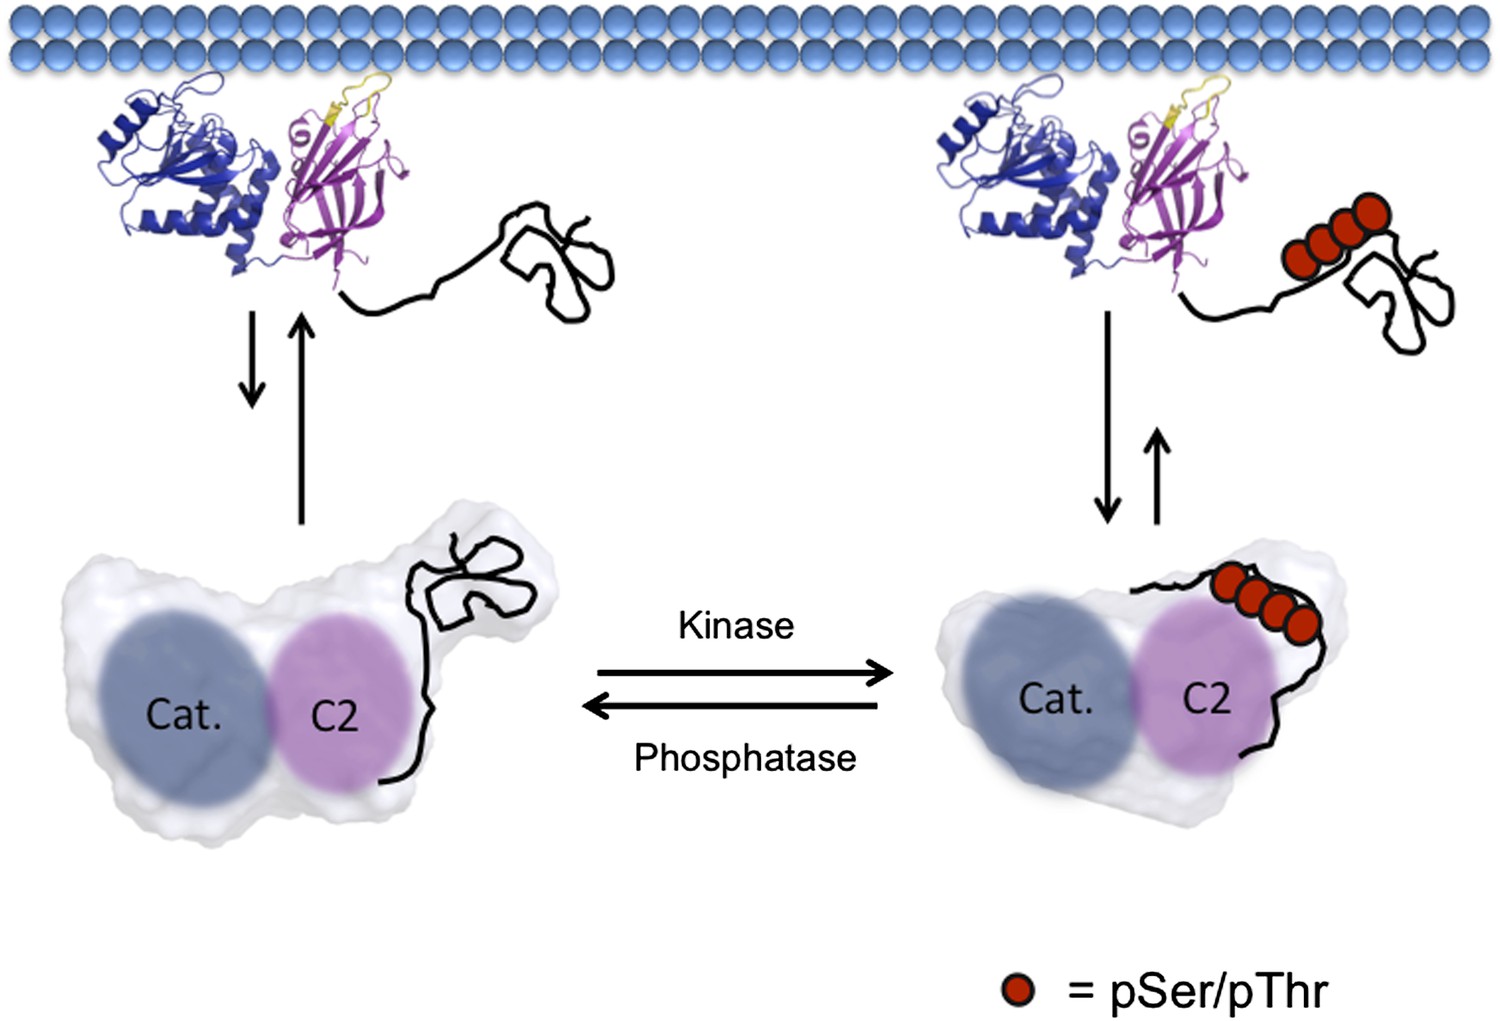
Model of PTEN regulation by phosphorylation.
Upon phosphorylation, PTEN adopts a more compact conformation with the phosphorylated tail condensing around the CBRIII loop and membrane binding surface of the C2 domain, preventing it from binding to the plasma membrane. When dephosphorylated, the tail of PTEN is no longer bound tightly to the C2 domain, allowing for the open PTEN protein to bind efficiently to the plasma membrane. Both phosphorylated and unphosphorylated PTEN are in the same open conformation when bound to the plasma membrane.
Download links
A two-part list of links to download the article, or parts of the article, in various formats.
Downloads (link to download the article as PDF)
Open citations (links to open the citations from this article in various online reference manager services)
Cite this article (links to download the citations from this article in formats compatible with various reference manager tools)
Phosphorylation-mediated PTEN conformational closure and deactivation revealed with protein semisynthesis
eLife 2:e00691.
https://doi.org/10.7554/eLife.00691


