Functional genomic characterization of neoblast-like stem cells in larval Schistosoma mansoni
- Howard Hughes Medical Institute, University of Illinois at Urbana-Champaign, United States
- University of Illinois at Urbana-Champaign, United States
Figures
Figure 1
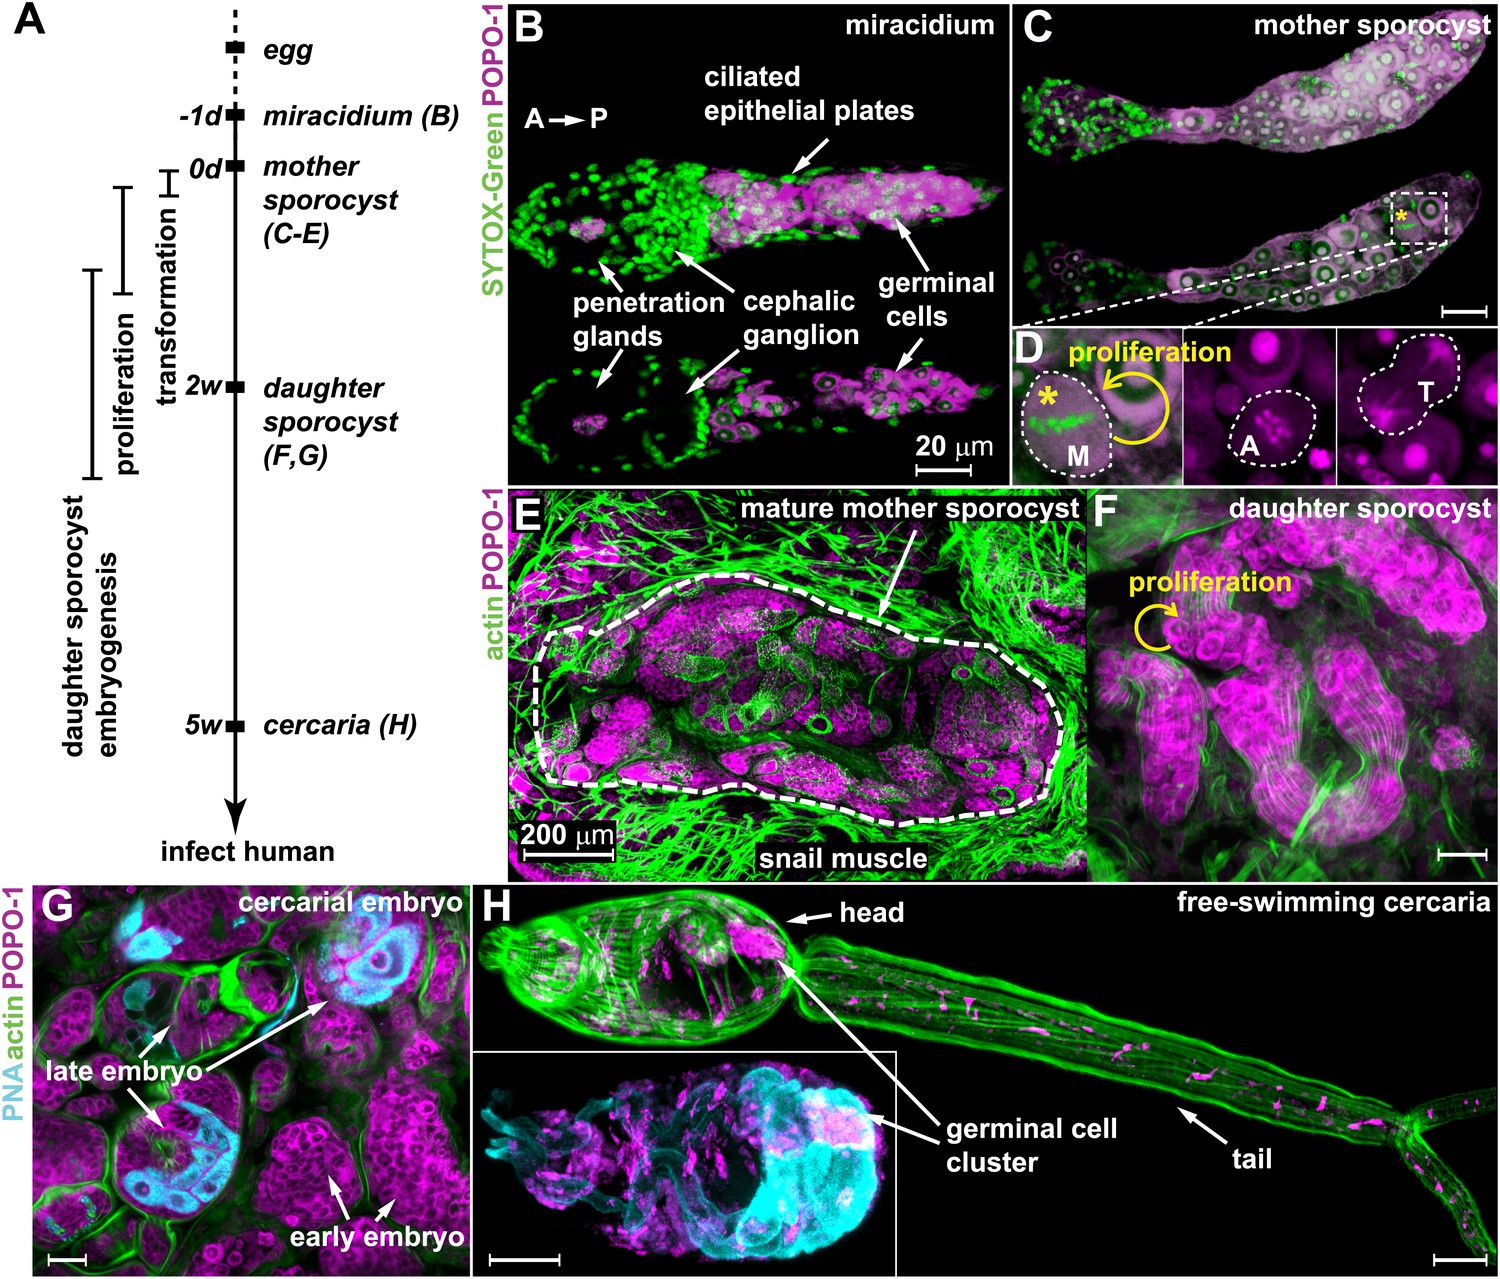
Germinal cells are detected throughout the asexual phase of the S. mansoni life cycle.
(A) A schematic timeline of schistosome asexual amplification. (B–C) Maximum intensity projections of confocal stacks (top) and single optical slices (bottom) of a POPO-1 and SYTOX-Green co-stained miracidium (B) and a sporocyst 24 hr after in vitro transformation (C). (D) Representative images of cells at metaphase (M), anaphase (A), and telophase (T) (from left to right), captured in sporocysts 24 hr post-transformation. (E–G) Cryosections of the tentacle of a Biomphalaria glabrata snail showing a mother sporocyst (perimeter highlighted by dashed line) with daughter sporocysts packed inside (3 weeks post infection) (E); an individual daughter sporocyst that has migrated to the digestive glands of a B. glabrata snail 6 weeks post infection (F); and cercarial embryos within a daughter sporocyst in the digestive glands of a B. glabrata snail 6 weeks post infection (G) (staged after Cheng and Bier, 1972). Actin is stained with phalloidin. Peanut agglutinin (PNA) visualizes acetabular glands and ducts of the cercariae. (H) A mature cercaria. The inset shows a magnified view of this animal’s head visualized with PNA and POPO-1 staining. Scale bars are 20 µm, except in (E) which is 200 µm.
Figure 2 with 1 supplement
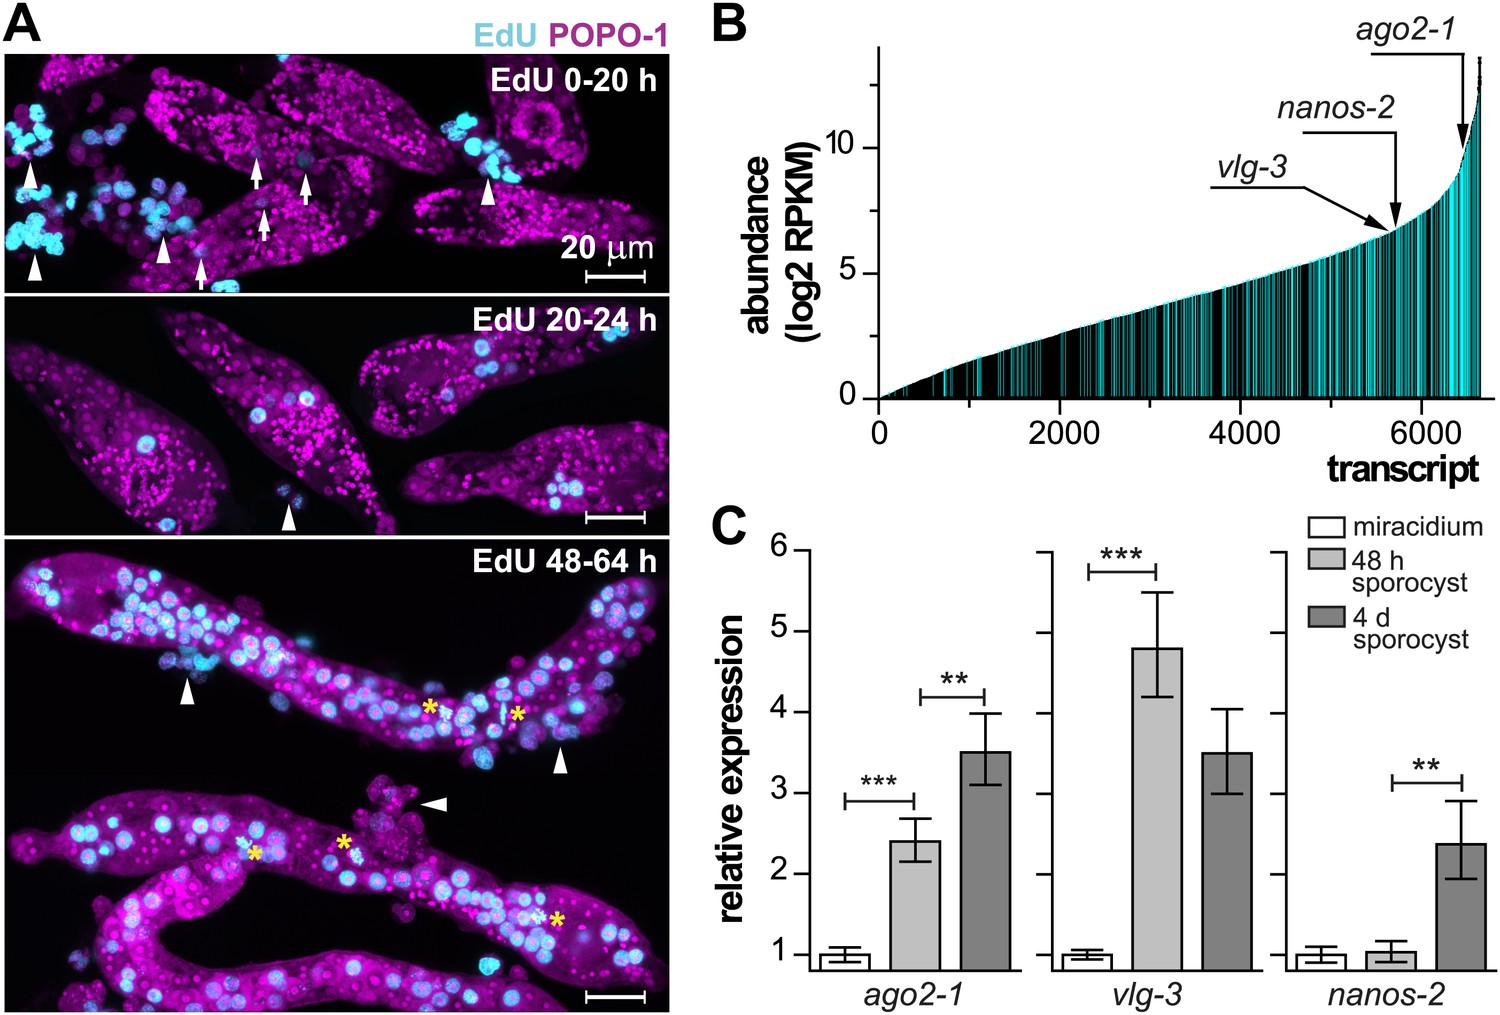
Life-cycle stage-specific transcriptional profiling to characterize germinal cell gene expression.
(A) EdU labeling to detect proliferating cells at various time points following transformation. For these experiments sporocysts were co-cultured with Bge cells, a cell line derived from embryos of B. glabrata snails, to sustain the normal development of larval schistosomes. Arrows indicate cells weakly incorporating EdU at the early time point; arrowheads indicate proliferating Bge cells. Asterisks highlight cells in mitosis. In the absence of SYTOX-Green, POPO-1 also stains somatic nuclei, which are small and compact. Scale bars are 20 µm. (B) Transcripts expressed in sporocysts 48 hr post-transformation, ranked by abundance as measured by RNAseq. Orthologs shared between sporocyst-enriched genes and planarian neoblast-enriched transcripts are highlighted in cyan. (C) Relative expression levels of ago2-1, vlg-3, and nanos-2 during sporocyst development with respect to the expression in miracidia, measured by qPCR in biological triplicate. Error bars are standard deviations. **p<0.01. ***p<0.001 (t-test).
Figure 2—figure supplement 1
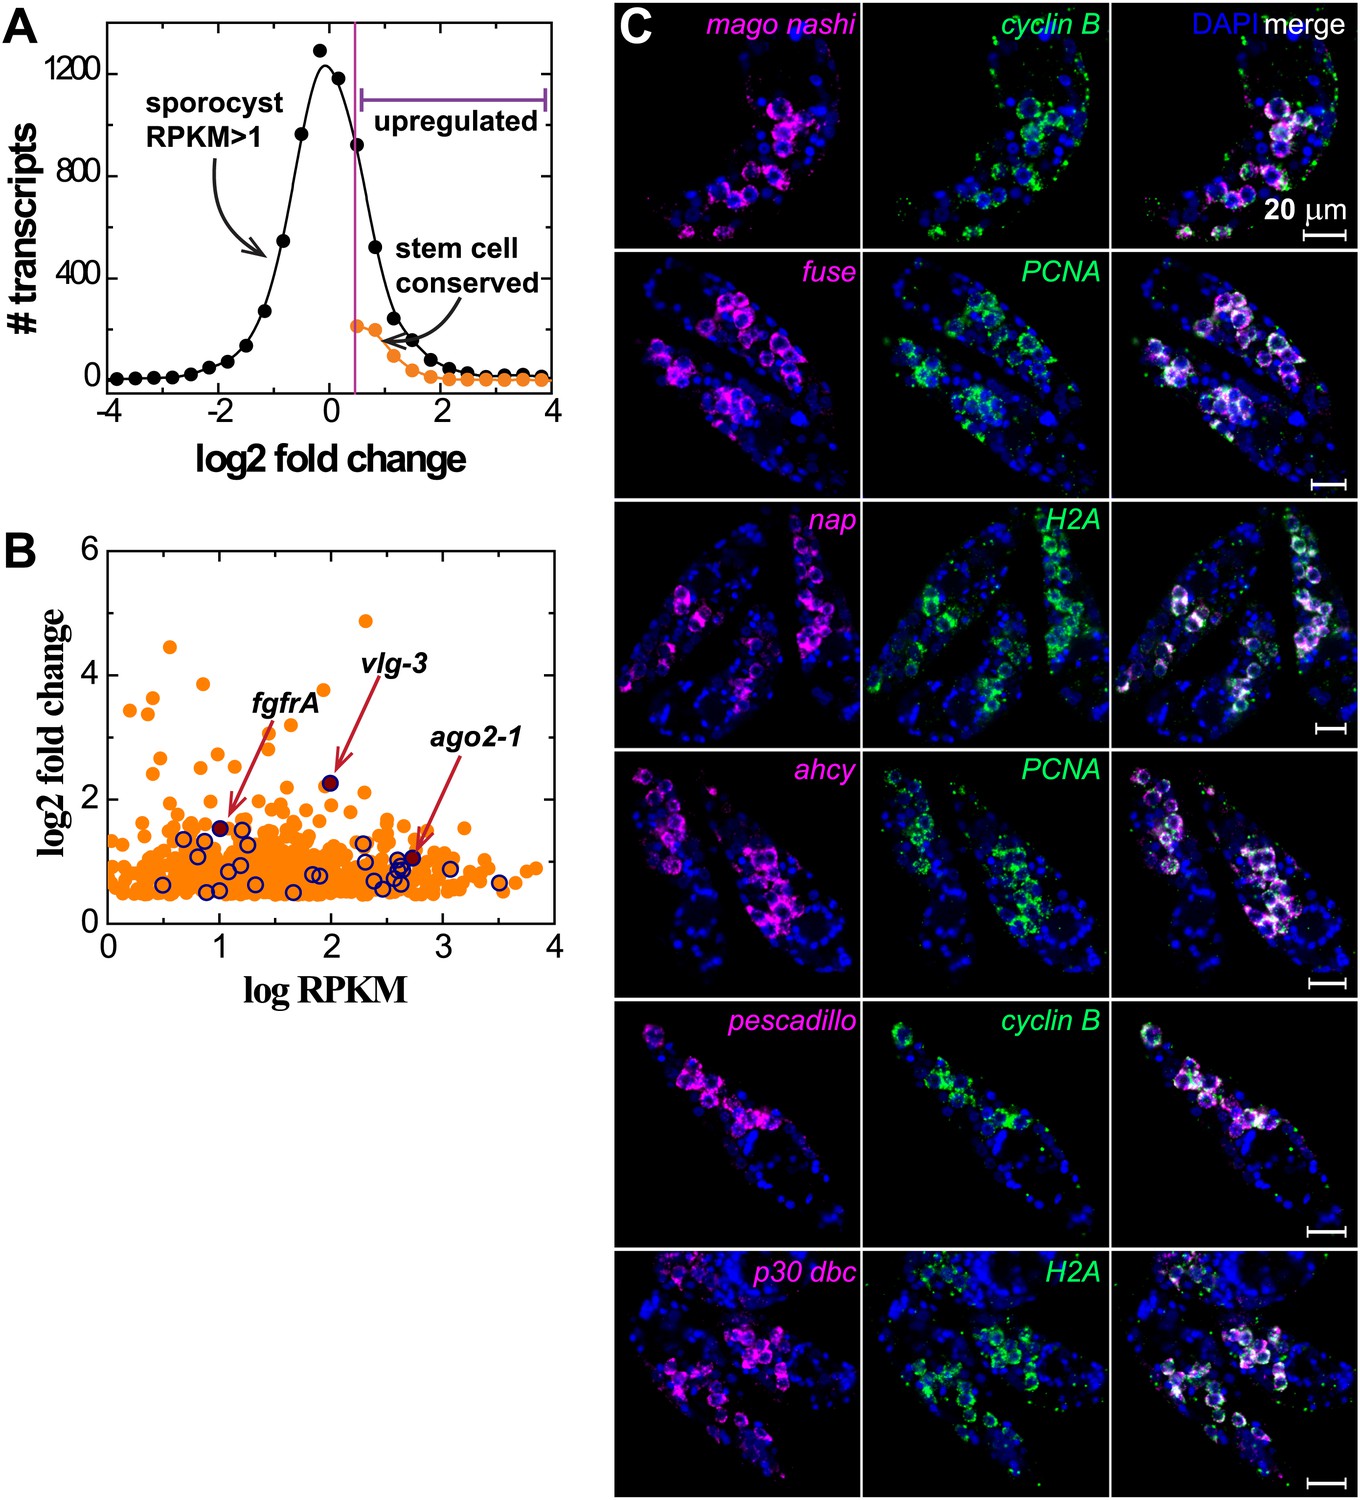
Transcriptional profiling reveals genome-wide similarity between schistosome germinal cells and planarian neoblasts.
(A) Histogram of fold changes of gene expression in sporocysts 48 hr post-transformation with respect to expression in miracidia, follows a log-normal distribution. The half standard deviation is used as the threshold to define differentially expressed transcripts. (B) Expression of sporocyst-specific genes that have homologs in neoblast-enriched transcripts is plotted logarithmically in fold change vs RPKM. A group of well-characterized conserved stem cell/neoblast markers, including ago2-1, vlg-3, and fgfrA, listed in Table 1, is highlighted by open symbols. (C) Confocal sections of sporocysts 24 hr post-transformation showing the expression of various conserved neoblast genes which overlap with the expression of cell cycle-associated transcripts. From top to bottom: mago nashi homolog (Smp_103470), far upstream (fuse) binding protein (Smp_044550), nucleosome assembly protein (nap, Smp_023530), adenosylhomocysteinase (ahcy, Smp_028440), pescadillo related gene (Smp_055800), and p30 dbc protein (Smp_193440).
Figure 3 with 1 supplement
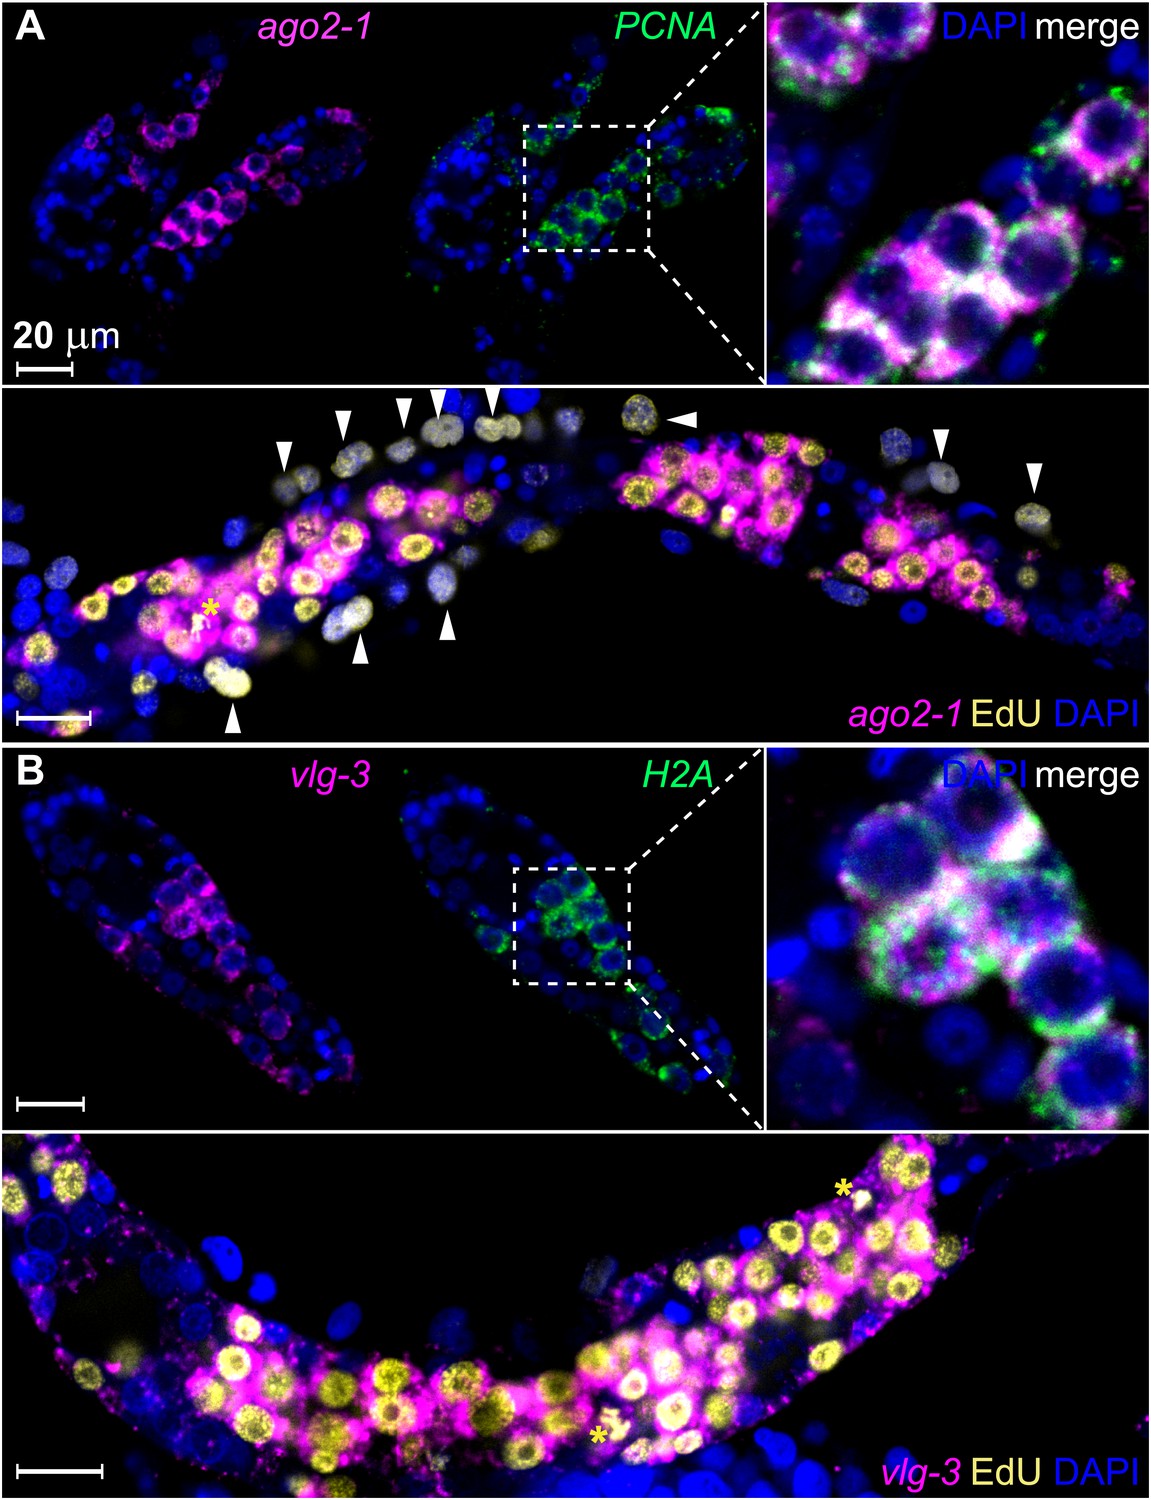
ago2-1 and vlg-3 are expressed in proliferative germinal cells.
(A) Top: confocal sections showing colocalization of ago2-1 and PCNA by FISH in sporocysts 24 hr post-transformation. Bottom: cells expressing ago2-1 incorporate EdU after a pulse 48–72 hr post-transformation. (B) vlg-3 is co-expressed with the cell cycle-associated transcript, H2A (top), and vlg-3 is expressed in cells that incorporate EdU following a pulse at 48–72 hr post-transformation (1254 vlg-3+ EdU+/1362 EdU+ cells) (bottom). Arrowheads indicate proliferating Bge cells; asterisks indicate mitotic cells. Scale bars are 20 µm.
Figure 3—figure supplement 1
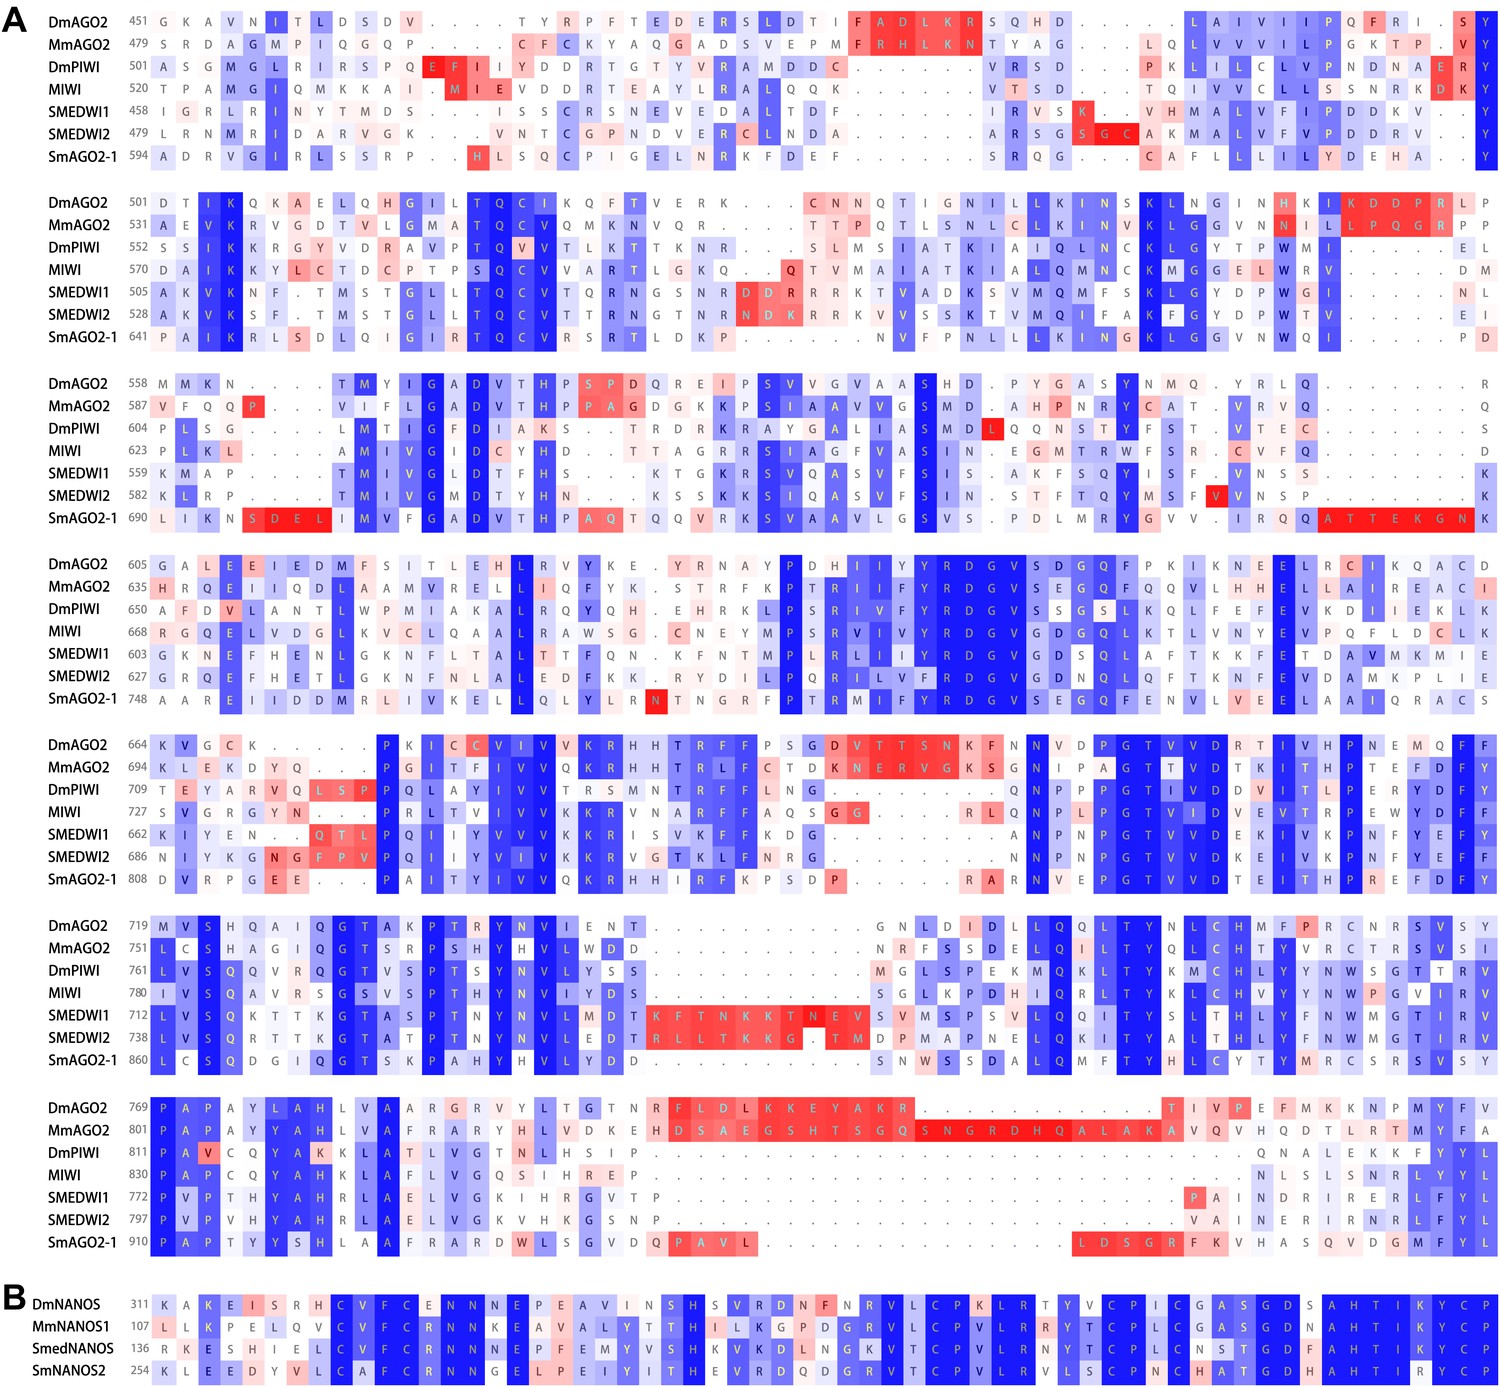
SmAGO2-1 is homologous to PIWI and AGO2 proteins, and SmNANOS2 is homologous to NANOS proteins.
The alignments are shown with respect to homologs of Drosophila melanogaster (Dm), Mus musculus (Mm), and planarian Schmidtea mediterranea (SMED) proteins. (A) PIWI domains. (B) Nanos RNA-binding domains. Blue: conserved residues, red: divergent residues.
Figure 4
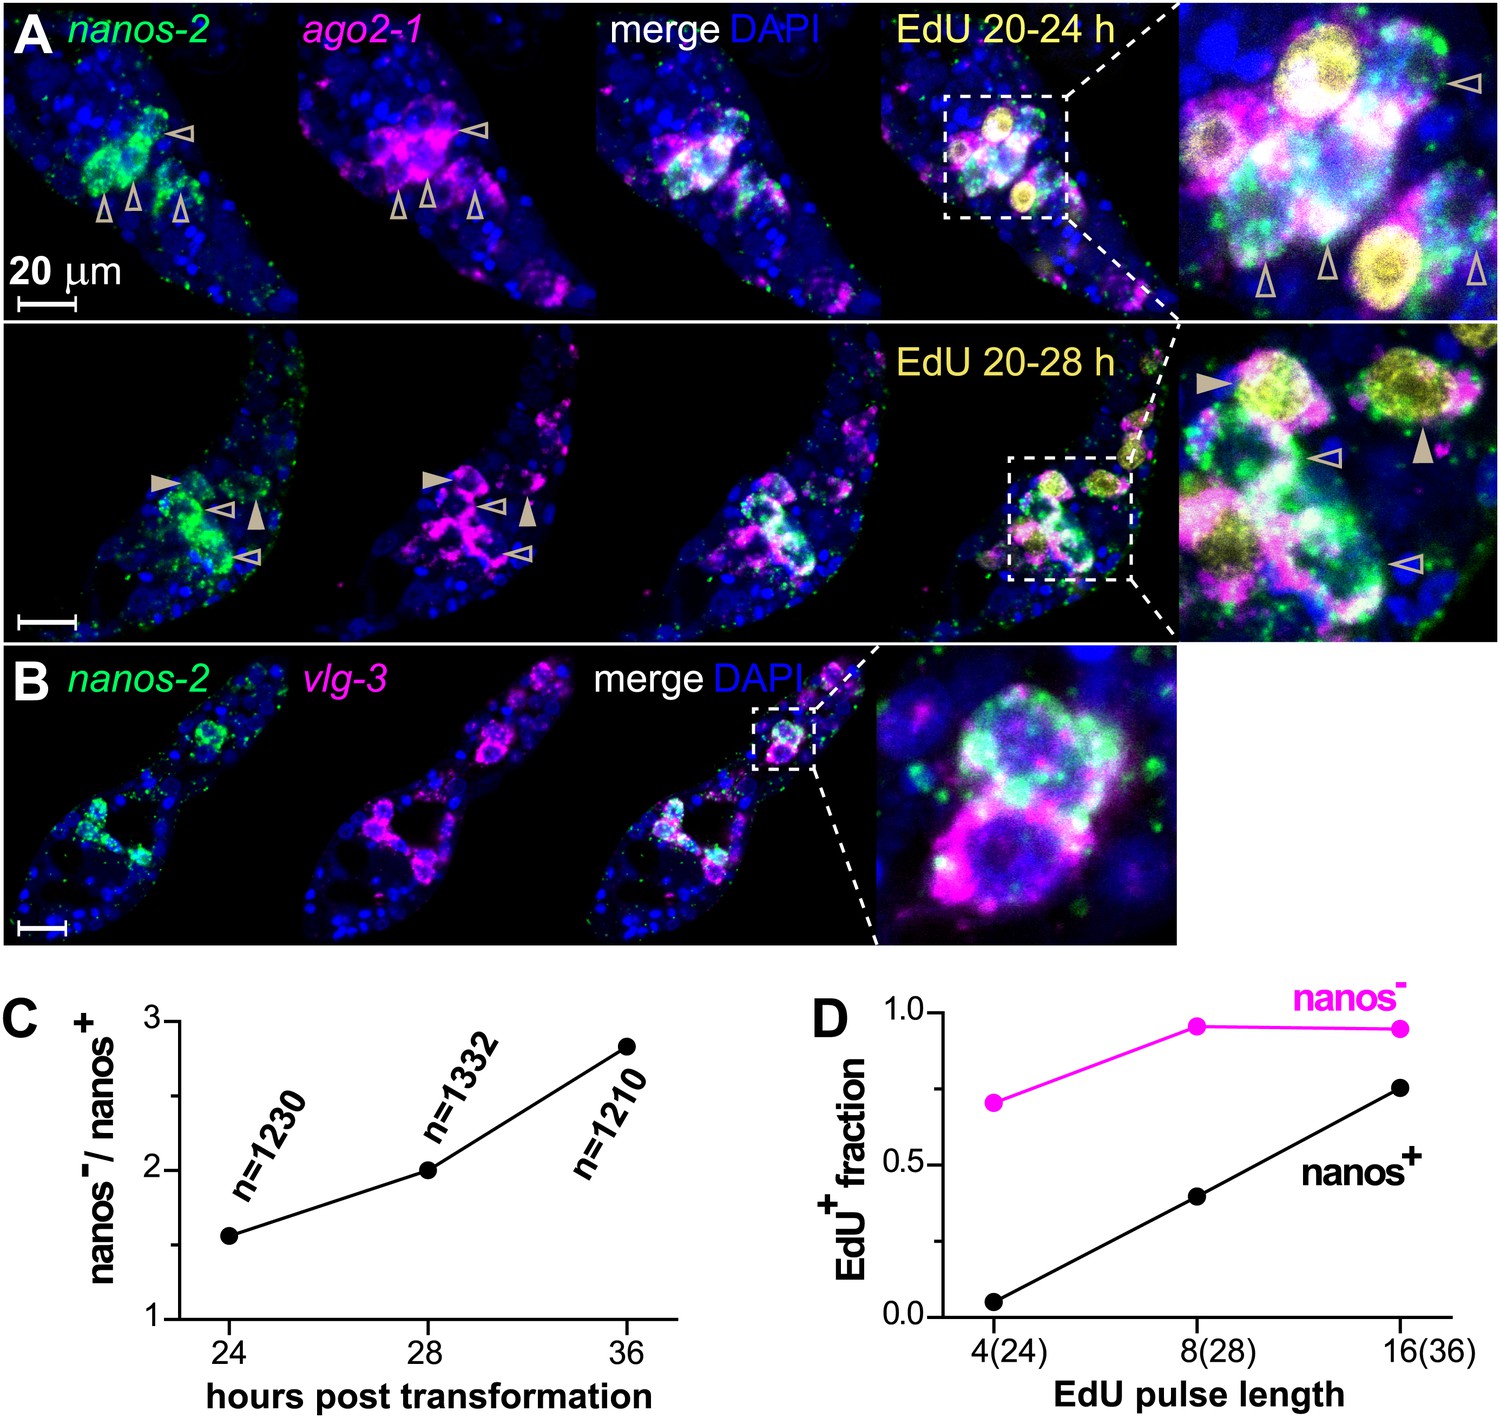
ago2-1, vlg-3, and nanos-2 expression identifies heterogeneity in the germinal cell population.
(A) FISH to detect nanos-2 and ago2-1 mRNA in EdU-labeled parasites. Relative to the nanos-2− germinal cells, nanos-2+ cells require longer time periods to incorporate EdU. Germinal cells are defined as ago2-1+ cells. The open arrowheads indicate nanos-2+ cells that are EdU−, whereas filled arrowheads point to those that are EdU+. Times for EdU pulses are indicated in figures. (B) FISH to detect nanos-2 and vlg-3 mRNA. Scale bars are 20 µm. (C) The ratio between nanos-2− and nanos-2+ germinal cells increases with time after transformation. (D) Fractions of cells that incorporate EdU after pulses of various lengths. All EdU pulses start at 20 hr post-transformation, and the end times are indicated in the parentheses along the x-axis.
Figure 5
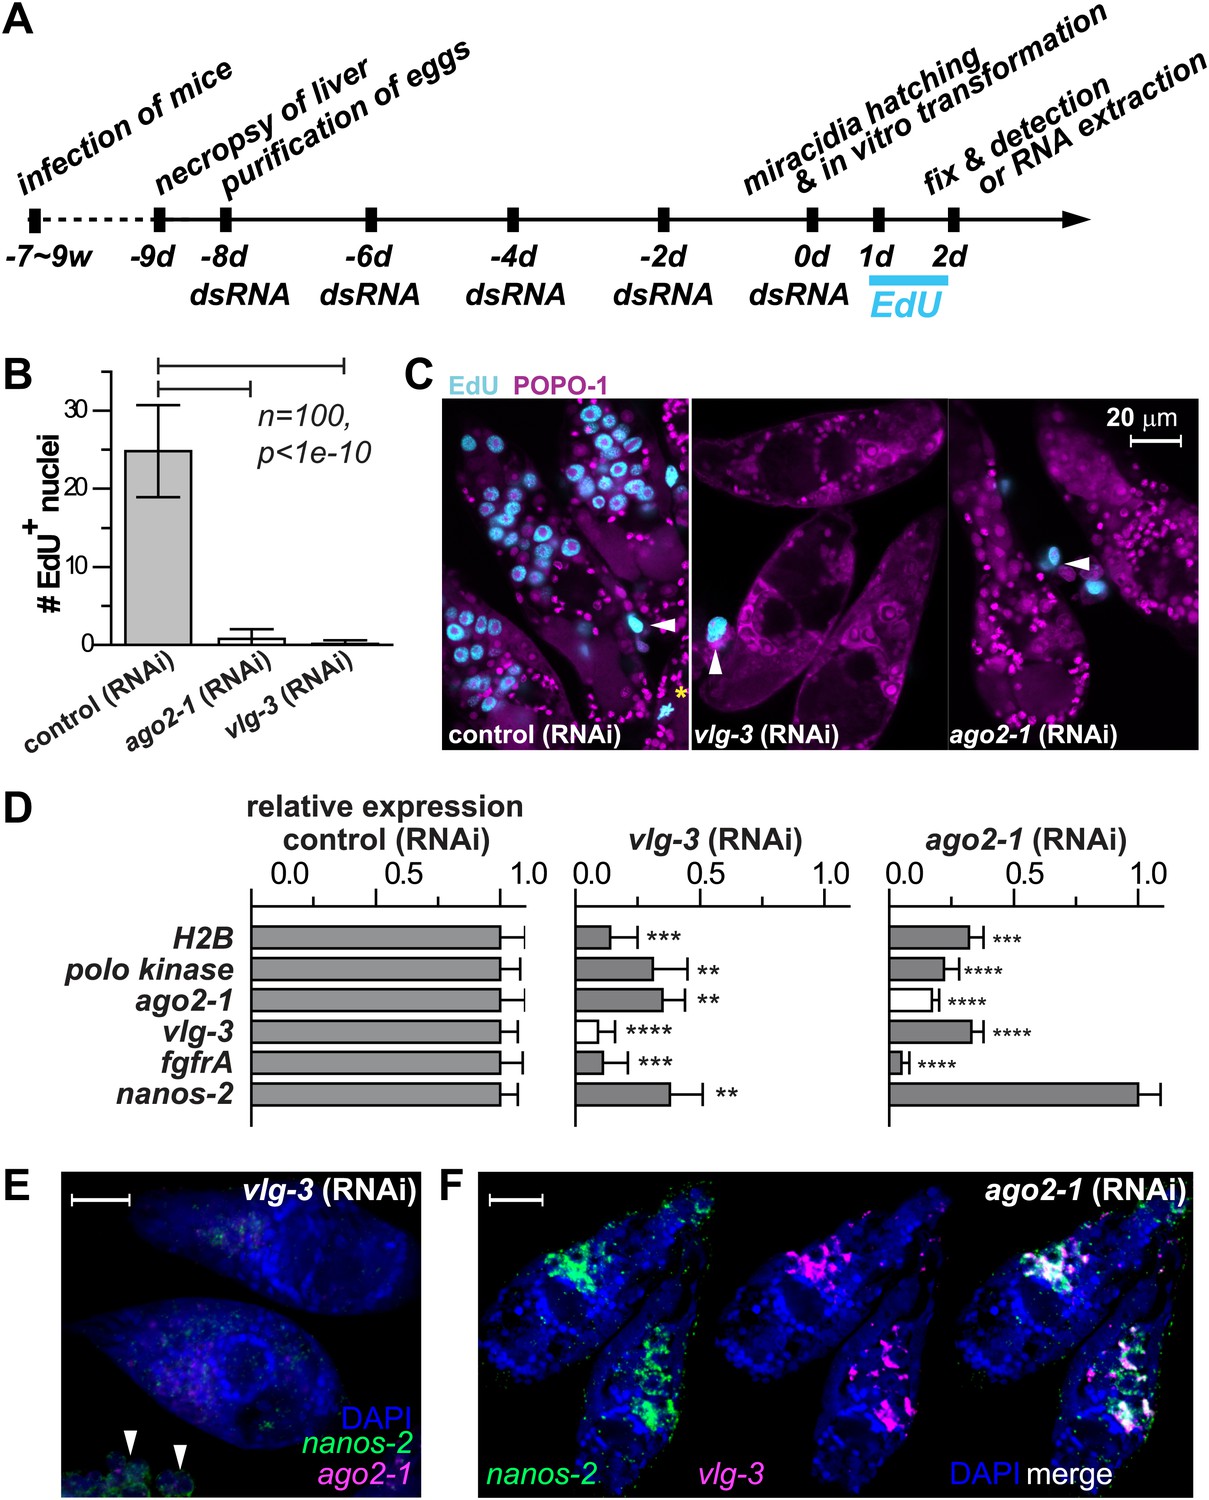
vlg-3 and ago2-1 are required for germinal cell maintenance and proliferation.
(A) Timeline for RNAi experiments; EdU was added to the culture at 20–40 hr post-transformation. (B) Average number of EdU+ nuclei per sporocyst in control, ago2-1 (RNAi), and vlg-3 (RNAi) experiments. (C) Representative confocal stacks showing EdU incorporation after RNAi. Arrowheads indicate proliferating Bge cells; asterisk indicates an EdU+ mitotic cell. (D) Relative gene expression levels measured by qPCR for control and RNAi sporocysts, both in biological triplicate. The white bars indicate the genes targeted by RNAi. Error bars represent standard deviations. **p<0.01, ***p<0.001, ****p<0.0001 (t-test). (E–F) FISH to detect nanos-2 and ago2-1 expression after vlg-3 RNAi (E), and nanos-2 and vlg-3 expression after ago2-1 RNAi (F). In (E), non-specific binding of probes to the Bge cells illustrates the background levels (arrowheads). The expression patterns in control RNAi animals are unchanged. Scale bars are 20 µm.
Figure 6
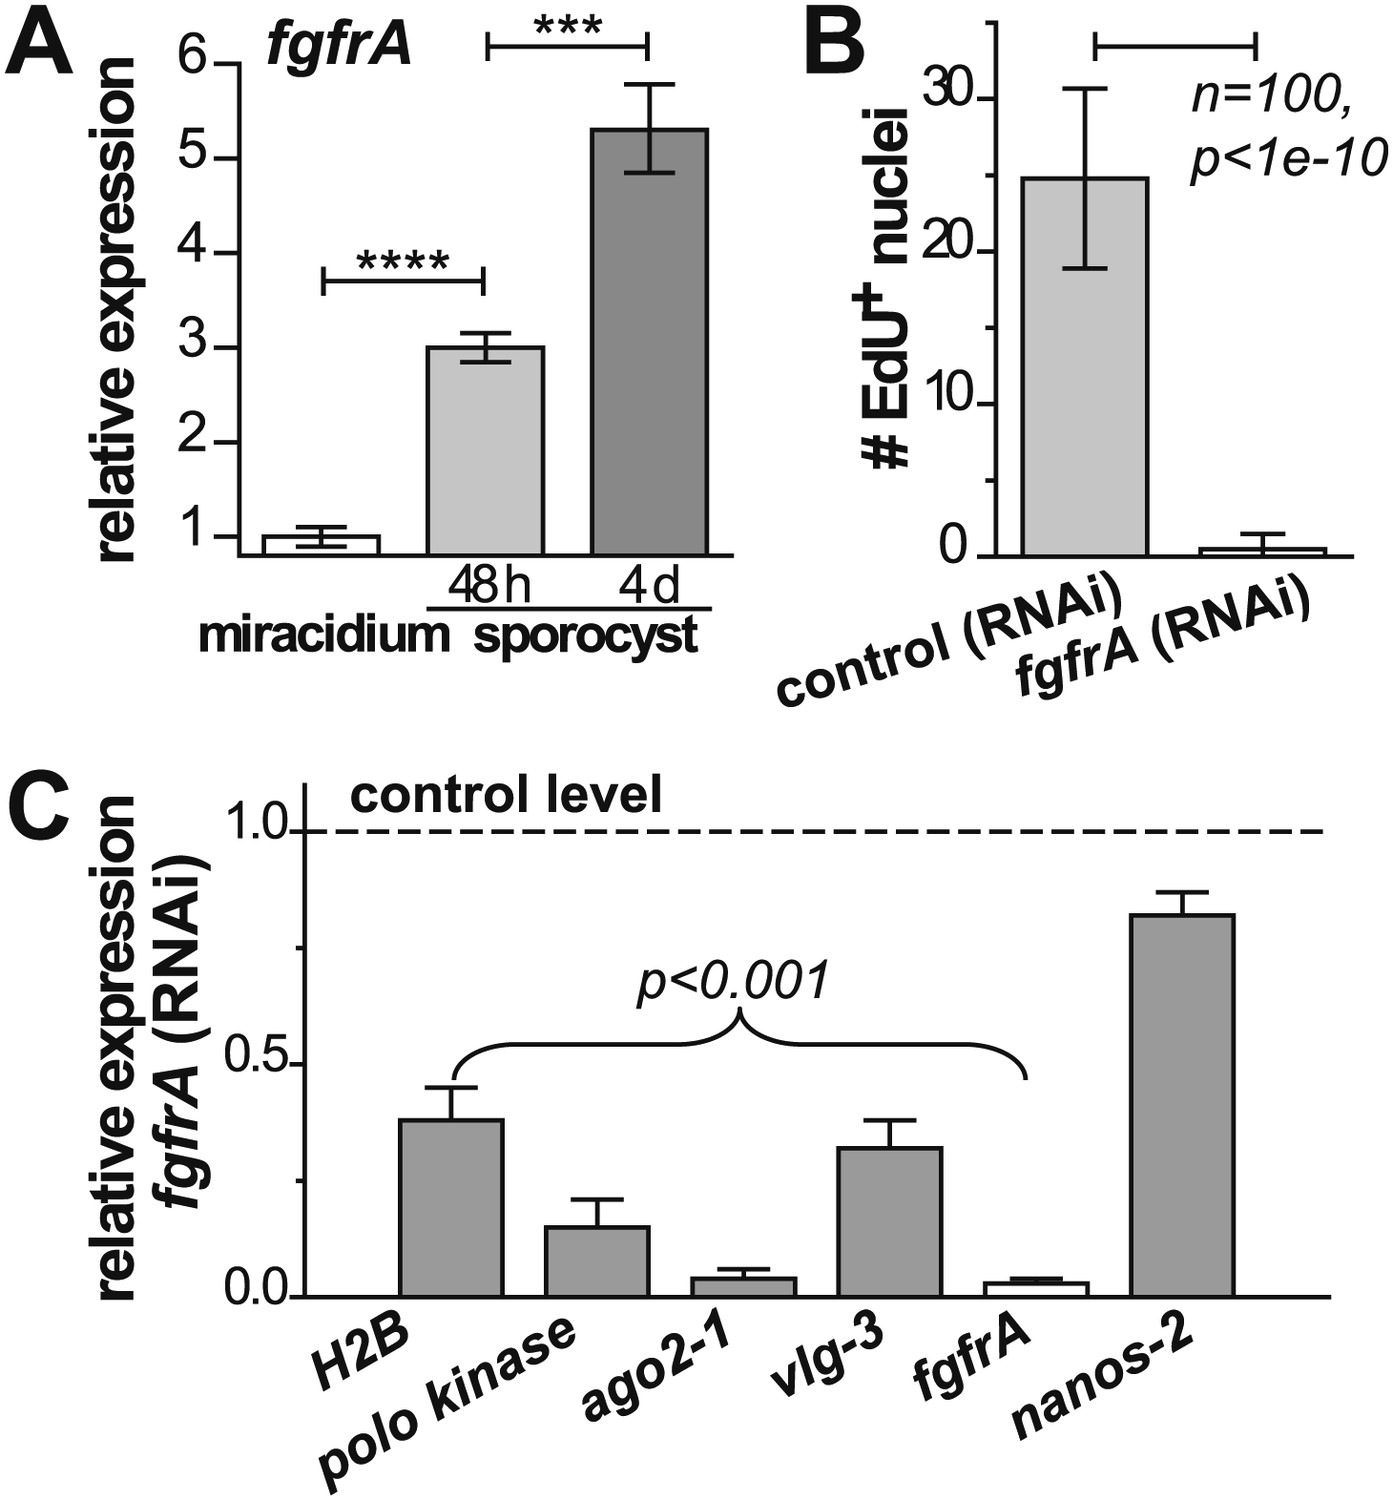
fgfrA is required for germinal cell proliferation.
(A) Relative expression levels of fgfrA during sporocyst development with respect to the expression in miracidia, measured by qPCR. (B) Average number of EdU+ nuclei per sporocyst in control and fgfrA (RNAi) parasites labeled at 20–40 hr post-transformation. (C) Relative gene expression levels measured by qPCR for control and fgfrA (RNAi) sporocysts. The white bar indicates efficient knockdown of fgfrA by RNAi. qPCR experiments were performed in biological triplicate. Error bars are standard deviations. ***p<0.001, ****p<0.0001 (t-test).
Tables
Table 1
Expression in miracidia and sporocysts of schistosome homologs of planarian neoblast-enriched transcripts, measured by RNAseq
| Gene name | RPKM (miracidia) | RPKM (sporocysts) | Fold change |
|---|---|---|---|
| vasa-like (vlg, Smp_068440, 154320, 033710) | 20.6/46.1/272.4 | 98.5/79.2/423.1 | 4.8/1.7/1.6 |
| polo kinase (Smp_009600) | 43.0 | 149.5 | 3.5 |
| fgfr (Smp_175590, 157300) | 3.5/3.0 | 10.2/6.4 | 2.9/2.1 |
| sz12 (Smp_047720) | 5.6 | 16.0 | 2.8 |
| bruli (Smp_041350) | 5.5 | 15.3 | 2.8 |
| Sedt8 (Smp_055310) | 1.9 | 4.8 | 2.6 |
| egr (Smp_094930) | 3.0 | 7.4 | 2.5 |
| cyclin B (Smp_082490) | 79.7 | 194.0 | 2.4 |
| nlk (Smp_074080) | 7.5 | 18.0 | 2.4 |
| ago2-1 (Smp_179320) | 258.9 | 537.5 | 2.1 |
| PCNA (Smp_046500) | 194.0 | 395.0 | 2.0 |
| inx (Smp_141290) | 102.6 | 203.7 | 2.0 |
| ezh (Smp_078900) | 8.1 | 15.5 | 1.9 |
| PHB (Smp_075210, 075940) | 222.0/197.7 | 421.0/290.8 | 1.9/1.5 |
| pp32a (Smp_010940) | 641.7 | 1176.3 | 1.8 |
| H2A (Smp_086860) | 240.3 | 437.1 | 1.8 |
| THOC (Smp_005260) | 219.6 | 397.3 | 1.8 |
| egfr (Smp_093930, 165470) | 6.8/7.0 | 12.1/10.0 | 1.8/1.4 |
| CHD (Smp_158050) | 39.6 | 68.6 | 1.7 |
| tudor-like (Smp_081570) | 222.8 | 367.8 | 1.7 |
| H2B (Smp_108390) | 124.6 | 206.5 | 1.7 |
| ef-tu (Smp_073500) | 151.6 | 243.6 | 1.6 |
| HSP60 (Smp_008545) | 2051.5 | 3224.7 | 1.6 |
| fhl (Smp_048560) | 2.0 | 3.1 | 1.5 |
| eed (Smp_165220) | 32.7 | 46.3 | 1.4 |
| junl (Smp_067520) | 5.5 | 7.7 | 1.4 |
-
Expression of genes in bold is confirmed in this study with qPCR or FISH.
Additional files
-
Supplementary file 1
(A) Transcripts that are upregulated in sporocysts 48 hr post in vitro transformation. (B) Expression of DEAD-box helicases (DBHs). (C) Transcripts that are conserved between planarian neoblast-enriched genes and genes that are upregulated in sporocysts 48 hr post in vitro transformation. (D) Orthologs between sporocyst-enriched genes and planarian neoblast-enriched transcripts. (E) Primers for qPCR. (F) Primers for cloning.
- https://doi.org/10.7554/eLife.00768.012
Download links
A two-part list of links to download the article, or parts of the article, in various formats.
Downloads (link to download the article as PDF)
Open citations (links to open the citations from this article in various online reference manager services)
Cite this article (links to download the citations from this article in formats compatible with various reference manager tools)
Functional genomic characterization of neoblast-like stem cells in larval Schistosoma mansoni
eLife 2:e00768.
https://doi.org/10.7554/eLife.00768


