Fluorescent sensors reporting the activity of ammonium transceptors in live cells
- Carnegie Institution for Science, United States
- Institute of Plant Genetics, Italian National Research Council (CNR-IGV), Italy
- Fraunhofer Institute for Applied Polymer Research, Germany
- Joint BioEnergy Institute, United States
- Institute for Organic Chemistry and Biochemistry, and BIOSS Center for Biological Signalling Studies, University of Freiburg, Germany
- Institute of Chemistry, University of Potsdam, Germany
Figures
Figure 1
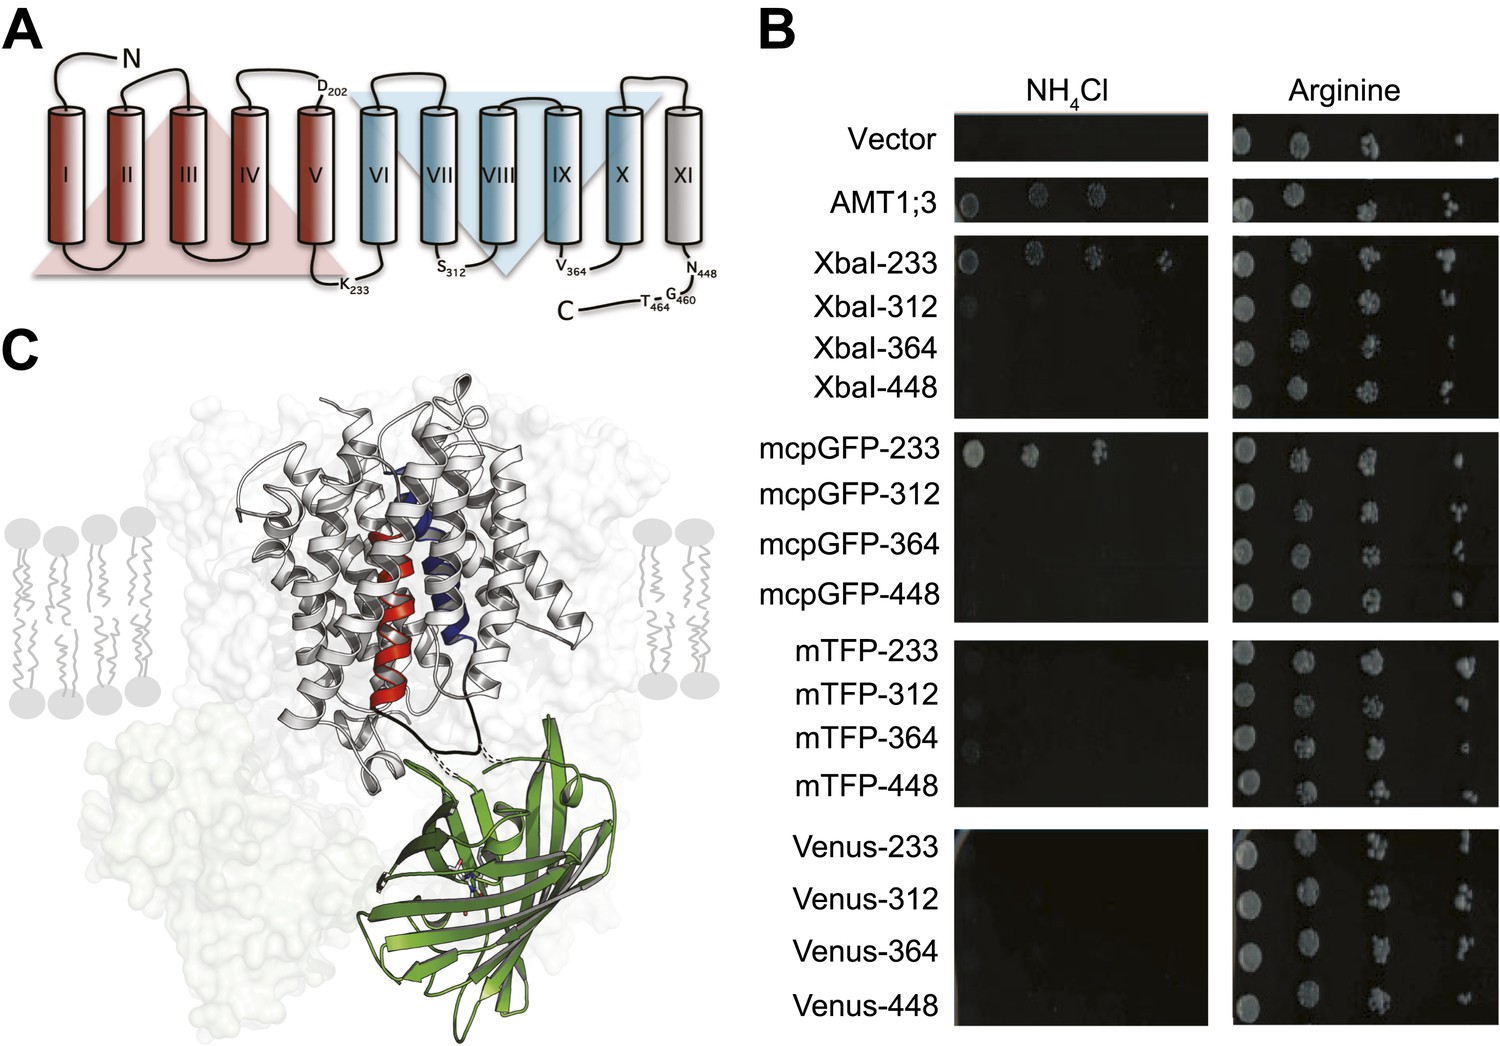
Design of fusion constructs.
(A) Topological representation of AMT1;3 by HMMTOP (Tusnady and Simon, 2001). Eleven TMH are organized in a pseudo-symmetric structure (TMH I-V and TMH VI-X) with an extra terminal TMH-XI that directs the C-terminus to the cytosol. The position of the residues preceding the insertion points of FPs in L5–6, 7–8, 9–10 and in the C-tail are indicated. Residues D202, G460 and T464, important for the activity of the transporter, are also shown. (B) The functionality of the transporters was measured as growth of the yeast Δmep1,2,3 mutant transformed with AMT1;3-FP fusions and grown on solid media containing 2 mM NH4Cl or 1 mM arginine (growth control) as the sole nitrogen source for three days. Numbers indicate the position in AMT1;3 preceding the insertion site. Vector: empty vector served as the negative control. (C) Three-dimensional model of one AMT-mcpGFP chimeric protein based on the crystal structures of Af-AMT1 (2B2H) and cpGFP (3evp). One monomer is shown in cartoon and the rest of the trimeric complex is represented as a shaded surface in the background. mcpGFP (green) was inserted in position 233 of L5–6 of AMT1;3, connecting TMH-V and -VI (red and blue, respectively).
Figure 2
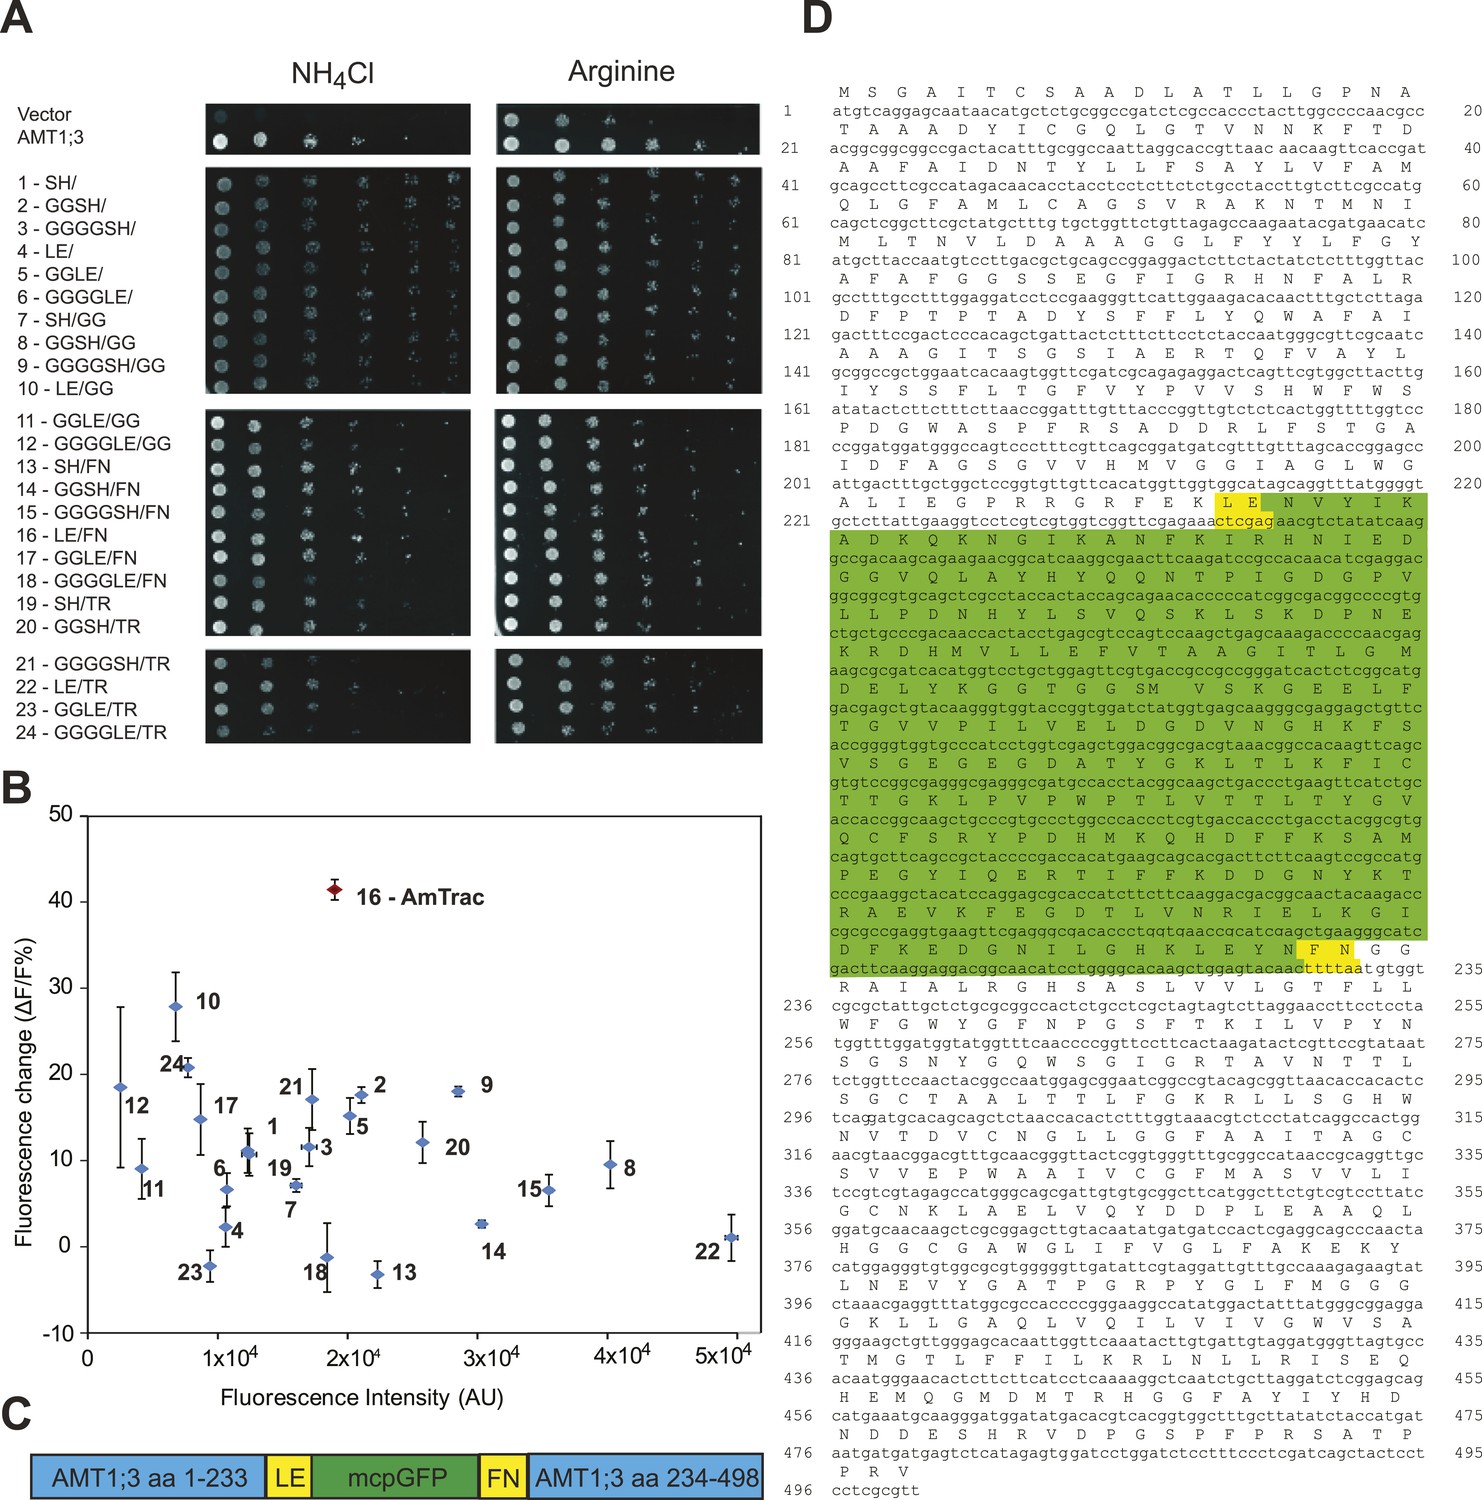
Development of AmTrac.
(A) Growth of the yeast Δmep1,2,3 mutant transformed with fusion variants on solid media containing 2 mM NH4Cl or 1 mM arginine (growth control) as the sole nitrogen source for 3 days. Composition of linkers connecting AMT1;3 and mcpGFP are indicated. Linkers at the N- and C-termini of mcpGFP are indicated in letter code and separated by a slash. In the cases of variants 1–6, no linkers were inserted between the C-terminal sequence of mcpGFP and the second part of AMT1;3. (B) Screen of 24 linker variants for fluorescence intensity before addition of ammonium and fluorescence intensity change after addition of 1 mM NH4Cl (mean ± SE; n = 3). Variant 16 (in red), carrying LE/FN as linkers, named AmTrac, showed the highest change in fluorescence intensity. (C) Schematic representation of AmTrac. Linkers between AMT1;3 and mcpGFP are indicated in yellow. (D) Protein sequence of AmTrac. Residues in ‘yellow’ constitute synthetic linker segments. Residues in ‘green’ correspond to the mcpGFP moiety. Numbers indicate amino acid position in AMT1;3.
Figure 3
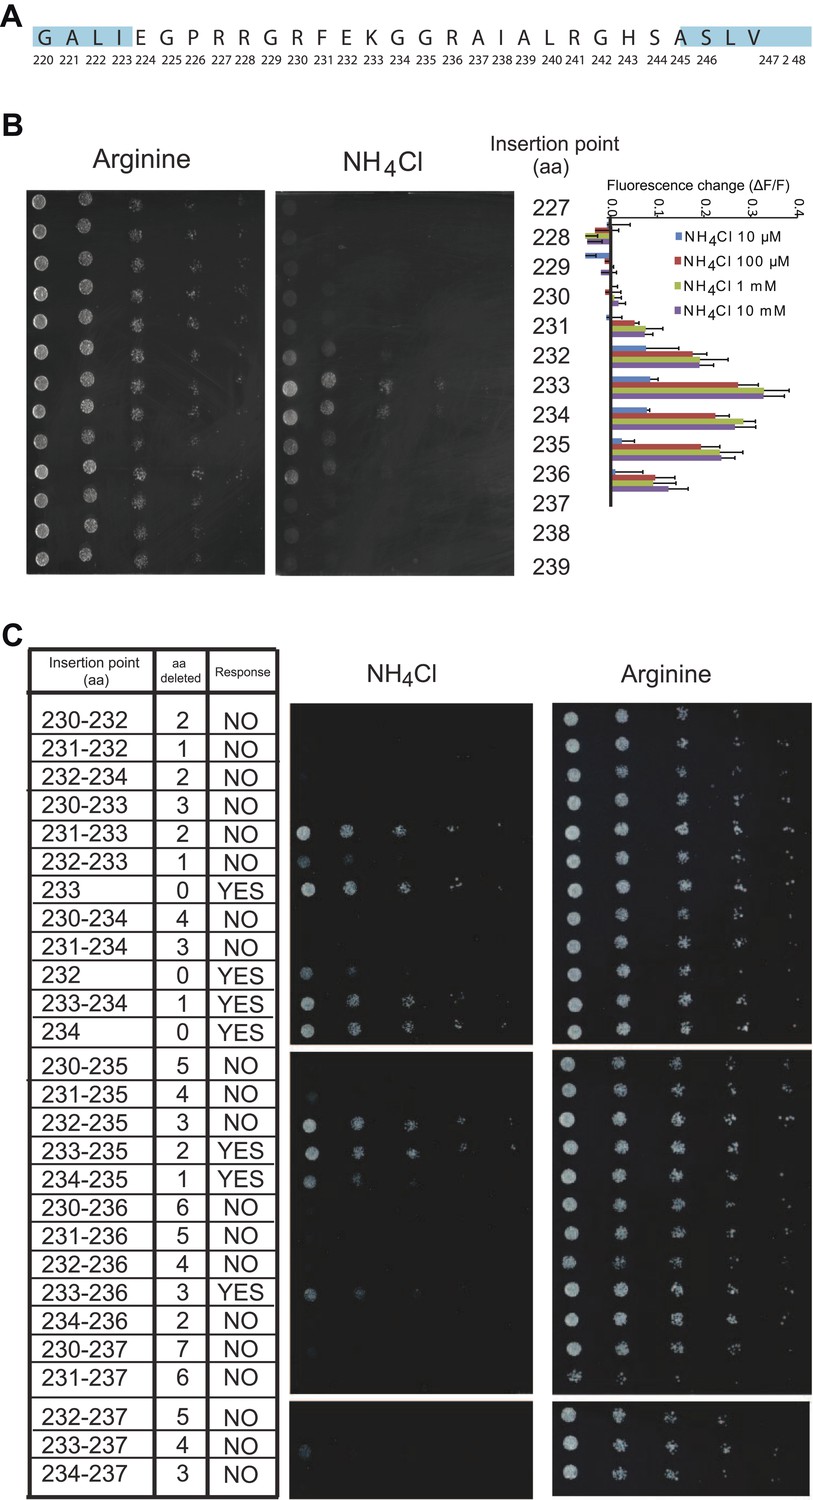
Effect of L5 on transport and fluorescence response.
(A) Amino acid sequence of the L5–6 region of AMT1;3. Residues in ‘blue’ correspond to TMH 5 (left) and TMH 6 (right). (B) Influence of the insertion position of mcpGFP into L5 on transport activity and fluorescence response. Left panels show the growth assay of the yeast Δmep1,2,3 strain transformed with insertion variants on solid media containing 2 mM NH4Cl or 1 mM arginine (growth control) as the sole nitrogen source for 3 days. Numbers indicate the insertion site within AMT1;3 (residue preceding the point of insertion of mcpGFP). Right graph shows the fluorescence response of the variants to addition of the indicated concentrations of NH4Cl. Data were normalized to the water-treated control (0; mean ± SE; n = 2). (C) Growth and response of AmTrac variants with deletions in L5–6. Growth was analyzed as described in Figure 2A. Numbers in the left column indicate the position of the insertion in AMT1;3; two numbers indicate residues preceding and following the mcpGFP insertion. Right column named “Response” indicates whether the corresponding variant responded to addition of 1 mM NH4Cl with a fluorescence change. The original AmTrac corresponds to insertion after aa 233.
Figure 4
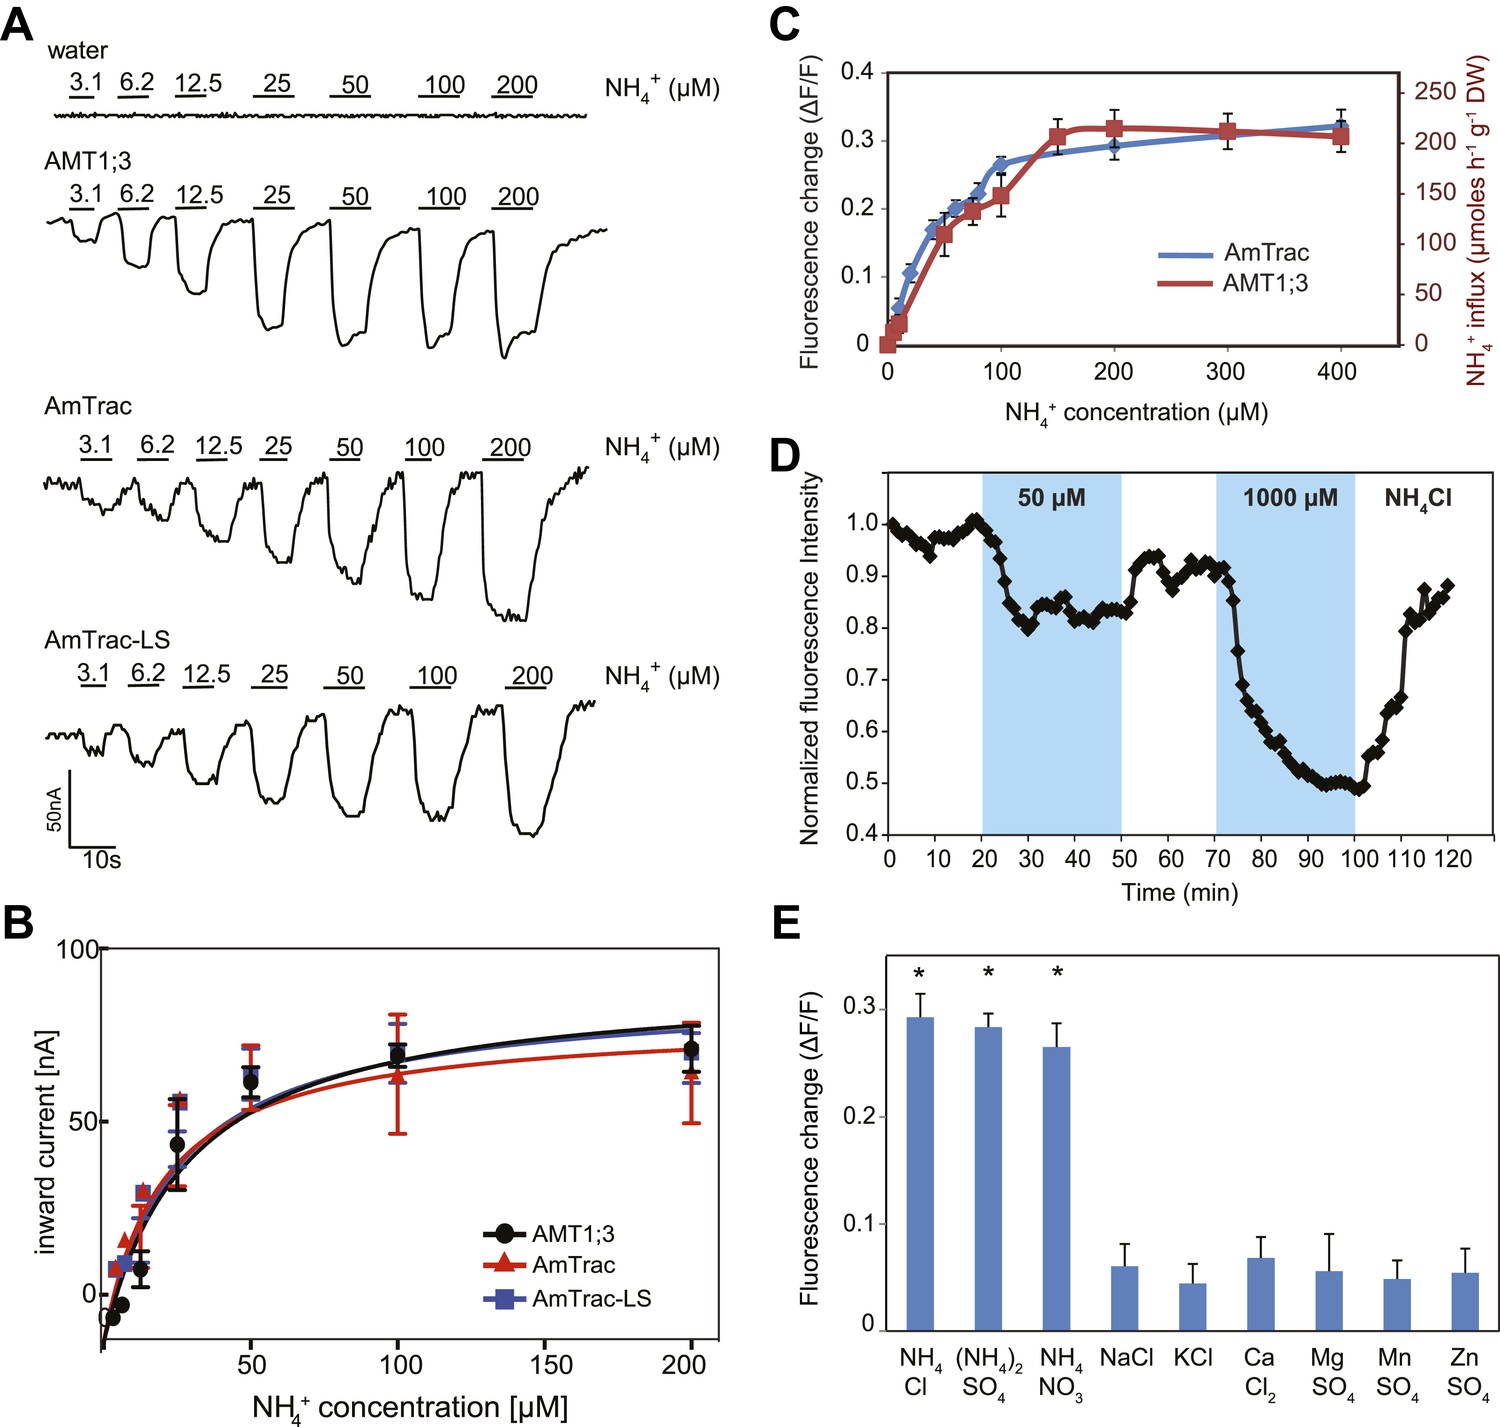
Characterization of AmTrac transport and responses.
(A) Currents recorded in single oocytes injected with water, AMT1;3, AmTrac, or AmTrac-LS, and perfused with NH4Cl at the indicated concentrations. (B) Kinetics of NH4+-induced currents of AMT1;3, AmTrac, and AmTrac-LS. The Kms were 55 ± 15 μM, 51 ± 24 μM, and 57 ± 19 μM, respectively. The data were fitted to Michaelis–Menten kinetics. Oocytes were clamped at −120 mV (independent data from three different oocytes recorded from three different frogs). (C) Titration of the fluorescence response of AmTrac in yeast (blue, left y-axis) and of ammonium uptake of AMT1;3 in plants (red, right y-axis; Yuan et al., 2007). Data are normalized to water-treated controls (0) (mean ± SE; n = 3). (D) Response of a single yeast cell expressing AmTrac to pulses of NH4Cl at the indicated concentrations (blue frames). (E) Substrate specificity. Yeast cells expressing the sensor were treated with the indicated salts at 1 mM concentration. Data are normalized to water-treated control (0) (mean ± SE; n = 3). Only data for the ammonium treatments were significantly different from control (SNK test: *p<0.01).
Figure 5
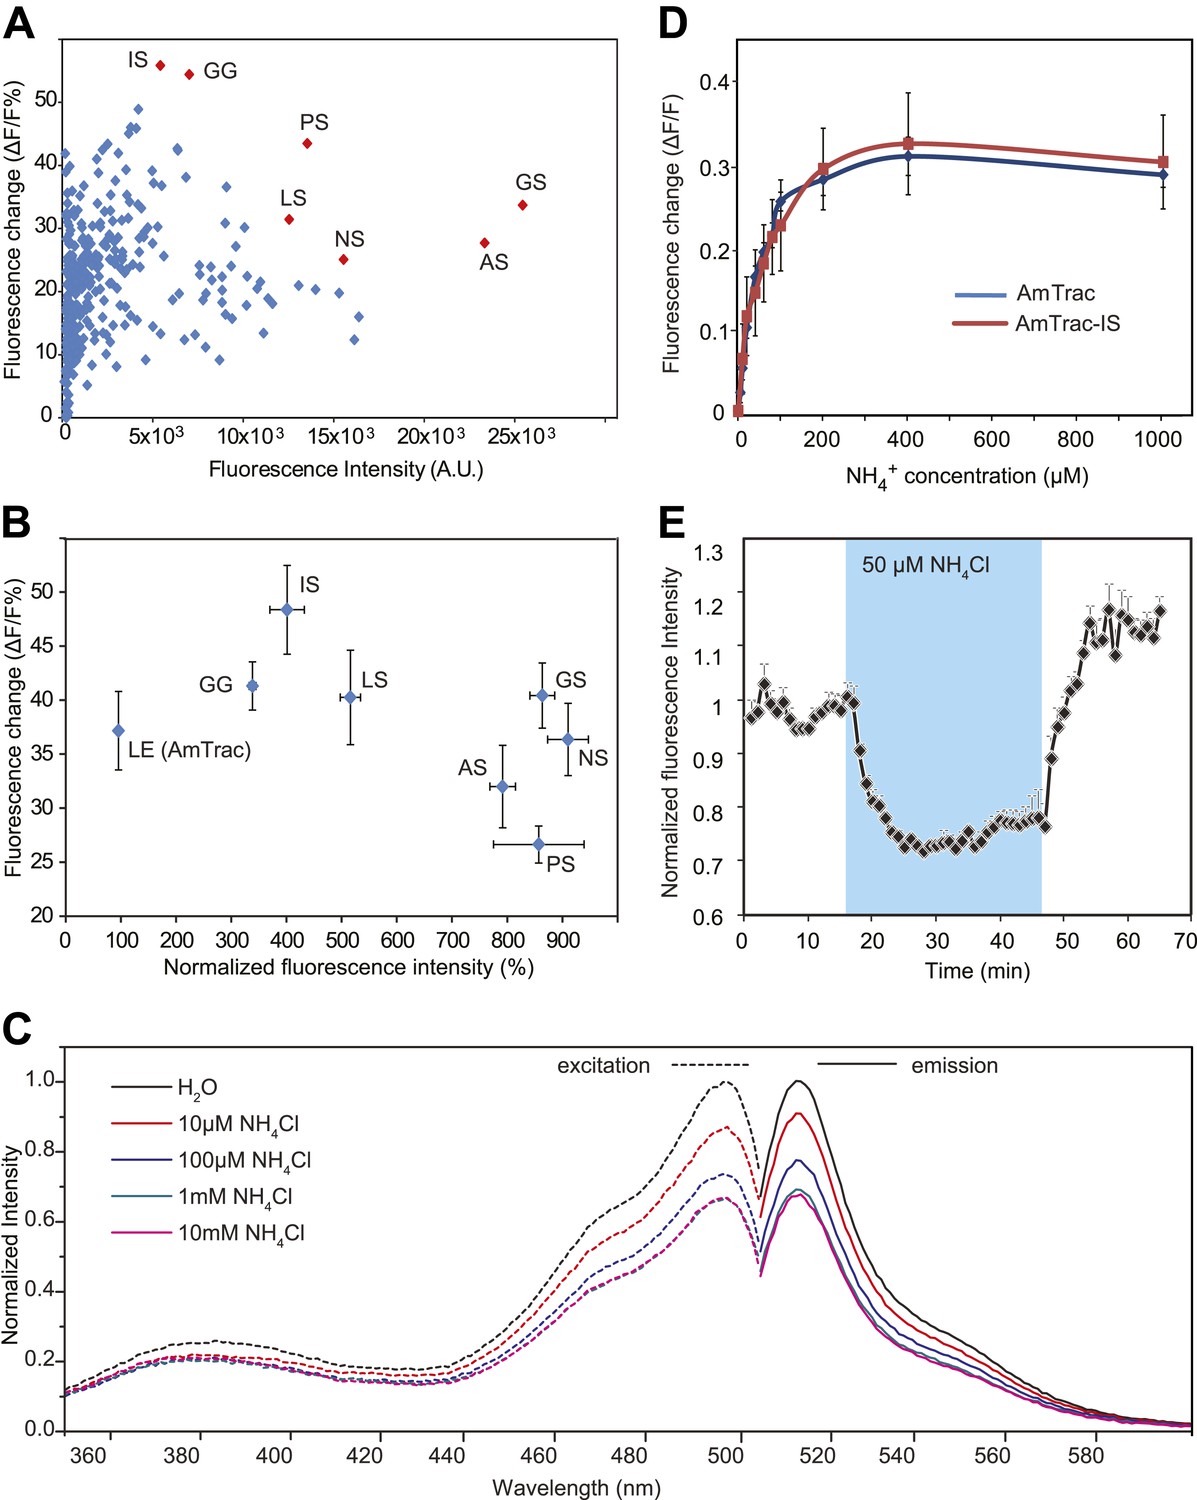
Development of improved variants of AmTrac.
(A) Screen for improved sensor variants. Fluorescence intensity and fluorescence response of ∼350 random variants of the C-terminal linker of mcpGFP to addition of 1 mM NH4Cl. The brightest and most responsive variants (in red) were sequenced and composition of the linker (LE in AmTrac) is reported as letter code. Note that most variants carry a Ser residue in the last position of the linker. (B) Fluorescence intensity and fluorescence response after addition of 1 mM NH4Cl, normalized to values of AmTrac (100%) of yeast expressing the best variants identified in (A) (mean ± SE; n = 3). (C) Steady-state fluorescence spectra of AmTrac-LS recorded at λexc 485 nm and λem 514 nm, respectively, with addition of NH4Cl at the indicated concentrations, or water (as control). Fluorescence intensities were normalized to the major peak of the water control (=1). (D) Titration of the fluorescent response of AmTrac (blue line) and AmTrac-IS (red line). Data are normalized to water-treated controls (0; mean ± SE: n = 3). AmTrac kinetics shown here for comparison are the same as Figure 4C.(E) Single cell response of AmTrac-LS. Individual cells trapped in a microfluidic plate were perfused with 50 mM MES buffer pH 6.0, or a pulse of 50 µM NH4Cl in buffer (blue box). Data were normalized to the initial value (mean ± SE; n =3).
Figure 6
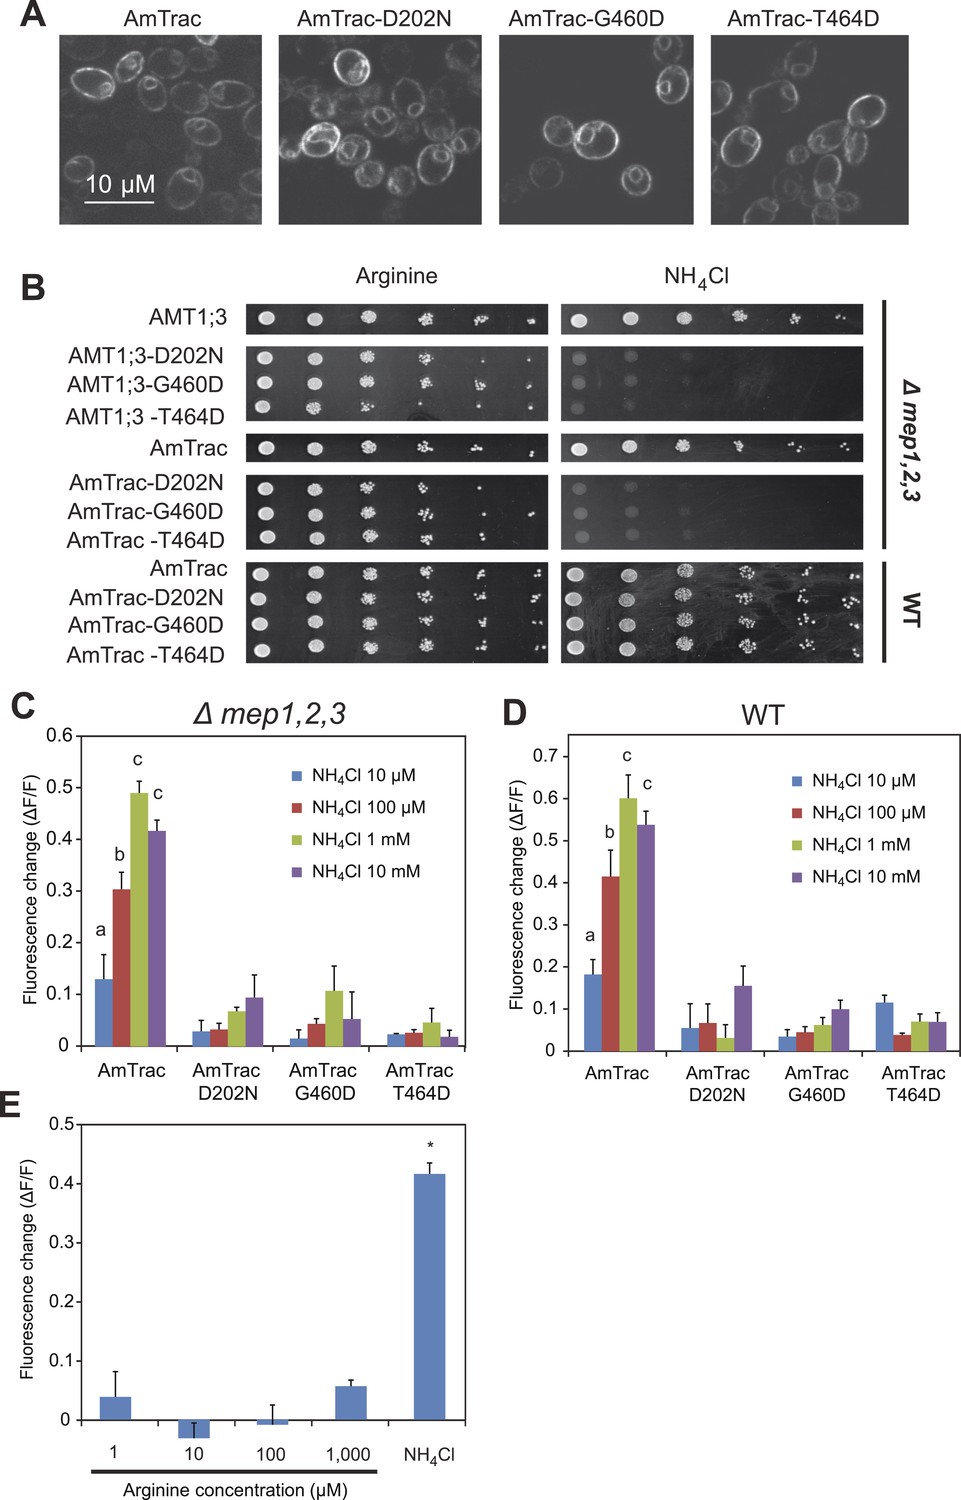
AmTrac mutant analysis.
(A) Confocal z-section of yeast expressing AmTrac or its inactive variants carrying mutations D202N, G460D or T464D. Bar 10 µm. (B) Growth complementation of the Δmep1,2,3 or wt yeast expressing AmTrac or its inactive variants on solid media containing 2 mM NH4Cl or 1 mM arginine (growth control) as sole nitrogen source for 3 days. Endogenous MEPs in wt strain are not affected by expression of mutant variants. (C) Fluorescence response of Δmep1,2,3 or (D) wt yeast expressing AmTrac or the transport-inactive variants D202N, G460D or T464D. Data were normalized to water-treated controls (0) (mean ± SE; n = 3). Only yeast cells expressing AmTrac showed significantly different responses (SNK test: p<0.01). (E) Response of AmTrac to addition of arginine. Fluorescence response of Δmep1,2,3 yeast cells expressing AmTrac treated with the indicated concentrations of arginine or 1 mM NH4Cl. Data were normalized to water-treated controls (0) (mean ± SE; n = 3). Only the ammonium treatment was significantly different from control (SNK test: *p<0.01). Note that arginine addition to yeast cells has been shown to lead to increased cytosolic levels of ammonium (Marini et al., 1994).
Figure 7
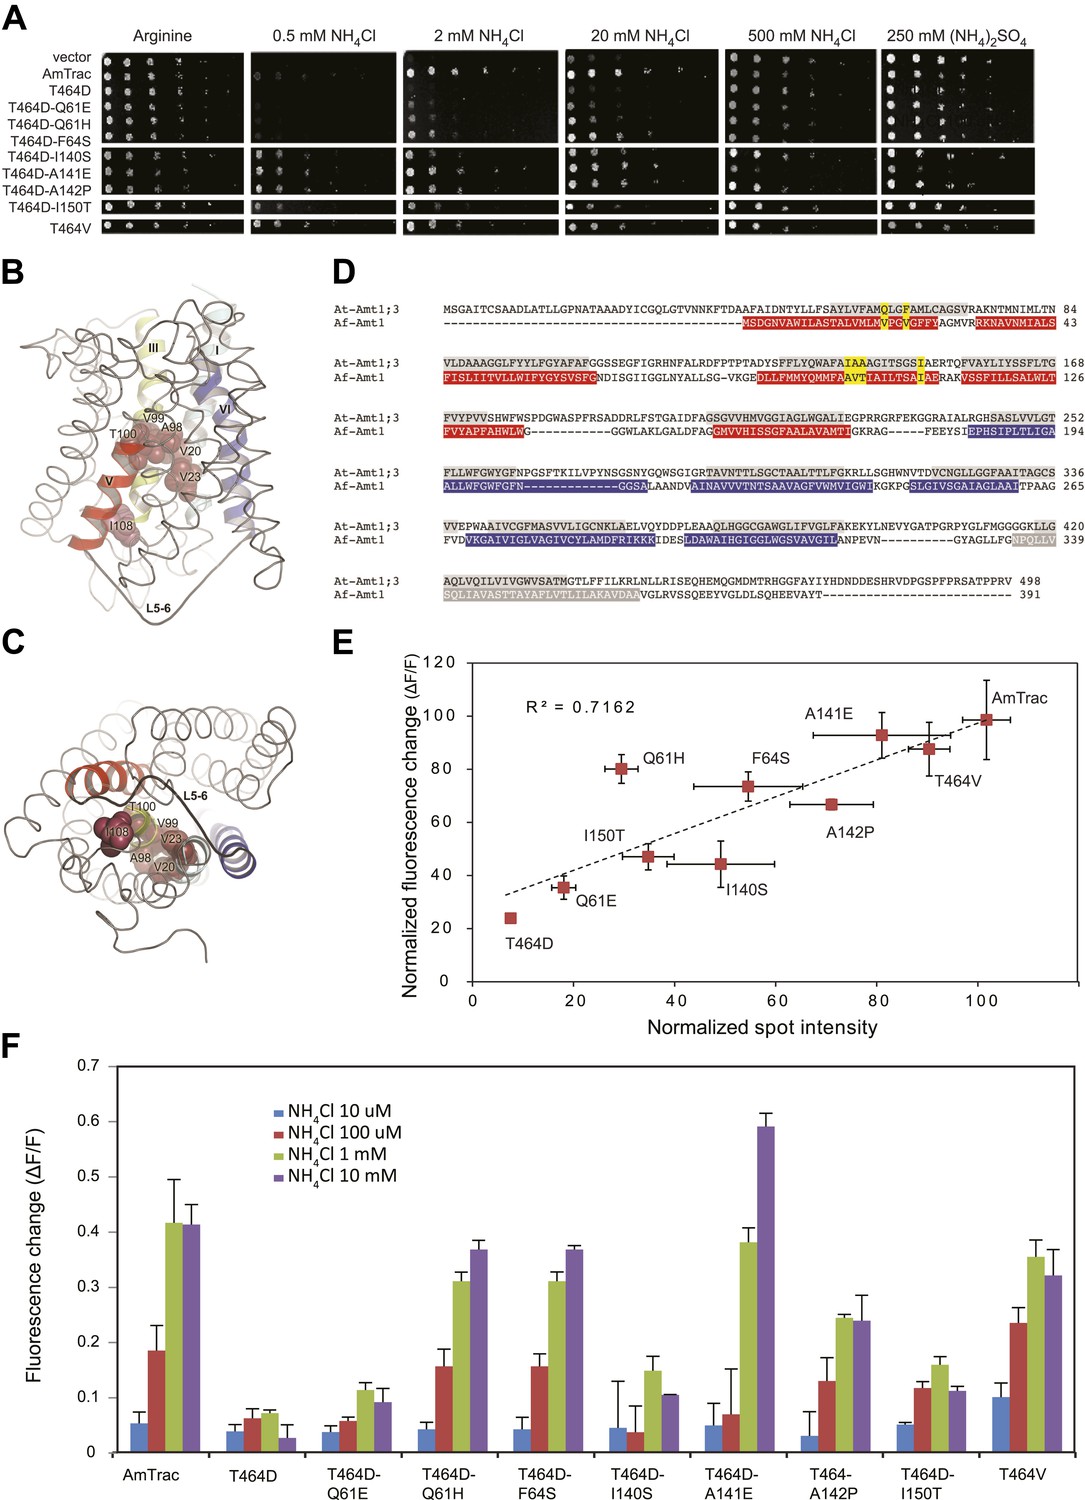
Suppressor mutants restore transport and fluorescence response.
(A) Growth of the yeast Δmep1,2,3 strain transformed with suppressor mutants and grown on solid media containing the indicated concentrations of NH4Cl, (NH4)2SO4 (as anion control) or 1 mM arginine (growth control) as the sole nitrogen source for 3 days. Note that yeast expressing AmTrac-T464D-A141E grew poorly at high concentrations of ammonium, suggesting high capacity transport activity leading to ammonium toxicity. (B) Lateral view and (C) cytoplasmic side view of AfAmt1 according to the crystal structure (Andrade et al., 2005). The corresponding residues in AfAmt1 that suppress the T464D mutation in AmTrac are indicated by spheres. TMH-V is shown as red helix, TMH-VI in blue. The connecting L5–6 is labeled. Note that residues corresponding to cis-suppressing mutations reside in the internal pore region. (D) Sequence alignment of AMT1;3 from Arabidopsis (At-Amt1;3) and Af-Amt1 from A. fulgidus. The residues belonging to TMH domains of the two pseudo-symmetric halves of AfAMT1 are shown in red and blue.C-terminal TMH-XI of AfAMT1 is shown in grey, with white font. Predicted TMHs of AMT1;3 are highlighted in grey, with black font. The corresponding residues identified in the suppressor screen of AmTrac-T464D are indicated in both sequences (yellow). (E) Correlation between transport efficiency (growth in 2 mM NH4Cl) and fluorescence change after addition of 1 mM NH4Cl of the suppressor mutants. Data are normalized to values obtained for AmTrac (=100) (mean ± SD; n = 3). (F) Fluorescence response of suppressors to addition of the indicated concentrations of NH4Cl. Data were normalized to water-treated controls (0) (mean ± SE; n = 3).
Figure 8
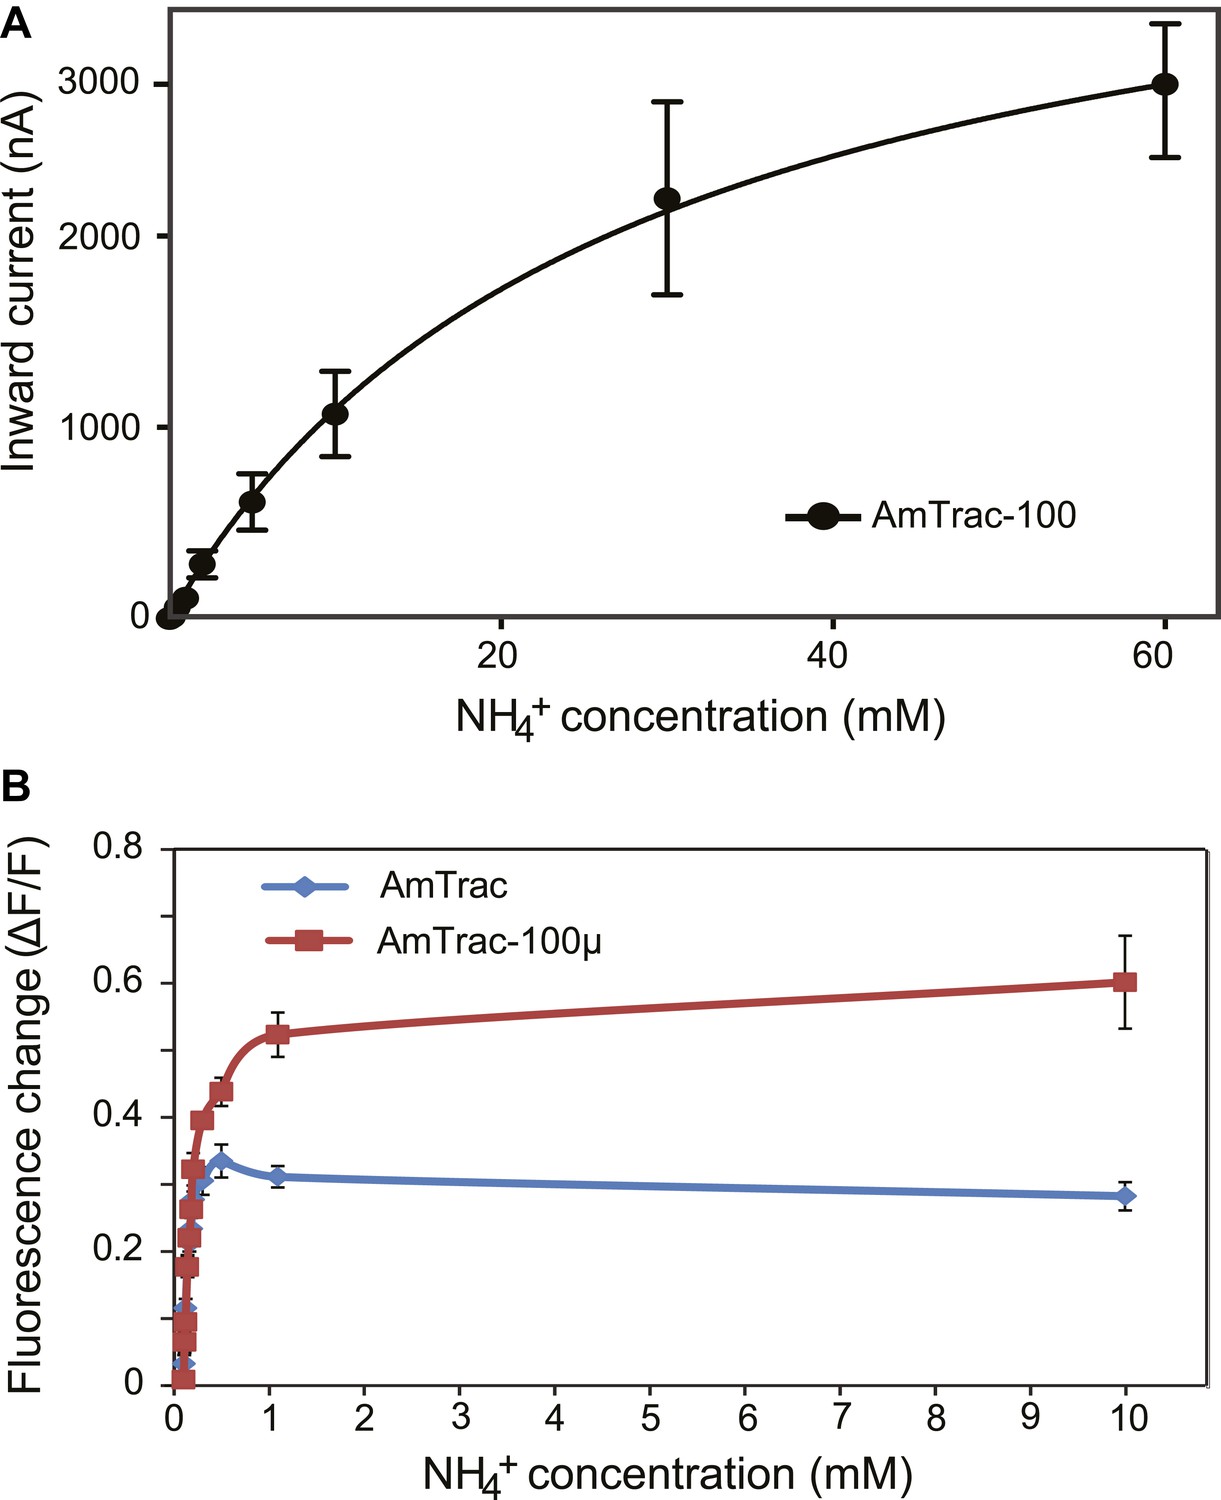
Characterization of a high capacity sensor variant.
(A) Kinetics of NH4+-induced currents of AmTrac-100. The Km was 3.4 ± 0.56 mM. The data were fitted to Michaelis–Menten kinetics. Oocytes were clamped at −120 mV (independent data from three different oocytes recorded from three different frogs). (B) Titration of the fluorescent response of AmTrac (blue line) and AmTrac-100µ (red line). Data are normalized to water-treated controls (0; mean ± SE: n = 3).AmTrac kinetics shown here for comparison are the same as Figure 4C and Figure 5D.
Figure 9
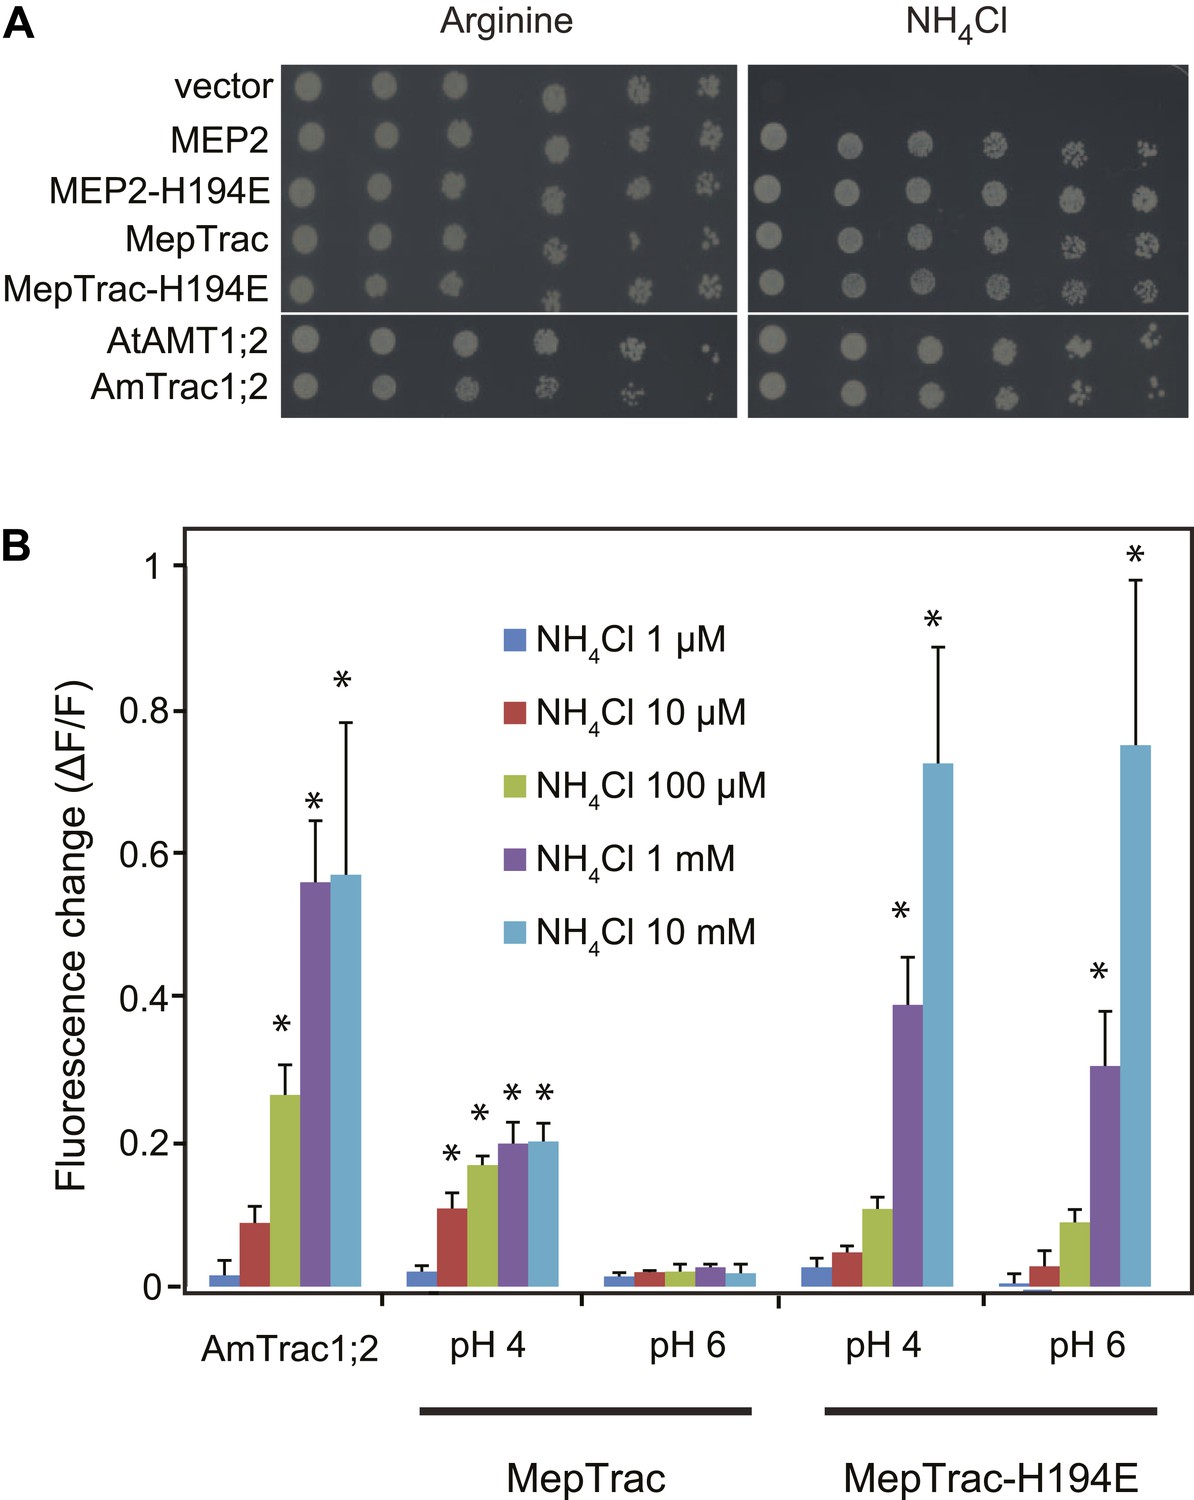
AmTrac1;2 and MepTrac response.
(A) Growth complementation of Δmep1,2,3 yeast expressing MEP2, MepTrac, their H194E mutants or AmTrac1;2 on solid media containing 2 mM NH4Cl or 1 mM arginine (growth control) as sole nitrogen source for 3 days. (B) Fluorescence response of Δmep1,2,3 yeast expressing AmTrac1;2, MepTrac or MepTrac-H194E to NH4Cl at the indicated concentrations at pH 4 or 6. AmTrac1;2 was tested at pH 6. Data are normalized to water-treated control (0) (mean ± SE; n = 3; SNK test: *p<0.01).
Tables
Table 1
List of suppressor mutations, their location and frequency
| Mutation | Location | # | % |
|---|---|---|---|
| Q61E | TM 1 | 3 | 5 |
| Q61H | TM 1 | 5 | 9 |
| F64S | TM 1 | 3 | 5 |
| I140S | TM 3 | 1 | 2 |
| A141E | TM 3 | 26 | 46 |
| A142P | TM 3 | 13 | 23 |
| I150T | TM 3 | 2 | 4 |
| D464V | C-tail | 3 | 5 |
| Total | 56 | 100 |
Additional files
-
Supplementary file 1
Primers used for AmTrac and MepTrac cloning.
- https://doi.org/10.7554/eLife.00800.013
Download links
A two-part list of links to download the article, or parts of the article, in various formats.
Downloads (link to download the article as PDF)
Open citations (links to open the citations from this article in various online reference manager services)
Cite this article (links to download the citations from this article in formats compatible with various reference manager tools)
Fluorescent sensors reporting the activity of ammonium transceptors in live cells
eLife 2:e00800.
https://doi.org/10.7554/eLife.00800


