Crystal structures of the CPAP/STIL complex reveal its role in centriole assembly and human microcephaly
- University of Oxford, United Kingdom
- Ludwig Institute for Cancer Research, University of California, San Diego, United States
- Medical Research Council, United Kingdom
Figures
Figure 1 with 5 supplements
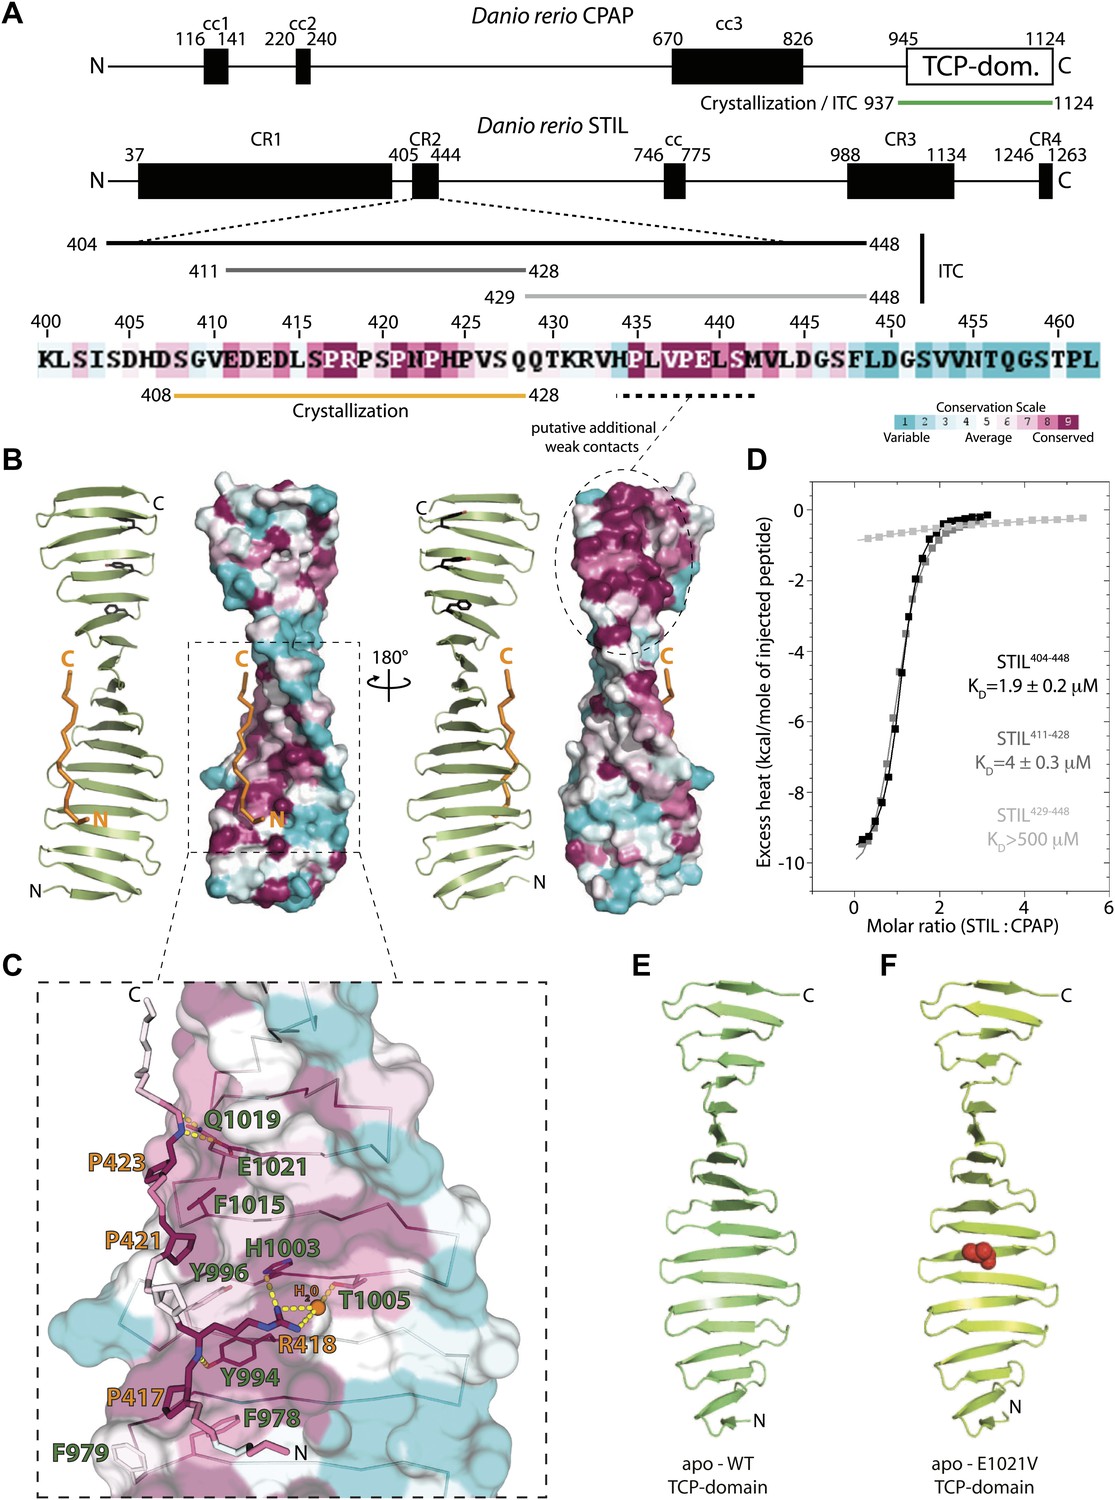
Biochemical and structural characterisation of the CPAP TCP domain and its interaction with STIL.
(A) Schematic representation of D. rerio CPAP and STIL. CPAP is a 1124 amino acid (aa) protein with three predicted coiled coil (cc) domains and a C-terminal TCP domain. STIL is a 1263 aa protein with one predicted cc domain and several conserved regions (CR). The proline-rich CR2 domain is enlarged and coloured according to Consurf conservation scores (Glaser et al., 2003) from cyan (variable) to burgundy (conserved). The constructs used in this study are indicated by bars. (B) Two views of the TCP domain structure (green) in complex with the STIL peptide (orange), rotated by 180°. Images on the left of each view show a ribbon representation and images on the right show the TCP domain as a molecular surface coloured according to Consurf conservation scores. Note the presence of a conserved patch (dashed circle) along the edge of the TCP domain where the STIL peptide is bound. This patch contains aromatic residues (black sticks) that would be well placed to interact with conserved prolines in the C-terminal part of the STIL CR2 region that we had to omit for crystallisation. ITC experiments (Figure 1D) suggest that these putative additional contacts would only contribute weakly to overall binding. (C) Detailed view of the D. rerio CPAP–STIL interaction interface coloured according to Consurf conservation scores. Interface residues are shown in sticks, and the TCP domain is shown as a semi-transparent molecular surface. Contact residues are labelled in green (CPAP) and orange (STIL). Dotted yellow lines indicate hydrogen-bonds. The dark orange sphere represents a bound water molecule. (D) ITC analysis using the STIL constructs shown in Figure 1A. The excess heat measured on titrating STIL into CPAP at 25°C was fitted to a single set of binding sites model. Fitted KD values are indicated together with their standard deviations. (E and F) Ribbon models of the apo-structures of the D. rerio CPAP TCP domain: (E) WT apo-structure; (F) E1021V (MCPH mutation) apo-structure (V1021 represented as red spheres).
Figure 1—figure supplement 1
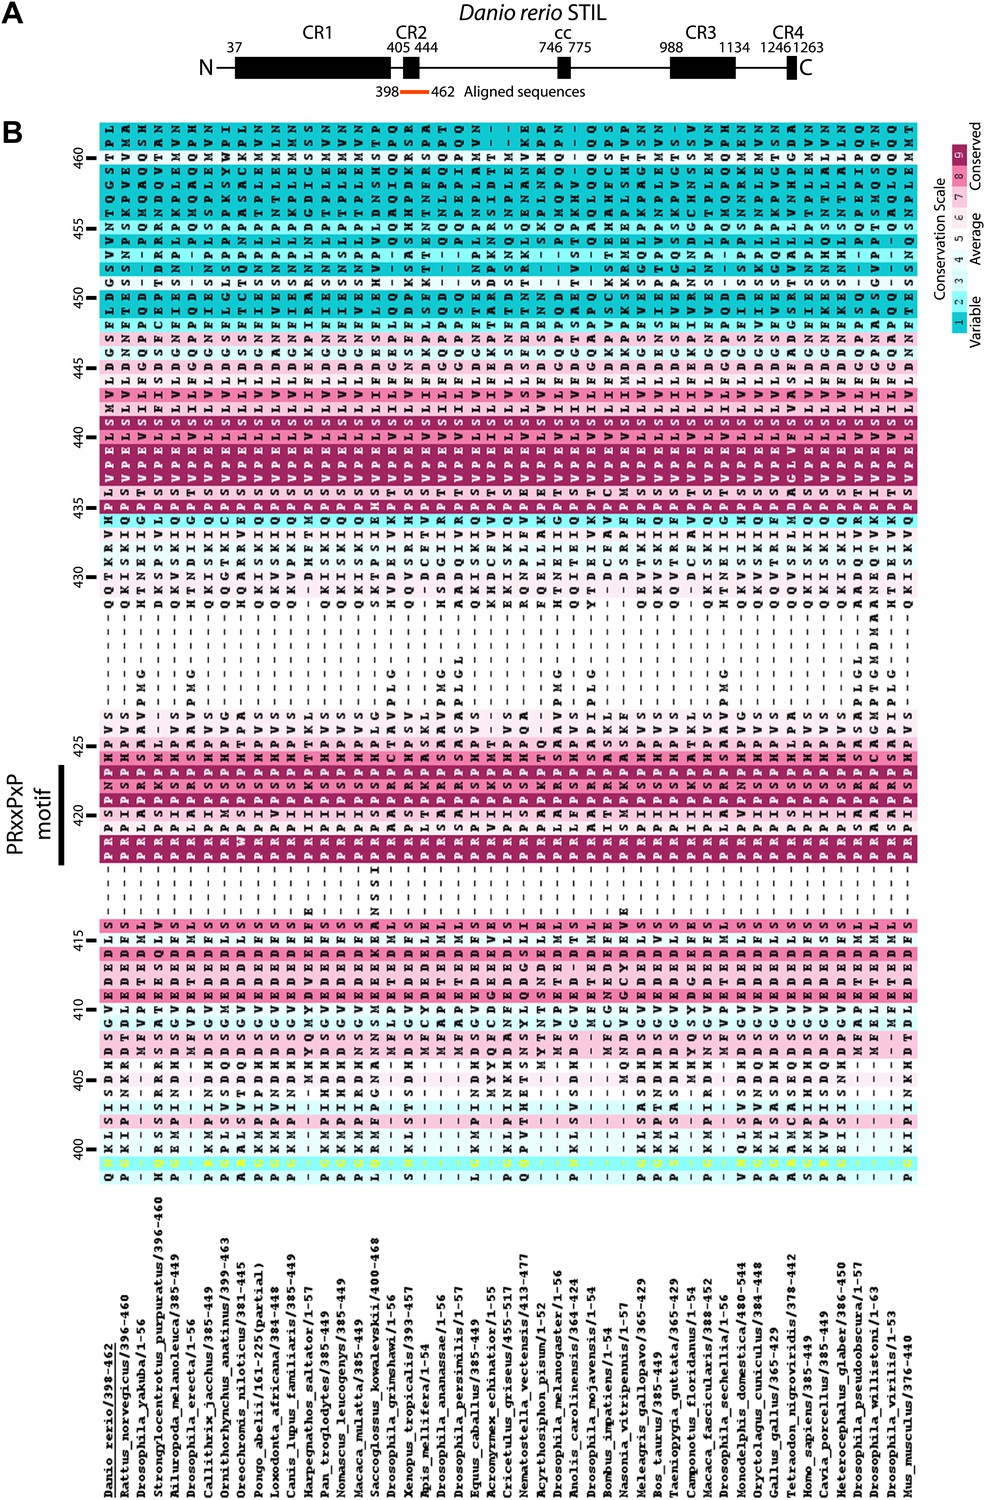
Multiple sequence alignment of the conserved proline-rich region of STIL (CR2).
The numbering refers to D. rerio STIL. The alignment is coloured by conservation according to the Consurf conservation score from cyan (variable) to burgundy (conserved).
Figure 1—figure supplement 2
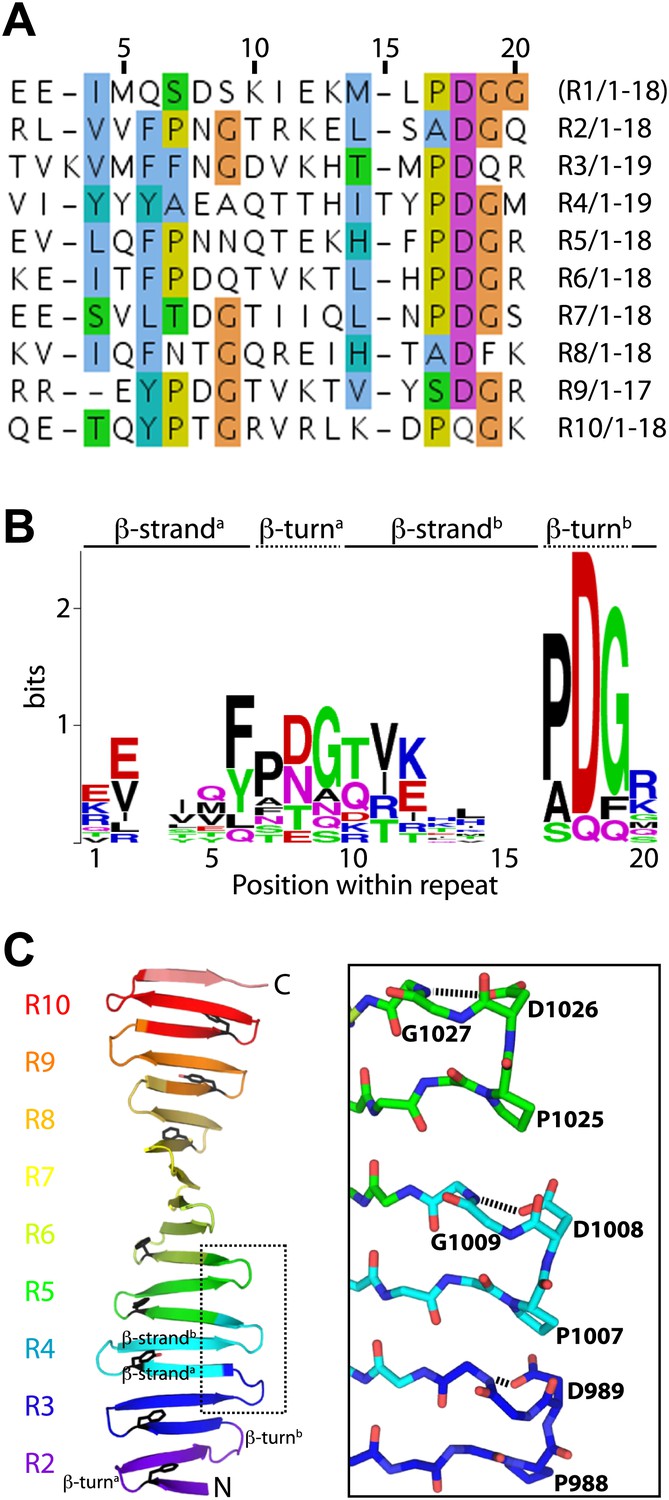
The TCP domain sequence repeats.
(A) Alignment of the sequence repeats of D. rerio CPAP937–1124. Residues are coloured according to the Clustalx colour scheme. R, Repeat. Repeat 1 was not visible in the electron density map of D. rerio apo-CPAP937–1124 but could be seen partially in the structure of the complex between D. rerio CPAP937–1124 and STIL408–428. (B) Sequence logo of the CPAP937–1124 repeat with the relative residue frequencies at each position. Prominent features of this repeat are two PDG motifs and the high frequency of aromatic residues adjacent to the first PDG motif in position 6 of the repeat. (C) Left: ribbon presentation of the D. rerio apo CPAP937–1124 structure with its sequence repeats rainbow-coloured from N- to C-terminus. R, Repeat. An individual structural repeat consists of a β-hairpin. The aromatic residues found in position 6 of the repeat are shown in black sticks. These aromatic residues run along the edge of one side of the β-sheet, where the proline-rich STIL peptide binds. The PDG motifs frequently constitute the β-turns of the TCP repeats. Boxed are three of these turns that are presented on the right as a close-up. In this close-up, residues of the PDG motif are labelled and shown in sticks. The Asp residue in this motif hydrogen-bonds (dotted black lines) to the main-chain of the (n) + 1 neighbouring residue.
Figure 1—figure supplement 3
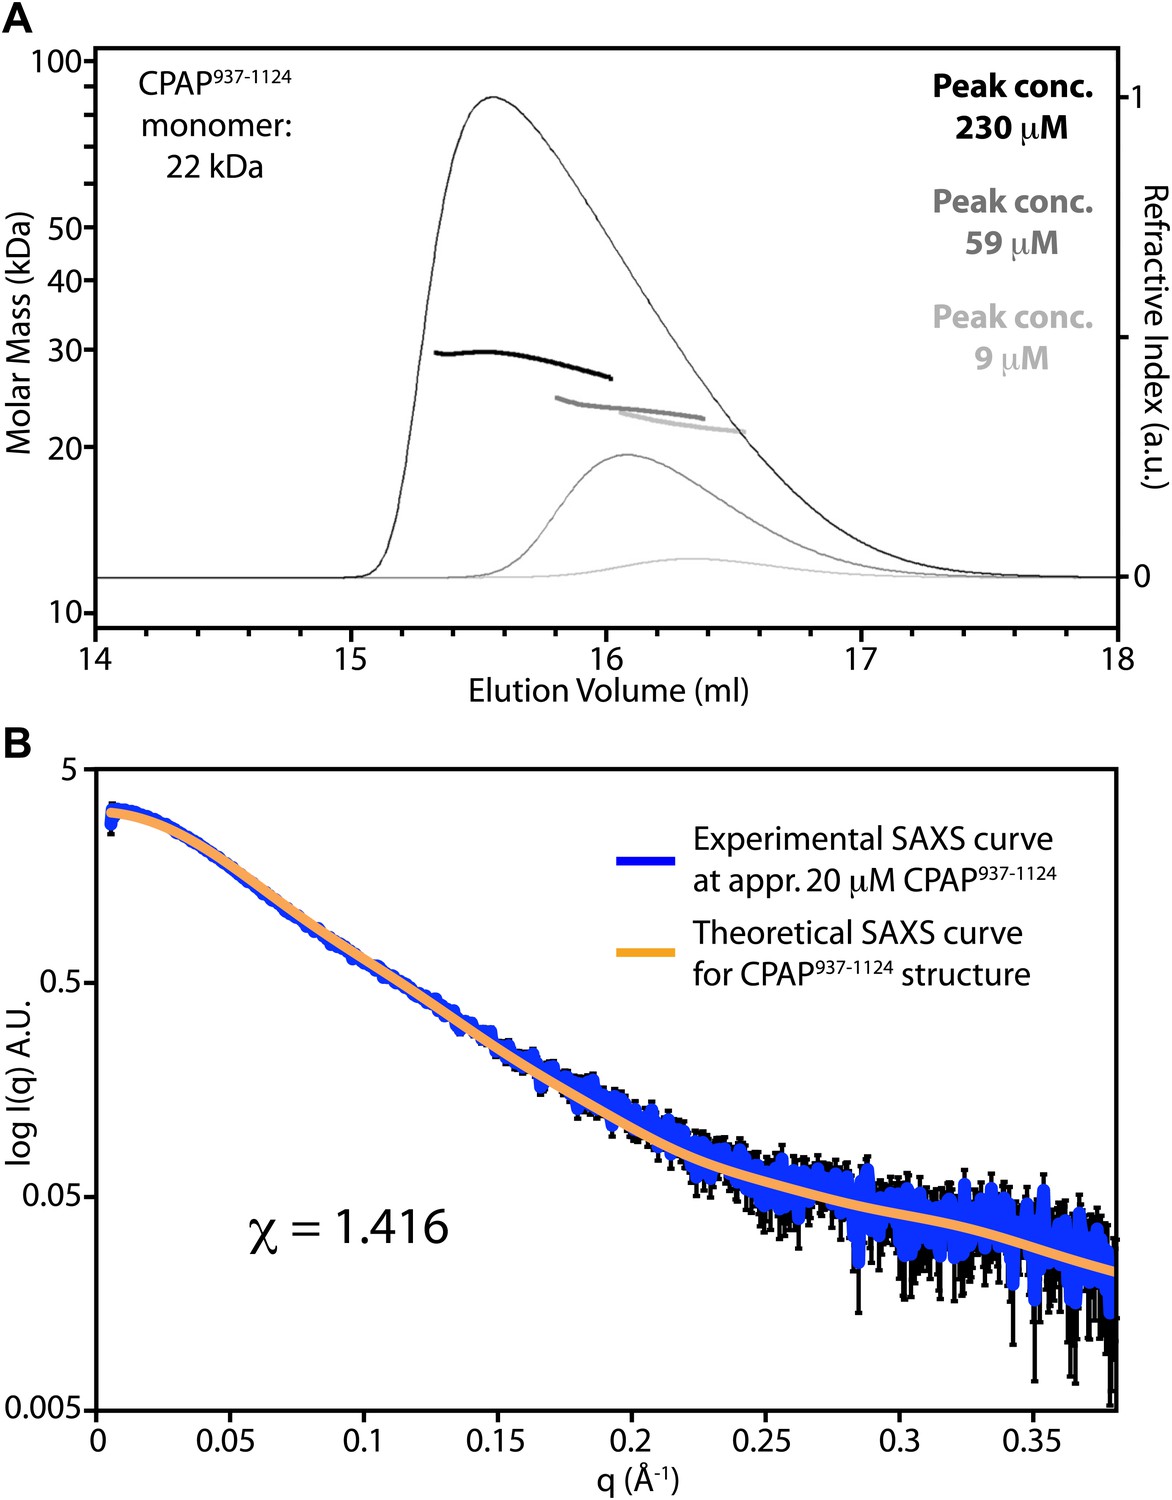
The TCP domain of CPAP is predominantly monomeric in solution.
(A) Panel showing size exclusion chromatography coupled to multi-angle light scattering (SEC-MALS) chromatograms. CPAP937–1124 was injected at concentrations of approximately 70 μM (light grey), 460 μM (dark grey) and 2.4 mM (black). The corresponding chromatogram traces (thin lines) show the refractive index signal. The concentrations of the CPAP937–1124 monomer measured at the peaks are indicated, and heavy solid lines across the peaks show the calculated molar masses. When averaged across the central 50% of the peaks, these molar masses were 22 kDa, 23 kDa, and 29 kDa, respectively. The theoretical molecular weight of a CPAP937–1124 monomer is 22 kDa. The Rh of CPAP937–1124 determined at the intermediate concentration was 2.9 ± 0.15 nm, which is significantly larger than expected for a globular protein of this mass and thus is consistent with the extended crystallographic structure. SEC-MALS measurements were performed using a Wyatt Heleos II 18 angle light scattering instrument coupled to a Wyatt Optilab rEX online refractive index detector. Detector 12 in the Heleos instrument was replaced with Wyatt's QELS detector for dynamic light scattering measurement. Samples (100 μl) were resolved on a Superdex S-200 10/300 analytical gel filtration column (GE Healthcare, Little Chalfont, UK) running at 0.5 ml/min in 25 mM bis Tris pH 7.2, 100 mM NaCl buffer before passing through the light scattering and refractive index detectors in a standard SEC-MALS format. Protein concentration was determined from the excess differential refractive index based on 0.186 RI increment for 1 g/ml protein solution. The concentration and the observed scattered intensity at each point in the chromatograms were used to calculate the absolute molecular mass from the intercept of the Debye plot using Zimm's model as implemented in Wyatt's ASTRA software. Autocorrelation analysis of data from the dynamic light scattering detector was also performed using Wyatt's ASTRA software, and the translational diffusion coefficients determined were used to calculate the hydrodynamic radius using the Stokes-Einstein equation and the measured solvent viscosity of 9.3 e-3 Poise. (B) Small-angle X-ray scattering (SAXS) experiment with approximately 20 μM D. rerio CPAP937–1124 in 25 mM bis Tris pH 7.2, 100 mM NaCl, 2 mM DTT. Shown in blue is the experimentally measured SAXS curve of CPAP937–1124 with the experimental error indicated by black bars. The orange line shows the fitted theoretical SAXS curve of CPAP937–1124 derived from its crystal structure. Fitting was done using CRYSOL (Svergun et al., 1995) and resulted in a χ-value of 1.416. A.U., arbitrary units. At higher CPAP937–1124 concentrations the fit became less good due to the tendency of CPAP937–1124 to self-associate at these concentrations as revealed by a gradual increase of the derived Rg values. SAXS data were collected at the European Synchrotron Radiation Facility (ESRF), Grenoble, France, at beamline ID14–3. Measurements were done at 10°C at a wavelength of 0.931 Å with the standard beamline settings using a PILATUS 1M detector (Dectris, Baden, Switzerland). To minimise radiation damage, a flow cell was used for the measurements. Collected data was buffer subtracted using PRIMUS (Konarev et al., 2003) and the beamstop shadow removed by cutting the data at a q-value of 0.055 nm−1. Above a q-value of 3.8 nm−1 the data became too noisy to be interpretable and the data were therefore cut at this value.
Figure 1—figure supplement 4
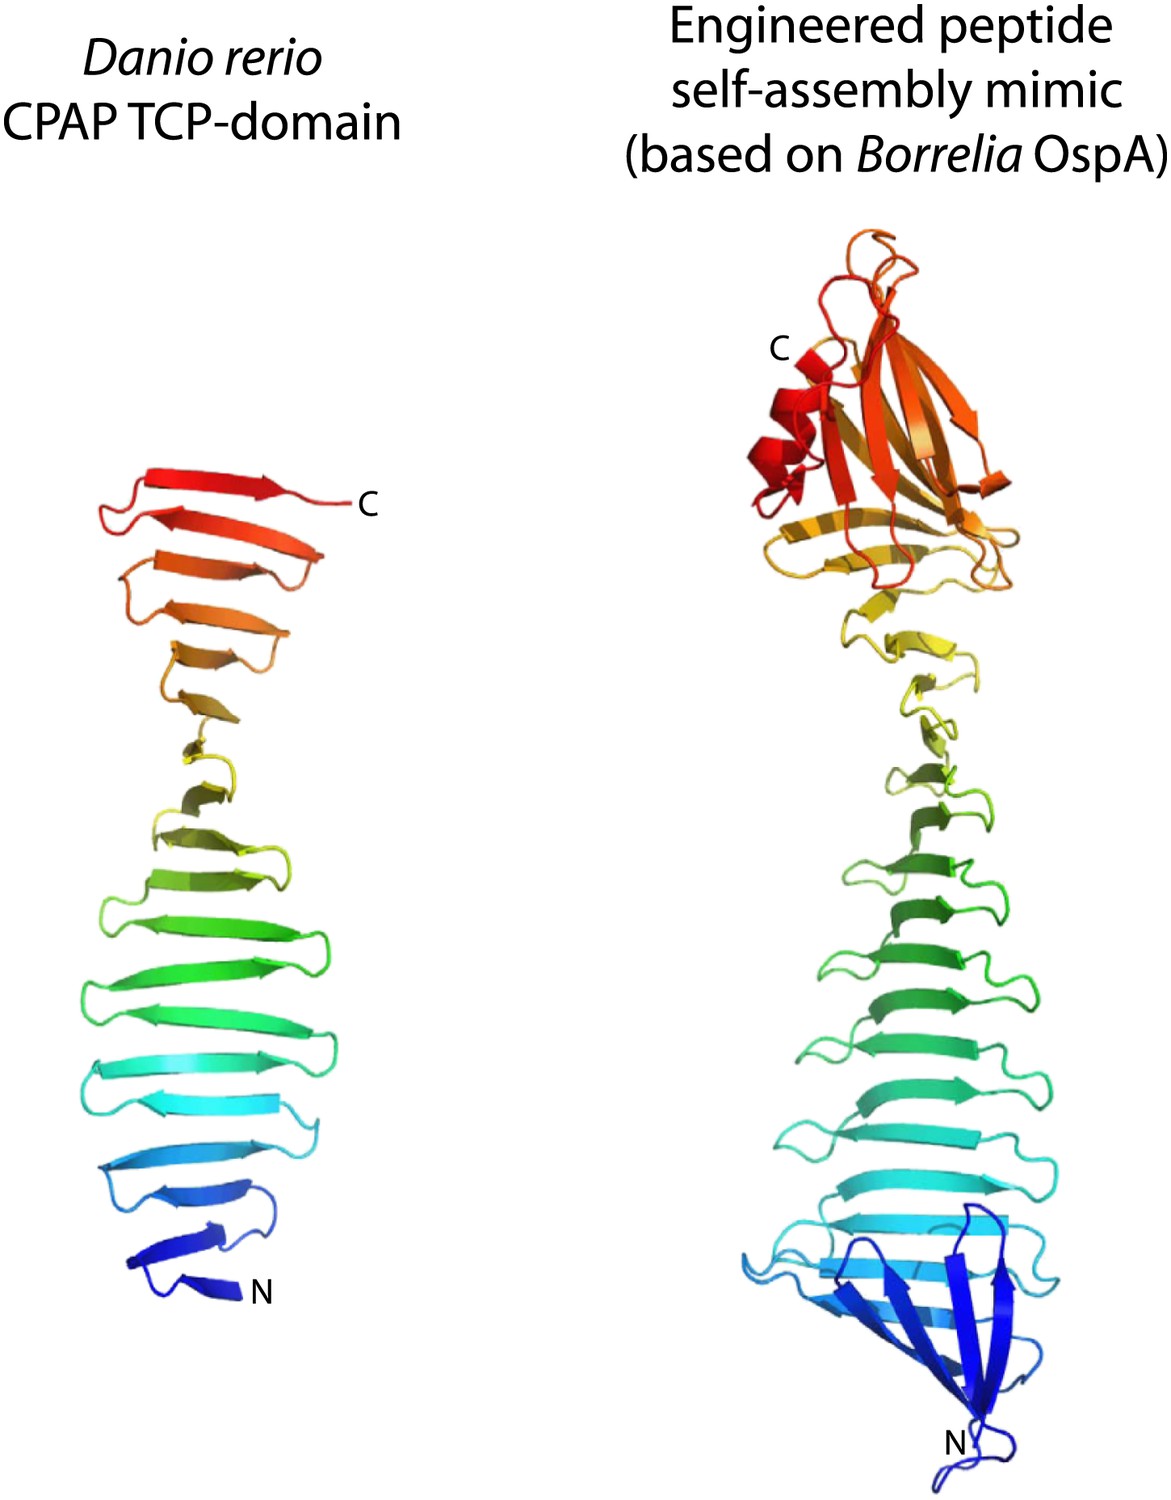
The TCP domain resembles engineered peptide-assembly mimics used to study β-rich self-assemblies.
Side-by-side comparison of the apo-structure of the D. rerio TCP-domain of CPAP (left) with the structure of an engineered peptide-assembly mimic based on Borrelia OspA (right) that is used to study β-rich self-assemblies (PDB code 2FKJ, chain A). Structures are shown as ribbon presentations and are rainbow-coloured from N- to C-terminus. Note that the conformation of the peptide-self-assembly mimic is maintained by two globular domains capping both ends of its β-sheet. In contrast, the TCP domain entirely lacks a hydrophobic core.
Figure 1—figure supplement 5
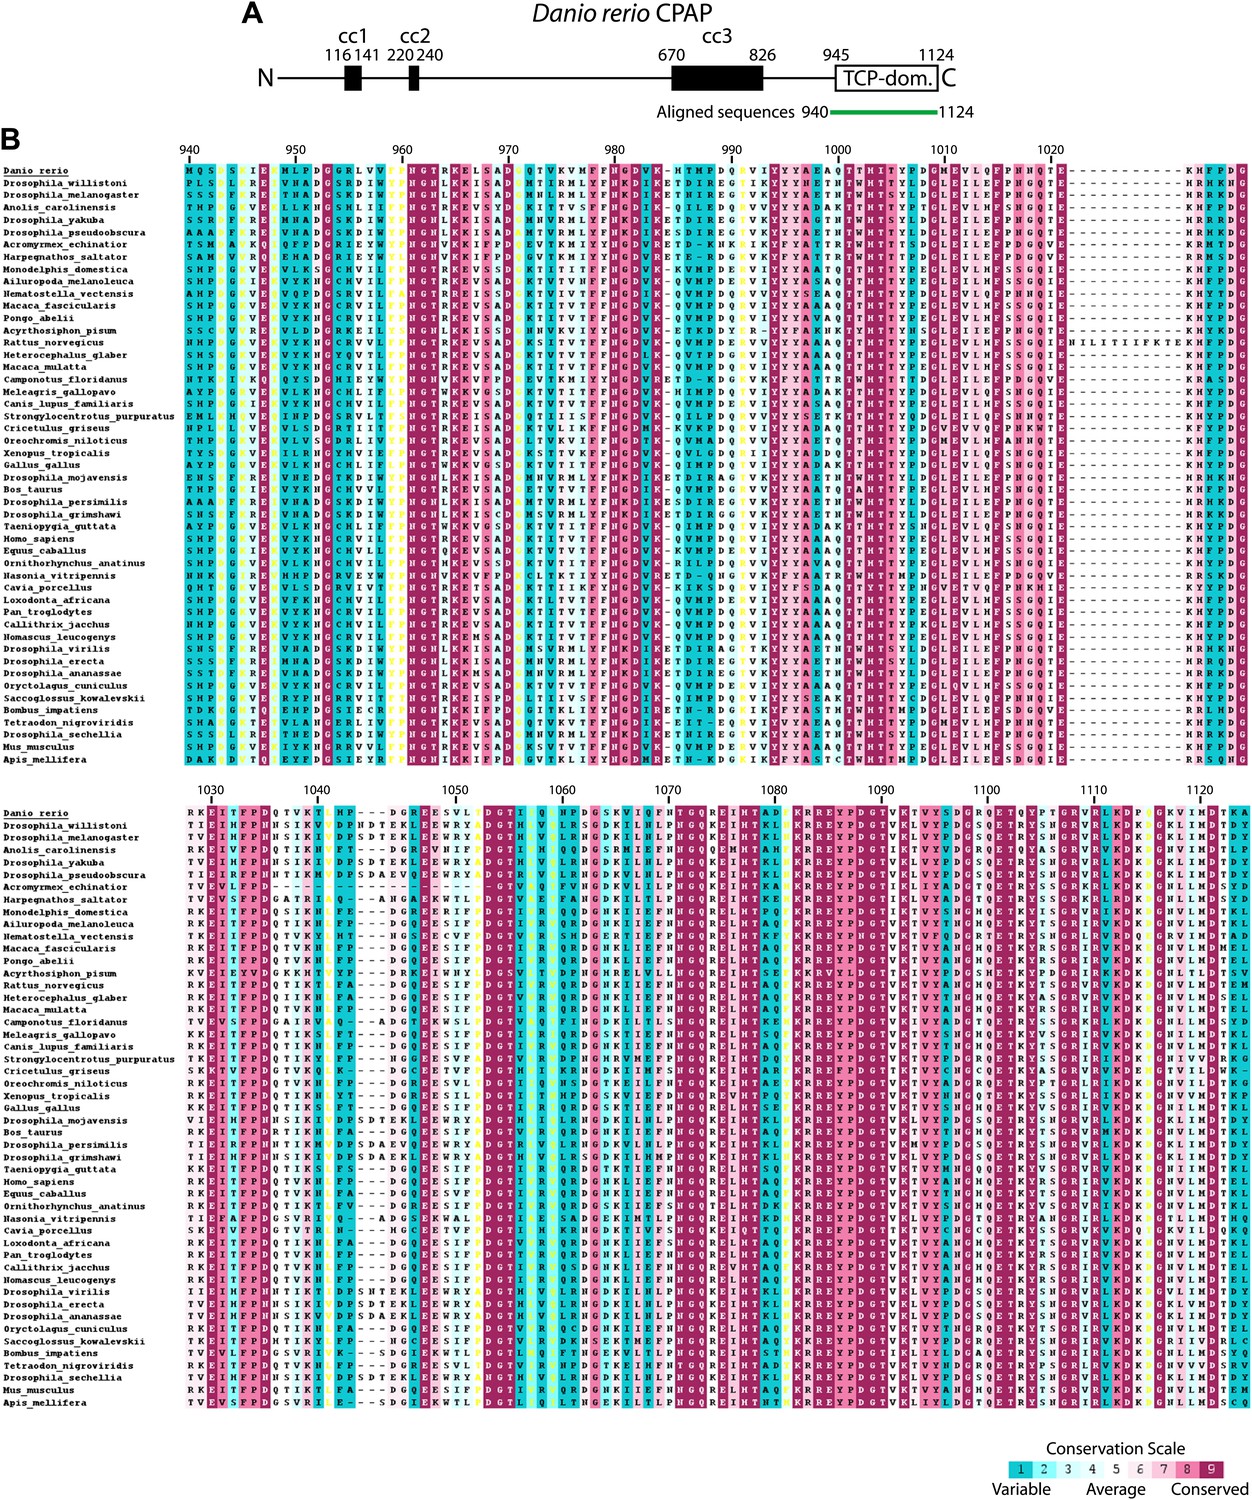
Multiple sequence alignment of the TCP domain of CPAP.
The numbering refers to D. rerio CPAP. The alignment is coloured by conservation according to the Consurf conservation score from cyan (variable) to burgundy (conserved).
Figure 2 with 1 supplement
Mutational analysis of the CPAP:STIL interaction in vitro and conservation of the interaction across species.
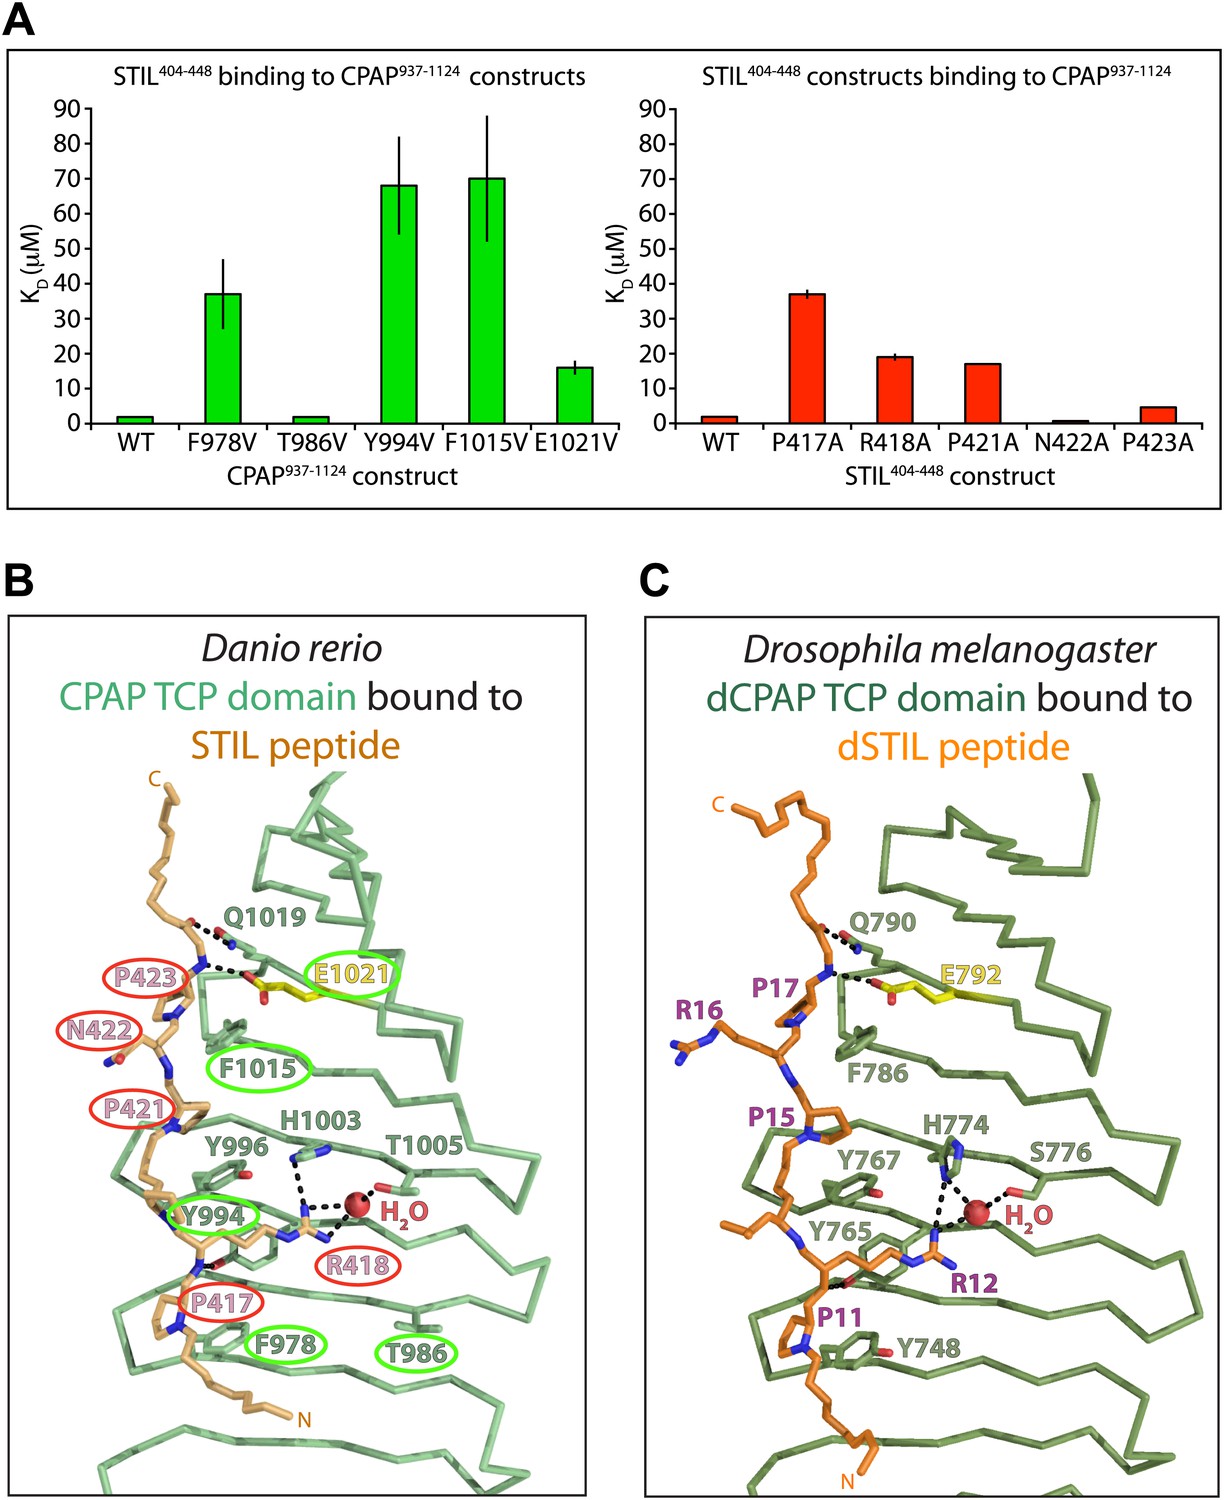
(A) Graphs showing the binding constants (KD) determined by ITC for the interaction between WT and mutant constructs of CPAP937–1124 and STIL404–448. Left panel, WT and various mutant forms of CPAP937–1124 binding to WT STIL404–448 (T986 is a non-interacting residue included as a negative control). Error bars, standard deviation. Right panel, WT and various mutant STIL404–448 constructs binding to WT CPAP937–1124 (N422 is a non-interacting residue included as a negative control). Error bars, standard deviation. The wild-type measurements are the same as shown in Figure 1D and are shown again for comparison to the mutants. (B and C) Close-up view of the CPAP (green):STIL (orange) interaction interface from D. rerio (B) and Drosophila (C). Interface residues are shown as sticks, in yellow is the Glutamate residue in Drosophila and D. rerio CPAP that is equivalent to E1235 in human CPAP (mutated in MCPH). Residues of the D. rerio protein mutated for ITC experiments are ringed in green (CPAP) or red (STIL). Dotted black lines indicate hydrogen-bonds. The conserved bound water molecule is shown as a red sphere.
Figure 2—figure supplement 1
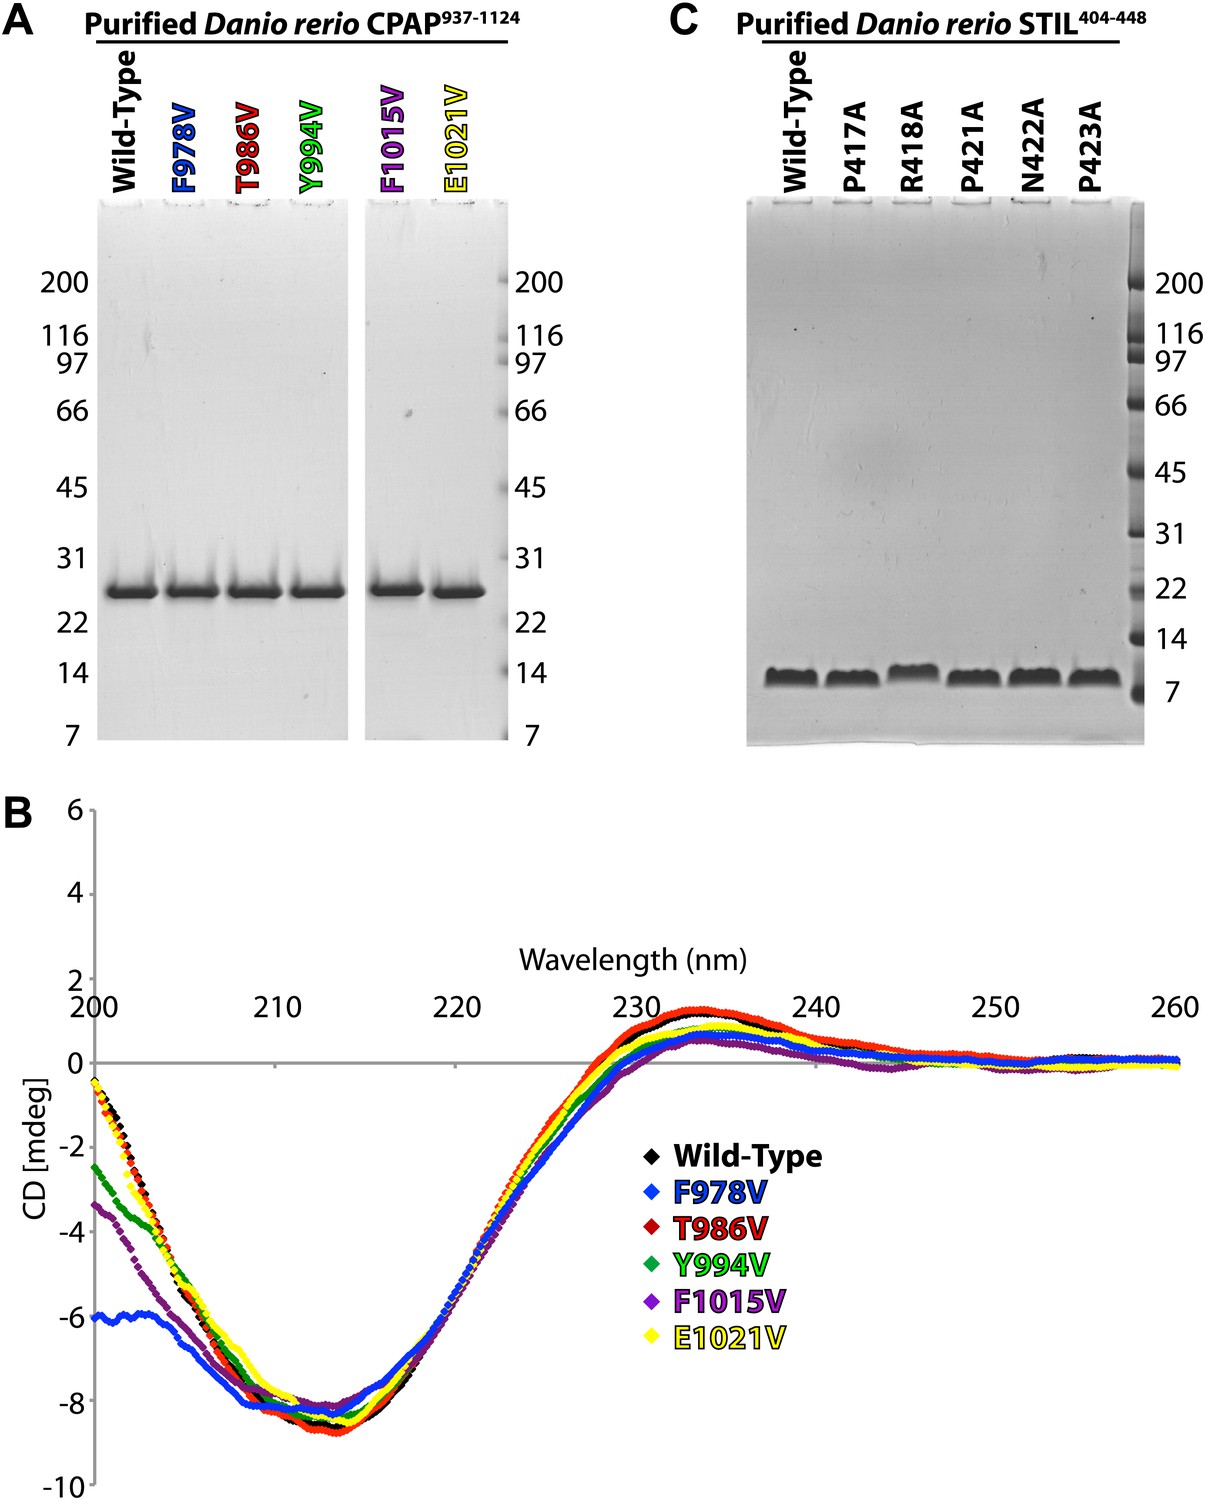
Characterisation of the D. rerio TCP domain mutants and STIL peptide mutants used for thermodynamic analysis.
(A) Coomassie stained SDS-PAGE gel of purified, recombinant CPAP937–1124 and its mutants (as labelled in colours above the gel). (B) Buffer-subtracted circular dichroism (CD) spectra of D. rerio CPAP937–1124 and its mutants in 10 mM Na-Phosphate pH 7.3 at approximately 200 μg/ml. Spectra were recorded on a JASCO J-810 from 260 to 190 nm in 0.2 nm steps at 20°C and are colour-coded as in (A). The data were cut at 200 nm as the detector was saturated below this wavelength for some constructs as indicated by a high HT voltage. (C) Coomassie stained SDS-PAGE gel showing purified, recombinant D. rerio STIL404–448 and its mutants.
Figure 3 with 1 supplement
The interaction between dCPAP and dSTIL is essential for centriole duplication in Drosophila.
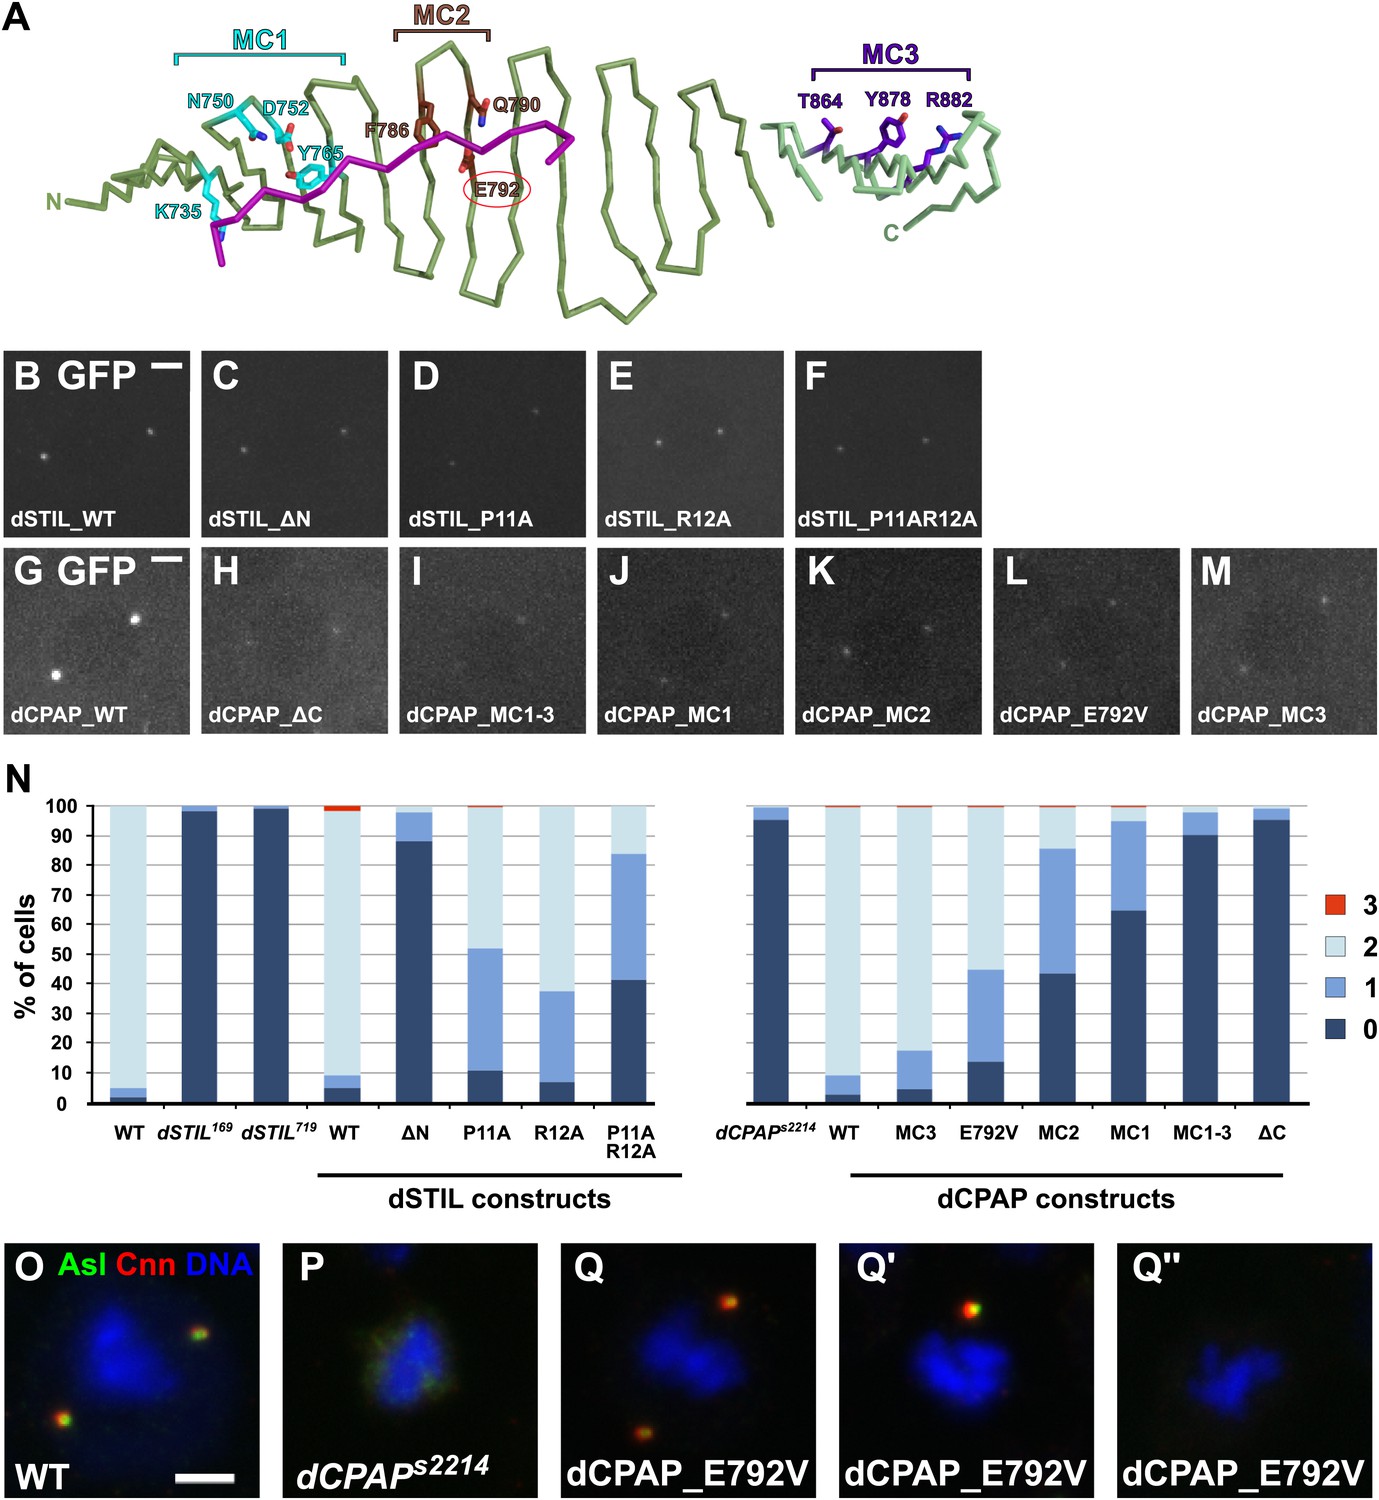
(A) Schematic view of the complex between dCPAP (green) and dSTIL (magenta) with the residues mutated in MC1 (cyan), MC2 (brown) and MC3 (dark purple) indicated as coloured sticks. The MCPH residue E792 is circled in red. Note that MC1 and MC2 are mapped onto the Drosophila structure (dark-green backbone), while MC3 had to be mapped onto the backbone of the D. rerio structure (light green backbone). Although highly conserved between Drosophila and D. rerio (Figure 1—figure supplement 5) this region was not visible in the electron density map of the Drosophila structure probably due to its partial unfolding to enable packing interactions within the crystal. (B–M) Panels show representative still images taken from movies of Drosophila embryos expressing the indicated dCPAP-GFP or dSTIL-GFP constructs. Note that all analyses were performed in the presence of endogenous WT dCPAP or dSTIL, and that all images were acquired with the same microscope settings at the same stage of the cell cycle. (B–F) dSTIL-GFP constructs localise to centrosomes at similar levels. (G–M) All mutant dCPAP-GFP constructs localise to centrosomes, but at strongly reduced levels compared to wild-type dCPAP-GFP. (N) Graphs show the percentage of cells with 0, 1, 2, and 3 centrosomes in the genotypes analysed (as indicated). All dSTIL-GFP and dCPAP-GFP constructs were analysed in their respective mutant backgrounds. Note that this experiment was performed blind. (O–Q′′) Panels show third instar larval brain cells of various genotypes in metaphase. Cells were stained for the centriolar protein Asterless (Asl—green) and the PCM component Centrosomin (Cnn—red) and DNA (blue). Wild-type metaphase cells have two centrosomes (O), whereas centrosomes are mostly absent in third instar larval brain cells from dCPAP mutants (P). As an example, representative images of dCPAP mutant cells expressing the dCPAP_E792V-GFP construct are shown that were scored with 2 (Q), 1 (Q′) or no (Q′′) centrosomes. Scale bars = 3 μm.
Figure 3—figure supplement 1
Protein expression levels of GFP-tagged dCPAP and dSTIL constructs in dCPAP or dSTIL mutant Drosophila brain cells and quantification of their centriole/centrosome numbers.
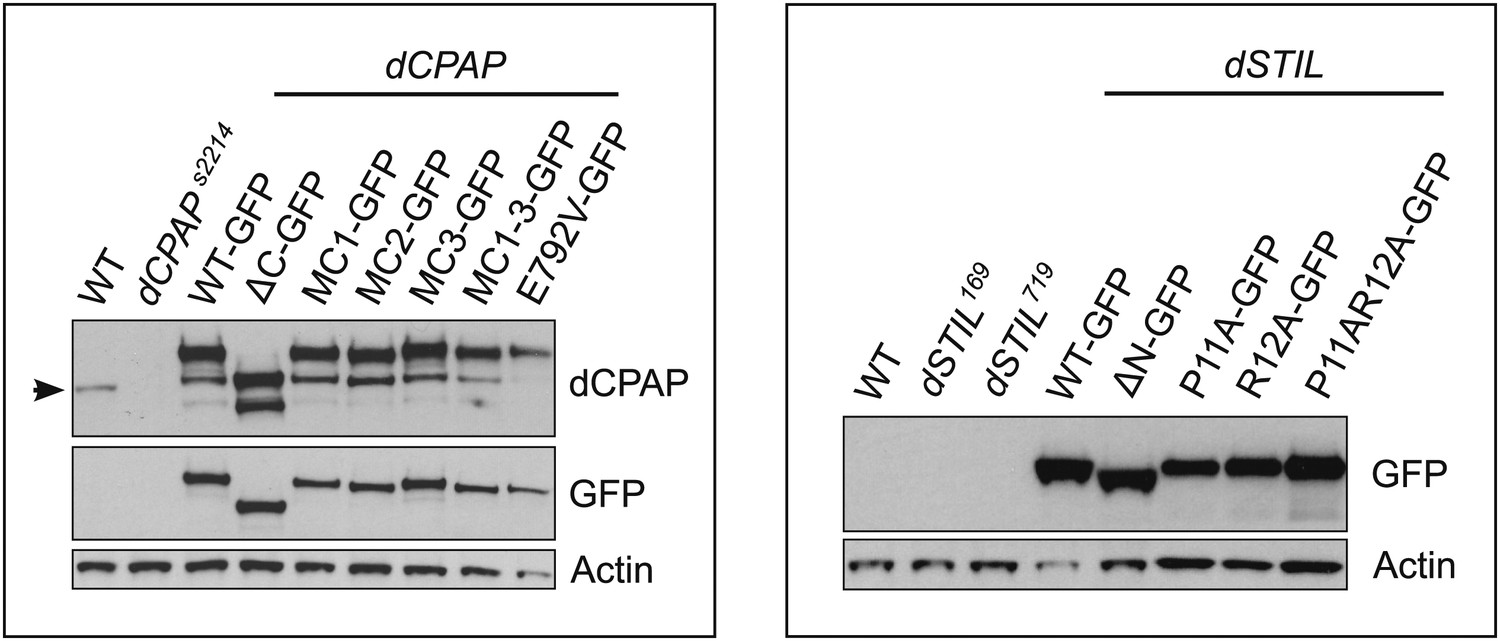
Panels show western blots of third instar larval brain samples probed with antibodies against GFP (recognising the fusion proteins), actin (as a loading control) and dCPAP (recognising both the fusion proteins and the endogenous protein) (highlighted by an arrow). All fusion proteins were expressed in their respective mutant backgrounds, as indicated by the black lines. Left panel, the dCPAP fusion proteins were expressed at approximately equal levels (when compared to the actin control) but were all moderately overexpressed compared to the endogenous dCPAP protein. Right panel, dSTIL_WT, dSTILΔN and dSTILP11AR12A were expressed at slightly higher levels than dSTIL_P11A and dSTIL_R12A, and all GFP fusion proteins were strongly overexpressed when compared to endogenous dSTIL (data not shown).
Figure 4
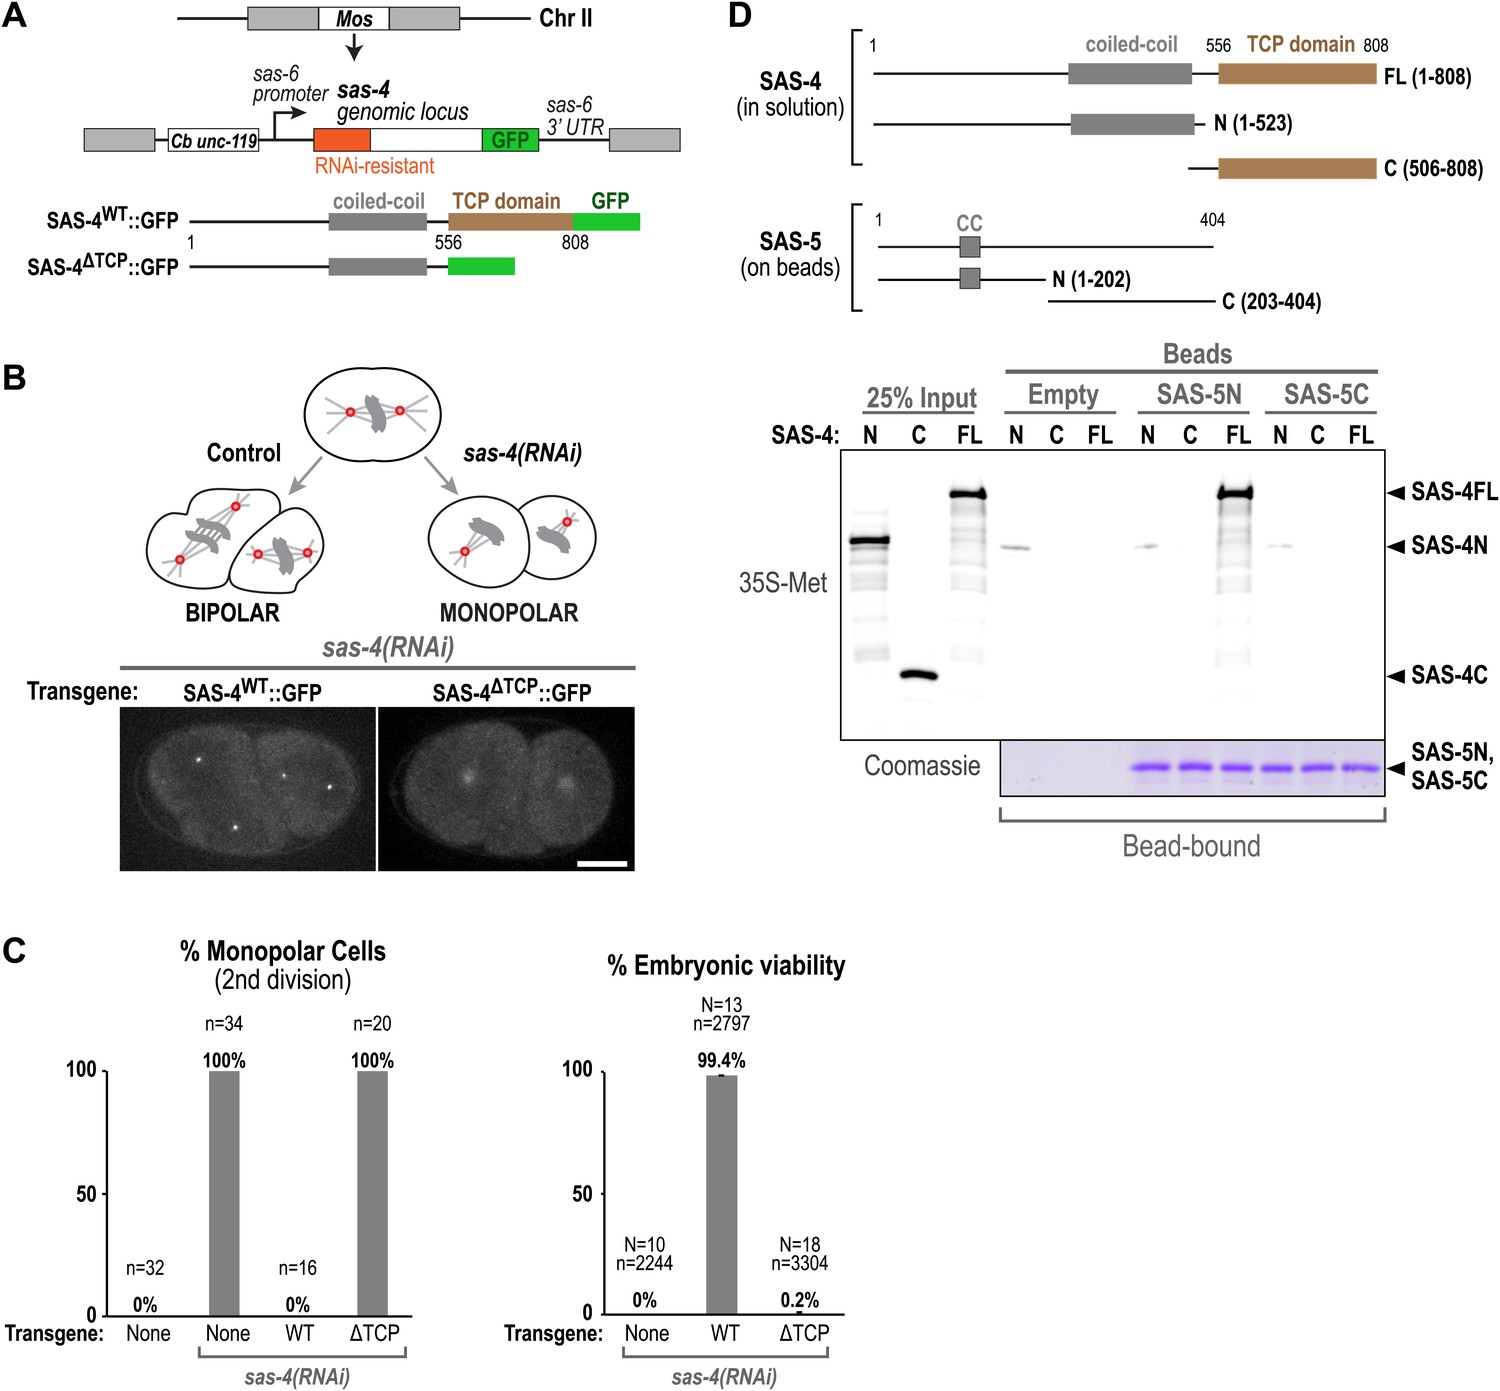
The TCP domain of C. elegans SAS-4 is required for its interaction with SAS-5, its localisation to centrioles, and for centriole assembly.
(A) Schematic illustration of the MosSCI system used for generating single-copy sas-4 transgene insertions. (B) A schematic illustration of the monopolar spindle assay for centriole duplication in C. elegans embryos. Panels show maximum intensity projections of representative fluorescence confocal z-series taken of sas-4(RNAi) embryos expressing either WT or ΔTCP SAS-4::GFP. Transgenic SAS-4WT::GFP localises to sharp foci representing the centrioles, whereas SAS-4ΔTCP::GFP localises diffusely to the pericentriolar material. Bar, 10 μM. (C) Graphs show the quantification of second division monopolar spindles (left) and embryonic viability (right) after sas-4(RNAi) and rescue with either a WT or ΔTCP sas-4::gfp transgene. (D) Panels show autoradiographs (top panel) and a Coomassie stained gel from a Ni-NTA pull-down experiment with 35S-labelled in vitro translated SAS-4 fragments (prey) and SAS-5-6xHis fragments (baits).
Figure 5
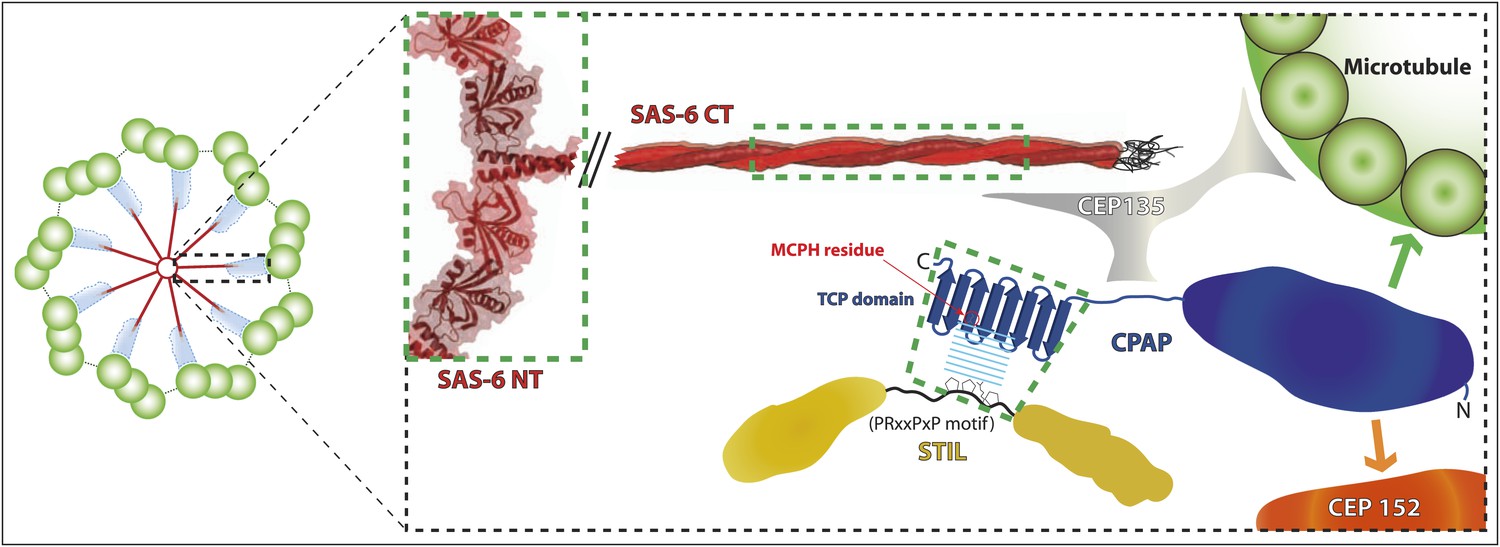
A schematic representation of protein interactions within the inner region of the centriole.
In this illustration, interactions whose crystal structure have been determined are highlighted by green boxes—all other interactions are inferred from biochemical and genetic studies and so are depicted in cartoon form. The cartwheel central hub comprises SAS-6 (red) (Nakazawa et al., 2007; Kitagawa et al., 2011b; van Breugel et al., 2011). The spokes extending outward from the hub consist of a homodimeric SAS-6 coiled-coil, which extends (van Breugel et al., 2011) into a region known as the ‘pinhead’ (cyan in low magnification view, left), where CEP135 (grey) may act as a linker between SAS-6, CPAP and microtubules (Hiraki et al., 2007; Roque et al., 2012; Lin et al., 2013). CPAP (dark blue) localises more towards the periphery of the centriole (Mennella et al., 2012; Sonnen et al., 2012; Lukinavičius et al., 2013), where its N-terminal part may interact directly with both Asterless/CEP152 (Cizmecioglu et al., 2010; Dzhindzhev et al., 2010) (orange arrow) and microtubules (Hsu et al., 2008) (green arrow). In contrast STIL (yellow) localises more towards the interior of centrioles (Arquint et al., 2012), and appears to function upstream of CPAP in centriole biogenesis (Tang et al., 2011; Vulprecht et al., 2012). Thus, we propose that the C-terminal TCP domain of CPAP interacts with the conserved region 2 (CR2) of STIL towards the interior of the centriole and that this interaction is crucial for CPAP/STIL function at centrioles. The orientation of STIL in centrioles is unknown.
Tables
Table 1
Characterisation of the CPAP:STIL interaction in vitro
| Danio rerio STIL peptide in syringe | Danio rerio CPAP937–1124 TCP domain in cell | Number of binding sites (N) | SD N | KD (μM) | SD KD (μM) | ΔH (kcal/mol) | SD (kcal/mol) | n (number of measurements) | Factor change in KD |
|---|---|---|---|---|---|---|---|---|---|
| STIL404–448 | WT | 1.07 | 0.04 | 1.9 | 0.2 | −10.1 | 0.3 | 5 | 1 |
| STIL411–428 | WT | 0.98 | 0.03 | 4 | 0.3 | −11.3 | 0.5 | 3 | 2 |
| STIL429–448 | WT | 0.97 | 0.08 | 540 | 130 | −6.3 | 0.6 | 2 | ∼280 |
-
Binding parameters between D. rerio CPAP and various D. rerio STIL constructs obtained from ITC experiments. Fitting was performed with N as a variable. Constraining N to a fixed value of 1 during fitting produced KD values that were within the experimental error of those tabulated here.
Table 2
Native dataset analysis and refinement statistics
| D. rerio CPAP937–1124 WT | D. rerio CPAP937–1124 E1021V | D. rerio CPAP937–1124 + D. rerio STIL408–428 complex | D. melanogaster dSTIL1–47 − dCPAP700–901 fusion complex | |
|---|---|---|---|---|
| Beamline | Diamond I02 | MRC-LMB Cambridge UK | Diamond I04 | Diamond I04 |
| Space group | P21 | P21 | P21 | P1 |
| Wavelength (Å) | 0.9786 | 1.5418 | 0.9795 | 0.9795 |
| Monomers in the asymmetric unit | 1 | 1 | 2 | 3 |
| Unit cell dimensions (Å) | a = 52.34; b = 36.44; c = 56.44; α = 90.00; β = 117.31; γ = 90.00 | a = 52.12; b = 36.48; c = 56.46; α = 90.00; β = 117.47; γ = 90.00 | a = 60.25; b = 67.47; c = 61.65; α = 90.00; β = 113.92; γ = 90 | a = 58.64; b = 69.91; c = 69.98; α = 86.96; β = 88.64; γ = 67.69 |
| Resolution (Å) | 29.48–1.7 | 36.48–1.9 | 56.35–2.7/2.2 (anisotropy) | 64.60–2.57 |
| Completeness(overall/inner/outer shell) | 99.7/99.4/100 | 100/99.6/100 | 99.9/99.5/99.9 | 97.6/93.6/97.2 |
| Rmerge (overall/inner/outer shell) | 0.074/0.030/0.929 | 0.096/0.028/1.093 | 0.101/0.053/1.008 | 0.091/0.069/0.512 |
| Rpim (overall/inner/outer shell) | 0.029/0.012/0.369 | 0.039/0.012/0.456 | 0.050/0.027/0.505 | 0.061/0.035/0.449 |
| Mean I/σI (overall/inner/outer shell) | 14.6/39.9/2.0 | 13.8/43.4/1.8 | 7.6/19.0/1.4 | 7.6/16.3/1.7 |
| Multiplicity (overall/inner/outer shell) | 7.2/7.0/7.3 | 6.8/6.6/6.6 | 4.8/4.7/4.9 | 3.1/2.9/3.1 |
| Number of reflections | 19,941 | 14,349 | 21,892 | 31,911 |
| Number of atoms | 1595 | 1515 | 3176 | 3924 |
| Waters | 190 | 114 | 54 | 65 |
| Rwork/Rfree (% data used) | 19.9/24.4 (5.1%) | 20.9/26.7 (5.0%) | 23.4/27.7 (5.0%) | 24.5/26.3 (5.05%) |
| rmsd from ideal values: bond length/angles | 0.011/1.478 | 0.009/1.310 | 0.015/1.619 | 0.007/0.900 |
| Mean B value | 26.52 | 31.553 | 59.69 | 70.80 |
| Correlation coefficient Fo-Fc/Fo-Fc free | 0.961/0.942 | 0.955/0.926 | 0.954/0.933 | 0.854/0.836 |
| Molprobity Score | 0.97 (100th percentile) | 1.2 (99th percentile) | 1.70 (96th percentile) | 1.40 (100th percentile) |
Table 3
SeMet D. rerio CPAP937–1124 dataset analysis and phasing statistics
| Beamline | ESRF ID 23–1 | ||
| Space group | P21 | ||
| Wavelength (Å) | 0.9791 (Peak) | 0.9794 (Inflection) | 0.9393 (Remote) |
| Unit cell dimensions (Å) | a = 52.39 b = 36.53 c = 56.34 α = 90.00 β = 117.28 γ = 90.00 | a = 52.59 b = 36.60 c = 56.48 α = 90.00 β = 117.24 γ = 90.00 | a = 52.49 b = 36.55 c = 56.38 α = 90.00 β = 117.26 γ = 90.00 |
| Resolution (Å) | 36.56–1.7 | 36.56–1.7 | 36.56–1.7 |
| Completeness (overall/inner/outer shell) | 100.0/99.7/100.0 | 100/99.2/100 | 100/99.7/100 |
| Rmerge (overall/inner/outer shell) | 0.09/0.048/1.296 | 0.127/0.047/2.840 | 0.092/0.046/1.370 |
| Rpim (overall/inner/outer shell) | 0.042/0.031/0.552 | 0.056/0.028/1.201 | 0.041/0.026/0.580 |
| Mean I/sd(I) (overall/inner/outer shell) | 10.7/26.0/1.5 | 8.9/26.4/0.7 | 10.8/27.4/1.4 |
| Multiplicity (overall/inner/outer shell) | 7.2/7.0/7.3 | 7.2/6.9/7.3 | 7.2/7.0/7.3 |
| Se sites found/expected | 5/7 | ||
| Overall FOM | 0.306 | ||
Table 4
Characterisation of the CPAP:STIL interaction in vitro
| Danio rerio STIL404–448 peptide in syringe | Danio rerio CPAP937–1124 TCP domain in cell | Number of binding sites (N) | SD N | KD (μM) | SD KD (μM) | ΔH (kcal/mol) | SD (kcal/mol) | n (number of measurements) | Factor change in KD |
|---|---|---|---|---|---|---|---|---|---|
| WT | WT | 1.07 | 0.04 | 1.9 | 0.2 | −10.1 | 0.3 | 5 | 1 |
| WT | F978V | 0.70 | 0.09 | 37 | 10 | −23 | 5 | 4 | 20 |
| WT | T986V | 1.01 | 0.07 | 1.9 | 0.2 | −10.6 | 0.4 | 3 | 1 |
| WT | Y994V | 1.00 | 0.33 | 68 | 14 | −9.5 | 3.8 | 5 | 36 |
| WT | F1015V | 0.93 | 0.13 | 70 | 18 | −10.4 | 2.7 | 3 | 37 |
| WT | E1021V | 0.91 | 0.13 | 16 | 2 | −8.1 | 0.6 | 3 | 8 |
| WT | WT | 1.07 | 0.04 | 1.9 | 0.2 | −10.1 | 0.3 | 5 | 1 |
| P417A | WT | 1.06 | 0.02 | 37 | 1.3 | −11.5 | 0.2 | 3 | 20 |
| R418A | WT | 1.12 | 0.02 | 19 | 1 | −8.8 | 0.1 | 4 | 10 |
| P421A | WT | 1.16 | 0.03 | 17 | 0.3 | −9.8 | 0.2 | 4 | 9 |
| N422A | WT | 1.09 | 0.03 | 0.7 | 0.05 | −12.3 | 0.3 | 4 | 0.4 |
| P423A | WT | 1.16 | 0.05 | 4.6 | 0.3 | −10.9 | 0.4 | 4 | 2.4 |
-
Tables show the binding parameters between various D. rerio CPAP and STIL constructs obtained from ITC experiments. The measurements of the WT STIL404–448—WT CPAP937–1124 interaction are identical to each other and identical to those shown in Table 1 and are only presented again to allow easier comparison within each table. Fitting was performed with N as a variable. Constraining N to a fixed value of 1 during fitting produced KD values that were within the experimental error of those tabulated here. In control measurements on wild-type material and a selection of mutants of both CPAP and STIL, the experimental configuration was reversed with CPAP protein titrated into STIL peptide in the ITC cell. These experiments gave similar values for N, KD and ΔH to the standard configuration reported here.
Table 5
D. melanogaster dSTIL1–47-dCPAP700–901 crystallisation conditions
| Crystal | Protein concentration (mg/ml) | Mother liquor | µl protein:µl Mother liquor | µl seed stock |
|---|---|---|---|---|
| Native | 6.18 | 100 mM MES/imidazole mix pH 6.5, 30 mM MgCl2, 30 mM CaCl2, 20% ethylene glycol, 10% PEG 8000 | 0.15:0.05 | – |
| Semet1 | 5.00 | 100 mM MES/imidazole mix pH 6.5, 20% ethylene glycol, 10% PEG8000, 0.2 M racemic glutamic acid, 0.2 M glycine, 0.2 M racemic serine, 0.2 M racemic alanine, 0.2 M racemic lysine HCl | 0.1:0.1 | – |
| Semet2 | 5.29 | 100 mM MES/imidazole mix pH 6.5, 14% ethylene glycol, 7% PEG8000, 30 mM NaNO3, 30 mM NaPO4, 30 mM NH4SO4 | 0.3:0.1 | 0.05 |
| Semet3 | 5.29 | 100 mM MES/imidazole mix pH 6.5, 14% ethylene glycol, 7% PEG8000, 30 mM NaNO3, 30 mM NaPO4, 30 mM NH4SO4 | 0.3:0.1 | 0.05 |
| Semet4 | 5.29 | 100 mM MES/imidazole mix pH 6.5, 16% ethylene glycol, 8% PEG8000, 30 mM NaNO3, 30 mM NaPO4, 30 mM NH4SO4 | 0.3:0.1 | 0.05 |
Table 6
D. melanogaster dSTIL1–47-dCPAP700–901 SeMet dataset analysis
| Semet1-PEAK | SEMET1-LREM | Semet2-Peak | Semet3-PEAK | Semet3-INFL | Semet4-Peak | |
|---|---|---|---|---|---|---|
| Beamline | Diamond IO4 | Diamond IO4 | Diamond IO3 | Diamond IO3 | Diamond IO3 | Diamond IO3 |
| Spacegroup | P1 | P1 | P1 | P1 | P1 | P1 |
| Wavelength | 0.9795 | 0.9999 | 0.9792 | 0.9791 | 0.9794 | 0.9791 |
| Unit cell dimensions (Å) | a = 59.31 b = 70.02 c = 70.01 α = 87.65 β = 89.24 γ = 67.37 | a = 59.14 b = 70.24 c = 70.13 α = 87.62 β = 89.12 γ = 67.35 | a = 58.47 b = 70.15 c = 69.99 α = 87.08 β = 88.41 γ = 67.60 | a = 58.56 b = 70.03 c = 70.14 α = 86.93 β = 88.39 γ = 68.09 | a = 58.72 b = 70.06 c = 70.28 α = 86.84 β = 88.47 γ = 68.36 | a = 59.01 b = 70.17 c = 70.15 α = 87.16 β = 88.64 γ = 67.58 |
| Resolution (Å) | 54.74–3.50 | 64.77–3.50 | 64.80–3.44 | 70.04–3.50 | 70.17–4.60 | 64.80–3.36 |
| Completeness (overall/inner/outer) | 98.1/93.8/98.3 | 98.4/98.0/98.2 | 97.8/91.6/93.7 | 98.3/95.3/97.6 | 97.8/79.1/89.9 | 97.6/91.0/97.4 |
| Rmerge (overall/inner/outer) | 0.093/0.055/0.118 | 0.086/0.041/0.238 | 0.17/0.076/0.518 | 0.152/0.086/0.336 | 0.116/0.039/0.189 | 0.125/0.037/0.433 |
| Rpim (overall/inner/outer) | 0.071/0.047/0.136 | 0.062/0.029/0.172 | 0.078/0.040/0.229 | 0.075/0.043/0.184 | 0.087/0.034/0.141 | 0.100/0.038/0.323 |
| I/σI (overall/inner/outer) | 9.1/16.9/5.6 | 10.9/24.7/4.9 | 7.3/18.8/3.5 | 9.1/27.2/3.6 | 6.0/20.8/4.6 | 6.9/22.5/2.7 |
| Multiplicity (overall/inner/outer) | 3.9/3.8/3.9 | 3.9/3.8/3.8 | 7.0/7.0/7.1 | 6.0/6.7/5.3 | 3.5/3.6/3.5 | 3.5/3.4/3.6 |
| No. unique reflections | 12,832 | 12,884 | 13,315 | 12,797 | 5641 | 14,461 |
Table 7
Quantification of centriole/centrosome numbers in dCPAP or dSTIL mutant larval brain cells expressing the indicated WT or mutant constructs
| Genotype | Number of brains | Total number of cells | Cells with centrosome number (%) | |||
|---|---|---|---|---|---|---|
| 0 | 1 | 2 | 3 | |||
| WT | 12 | 944 | 2.1 | 2.6 | 95.2 | 0.0 |
| dCPAP | 8 | 661 | 95.2 | 4.2 | 0.6 | 0.0 |
| dCPAP_WT-GFP | 9 | 715 | 2.8 | 6.3 | 90.5 | 0.4 |
| dCPAP_ΔC-GFP | 13 | 1147 | 95.1 | 3.8 | 1.0 | 0.0 |
| dCPAP_MC1-GFP | 11 | 968 | 64.9 | 30.1 | 4.8 | 0.3 |
| dCPAP_MC2-GFP | 17 | 1053 | 43.5 | 42.2 | 14.1 | 0.3 |
| dCPAP_MC3-GFP | 16 | 1870 | 4.5 | 13.3 | 81.9 | 0.3 |
| dCPAP_MC1-3-GFP | 11 | 888 | 90.1 | 8.0 | 1.8 | 0.1 |
| dCPAP_E792V-GFP | 9 | 1015 | 13.7 | 31.1 | 54.8 | 0.4 |
| dSTIL169 | 9 | 846 | 98.1 | 1.9 | 0.0 | 0.0 |
| dSTIL719 | 9 | 980 | 99.2 | 0.8 | 0.0 | 0.0 |
| dSTIL_WT-GFP | 6 | 424 | 5.7 | 9.0 | 85.1 | 0.2 |
| dSTIL_ΔN-GFP | 13 | 884 | 88.1 | 9.8 | 1.9 | 0.1 |
| dSTIL_P11A-GFP | 9 | 1008 | 11.0 | 41.0 | 48.0 | 0.0 |
| dSTIL_R12A-GFP | 9 | 709 | 7.0 | 31.0 | 62.0 | 0.0 |
| dSTIL_P11AR12A-GFP | 9 | 727 | 41.0 | 43.0 | 16.0 | 0.0 |
Download links
A two-part list of links to download the article, or parts of the article, in various formats.
Downloads (link to download the article as PDF)
Open citations (links to open the citations from this article in various online reference manager services)
Cite this article (links to download the citations from this article in formats compatible with various reference manager tools)
Crystal structures of the CPAP/STIL complex reveal its role in centriole assembly and human microcephaly
eLife 2:e01071.
https://doi.org/10.7554/eLife.01071


