The role of Cdc42 and Gic1 in the regulation of septin filament formation and dissociation
- Max Planck Institute of Molecular Physiology, Germany
- Institute of Molecular Biology SAS, Slovak Republic
Figures
Figure 1
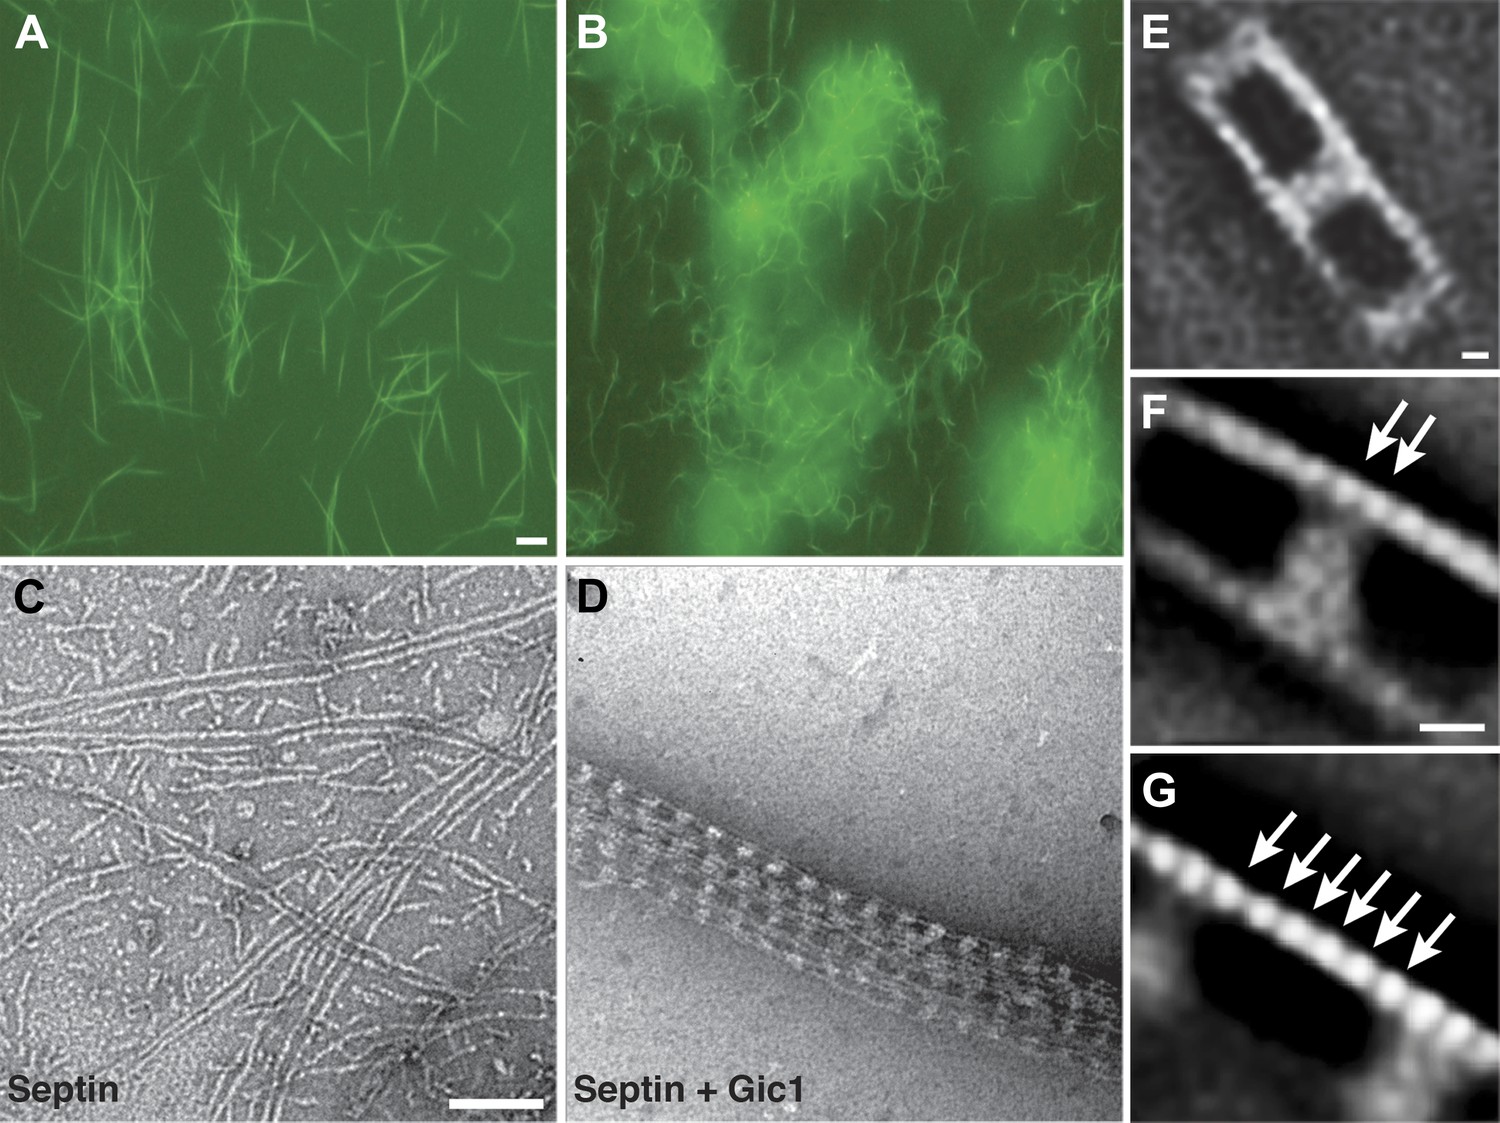
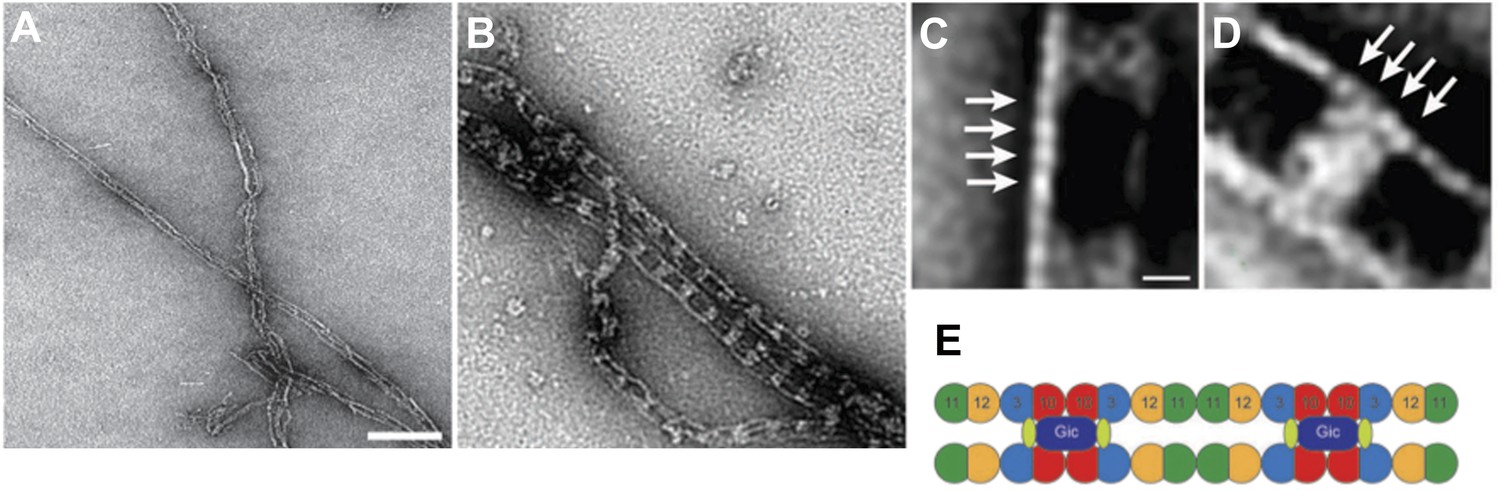
Gic1 scaffolds septin filaments resulting in long and flexible filament cables.
(A and B) Yeast septin octamers containing Cdc3-EGFP polymerized by dialysis alone (A) or together with Gic1 (B) and imaged using fluorescence microscopy. Scale bar, 0.5 µm. (C and D) Representative EM image of negatively stained septin filaments (C) and septin-Gic1 complexes (D) without EGFP. Scale bar, 100 nm. (E–G) Representative class averages with focus on the overall structure of the septin-Gic1 complex (E), the Gic1 cross-bridges (F) and the septin filaments (G); arrows indicate single septin proteins. Scale bars, 10 nm.
Figure 2
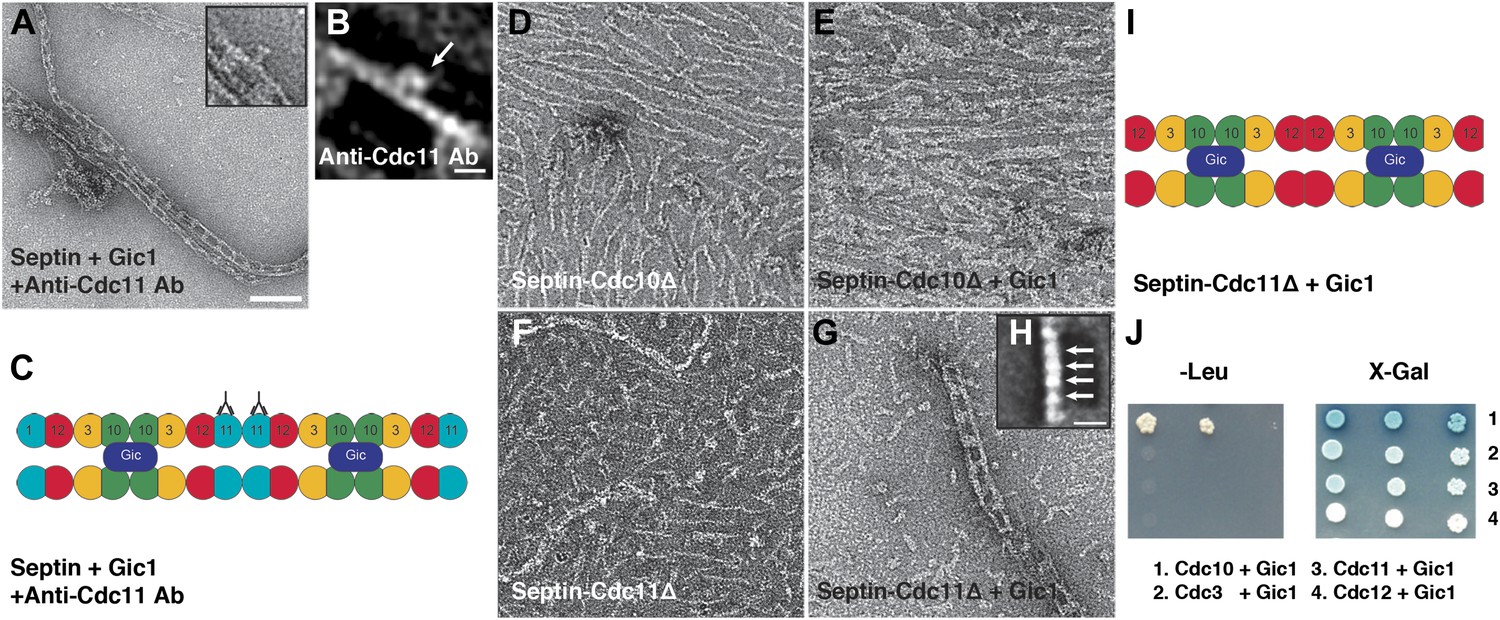
Gic1 binds specifically to septin Cdc10.
(A and B) Representative EM image (A) and class averages (B) of septin-Gic1 complexes labeled with antibody against Cdc11. Arrow indicates the antibodies. The class average in (B) contains 15 single particles. Scale bars, 100 nm and 10 nm in (A) and (B), respectively. (C) Model of the septin-Gic1 complex based on the known sequential order of septin filaments (Bertin et al., 2008). The G- and the N/C-interfaces are indicated by straight and circular interfaces between circles, respectively. Antibodies are indicated as Y shapes. (D and E) Representative EM images of septin-Cdc10Δ filaments without (D) and with Gic1 (E). (F and G) Representative EM images of septin-Cdc11Δ filaments (F) and septin-Cdc11Δ-Gic1 complexes (G). (H) Representative class average of the septin-Cdc11Δ-Gic1 complex with focus on the septin filament. Arrows indicate single septin proteins. Scale bar, 10 nm. (I) Model of the septin-Cdc11Δ-Gic1 complex. (J) Yeast two-hybrid assay of different septin proteins, namely Cdc3, Cdc10, Cdc11, and Cdc12 with Gic1.
Figure 3
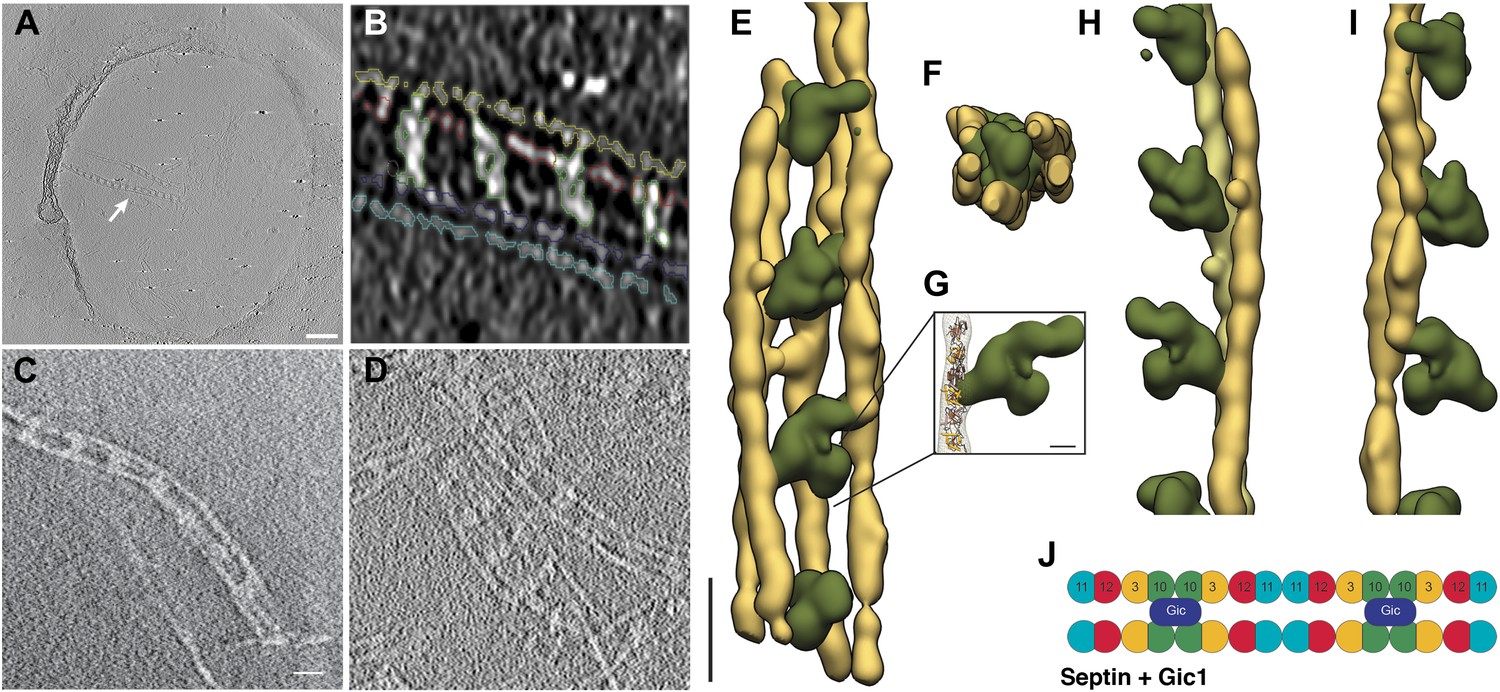
Cryo-ET of the septin-Gic1 complex.
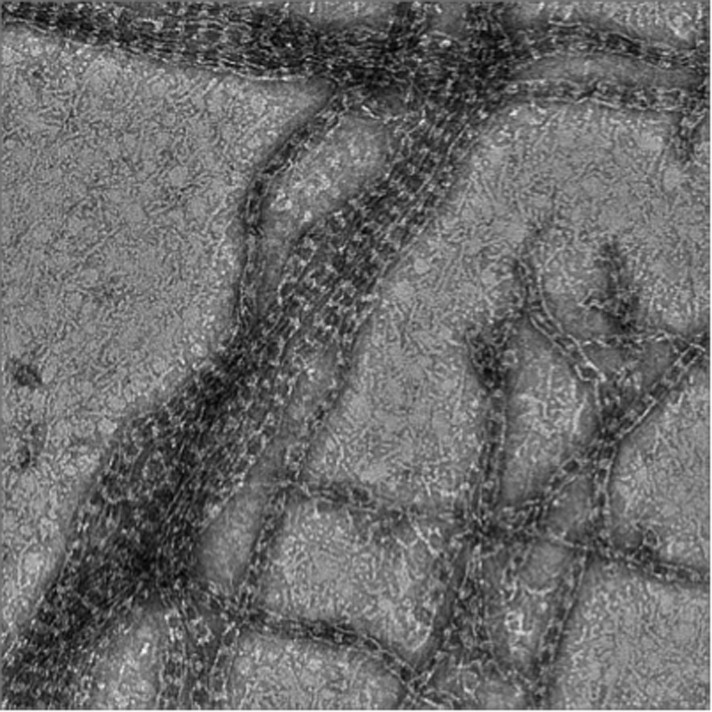
(A) Central slice of a cryo electron tomogram (for full tomogram see Videos 1–3). Arrow indicates a septin-Gic1 cable. Scale bar, 200 nm. (B) Segmentation of the tomograms. (C and D) Extracts from tomograms that show the flexibility and bending of the septin-Gic1 complex (C) as well as its ability to form mesh-like structures (D). Scale bar, 20 nm. (E–G) Side (E) and top view (F) of a septin-Gic1 complex. The septin filaments and Gic1 cross-bridges are depicted in gold and green, respectively. Scale bar, 20 nm. (G) The crystal structure of the human SEPT2/6/7 complex (PDB 2QAG) was manually fit into the EM structure. Scale bar, 5 nm. (H and I) Side views of the septin-Gic1 3D models. To allow a better observation of the septin filament interaction with Gic1, part of the septin filaments have been omitted. Scale bar, 20 nm. (J) Model of the septin-Gic1 complex based on the known sequential order of septin filaments (Bertin et al., 2008). The G- and the N/C-interfaces are indicated by straight and circular interfaces between circles, respectively.
Figure 4
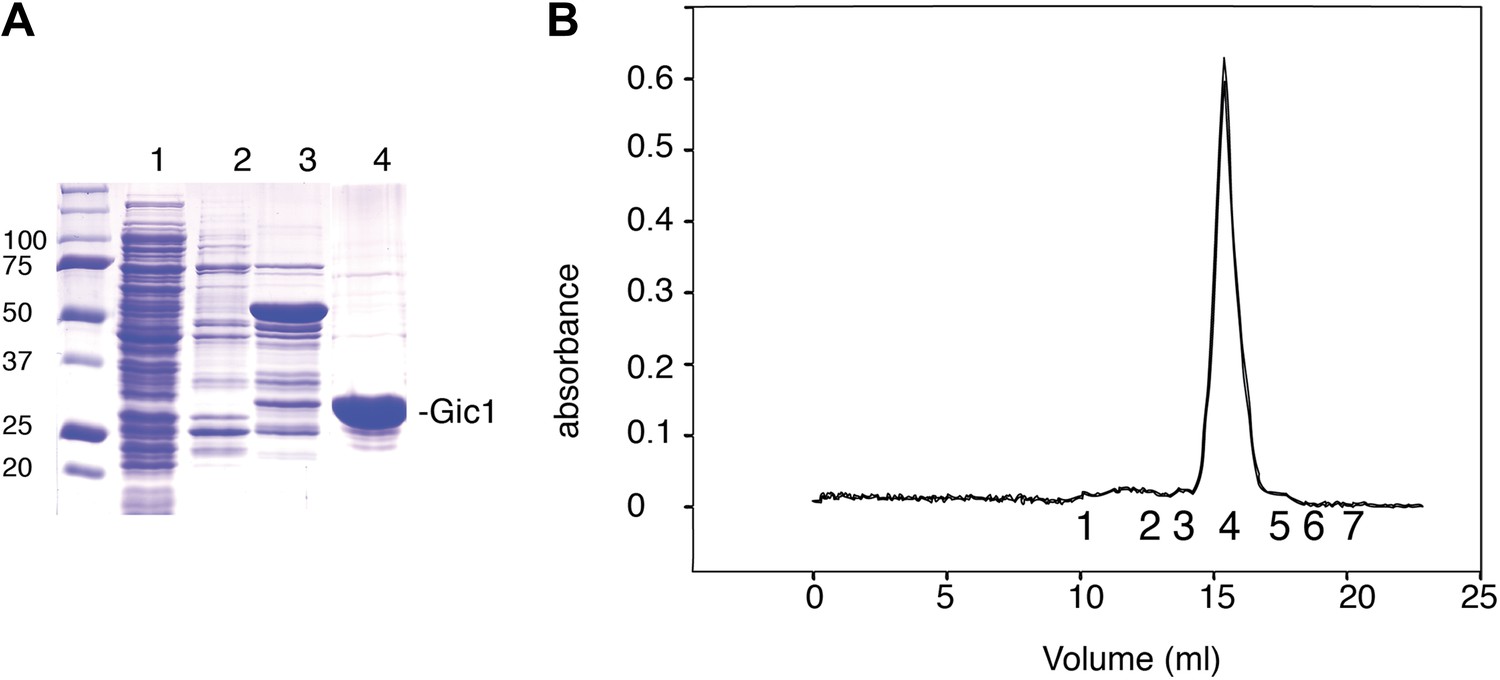
Purification of Gic1.
(A) SDS-PAGE of the Gic1(104-314) purification. (1) Flow through Ni-NTA, (2) wash Ni-NTA, (3) elution Ni-NTA, (4) elution from gel filtration after cleavage with prescission protease. (B) Gel filtration chromatography of purified Gic1(104-314). The calculated molecular weight of Gic1(104-314) is 23.38 kDa. The protein elutes from the gel filtration chromatography at a volume that corresponds to a molecular weight of 49 kDa, suggesting that it forms dimers. Protein standards for gel filtration: 1, ferritin (440 kDa); 2, aldolase (158 kDa); 3, conalbumin (75 kDa); 4, ovalbumin (43 kDa); 5, carbonic anhydrase (29 kDa); 6, RNase A (13.7 kDa); 7, aprotinin (6.5 kDa).
Figure 5
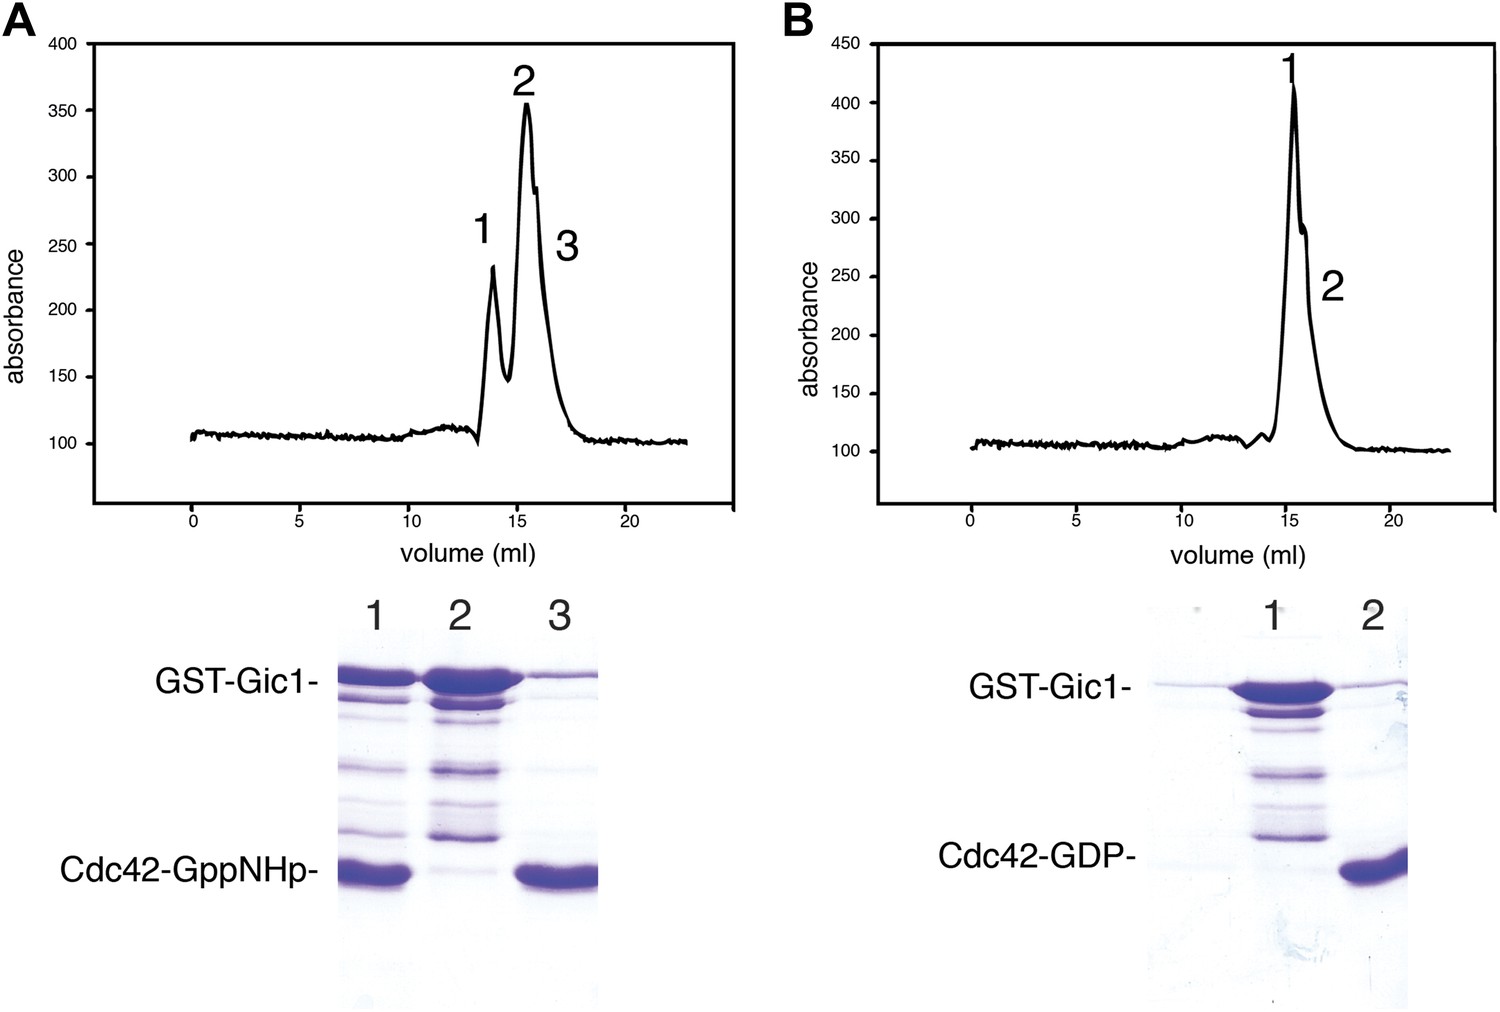
Cdc42-GppNHp binds specifically to Gic1.
(A and B) Gel filtration chromatography and SDS-PAGE of Gic1 with Cdc42-GppNHp (A) and Cdc42-GDP (B), respectively.
Figure 6
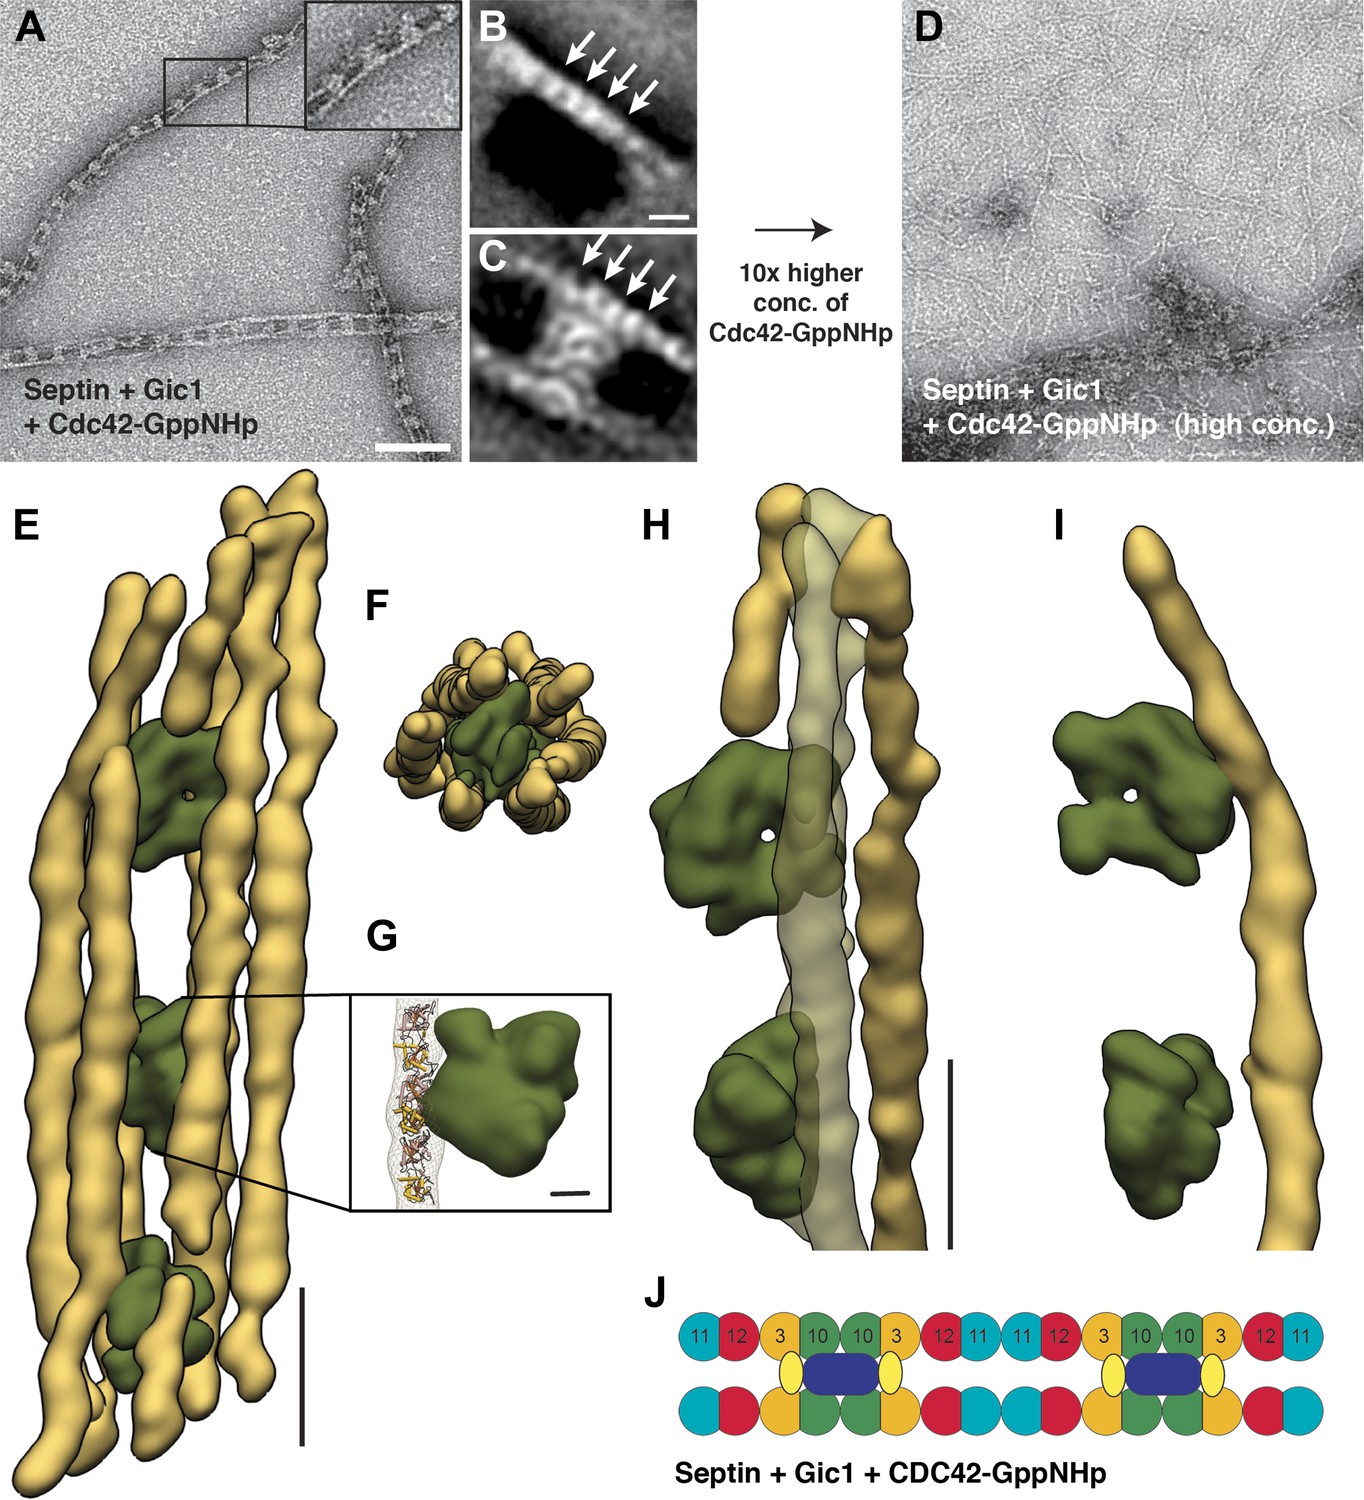
Cdc42-GppNHp binds specifically to Gic1 and dissociates septin-Gic1 complexes.
(A) Representative EM image of negatively stained septin-Gic1-Cdc42-GppNHp complexes. The concentration of Gic1 and Cdc42-GppNHp used for filament preparation is 0.5 µM. Scale bar, 100 nm. (B and C) Representative class averages of negatively stained septin-Gic1-Cdc42-GppNHp complexes with focus on septin filaments and the cross-bridges, respectively. Arrows indicate single septin proteins. Scale bar, 10 nm. (D) Same as (A) but at 10× higher concentration of Cdc42-GppNHp. (E–G) Side (E) and top view (F) of a septin-Gic1-Cdc42-GppNHp complex. The septin filaments and Gic1-Cdc42-GppNHp cross-bridges are depicted in gold and green, respectively. Scale bar, 20 nm. (G) The crystal structure of the human SEPT2/6/7 complex (PDB 2QAG) was manually fit into the EM structure. Scale bar, 5 nm. (H and I) Side views of the septin-Gic1-Cdc42-GppNHp 3D structures. To allow a better observation of the septin filament interaction with Gic1, part of the septin filaments have been omitted. Scale bar, 20 nm. (J) Model of the septin-Gic1-Cdc42-GppNHp complex. Cdc42-GppNHp is depicted as yellow ovals.
Figure 7
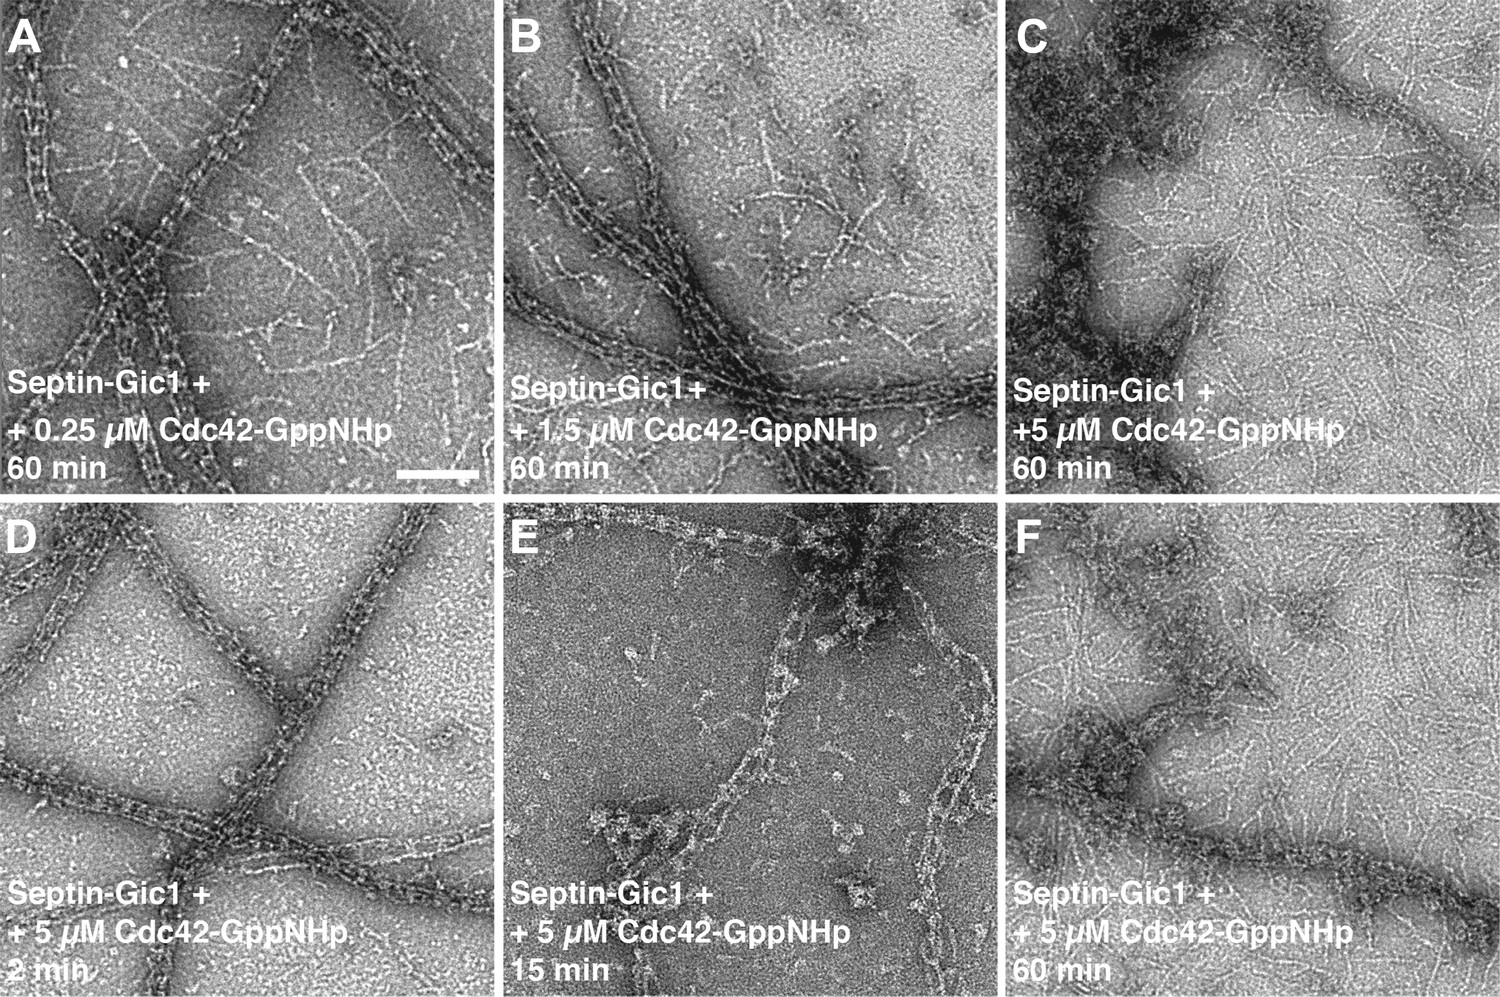
Time- and concentration-dependent interaction of Cdc42-GppNHp with the septin-Gic1 complex.
(A–C) Representative EM images of the septin-Gic1 complex incubated for 60 min with (A) 0.25 μM, (B) 1.5 μM or (C) 5 μM of Cdc42-GppNHp. (D–F) Representative EM images of the septin-Gic1 complex incubated with 5 µM of Cdc42-GppNHp for (D) 2 min, (E) 15 min and (F) 60 min. Scale bar, 100 nm.
Figure 8
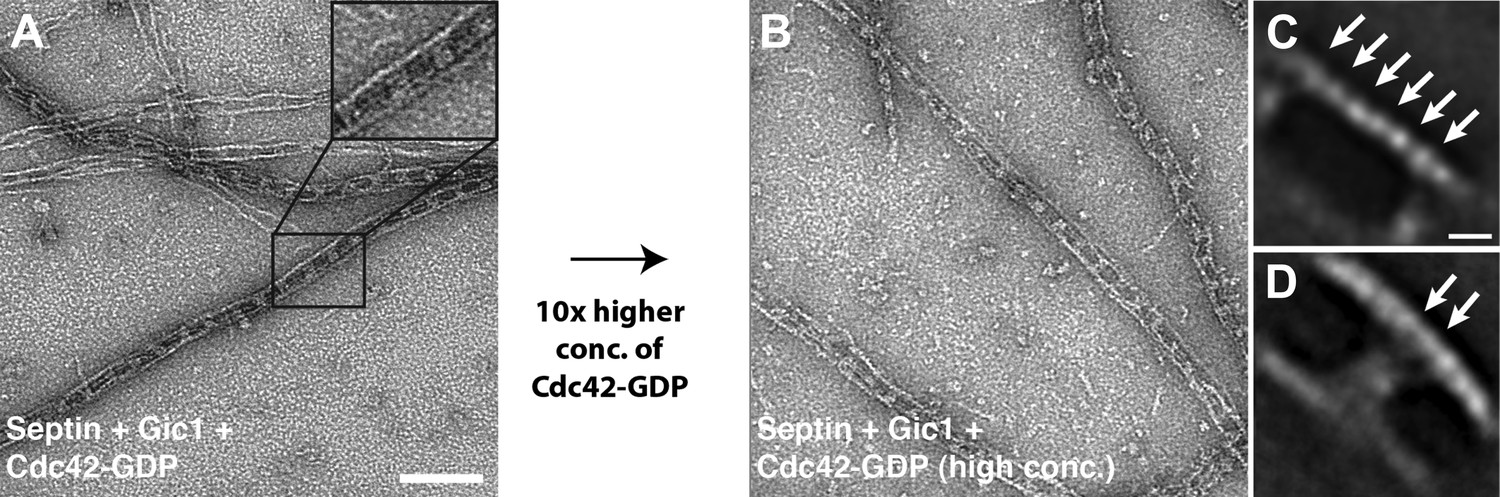
Cdc42-GDP does not interact with septin-Gic1 complexes.
(A) Representative EM image of negatively stained septin-Gic1-Cdc42-GDP complexes. Scale bar, 100 nm. (B) Same as (A) but at 10× higher concentration of Cdc42-GDP. (C and D) Representative class averages of negatively stained septin-Gic1-Cdc42-GDP complexes with focus on septin filaments and the cross-bridges, respectively. Arrows indicate single septin proteins. Scale bar, 10 nm.
Figure 9
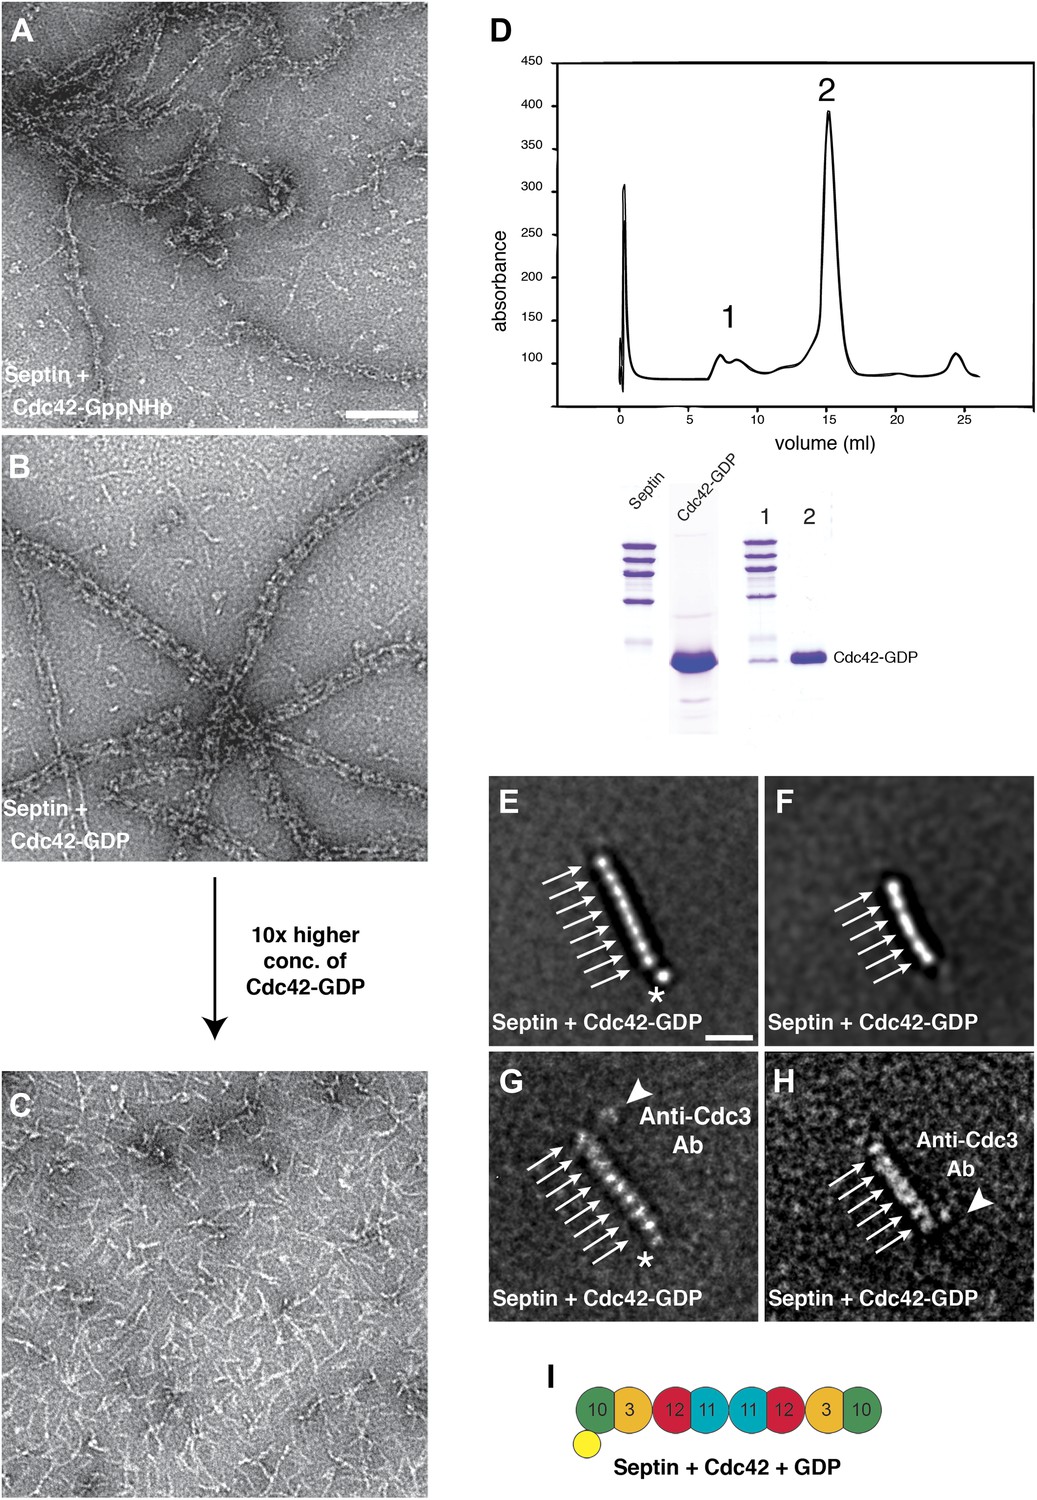
Cdc42-GDP binds specifically to Cdc10 and dissociates septin filaments.
(A) Representative EM image of negatively stained septin complexes incubated with Cdc42-GppNHp. Scale bar, 100 nm. (B) Representative EM image of negatively stained septin-Cdc42-GDP-complexes. (C) Same as (B) but at 10× higher concentration of Cdc42-GDP. (D) Gel filtration chromatography and SDS-PAGE of the septin-Cdc42-GDP complex. (E and F) Representative class averages of septin-Cdc42-GDP complexes. The asterisk indicates the additional density corresponding to Cdc42-GDP. Arrows indicate single septin proteins. Scale bar, 10 nm. (G and H) Representative class averages of the septin-Cdc42-GDP complex labeled with antibody against Cdc3. The asterisk indicates the additional density corresponding to Cdc42-GDP. Arrows indicate single septin proteins. The triangle indicates the antibody. (I) Model of the septin-Cdc42-GDP complex. Cdc42-GDP is depicted as yellow circle.
Figure 10
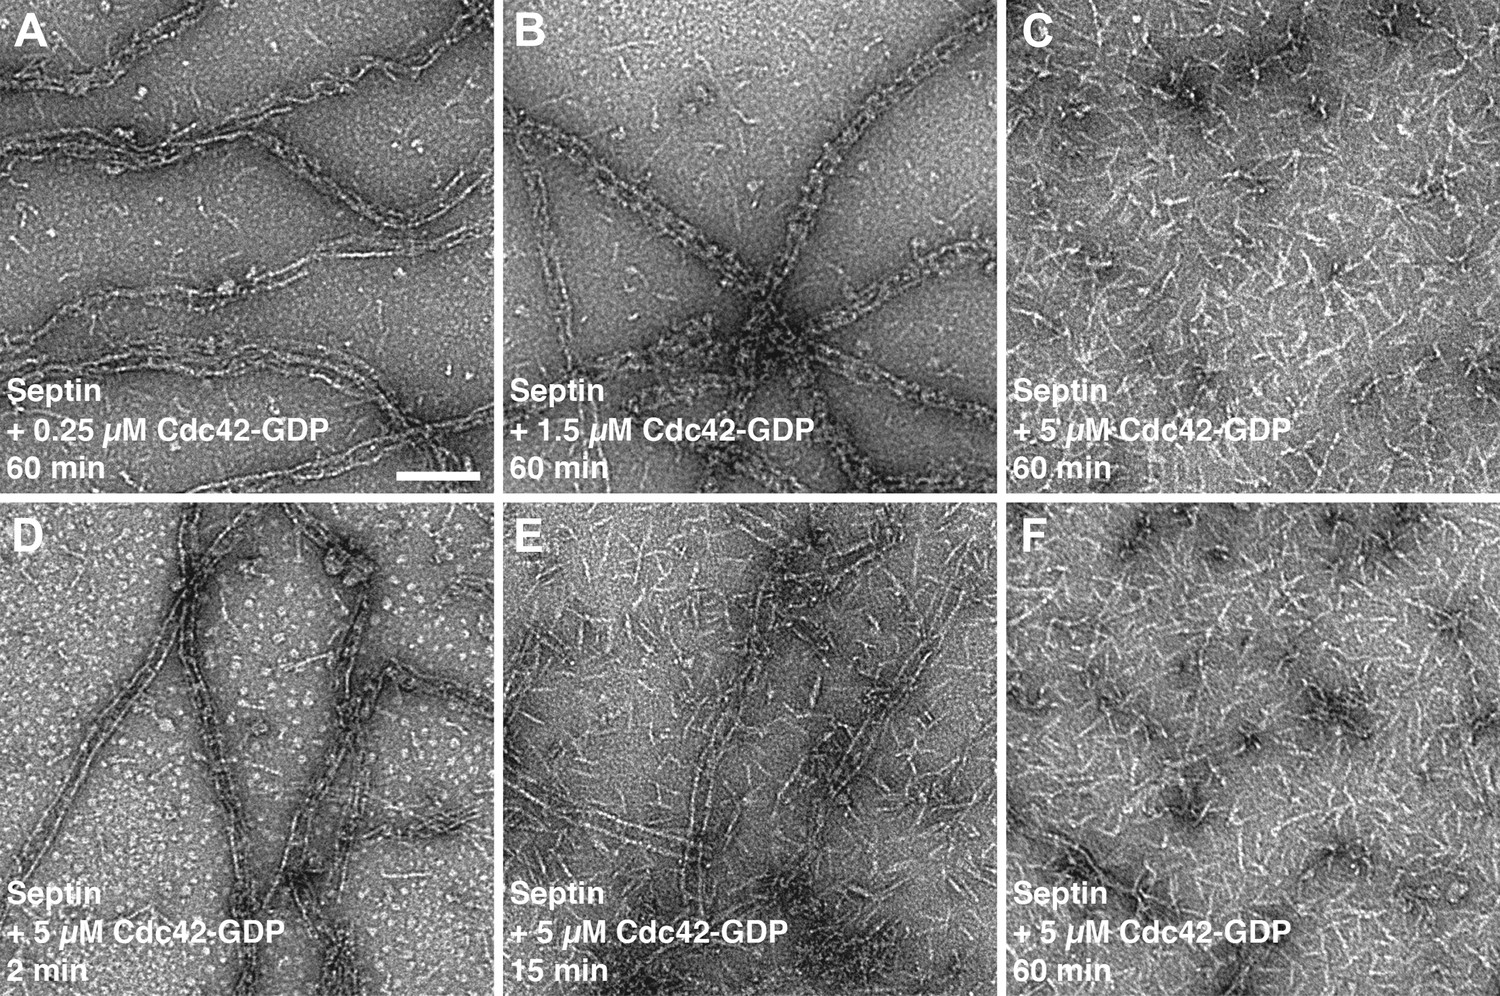
Time- and concentration-dependent interaction of Cdc42-GDP with septin filaments.
(A–C) Representative EM images of septin filaments incubated for 60 min with (A) 0.25 μM, (B) 1.5 μM or (C) 5 μM of Cdc42-GDP. (D–E) Representative EM images of septin filaments incubated with 5 µM of Cdc42-GDP for (D) 2 min, (E) 15 min and (F) 60 min. Scale bar, 100 nm.
Figure 11
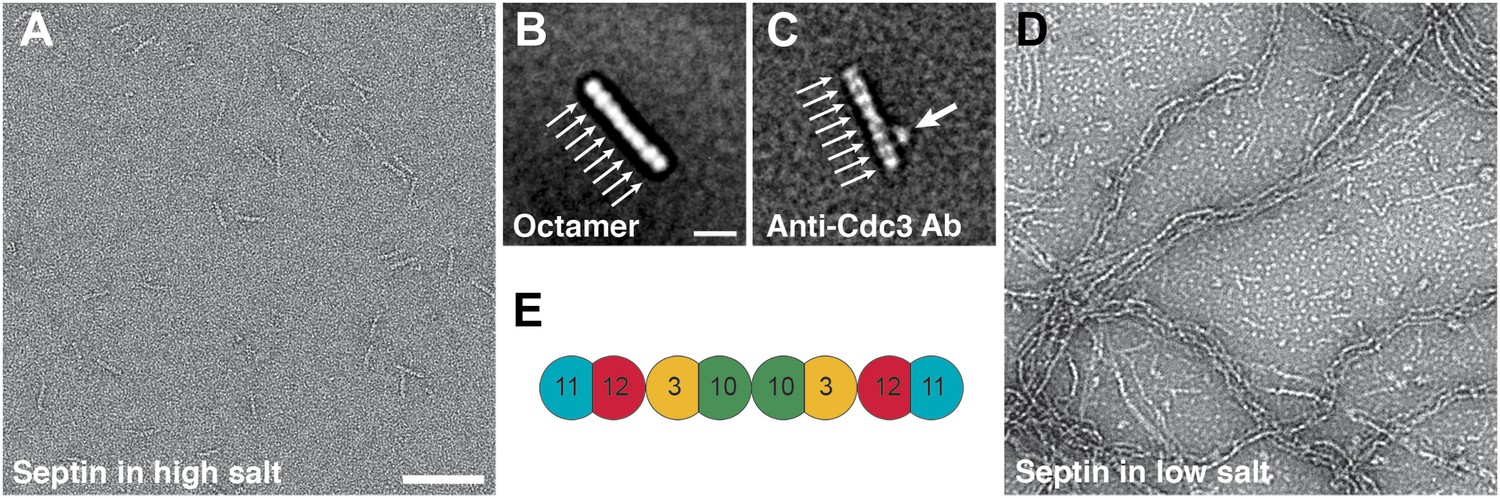
Septin polymerization depends on the ionic strength.
(A and B) Representative EM images and class averages of septin complexes at high-salt (500 mM NaCl) labeled with antibody against Cdc3 (C) and low-salt (100 mM NaCl) (D) conditions. Arrows indicate single septin proteins. Scale bars, B = 100 nm, D = 10 nm. (E) Model of the septin complex based on the known sequential order of septin filaments. The G- and the N/C-interfaces are indicated by straight and circular interfaces between circles, respectively.
Figure 12
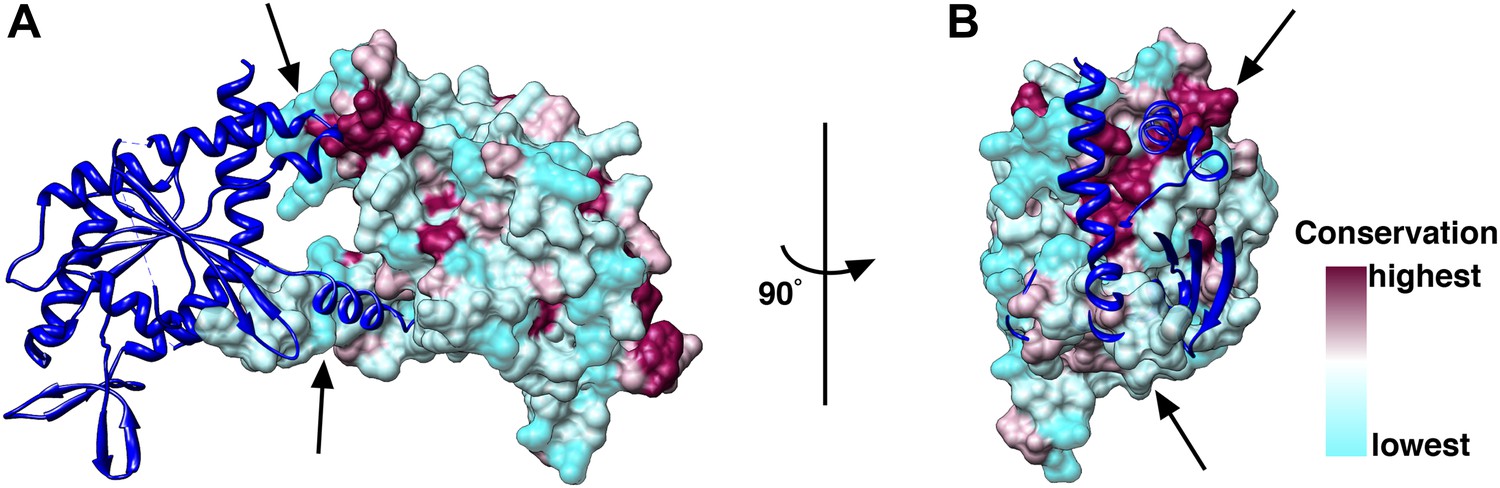
Conservation of the N/C interface between Cdc3, Cdc10, Cdc11 and Cdc12.
(A and B) Side (A) and end-on views (B) of the N/C interface between two Cdc10 septins. Homology models of Cdc3, Cdc10, Cdc11 and Cdc12 using the SEPT2 structure (PDB 2QA5) as reference were calculated using Phyre2 (Kelley and Sternberg, 2009). The models were aligned in Chimera (Pettersen et al., 2004) using the SEPT2/6/7 complex (PDB 2QAG) as reference. The sequences of Cdc3, Cdc10, Cdc11 and Cdc12 were aligned using ClustalW (Larkin et al., 2007) and the conservation between the four septins was mapped on their surfaces.
Figure 13

Gic1 but not Cdc42-GDP binds to polymerization impaired septin complexes.
(A–C) Representative EM image and class averages of polymerization-impaired septin complexes containing Cdc10(30-322). Scale bars, 100 nm in (A) and 10 nm in (B). (D–F) Representative EM image and class averages of polymerization-impaired septin complexes containing Cdc10(30-322) + Cdc42-GDP. (G) Gel filtration chromatography and SDS-PAGE of septin-Cdc10(30-322) and Cdc42-GDP. (H–J) Representative EM image and class averages of septin-Cdc10(30-322)-Gic1 complexes. The asterisk indicates the additional density corresponding to Gic1. (K) Gel filtration chromatography and SDS-PAGE of the septin-Cdc10(30-322)-Gic1 complex. (L) Model of the septin-Cdc42-GDP complex. Gic1 is depicted as blue oval. Arrows indicate single septin proteins.
Figure 14
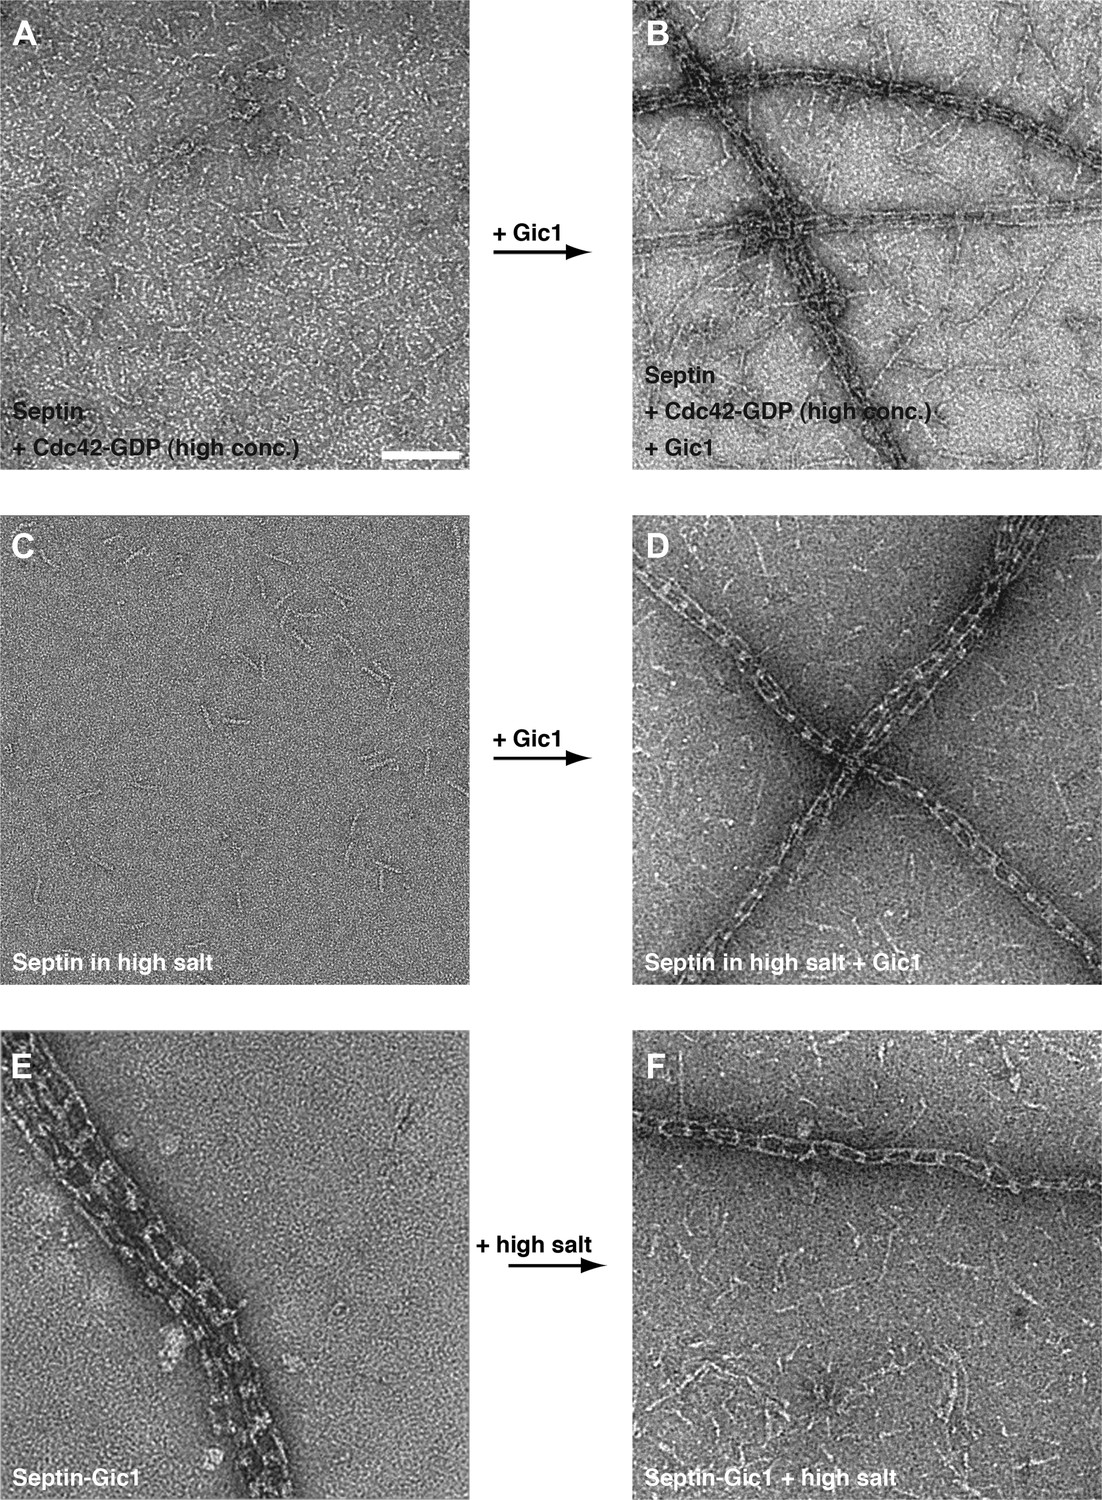
Gic1 stabilizes septin filaments.
(A–D) Representative EM images of septin-Cdc42-GDP complexes and septin octamers in high-salt buffer before (A and C) and after incubation with Gic1 (B and D), respectively. Scale bar, 100 nm. (E and F) Representative EM images of the septin-Gic1 complex before (E) and after increasing the salt concentration (F), respectively.
Figure 15
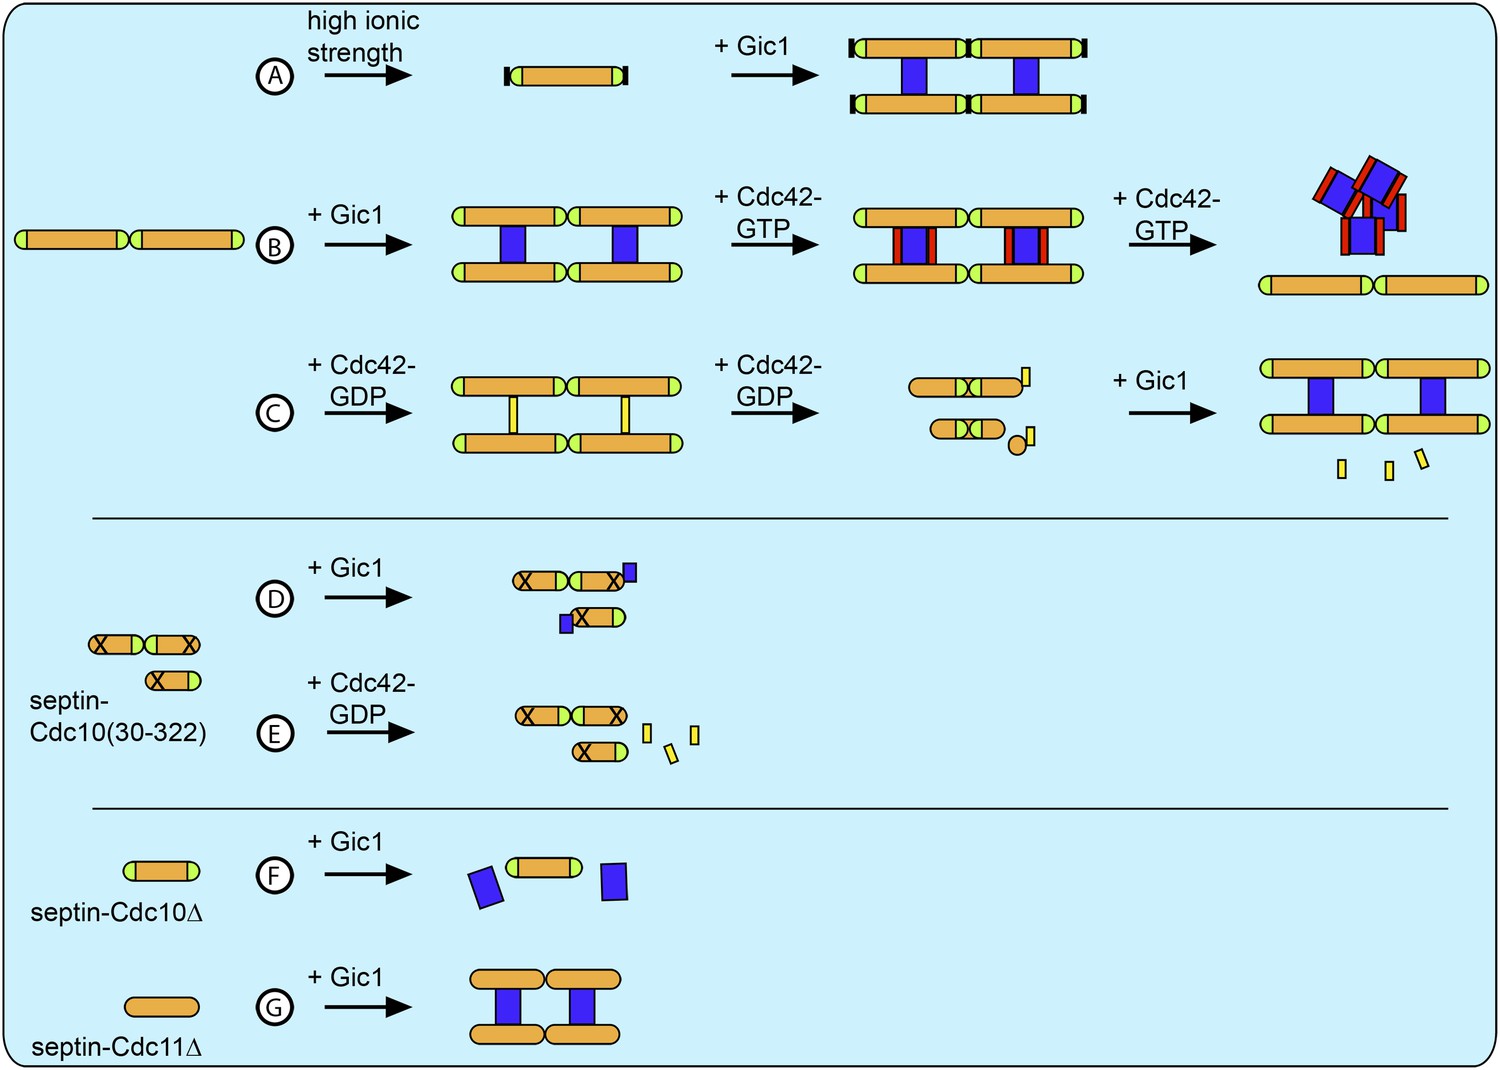
Schematic overview of all results.
(A) At high ionic strength septin filaments disassemble into octamers (Figure 11). However, when Gic1 is added, septin-Gic1 filament cables are formed even at high-salt concentrations (Figure 14). (B) Gic1 binds specifically to Cdc10 and thereby scaffolds and stabilizes septin filaments forming long filament cables (Figures 1 and 2). Cdc42-GTP binds specifically to Gic1 resulting in a Cdc42-GTP-Gic1 complex (Figures 5 and 6). However, at higher Cdc42-GTP concentrations, the Gic1-septin interaction is negatively influenced and results in the dissociation of the complex (Figure 6). (C) Cdc42-GDP interacts with Cdc10 and binds specifically to septin filaments (Figure 9). However, at higher Cdc42-GDP concentrations, the complex dissociates into octamers with Cdc42-GDP bound to Cdc10 and Cdc10-less hexamers (Figure 9). Gic1 displaces Cdc42-GDP and septin-Gic1 filament cables are formed (Figure 14). (D and E) The polymerization of septin complexes containing Cdc10(30-322) is impaired. (D) Gic1 still binds to Cdc10, however, does not cross-bridge complexes and septins do not polymerize (Figure 13). (E) Cdc42-GDP does not bind to septin-Cdc10(30-322) (Figure 13). (F) Gic1 does not bind to polymerization-impaired septin-Cdc10Δ complexes (Figure 2). (G) Gic1 binds to polymerization-impaired septin-Cdc11Δ complexes resulting in septin polymerization and formation of septin-Gic1 filament cables (Figure 2). Septins are depicted as orange rods. Green caps indicate Cdc11. Gic1 is depicted as blue rectangle. Cdc42-GTP and Cdc42-GDP are depicted as red and yellow rectangles, respectively. The N-terminal truncation of Cdc10 is marked by a cross and the destabilization of the Cdc11-Cdc11 N/C interface is indicated by a black block.
Figure 16
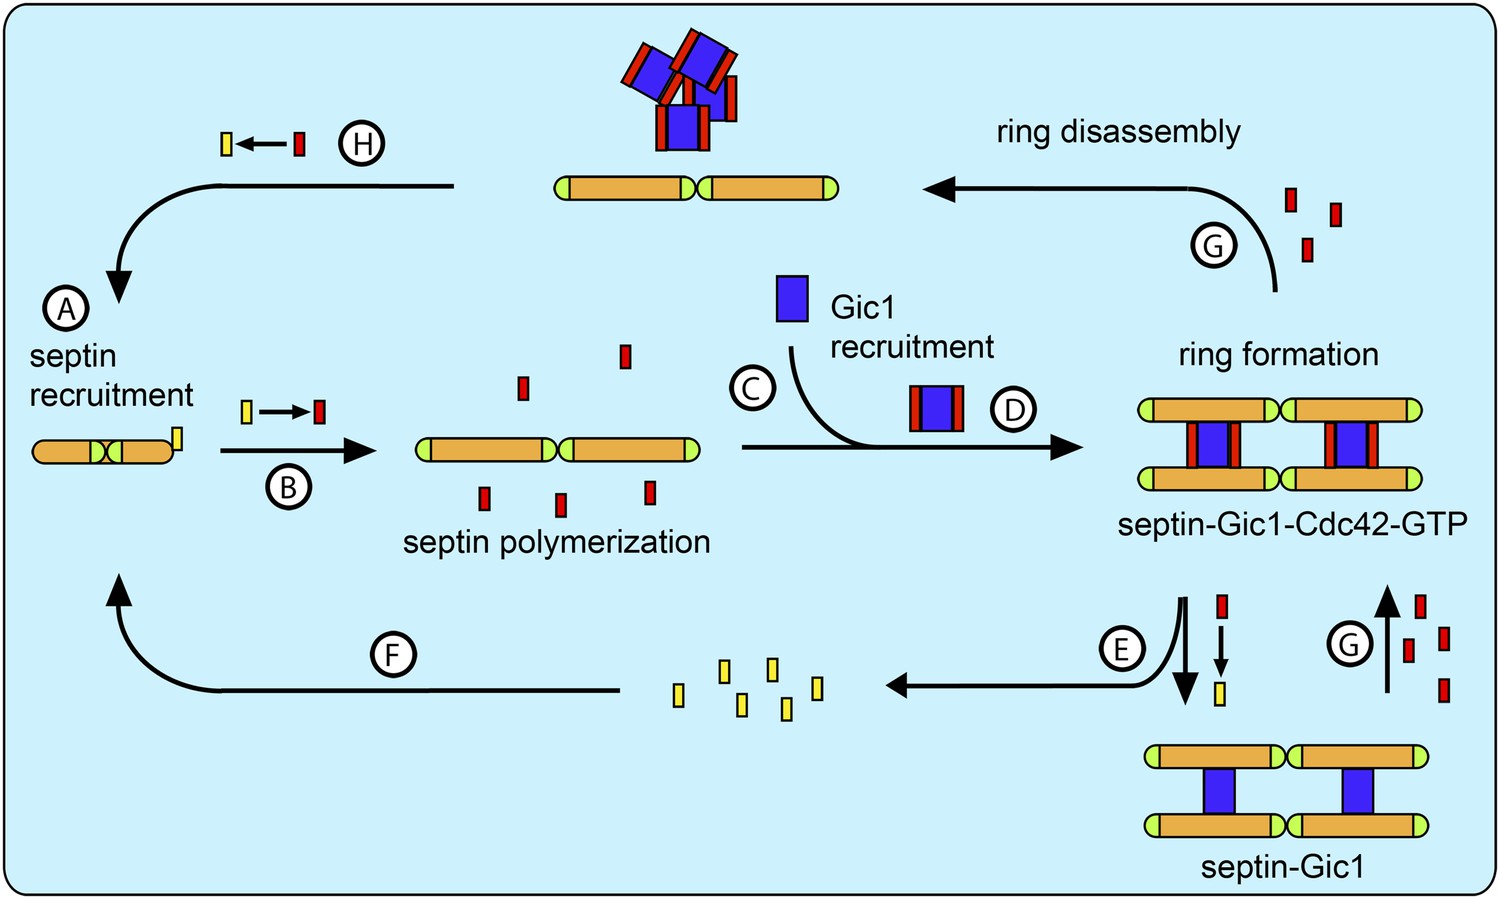
Model for septin recruitment, ring formation and disassembly.
(A) Cdc42-GDP recruits septin complexes to the bud site. (B) At the bud site Cdc24 catalyzes the nucleotide exchange of Cdc42, which recruits its effector Gic1. (C) Septins polymerize. (D) Gic1 scaffolds and stabilizes septin filaments and forms septin-Gic1-Cdc42-GTP filament cables that are used for building the septin ring. (E) Cdc42-GTP is not necessary for the stability of the filament cables and upon GTP hydrolysis dissociates from the septin-Gic1 complexes. (F) Cdc42-GDP recruits more septin complexes to the bud site. (G) During cell division the local concentration of Cdc42-GTP increases by the up-regulation of Cdc24. This leads to a dissociation of the septin-Gic1-Cdc42-GTP filament cables and the septin ring disassembles. (H) After Cdc42-GAP catalyzed hydrolysis, Cdc42-GDP binds to the septin filaments and disassembles them to octamers. Septins are depicted as orange rods. Green caps indicate Cdc11. Gic1 is depicted as a blue rectangle. Cdc42-GTP and Cdc42-GDP are depicted as red and yellow rectangles, respectively.
Figure 17
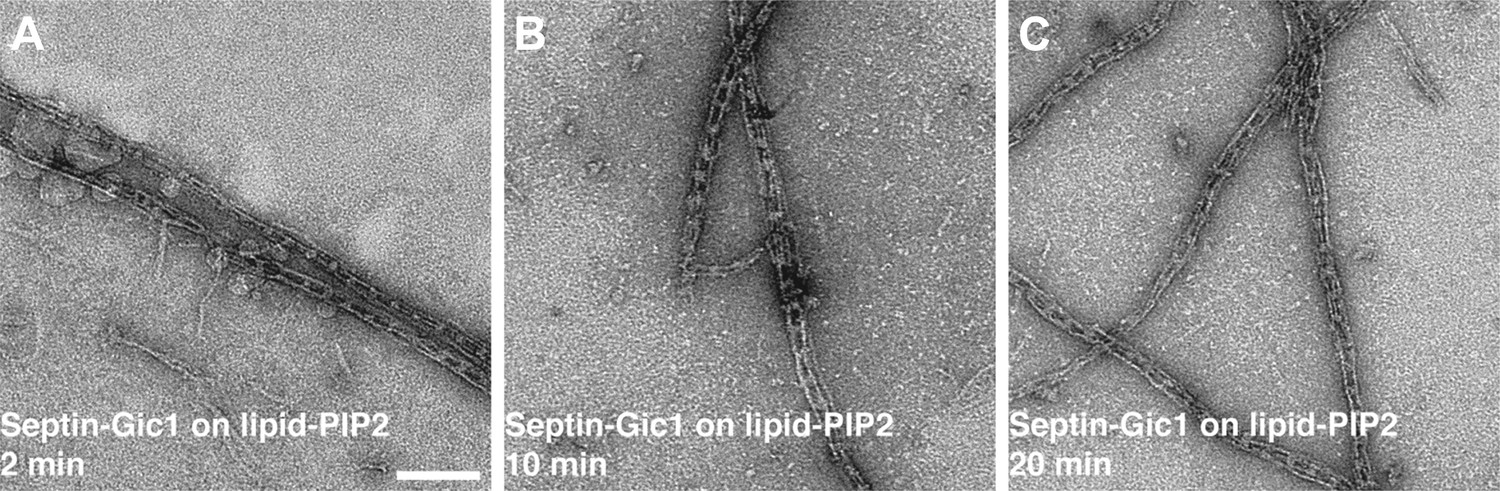
Septin-Gic1 complexes immobilized on a PIP2-containing lipid monolayer.
(A–C) Representative EM image of negatively stained septin-Gic1 complexes immobilized on a PIP2-containing monolayer. Scale bar, 100 nm.
Figure 18
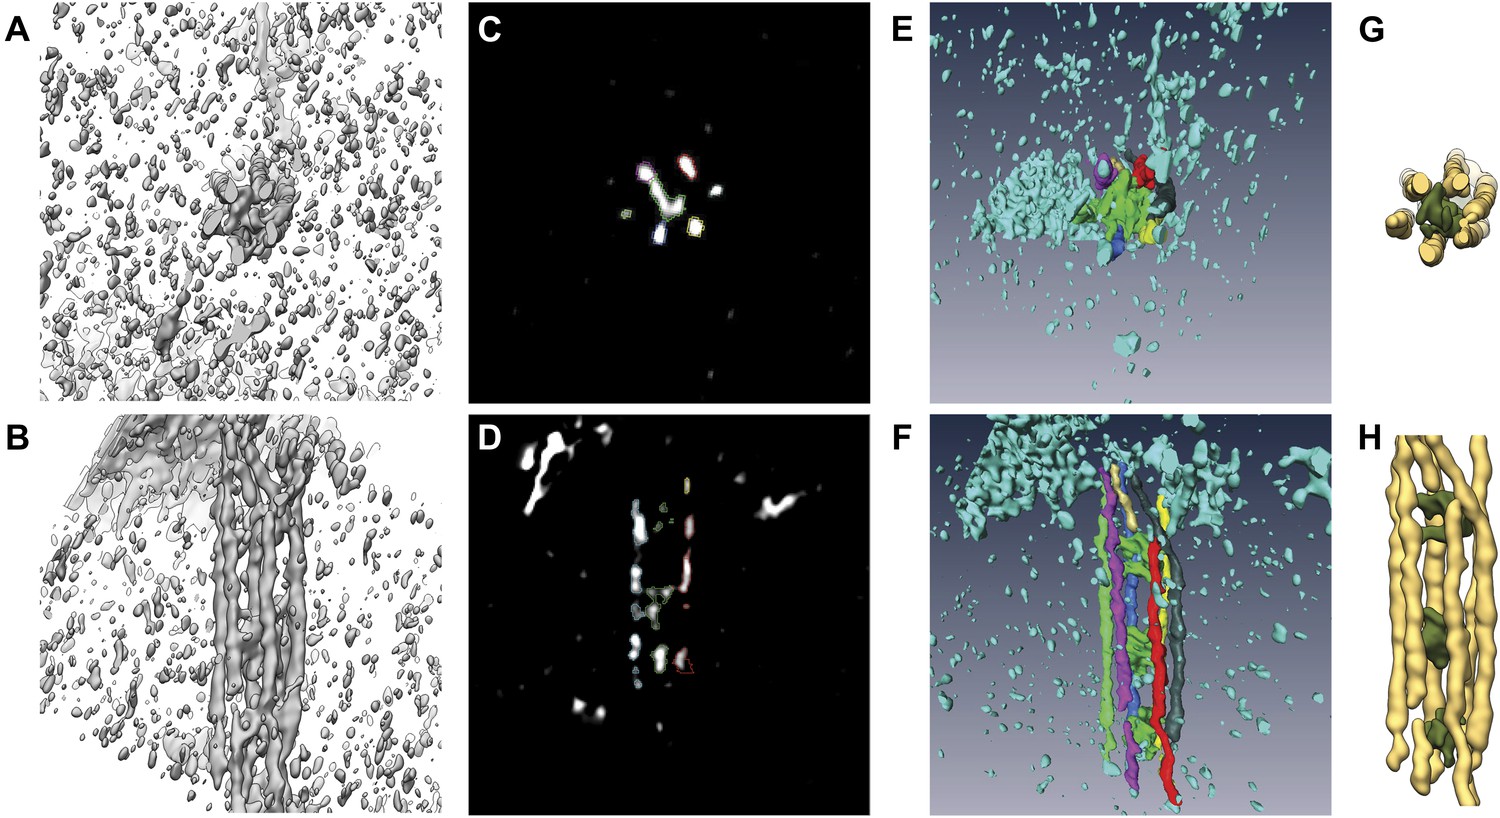
Processing of subtomograms.
(A and B) Top and side view of a representative raw subtomogram filtered to 30 Å, respectively. (C and D) Segmentation in Amira (Stalling et al., 2005). Top and side view of representative slices with selected densities, respectively. (E and F) Top and side view of three-dimensionally rendered segments in Amira, respectively. (G and H) Top and side view of masked raw densities filtered to 40 Å using the Amira derived segments as masks.
Figure 19
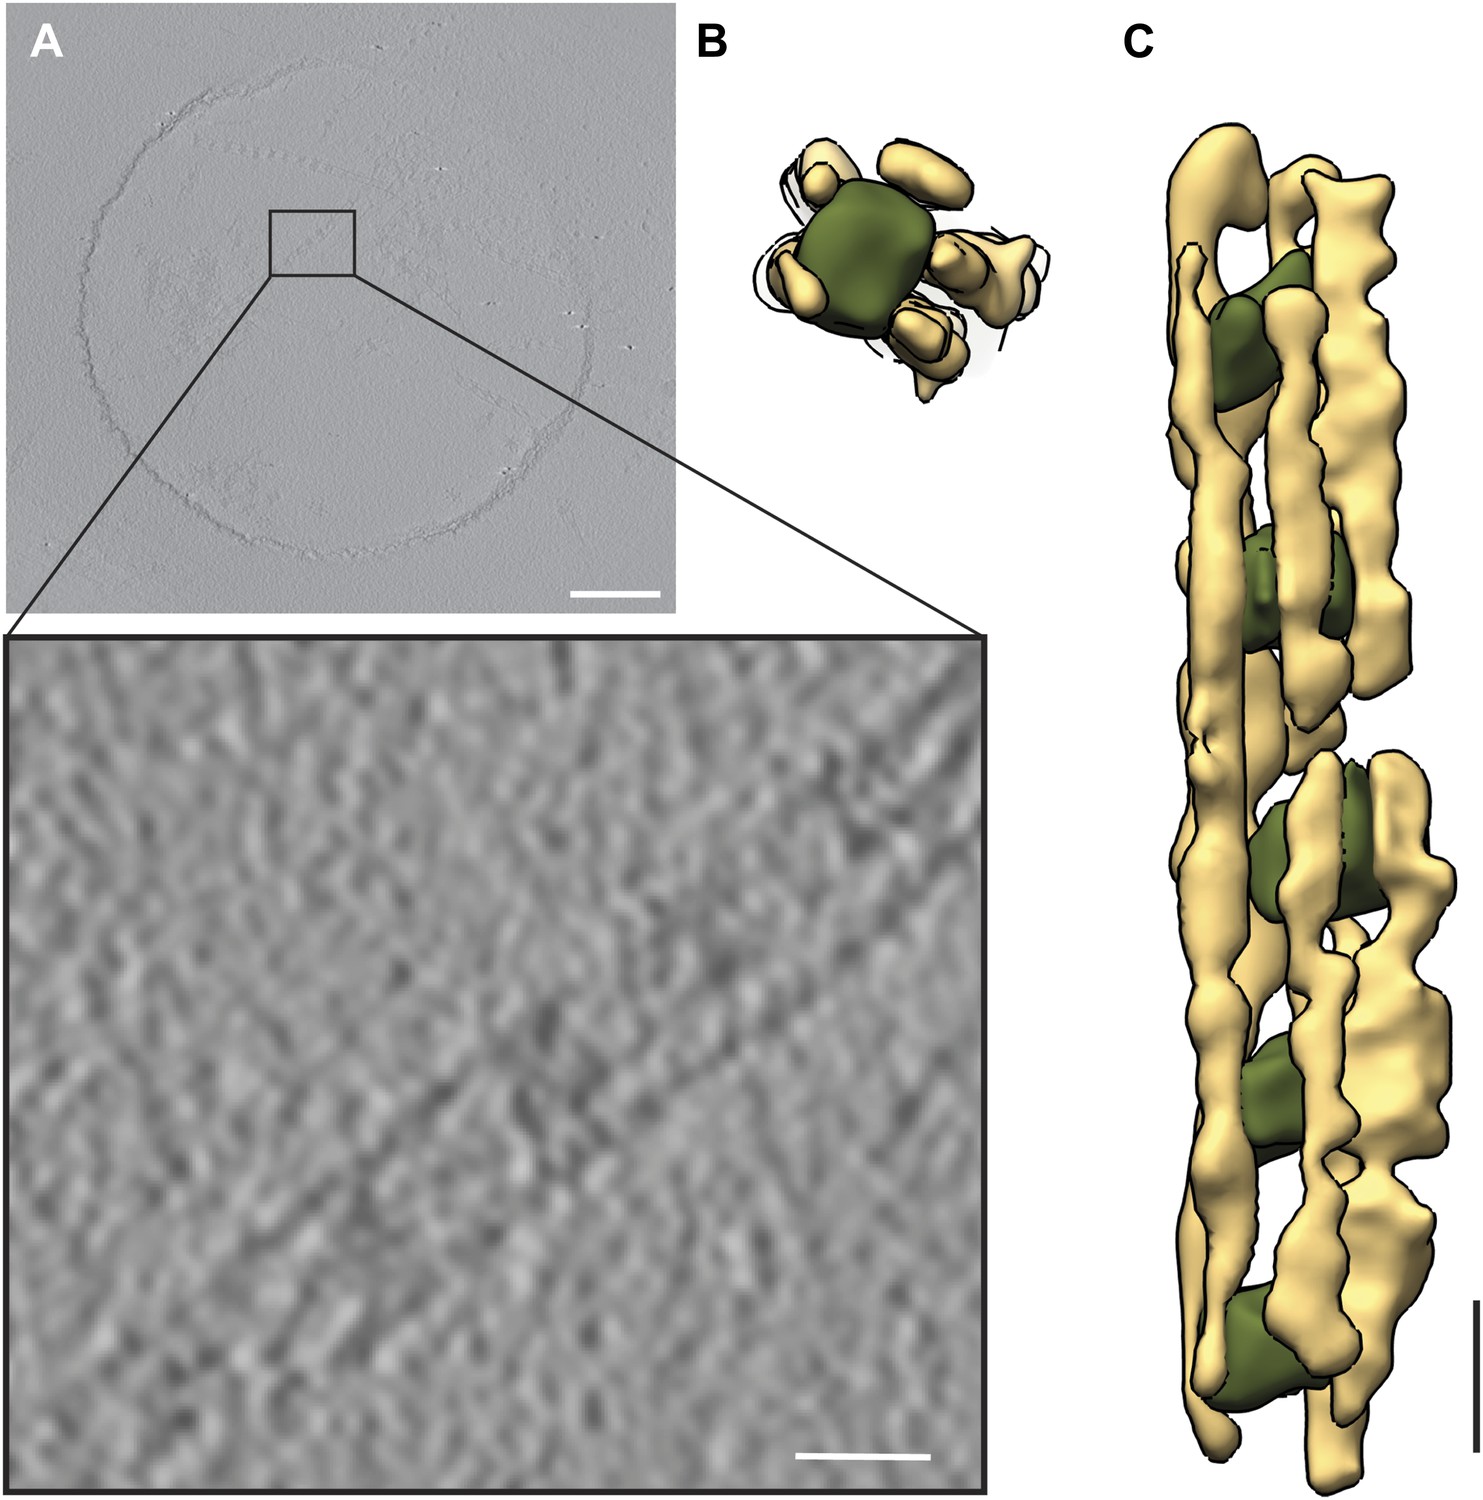
Tomography of septin-Gic1-Cdc42 complexes running parallel to the tilt-axis.
(A) Central slice of representative tomogram of septin-Gic1-Cdc42 complexes. A railroad-like complex running parallel to the tilt axis was extracted (see inset). Scale bars, 200 nm. (B and C) Top (B) and side view (C) of a septin-Gic1-Cdc42-GppNHp complex. The septin filaments and Gic1-Cdc42-GppNHp cross-bridges are depicted in gold and green, respectively. Scale bar, 20 nm.
Figure 20
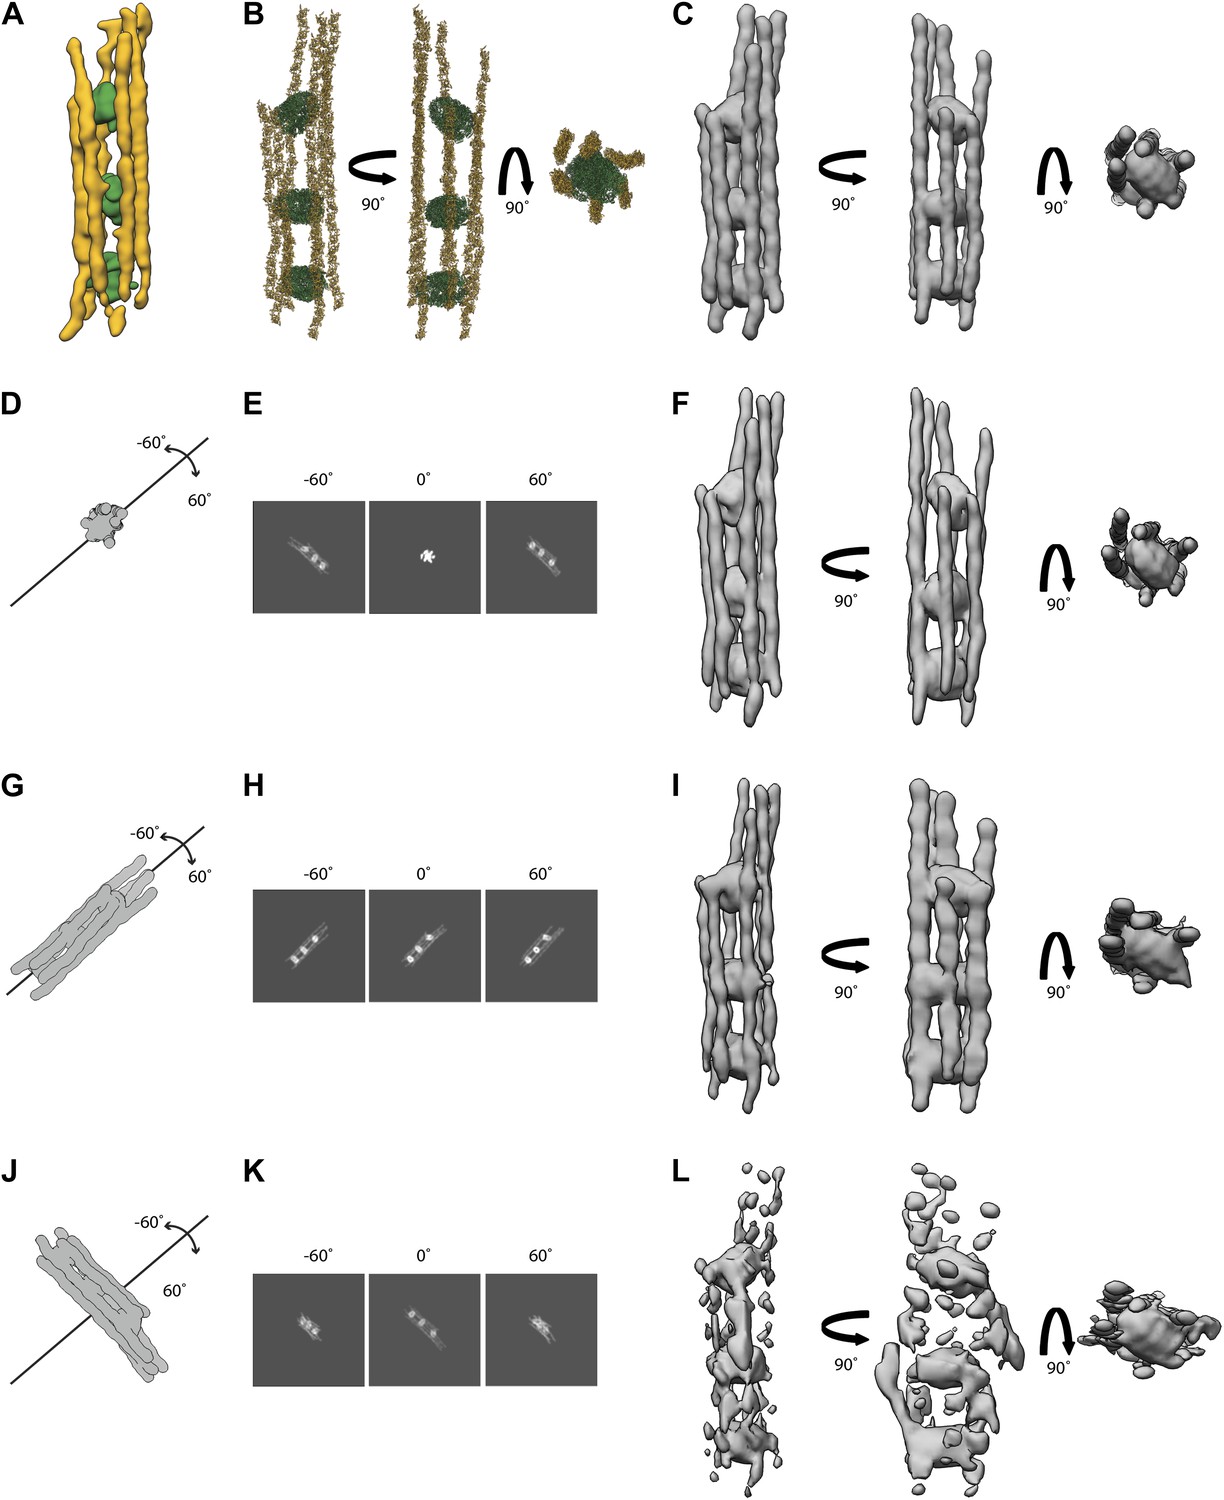
Simulations of electron tomograms of septin-Gic1-Cdc42-GppNHp complexes.
(A) Side view of a septin-Gic1-Cdc42-GppNHp subtomogram. The septin filaments and Gic1-Cdc42-GppNHp cross-bridges are depicted in gold and green, respectively. (B) Model of a septin-Gic1-Cdc42-GppNHp complex obtained by fitting the crystal structure of the mammalian septin trimer (PDBid: 2QAG, gold) and GROEL/GROES (PDBid: 1AON, green) into (A), shown in three different orientations. (C) Simulated EM density map of (B) at a resolution of 45 Å. (G–L) Simulations of electron tomograms obtained by tilting the model shown in (C) in the range of ±60 in 2° increments with its long axis running parallel to the beam (D), parallel (G) and perpendicular (J) to our microscope’s tilt axis, respectively. (E, H, and K) Corresponding projections at −60°, 0°, 60° and (F, I, and L) the resulting simulated tomograms, respectively. Note that the tomograms shown in (I and L) are obviously affected by missing wedge artifacts, whereas the tomogram in (F) (long axis of the molecule parallel to the beam axis during tilting) is only slightly stretched in comparison to the original model (C).
Figure 21
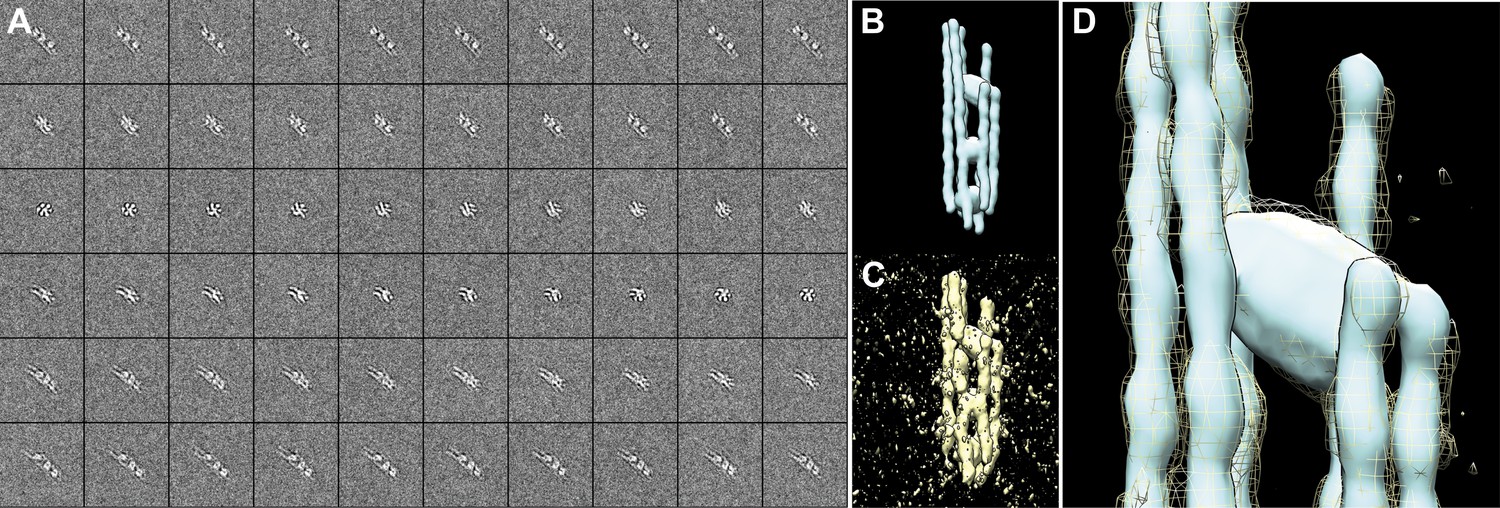
Electron tomogram simulation of septin-Gic1-Cdc42-GppNHp with CTF and noise added.
(A) Projections of the model shown in (B) in the range of ±60° in 2° increments, after applying the CTF at a defocus of 4 µm and addition of noise. Note that at 0°, the long axis of the model was running in the z direction (Figure 19D). (B) Original model used for generating the reprojections (Figure 19F). (C) Reconstruction obtained by back-projecting the images shown in (A). (D) Fitting of the simulated tomographic reconstruction (yellow mesh) into the original model (cyan surface).
Author response image 1
Septin-Gic1-GST complexes.
Author response image 2
Complexes between Gic1 and septin filaments containing Cdc3-EGFP.
(A-B) Representative EM images of negatively stained septin filaments containing Cdc3-EGFP polymerized by dialysis alone (A) or together with Gic1 (B). Scale bar, 100 nm. (C-D) Representative class averages with focus on the Gic1 cross-bridges (C) and the septin-EGFP filaments (D). Arrows indicate single septin proteins. Scale bar, 10 nm. (E) Model of the septin-Gic1 complex based on the known sequential order of septin filaments (Bertin et al. 2008). The G- and the N/C-interfaces are indicated by straight and circular interfaces between circles, respectively. EGFP is indicated as light green ovals.
Author response image 3

Cross-bridges between bare septin filaments.
(A) Very high concentration of septin filaments. (B) Low concentration of septin filaments. Note, due to negative staining the thin cross-bridges between bare septin filaments mediated by the C-terminal extensions of Cdc3 and Cdc12 can only rarely be visualized. Scale bar, 100 nm.
Videos
Video 1
Video through a cryo electron tomogram of the septin-Gic1 complex with bundles running perpendicular to the beam.
https://doi.org/10.7554/eLife.01085.006
Video 2
Video through a cryo electron tomogram of the septin-Gic1 complex with bundles running parallel to the beam (indicated by an arrow).
https://doi.org/10.7554/eLife.01085.007
Video 3
Close-up on a septin-Gic1 complex running parallel to the beam (full tomogram see Video 2).
https://doi.org/10.7554/eLife.01085.008
Video 4
Video of the 3D reconstruction of the septin-Gic1 complex derived from tomograms of vitrified samples.
https://doi.org/10.7554/eLife.01085.009
Video 5
Video of the 3D reconstruction of the septin-Gic1-Cdc42-GppNHp complex derived from tomograms of vitrified samples.
https://doi.org/10.7554/eLife.01085.013Download links
A two-part list of links to download the article, or parts of the article, in various formats.
Downloads (link to download the article as PDF)
Open citations (links to open the citations from this article in various online reference manager services)
Cite this article (links to download the citations from this article in formats compatible with various reference manager tools)
The role of Cdc42 and Gic1 in the regulation of septin filament formation and dissociation
eLife 2:e01085.
https://doi.org/10.7554/eLife.01085


