Genetic interactions affecting human gene expression identified by variance association mapping
- Wellcome Trust Sanger Institute, United Kingdom
- NORMENT, KG Jebsen Centre for Psychosis Research, Institute of Clinical Medicine, University of Oslo, Norway
- University of Geneva, Switzerland
- University of Geneva Medical School, Switzerland
- Swiss Institute of Bioinformatics, Switzerland
- King’s College London, United Kingdom
- McGill University, Canada
Figures
Figure 1 with 12 supplements
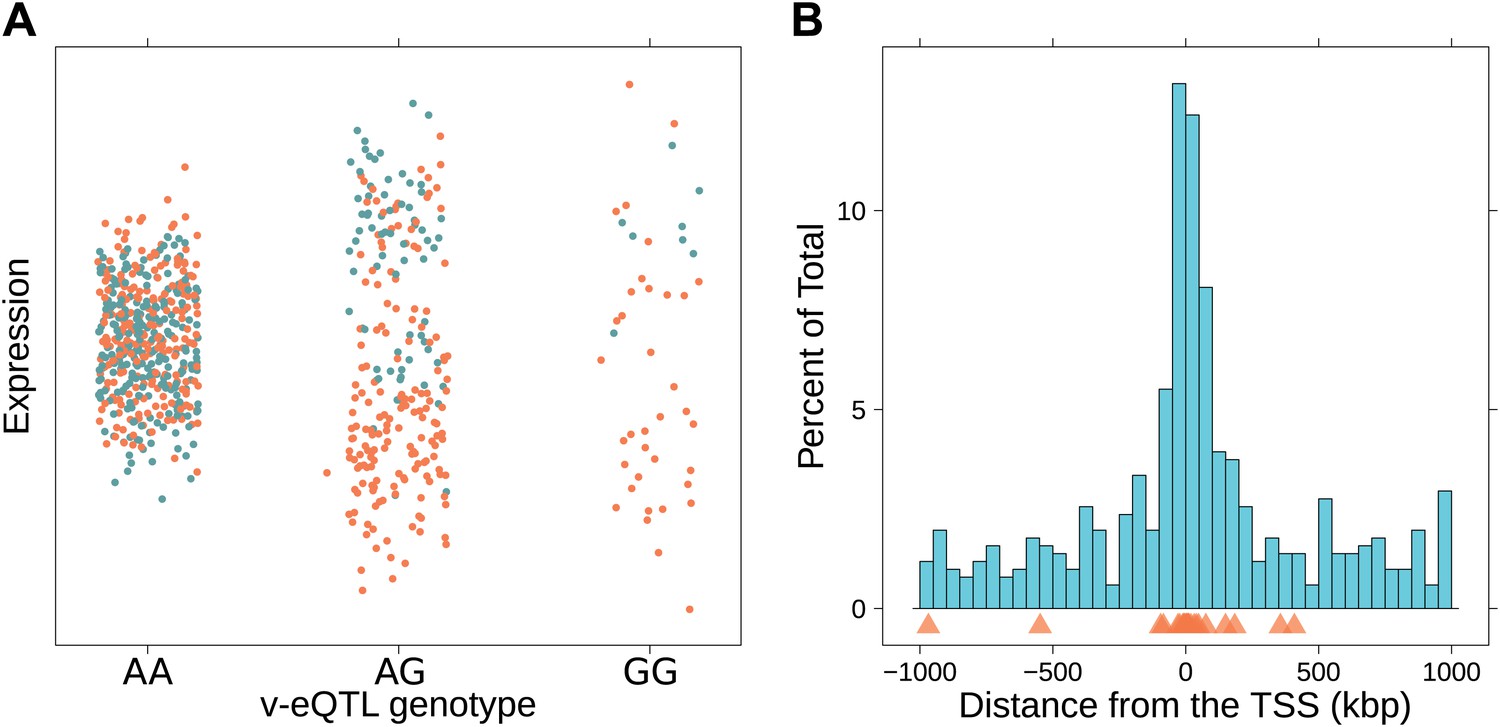
Genotype dependent variance analysis identifies candidate SNPs for interactions. These SNPs cluster close to the transcription start site.
(A) The plot shows expression of the gene TRIT1, broken down by v-eQTL genotype (rs3131691), to illustrate how an interaction can be observed as an increase in variance. The genotype at rs3131691 interacts with the genotype of rs230273. Orange individuals are carriers of the C allele at rs230273, which decreases expression only in the AG and GG genotype groups of rs3131691. Observing only expression conditioned on rs3131691, this induced bimodality increases the variance of the observations within these groups. Jitter has been introduced in the x axis to reduce overplotting. (B) Histogram of distance from transcription start site in kilobases for the 508 peak v-eQTL hits. Figure shows the clustering of the 508 v-eQTL discovered in the TwinsUK cohort around the transcription start site, with downstream of the TSS counted as positive. The orange triangles below mark the positions of the 26 v-eQTL which replicated in the GEUVADIS cohort.
Figure 1—figure supplement 1
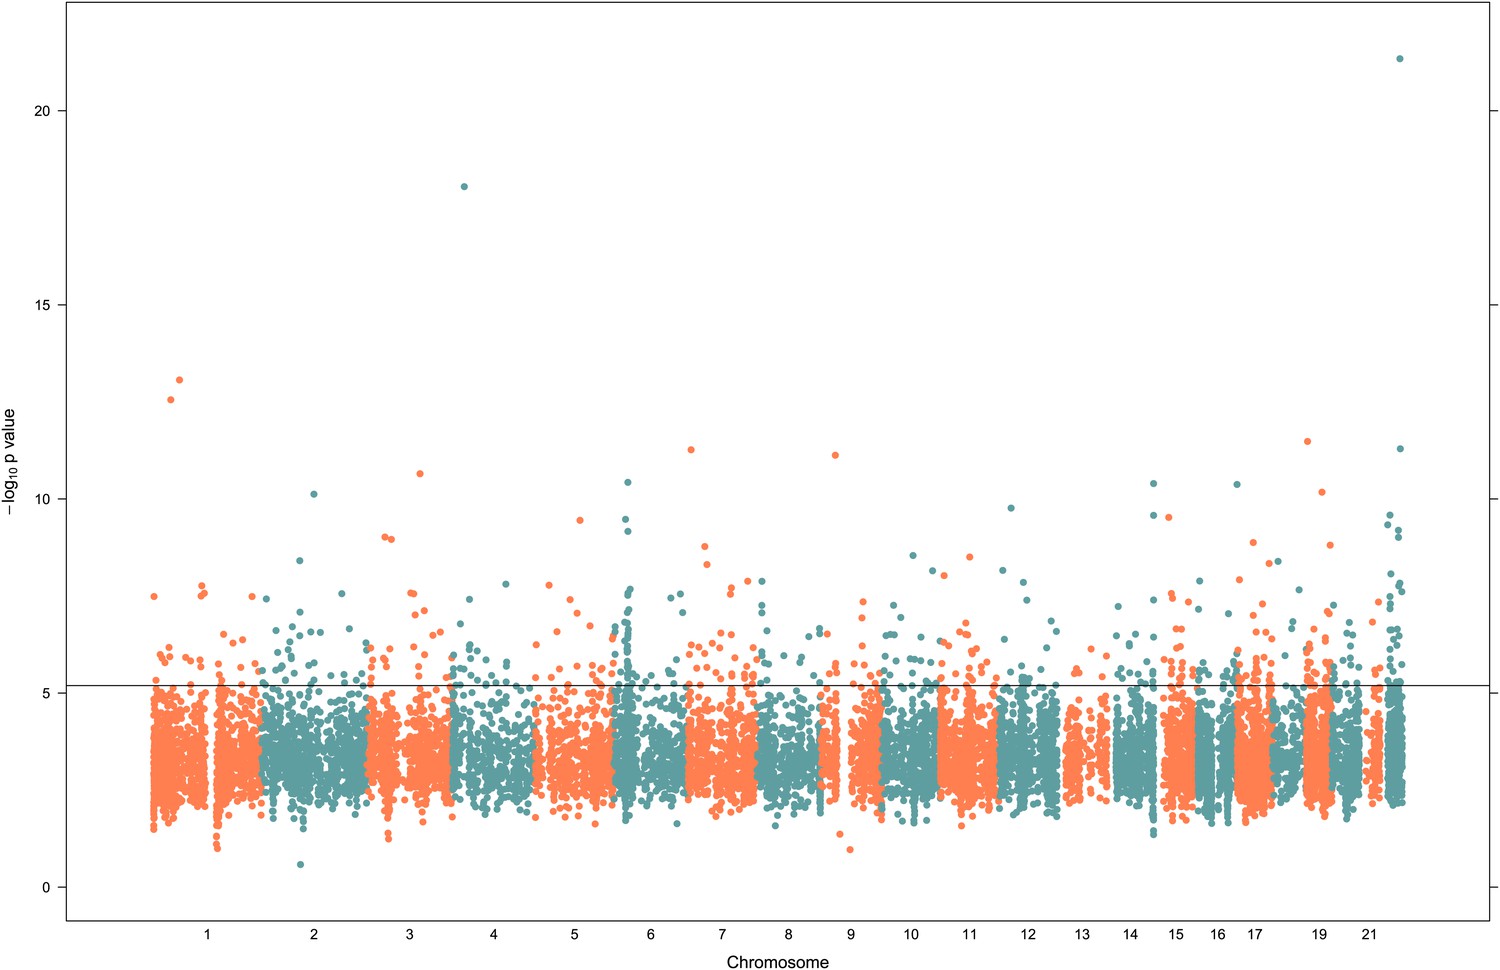
Peak v-eQTL signals for 13,660 genes.
p-values for SNPs associated with variance in gene expression (v-eQTL) are plotted against their genomic position. Horizontal line indicates FDR = 0.05 cut off. Only the most significant v-eQTL for each gene is plotted, explaining isolated signals and there being few signals with p-value >0.01.
Figure 1—figure supplement 2
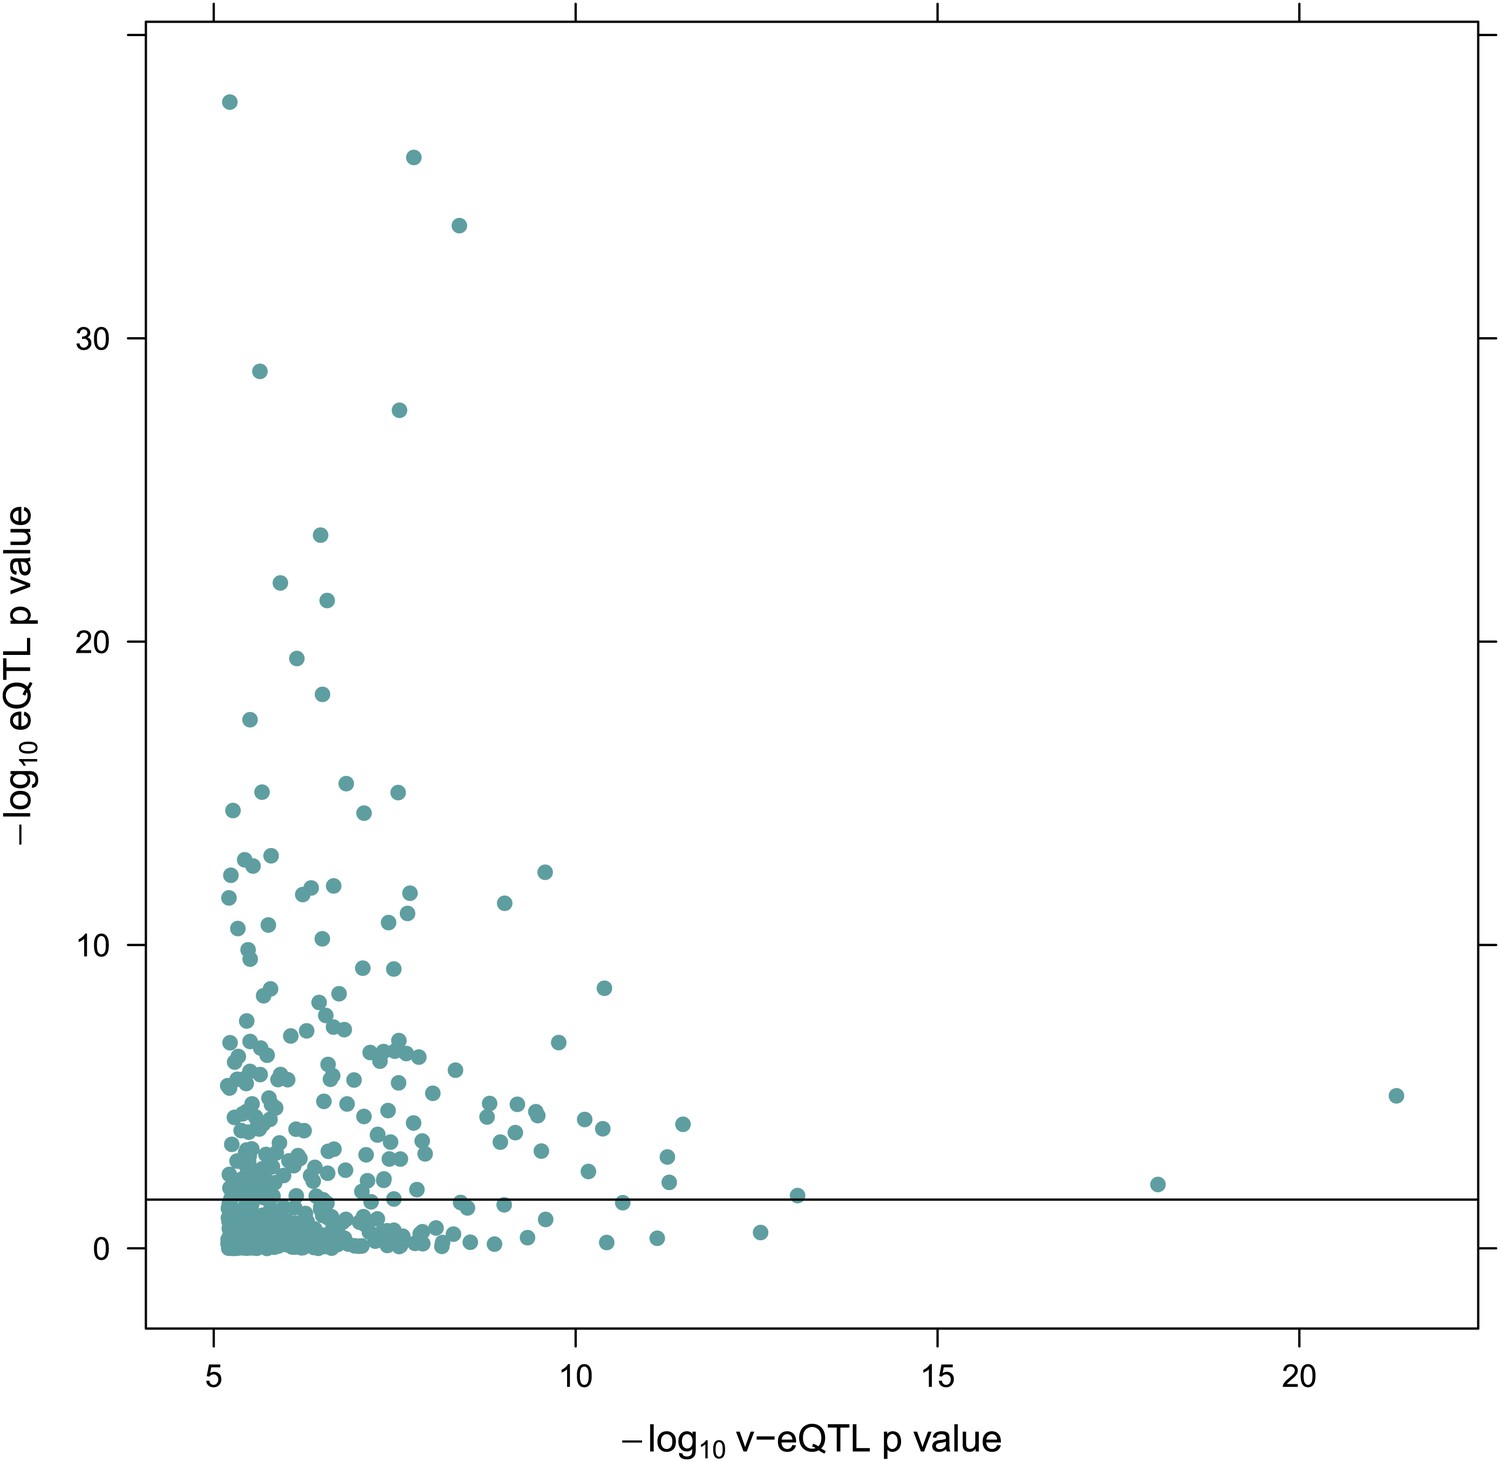
−log10 p value for v-eQTL against–log10 p value for eQTL for 508 v-eQTL hits estimated in the TwinsUK cohort.
https://doi.org/10.7554/eLife.01381.005
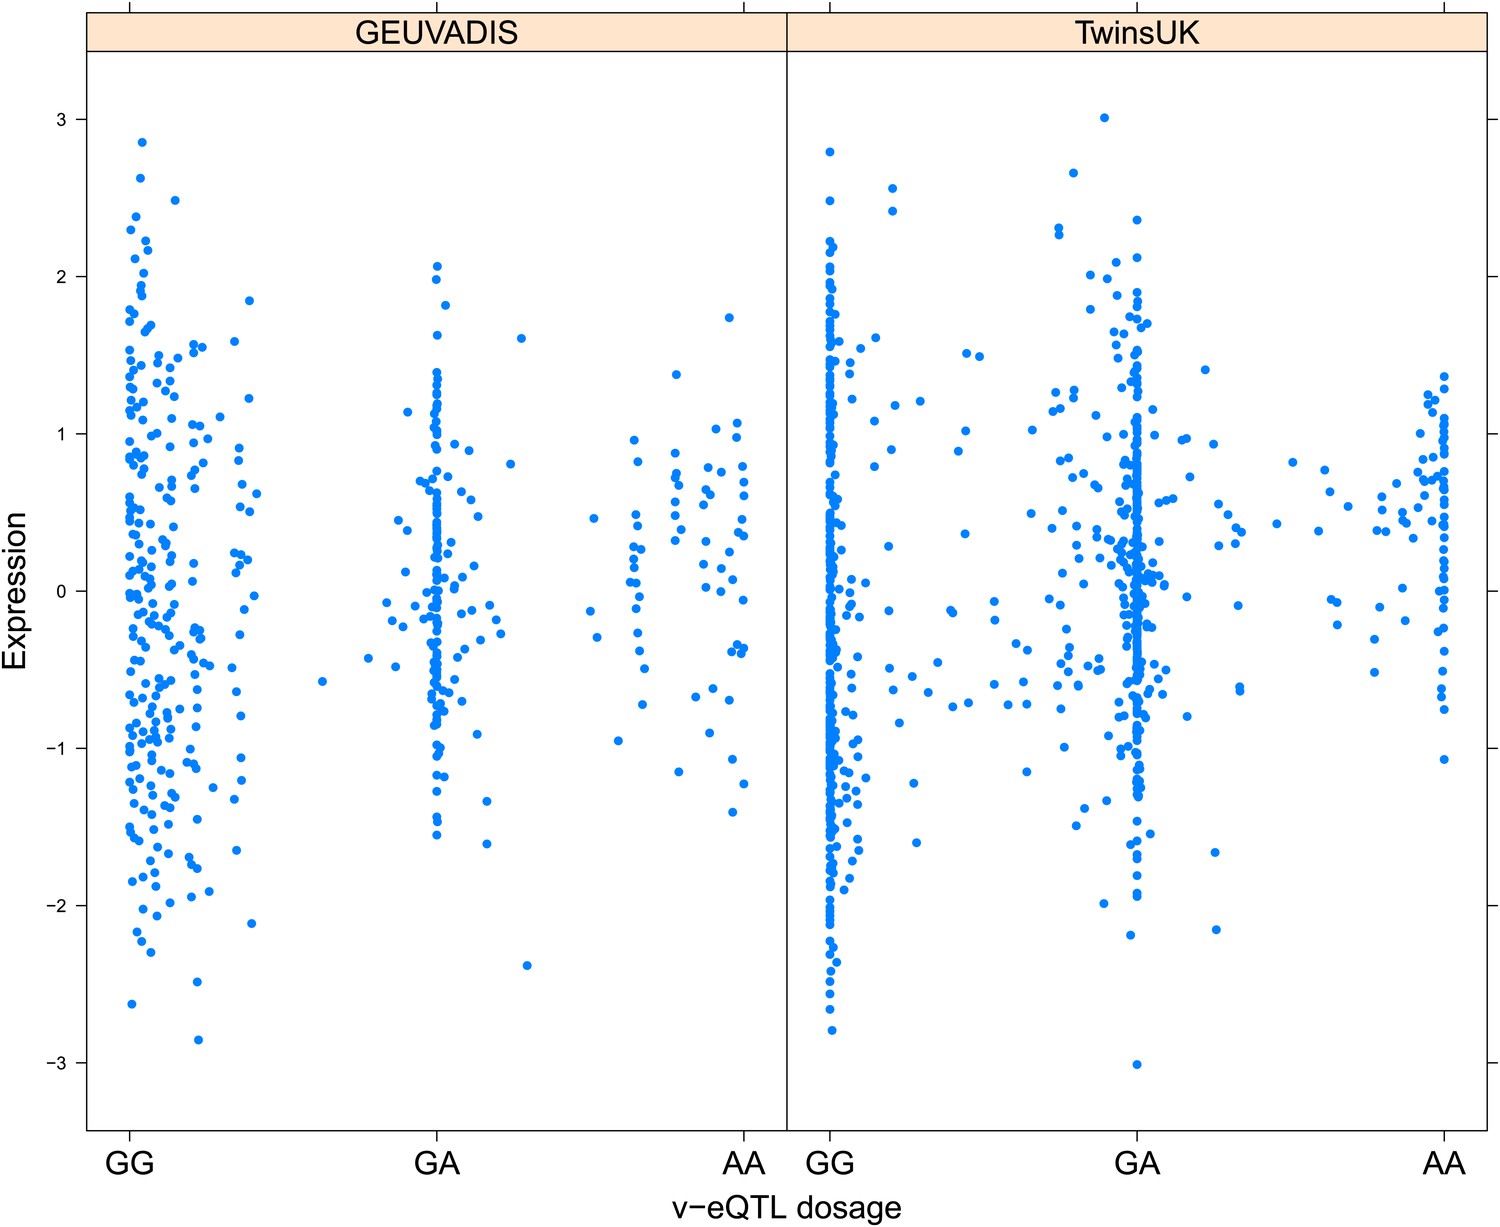
Figure 1—figure supplement 3
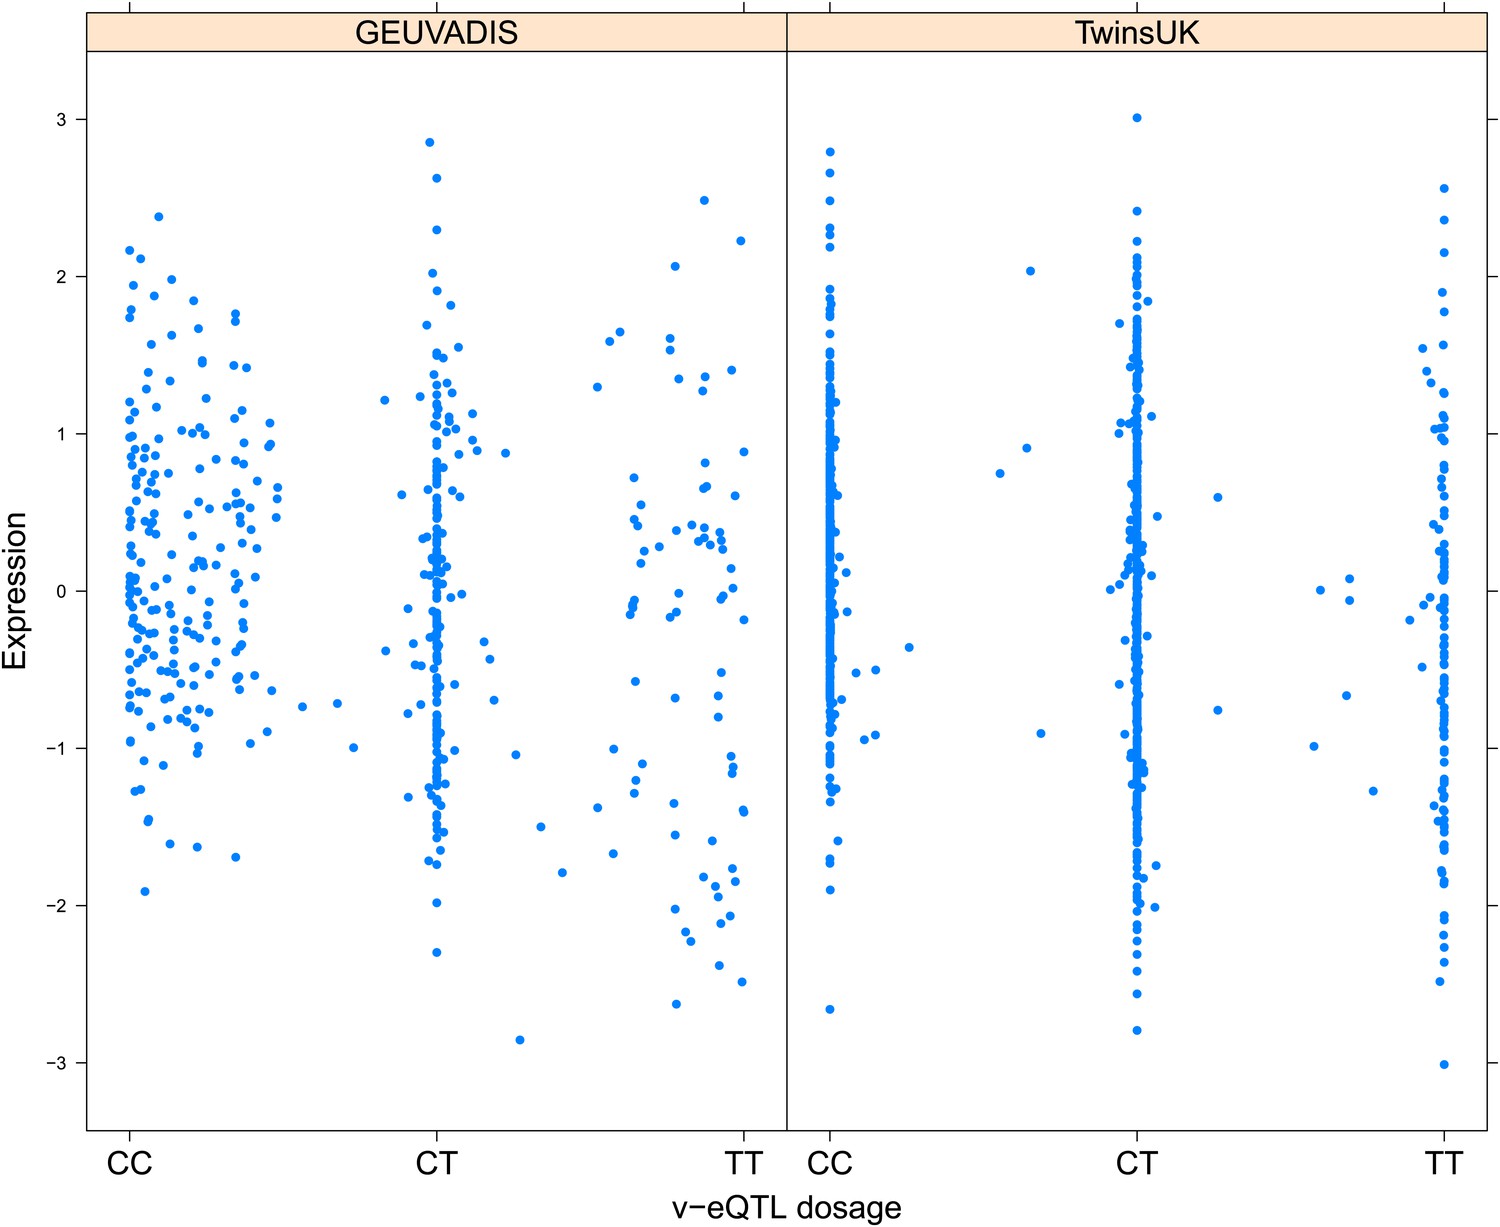
Variance of expression of ENSG00000164978 (NUDT2) is dependent on genotype dosage of rs10972055.
https://doi.org/10.7554/eLife.01381.006
Figure 1—figure supplement 4
Variance of expression of ENSG00000105499 (PLA2GC4) is dependent on genotype dosage of rs8109684.
https://doi.org/10.7554/eLife.01381.007
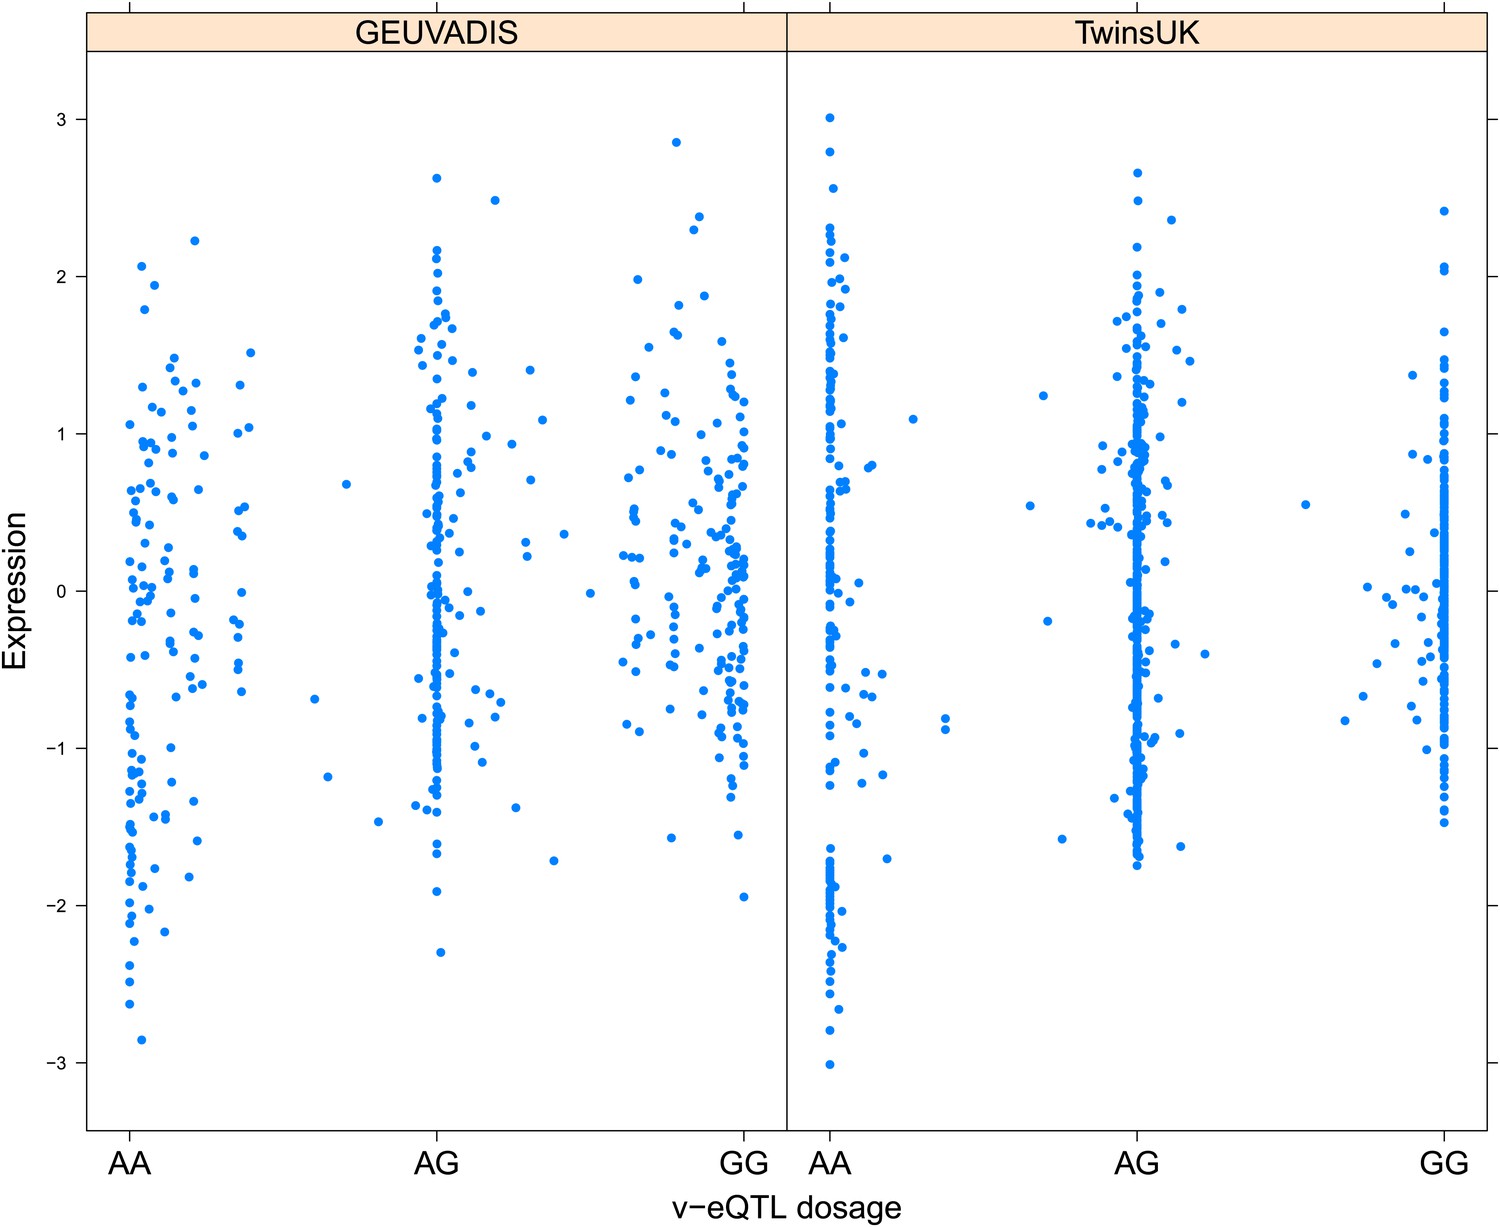
Figure 1—figure supplement 5
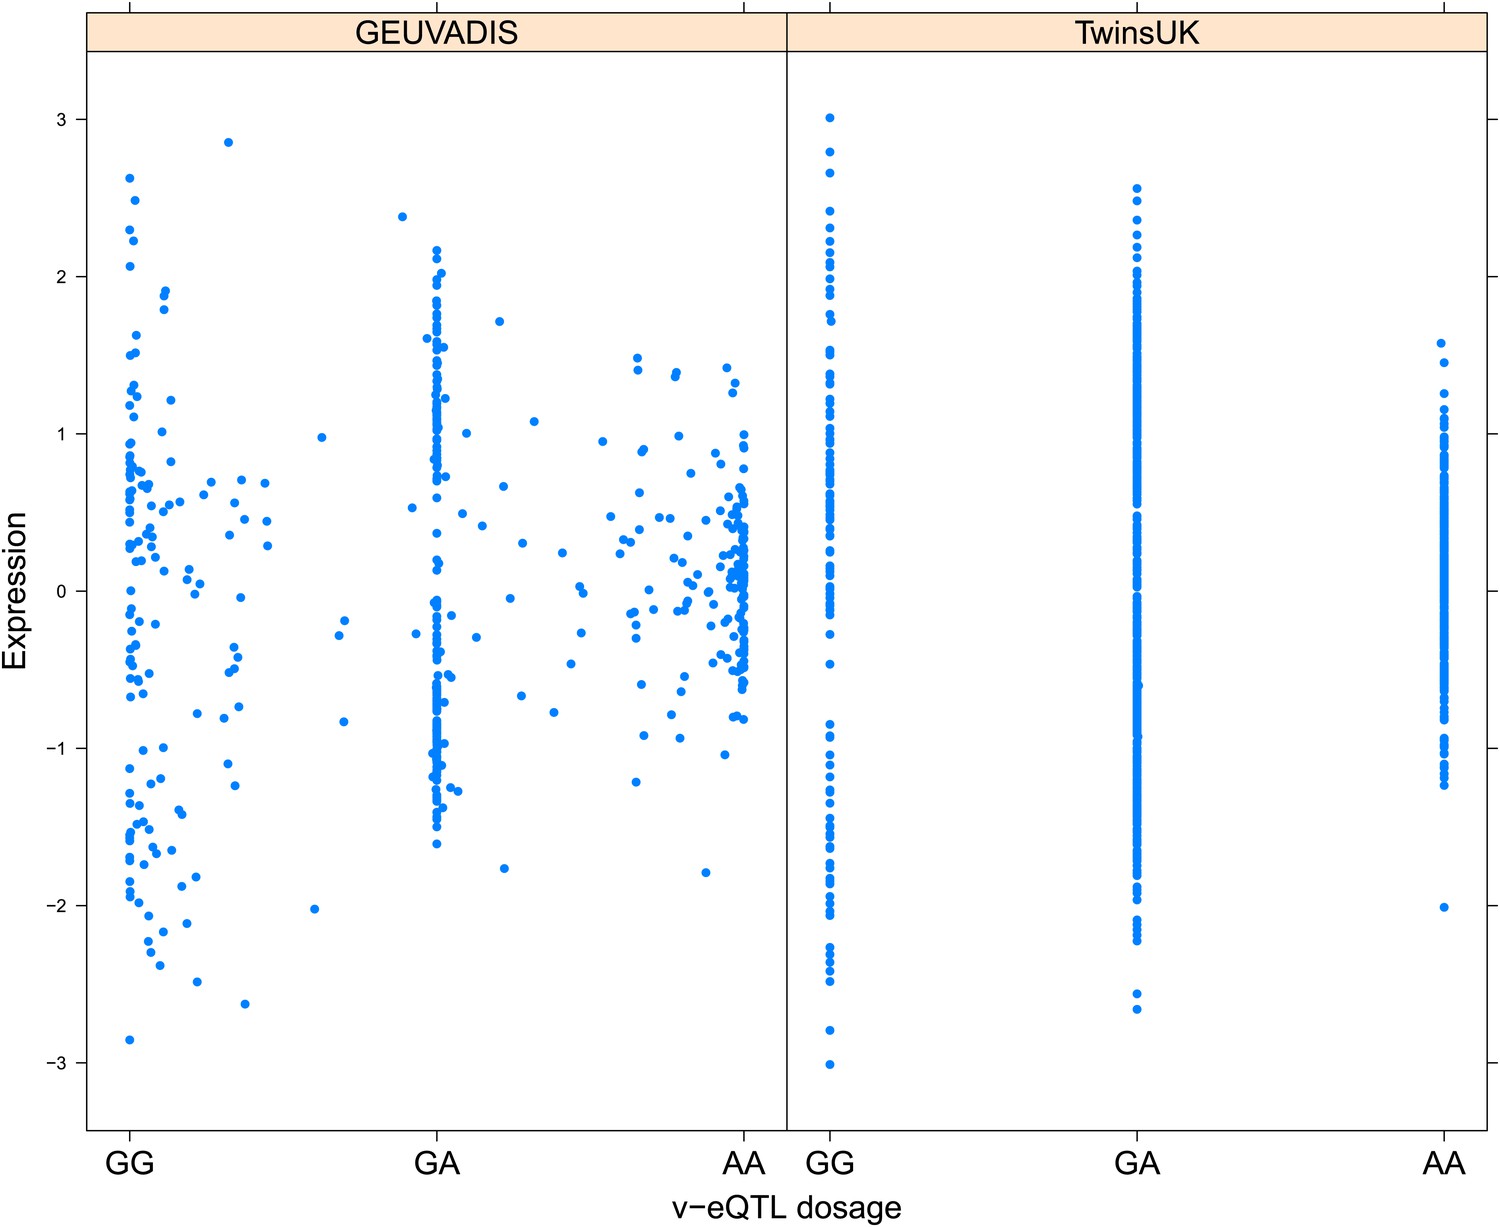
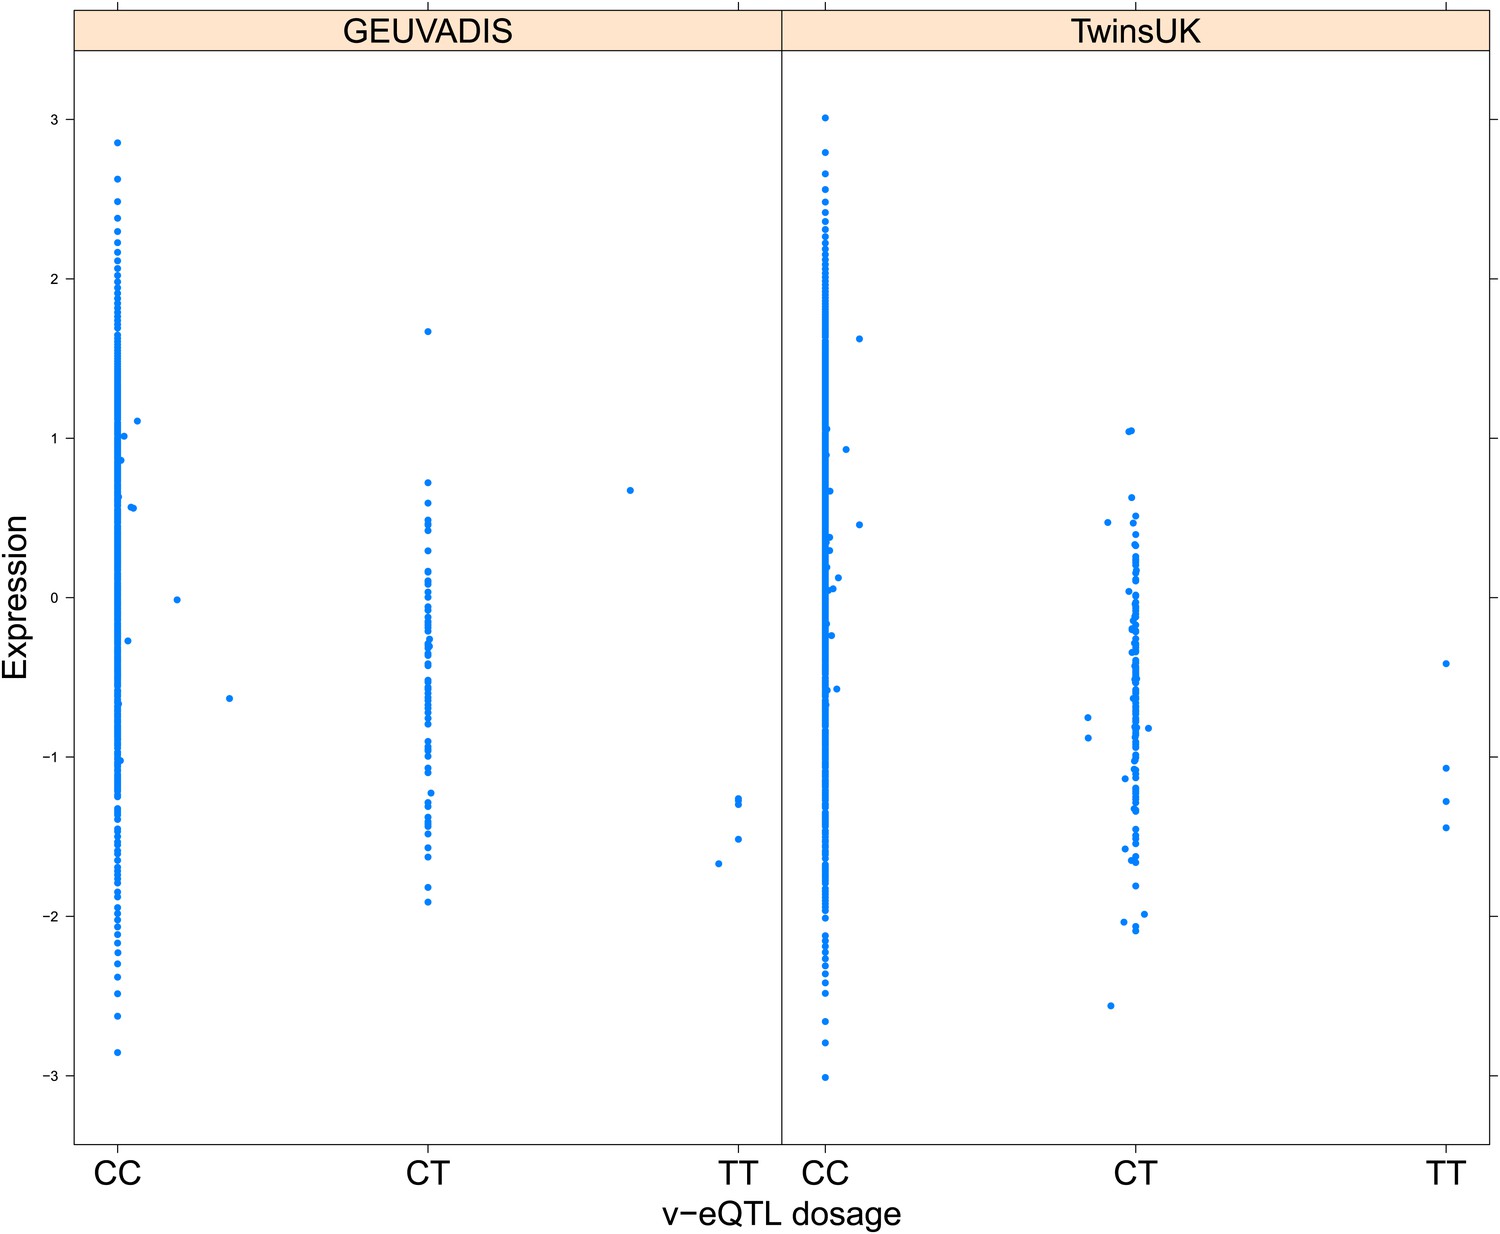
Variance of expression of ENSG00000043514 (TRIT1) is dependent on genotype dosage of rs3131691.
https://doi.org/10.7554/eLife.01381.008
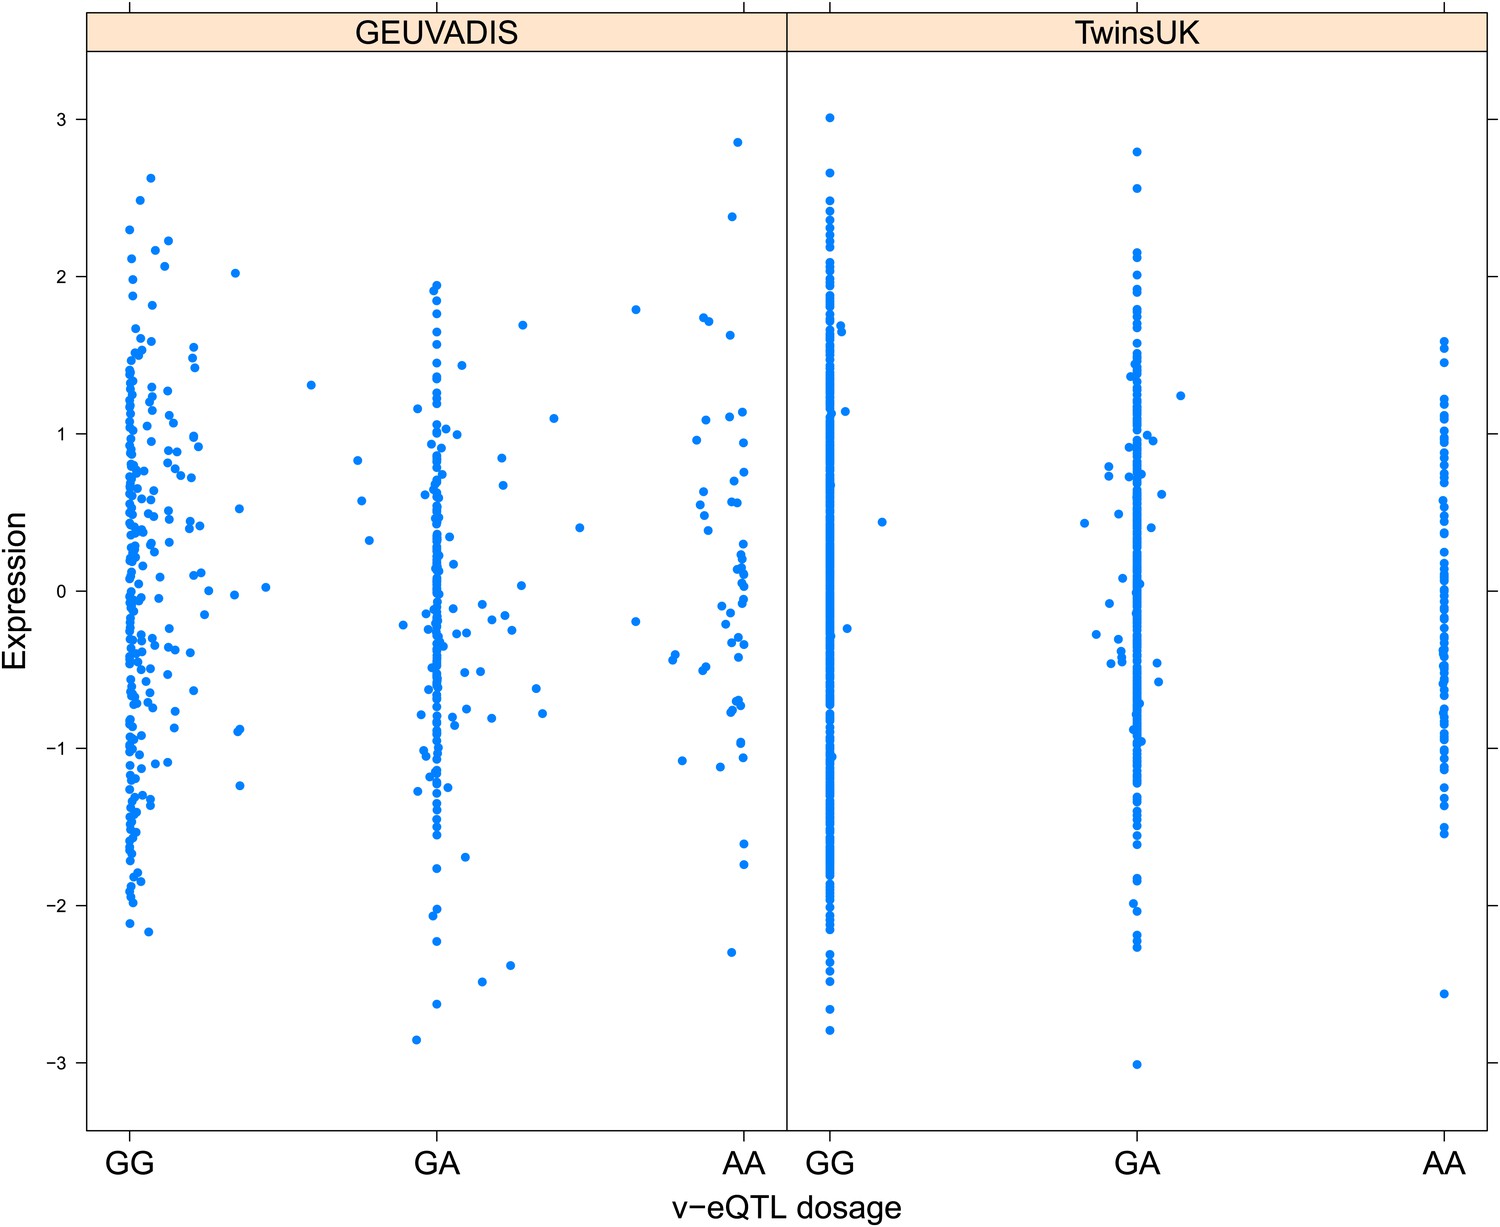
Figure 1—figure supplement 6
Variance of expression of ENSG00000075234 (TTC38) is dependent on genotype dosage of rs6008743.
https://doi.org/10.7554/eLife.01381.009
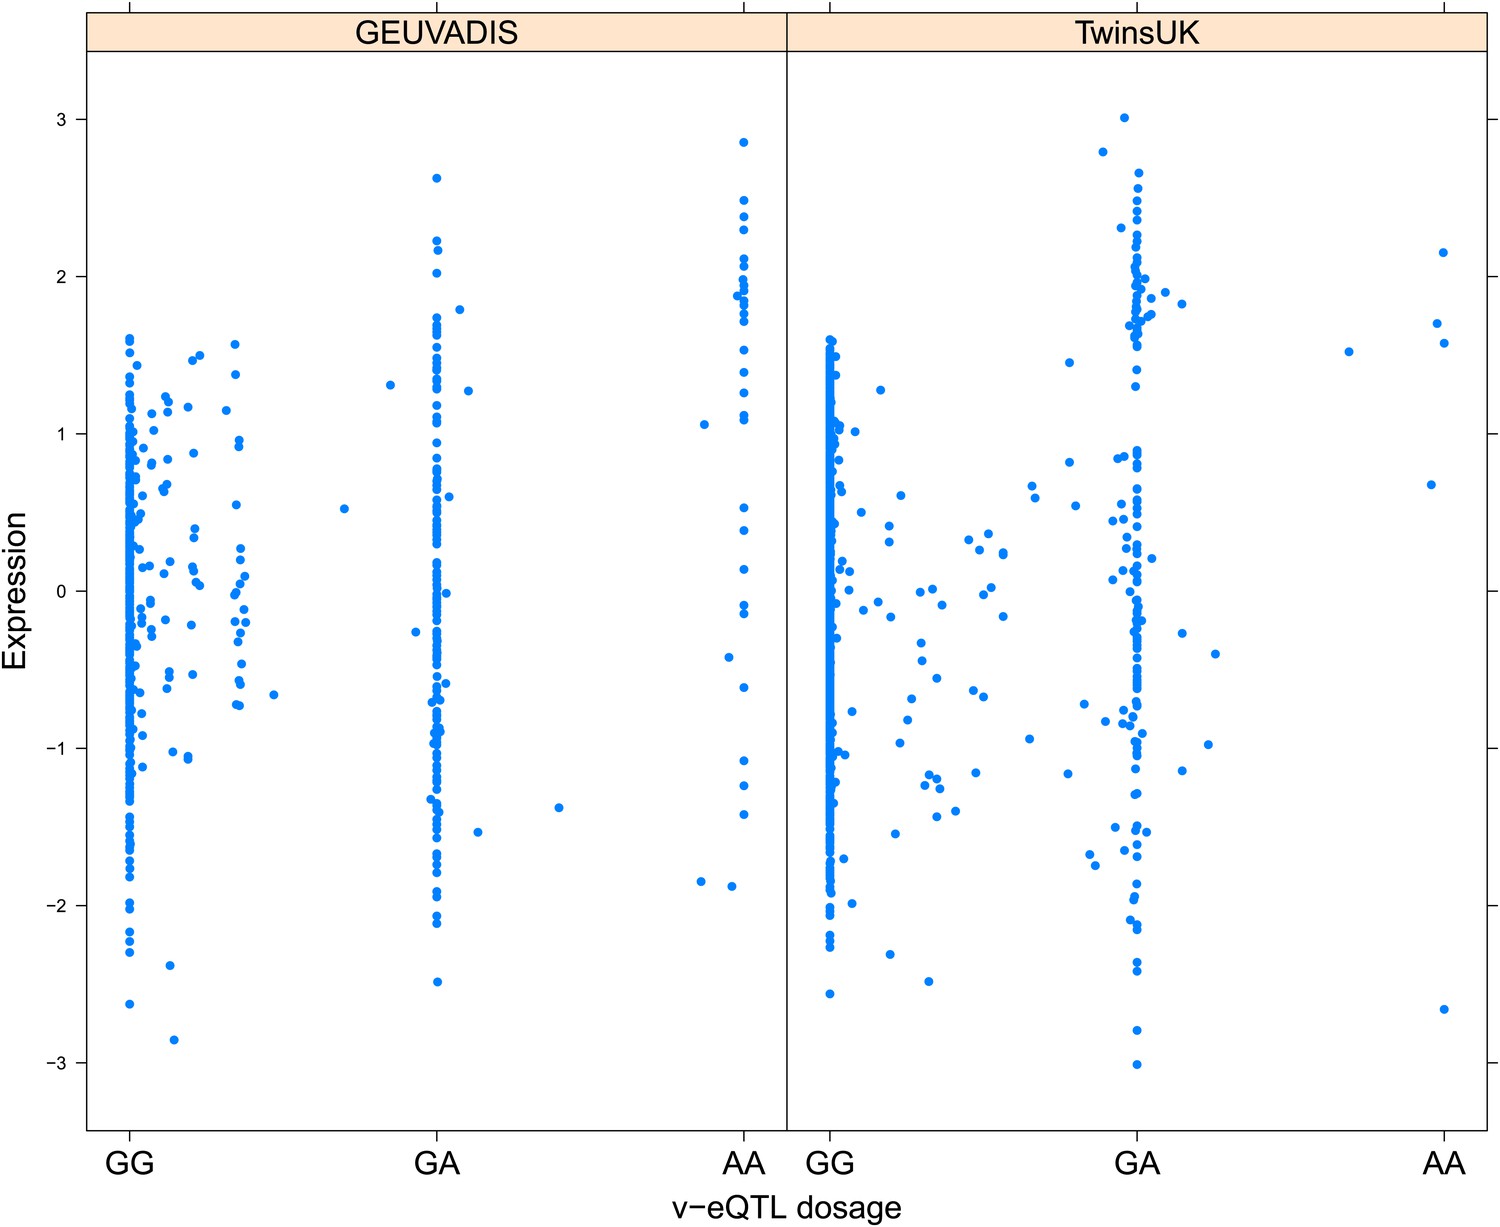
Figure 1—figure supplement 7
Variance of expression of ENSG00000164111 (ANXA5) is dependent on genotype dosage of rs6857766.
https://doi.org/10.7554/eLife.01381.010
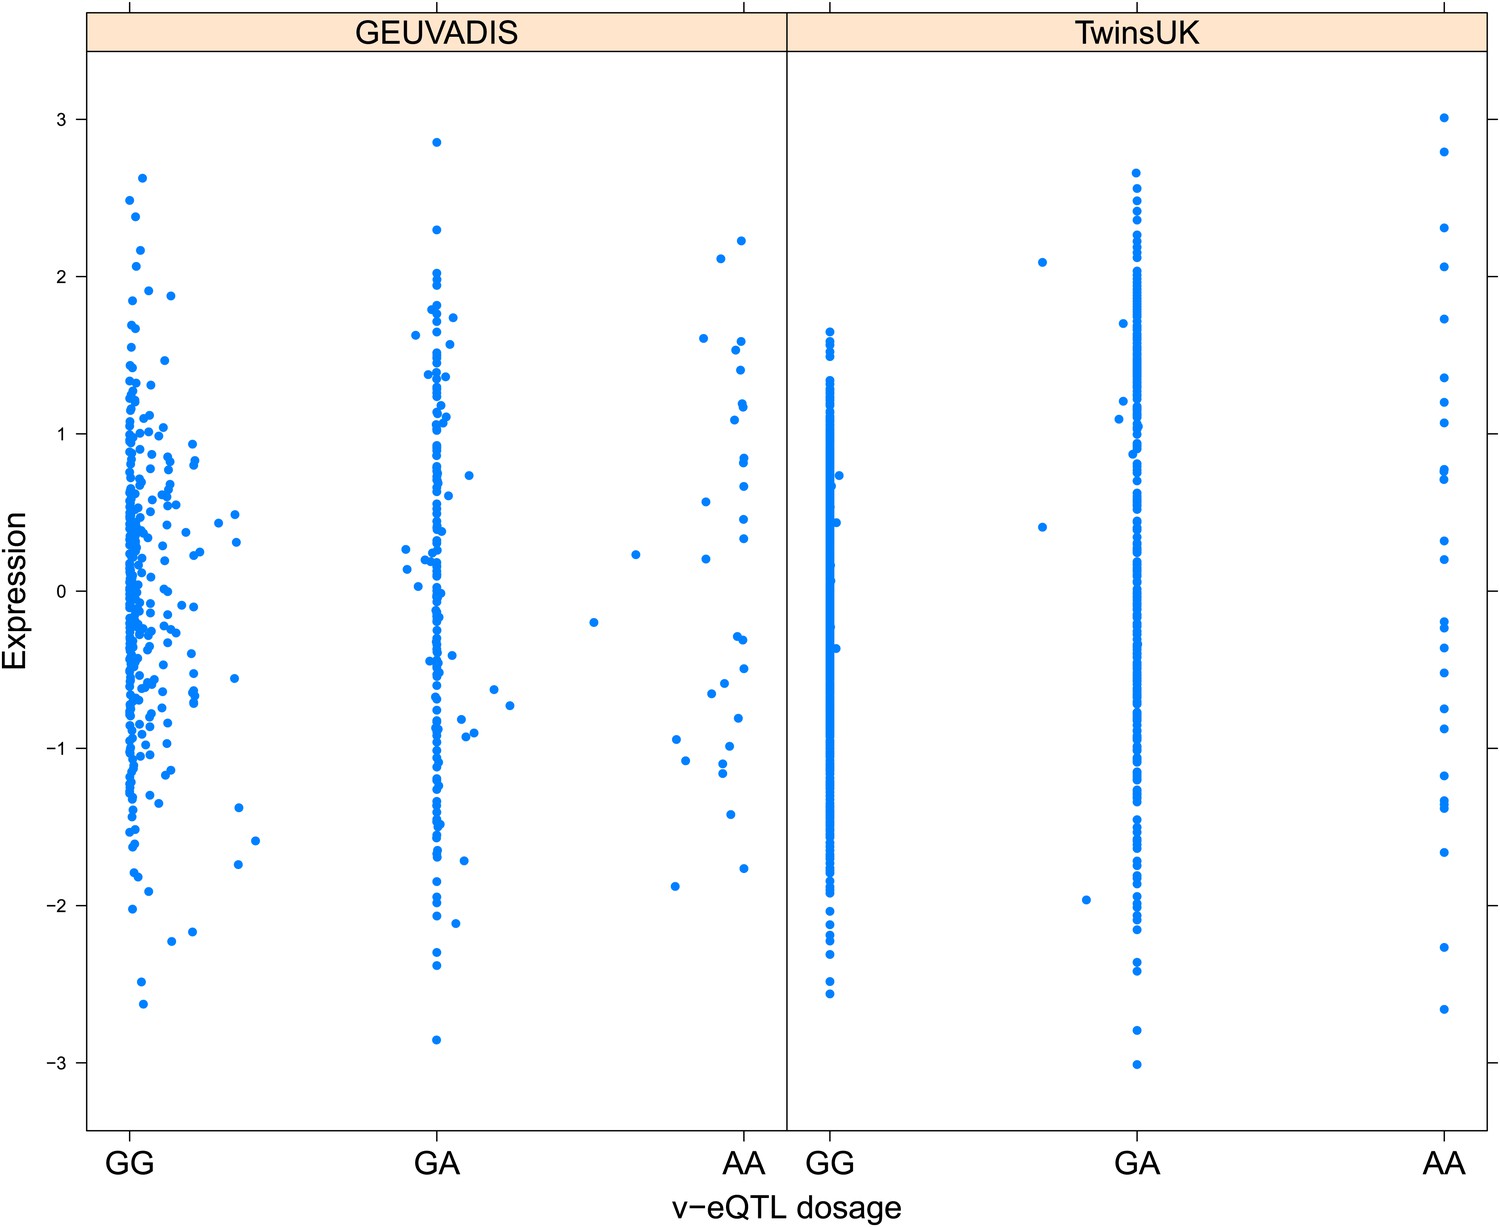
Figure 1—figure supplement 8
Variance of expression of ENSG00000137054 (POLR1E) is dependent on genotype dosage of rs7033474.
https://doi.org/10.7554/eLife.01381.011
Figure 1—figure supplement 9
Variance of expression of ENSG00000168765 (GSTM4) is dependent on genotype dosage of rs542338.
https://doi.org/10.7554/eLife.01381.012
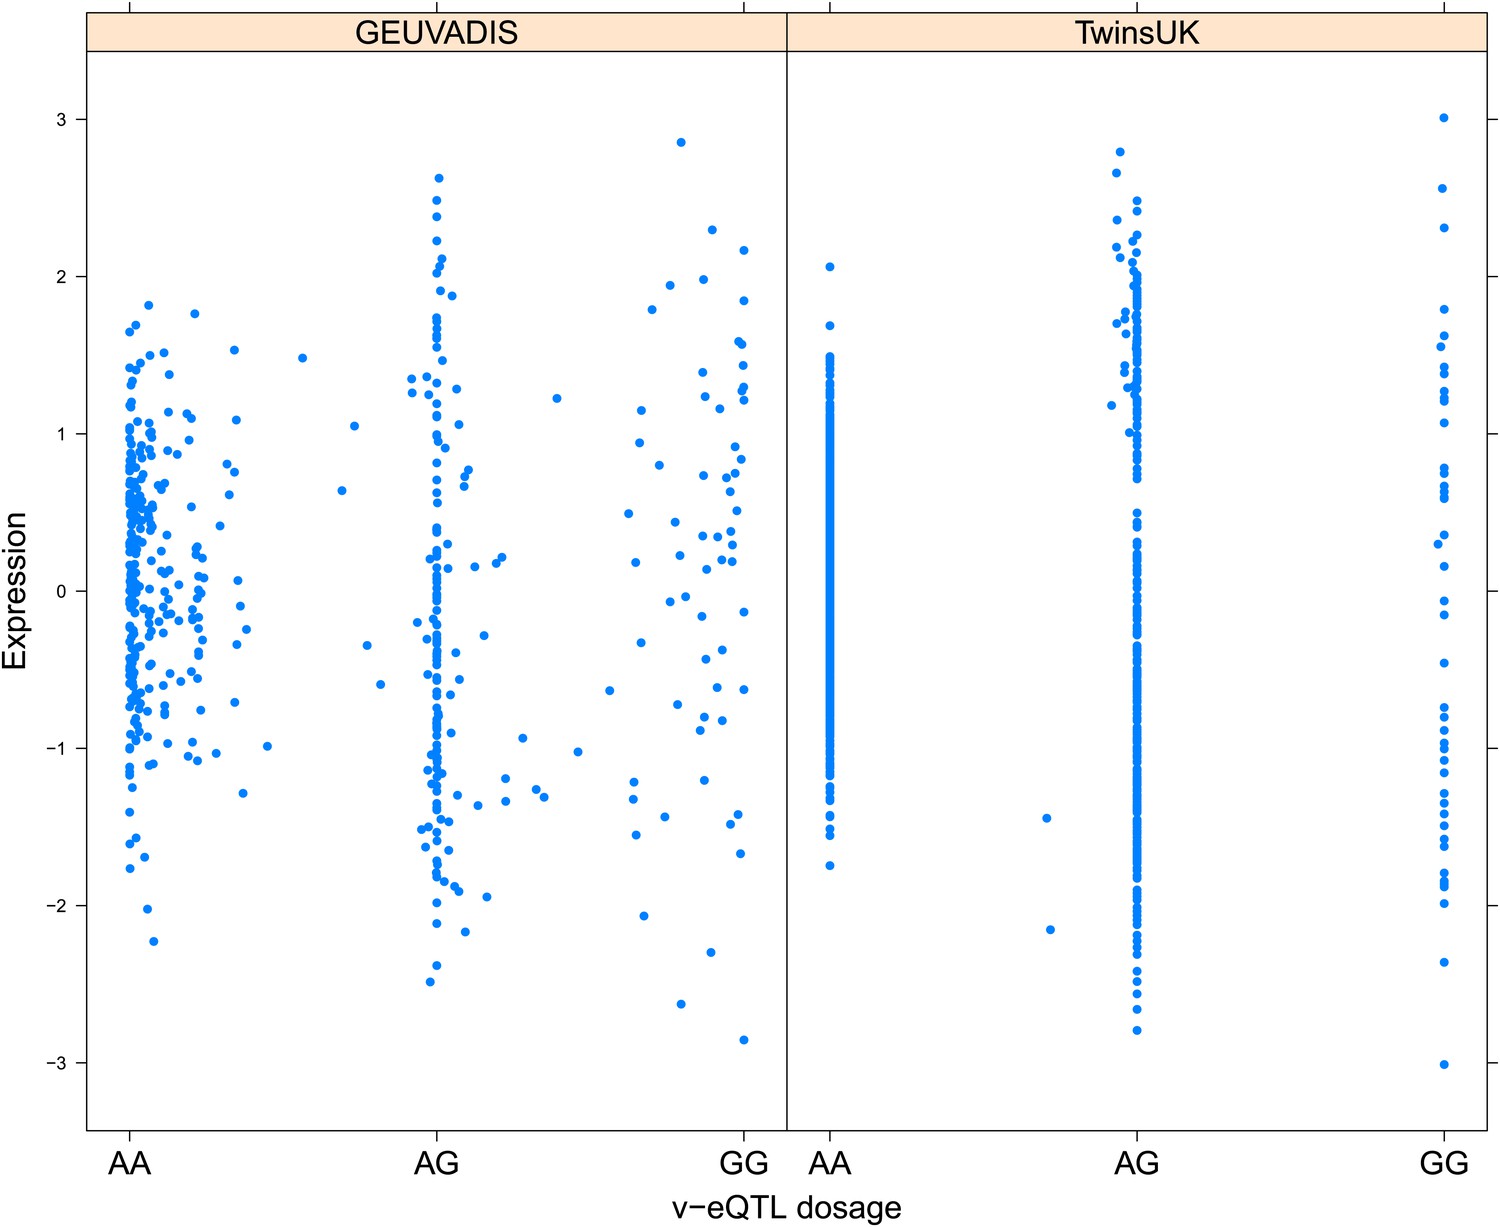
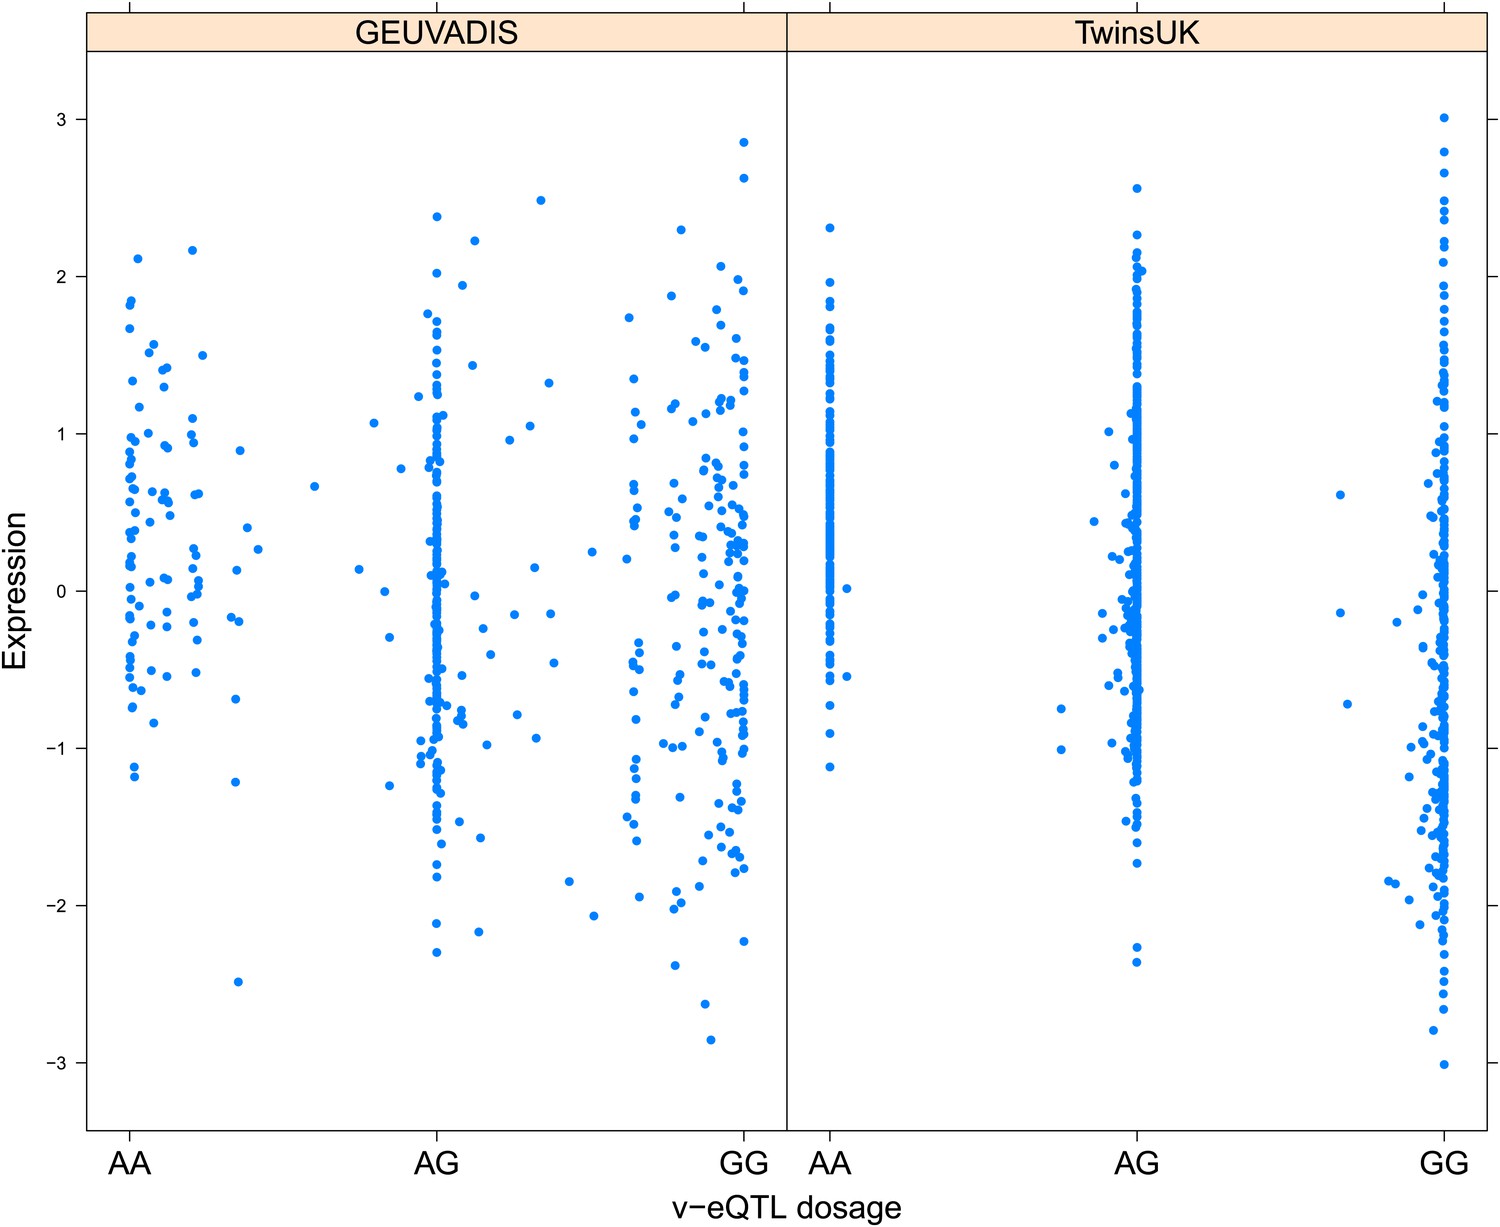
Figure 1—figure supplement 10
Variance of expression of ENSG00000232629 (HLA-DQB2) is dependent on genotype dosage of rs114183935.
https://doi.org/10.7554/eLife.01381.013
Figure 1—figure supplement 11
Variance of expression of ENSG00000196735 (HLA-DQA1) is dependent on genotype dosage of rs9276807.
https://doi.org/10.7554/eLife.01381.014
Figure 1—figure supplement 12
Variance of expression of ENSG00000160284 (C21orf56) is dependent on genotype dosage of rs16978976.
https://doi.org/10.7554/eLife.01381.015
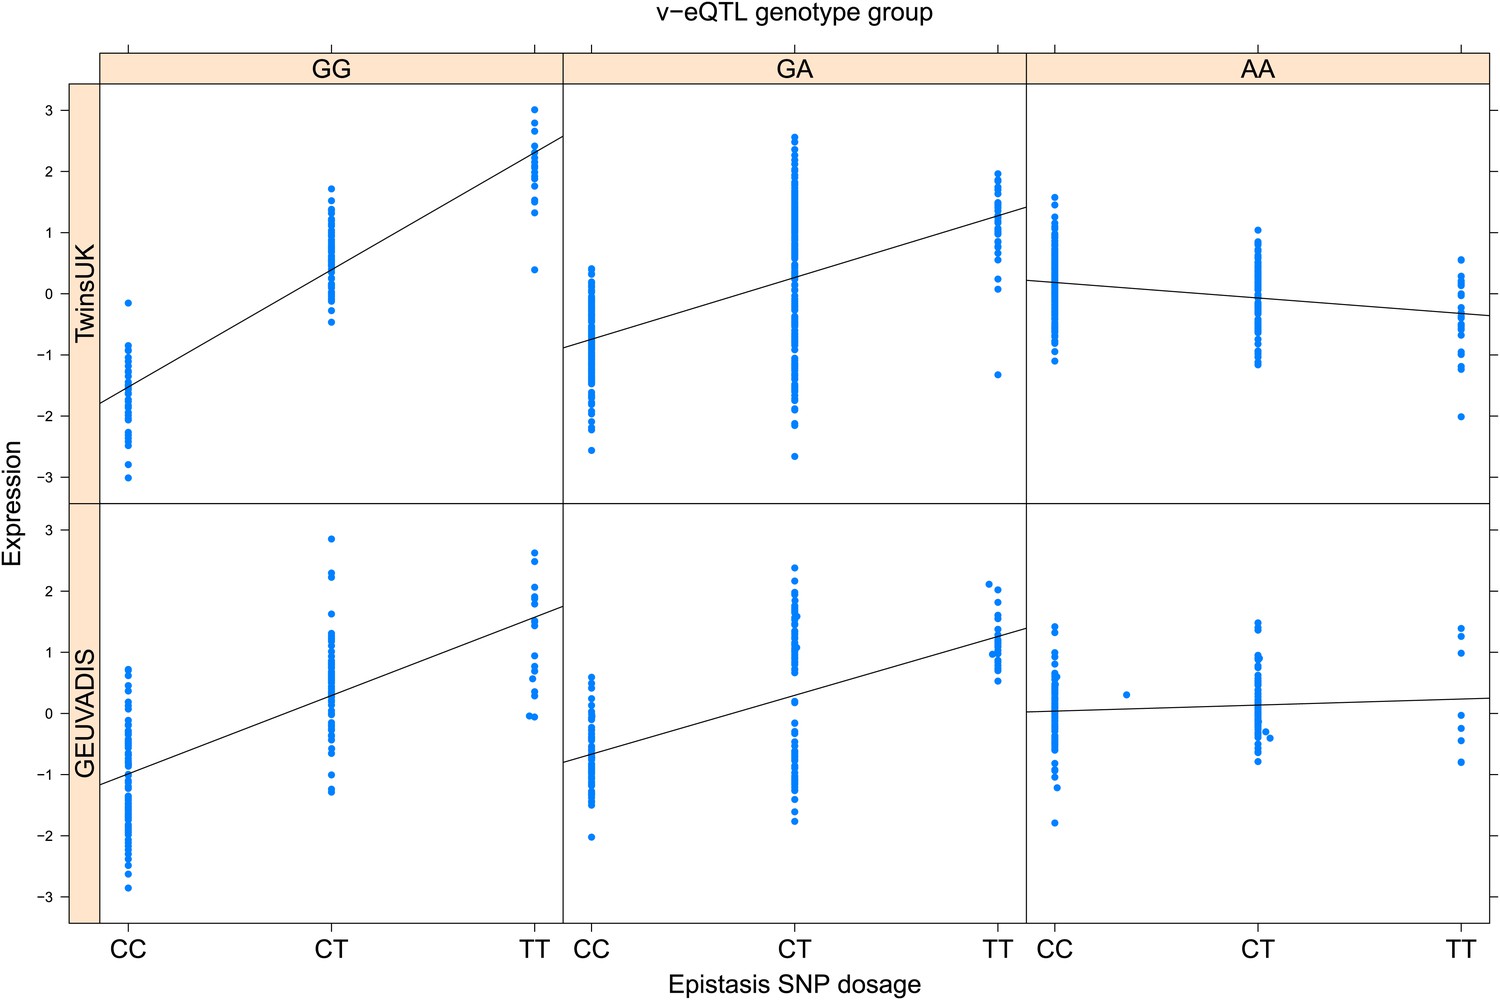
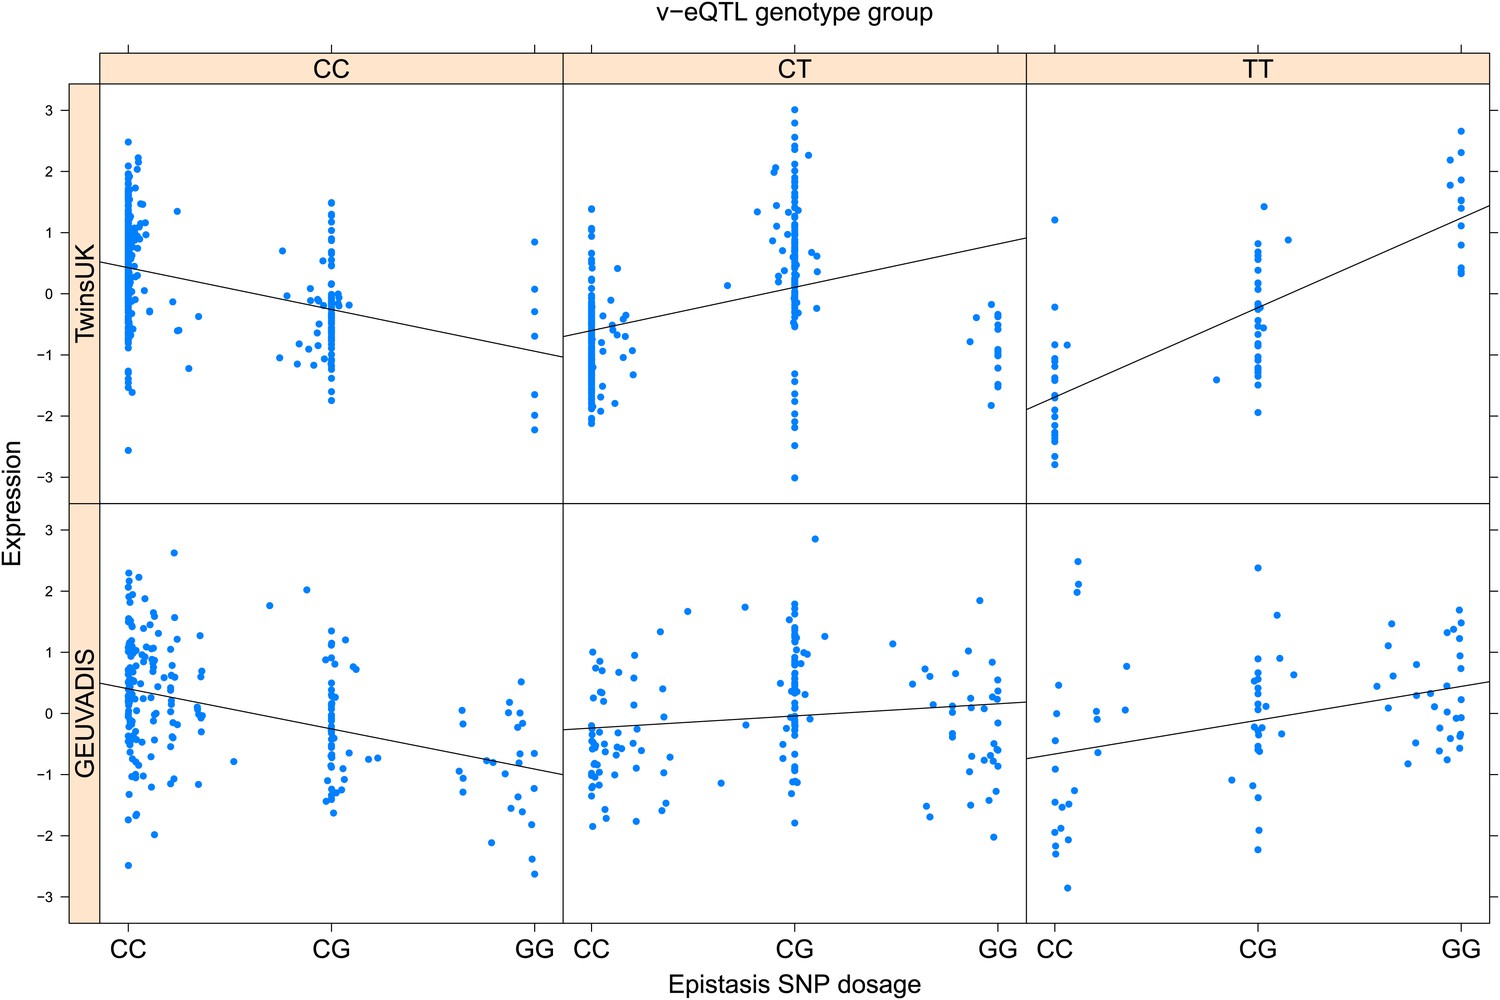
Figure 2 with 13 supplements
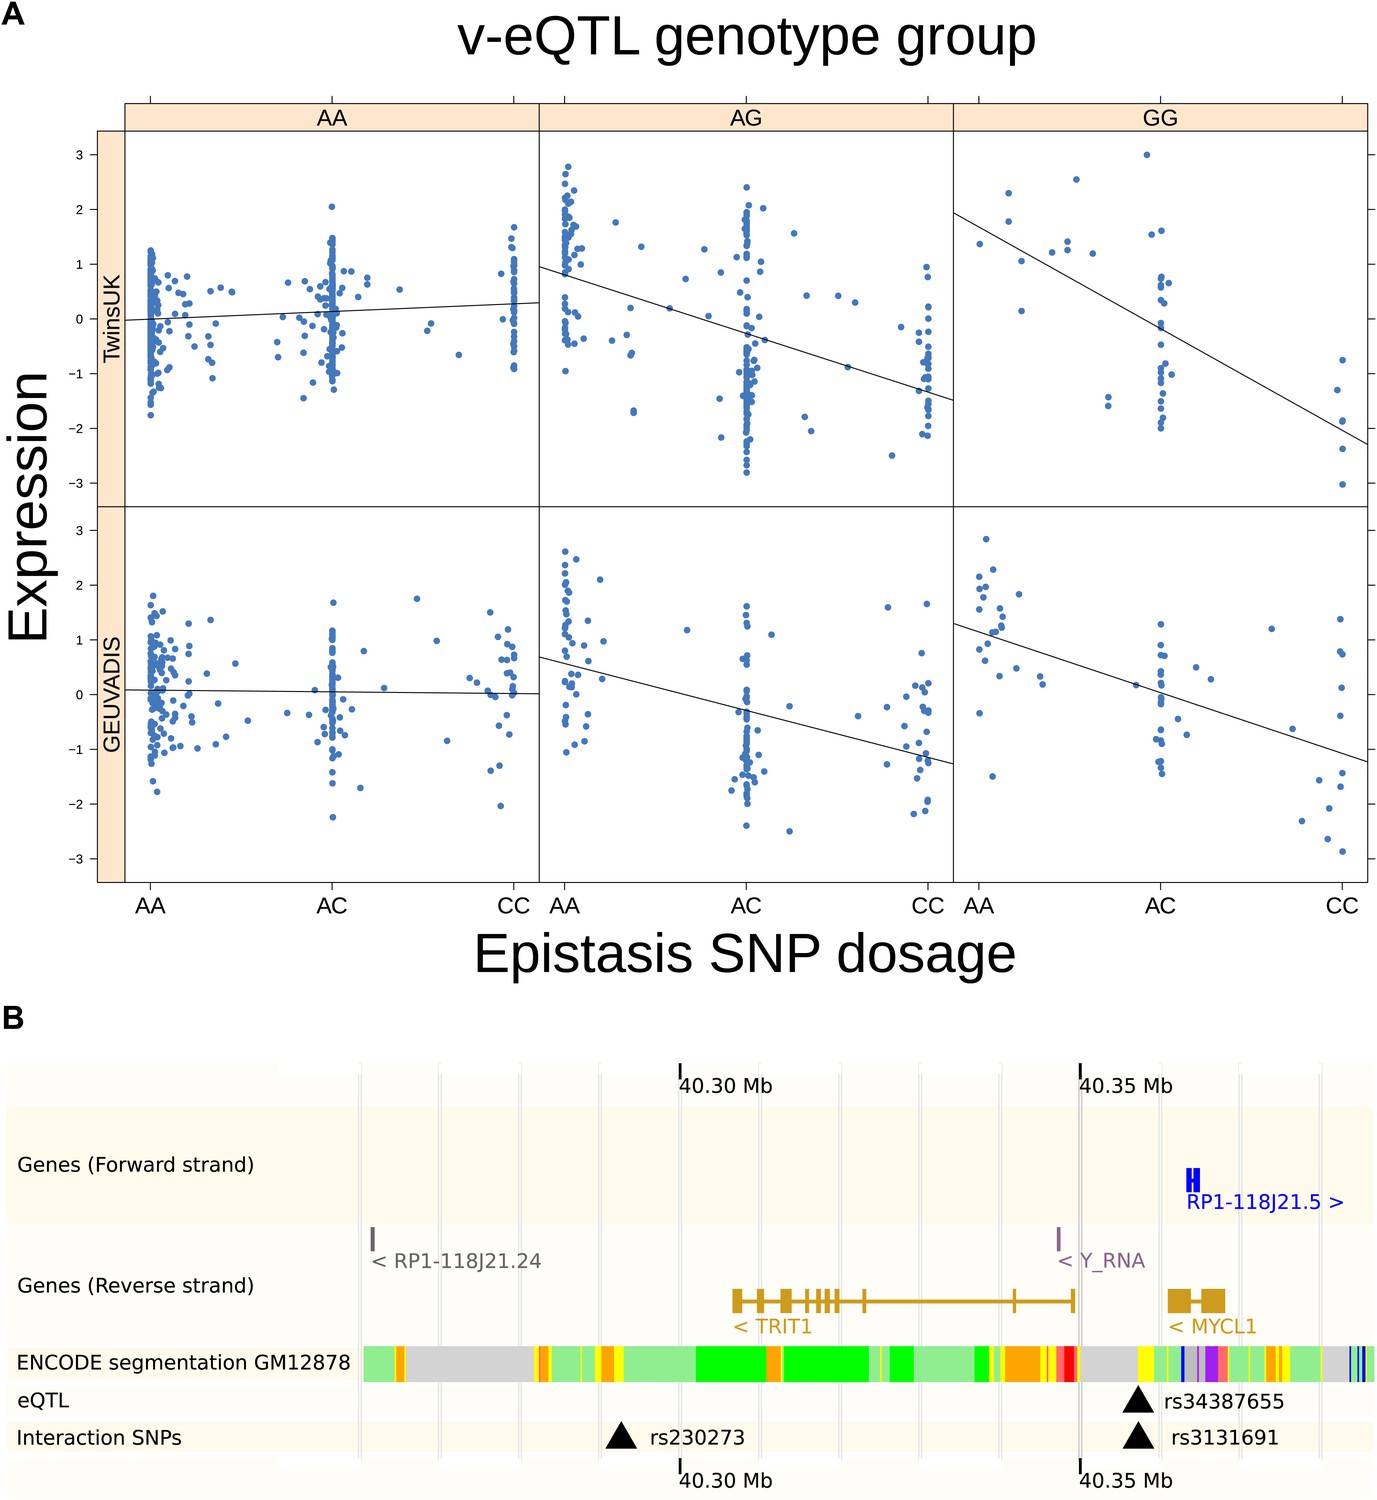
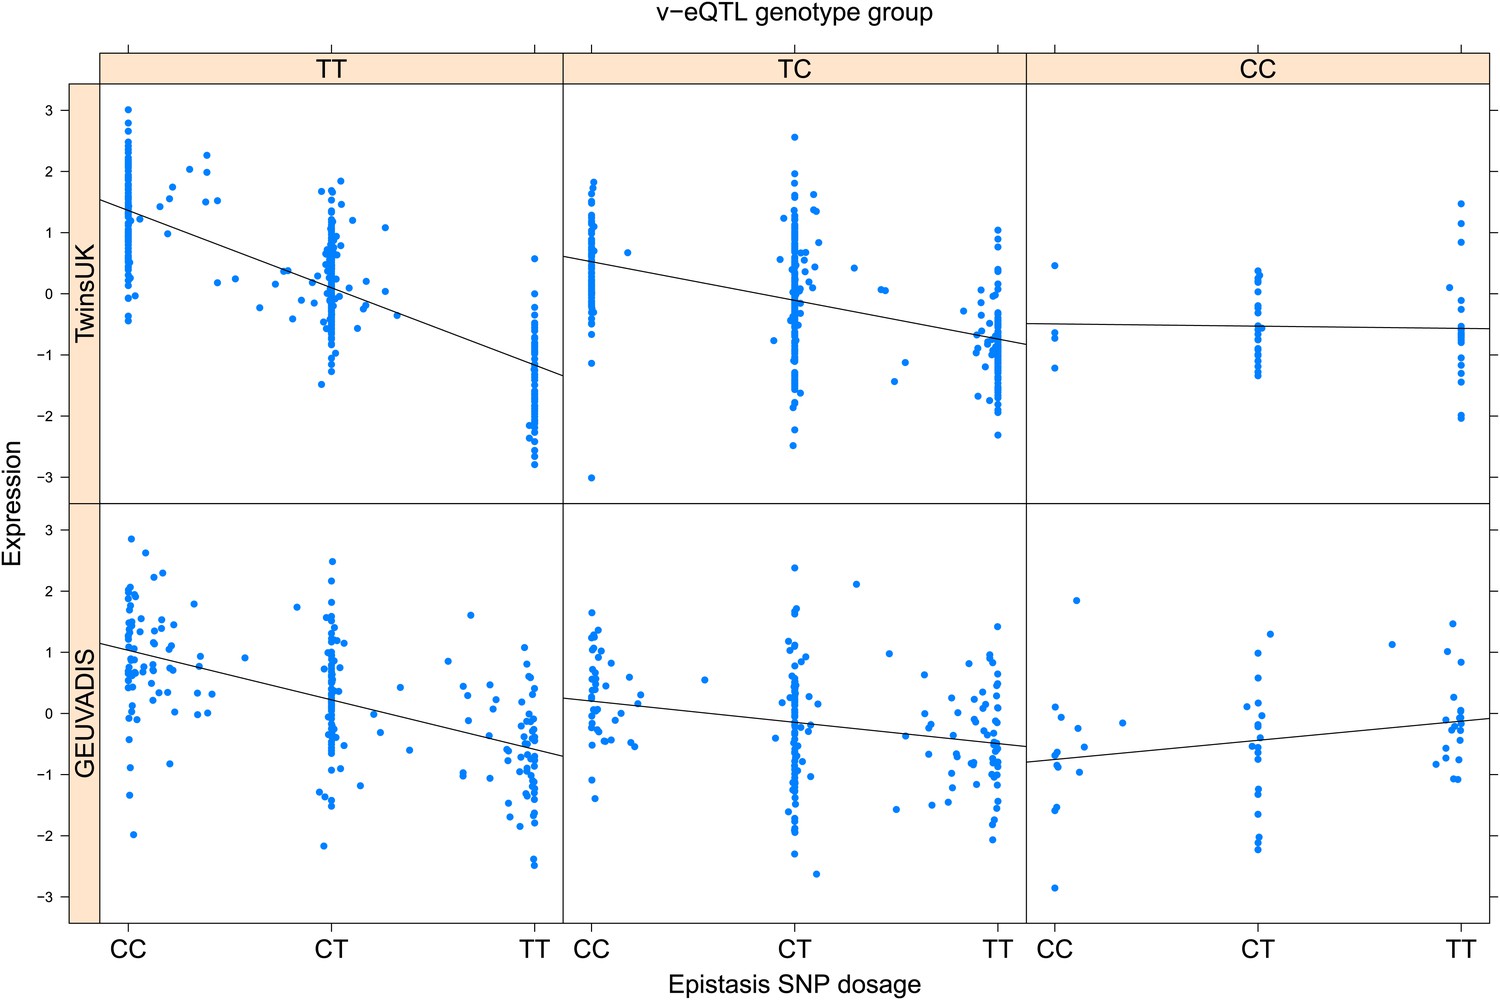
TRIT1 expression is affected by an interaction between two SNPs, lying on the boundaries of two separate enhancer regions, in both TwinsUK and GEUVADIS cohorts.
(A) Expression of TRIT1 is shown, with a separate panel for each v-eQTL (rs3131691) genotype group. Relationship between expression and imputed genotype dosage of the epistasis SNP (rs230273) is shown to be conditional on v-eQTL genotype. Expression from TwinsUK individuals is shown in the upper panels, GEUVADIS individuals in the lower panels. Best fit lines show different SNP effects for the epistatic SNPs in different v-eQTL genotype groups, these lines are constructed ignoring twin structure in the case of the TwinsUK sample and population in the GEUVADIS cohort. (B) SNPs affecting TRIT1 expression are near regulatory elements. Position of v-eQTL (rs3131691), interacting epistasis SNP (rs230273) and a nearby eQTL (rs34387655) affecting TRIT1 expression are shown. ENCODE segmentation analysis shows regulatory elements around TRIT1 (reverse strand gene). Colours indicating regions are: yellow = weak enhancer, orange = strong enhancer, red = strong promoter, light red = weak promoter, purple = poised promoter, dark green = transcriptional transition/elongation, light green = weakly transcribed, blue = insulator, and light grey = heterochromatin or repetitive/copy number variation.
Figure 2—figure supplement 1
Evidence for epistasis in twins against evidence for epistasis in 1000 Genomes for the 246 significant hits.
The 57 replicated associations after removing possible haplotype effects are shown in blue.
Figure 2—figure supplement 2
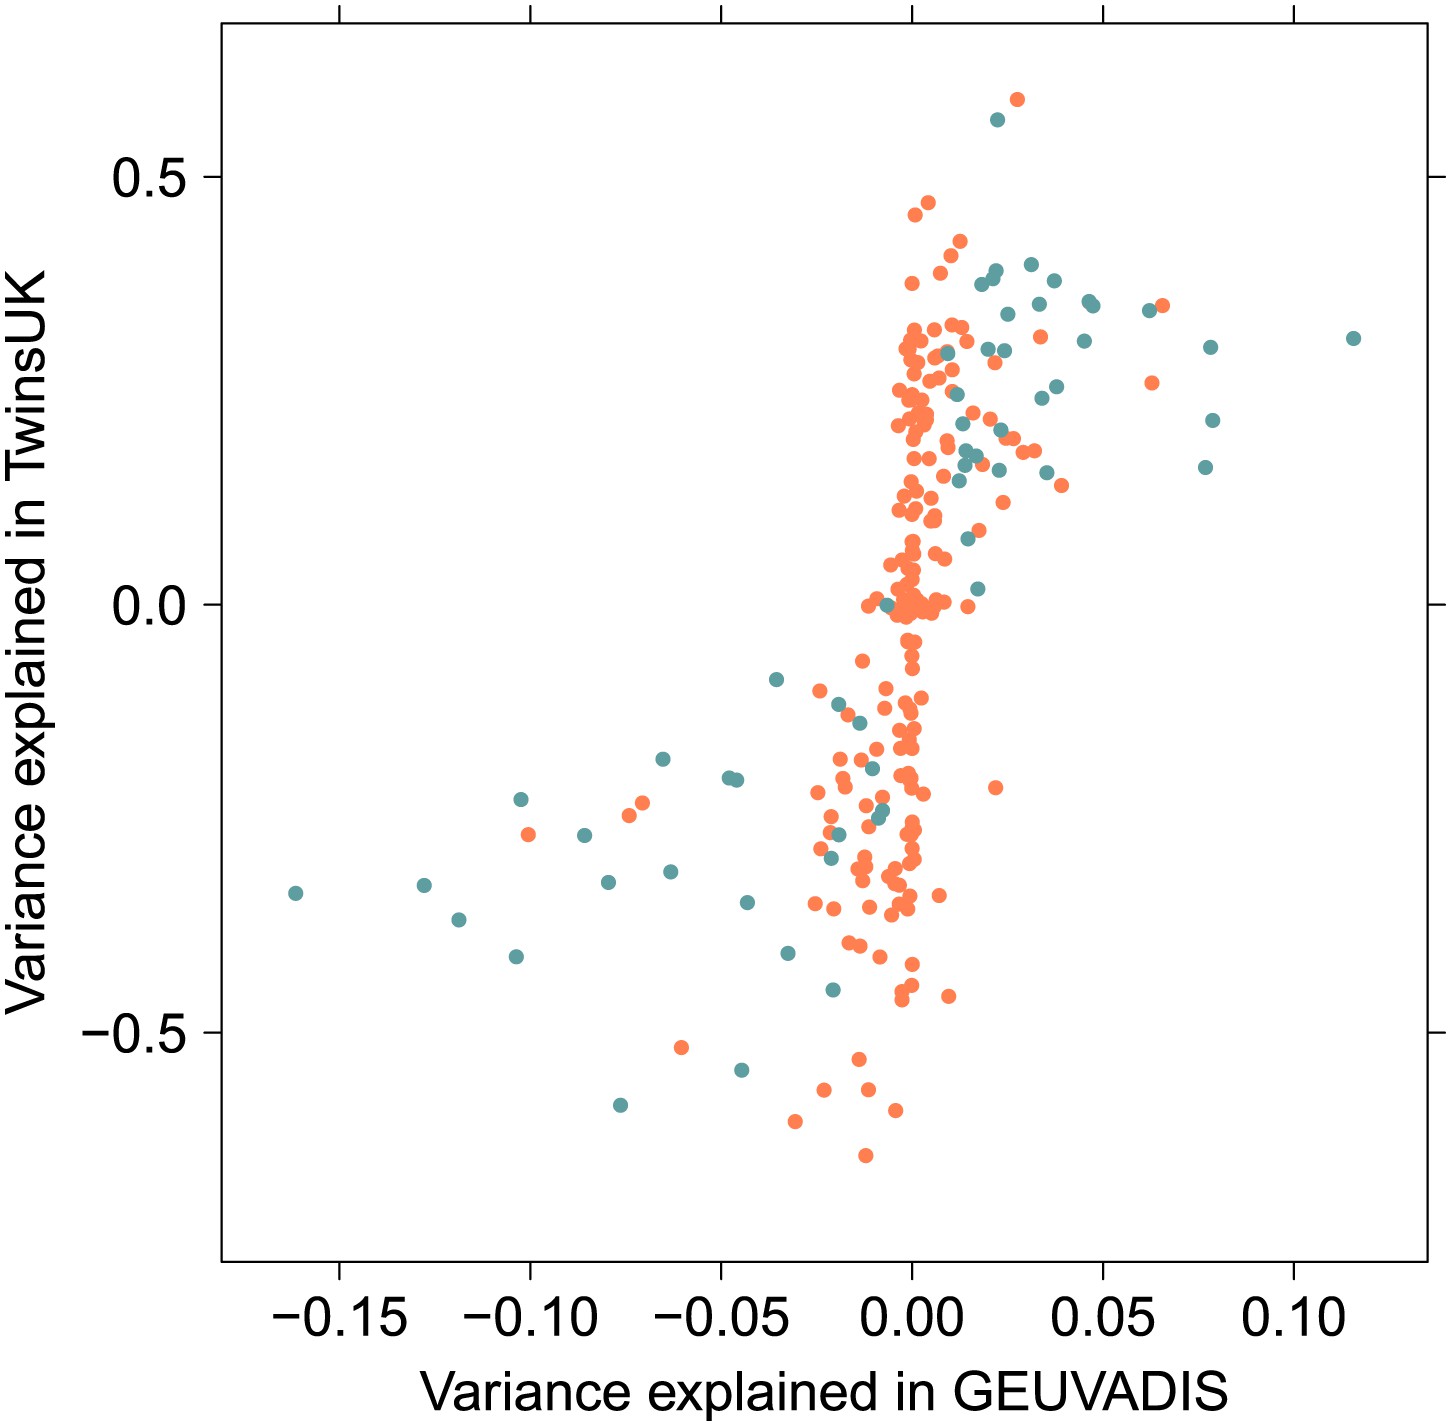
Estimate of interaction effect size in 1000 Genomes and twins cohorts.
Effect size is reported as proportion of variance explained by the interaction, where sign is positive if when both variants have the alternate allele the combined effect is a greater increase in expression than predicted by the separate additive effects, negative if expression is decreased comparatively. The 57 replicated associations are shown in blue.
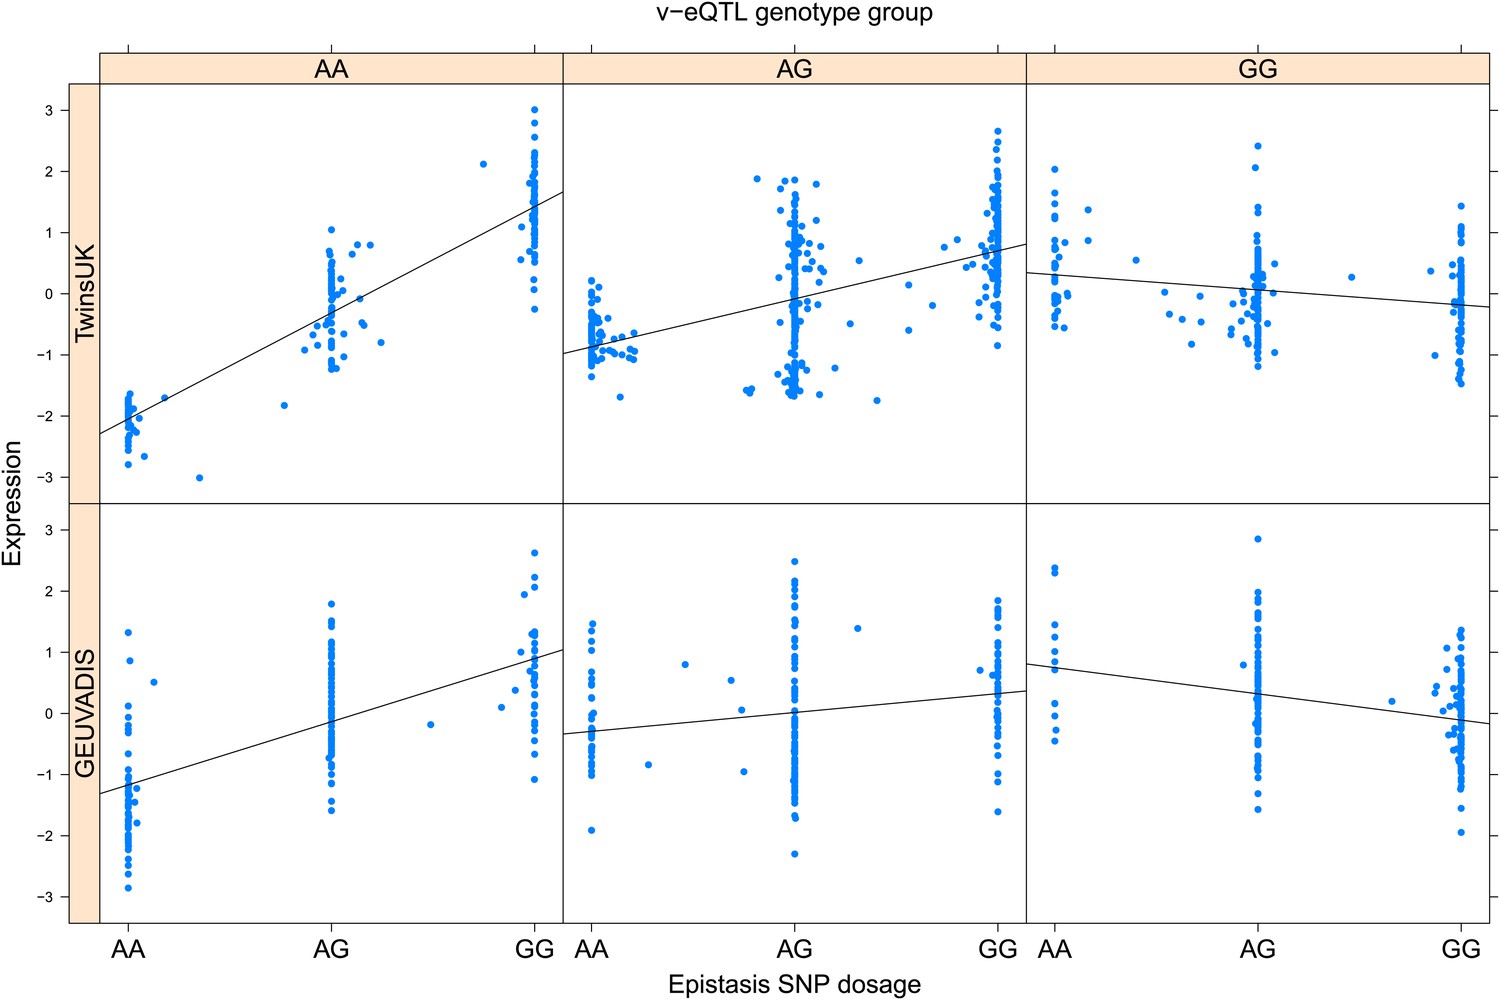
Figure 2—figure supplement 3
ENSG00000164978 (NUDT2) expression is affected by an interaction between two SNPs in both TwinsUK and GEUVADIS cohorts.
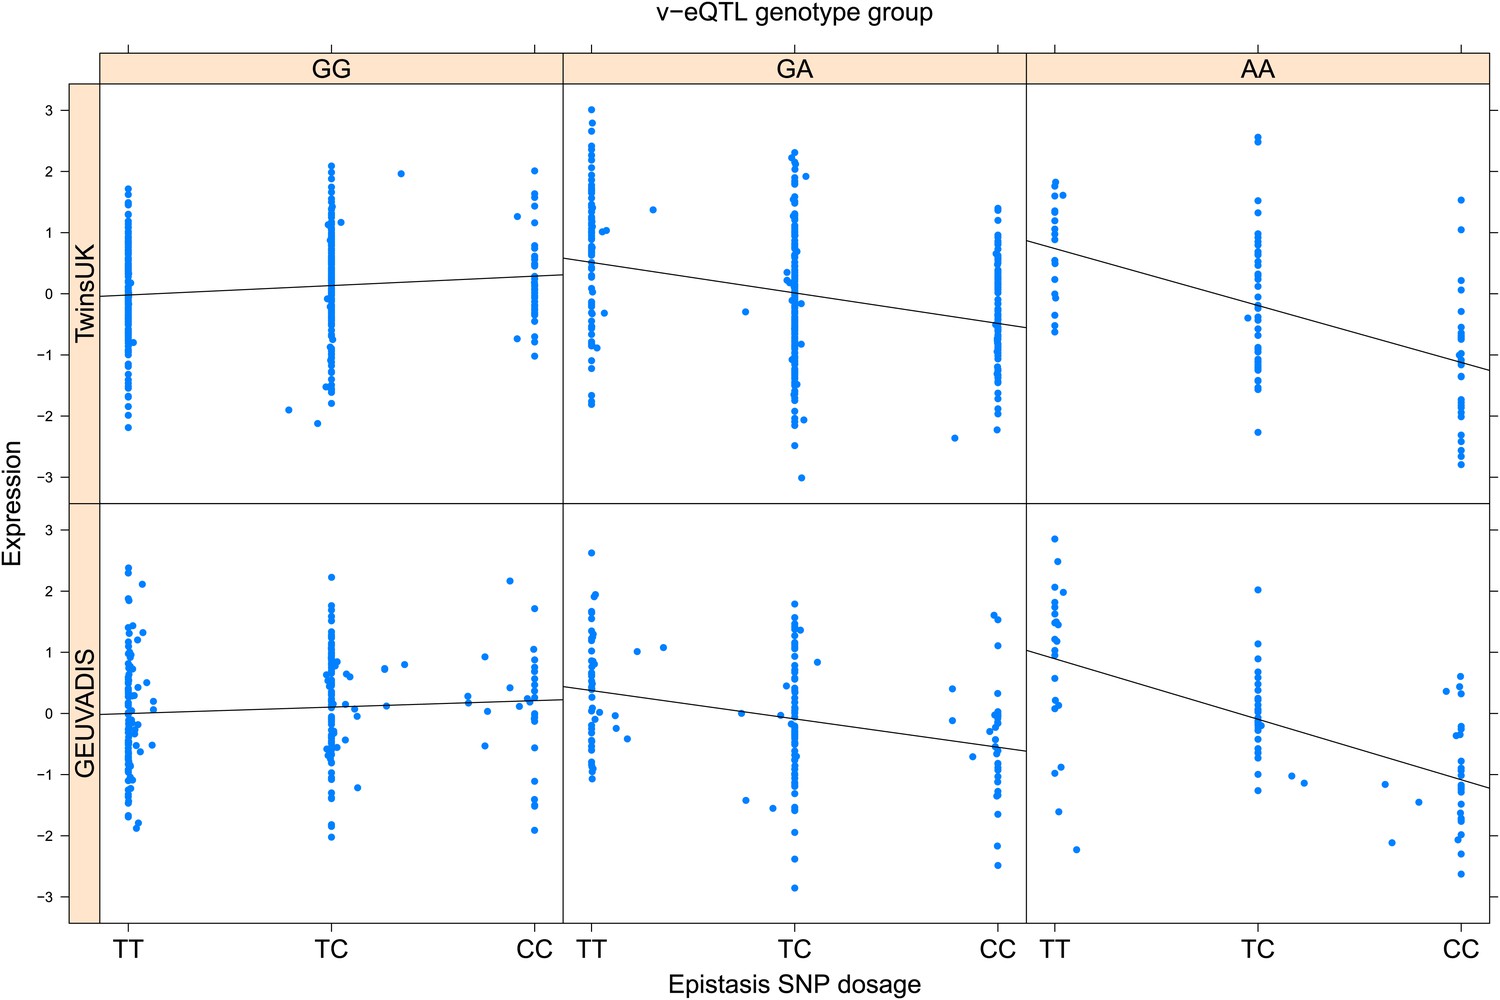
Expression of NUDT2 is shown, with a separate panel for each v-eQTL (rs10972055) genotype group. Relationship between expression and imputed genotype dosage of the epistasis SNP (rs10814083) is shown to be conditional on v-eQTL genotype. Expression from TwinsUK individuals is shown in the upper panels, GEUVADIS individuals in the lower panels. Best fit lines indicate the different epistatic SNP effects in the different v-eQTL genotype groups and are illustrative only. These lines are constructed ignoring twin structure in the case of the TwinsUK sample and population in the GEUVADIS cohort and do not represent model fit for the analysis performed.
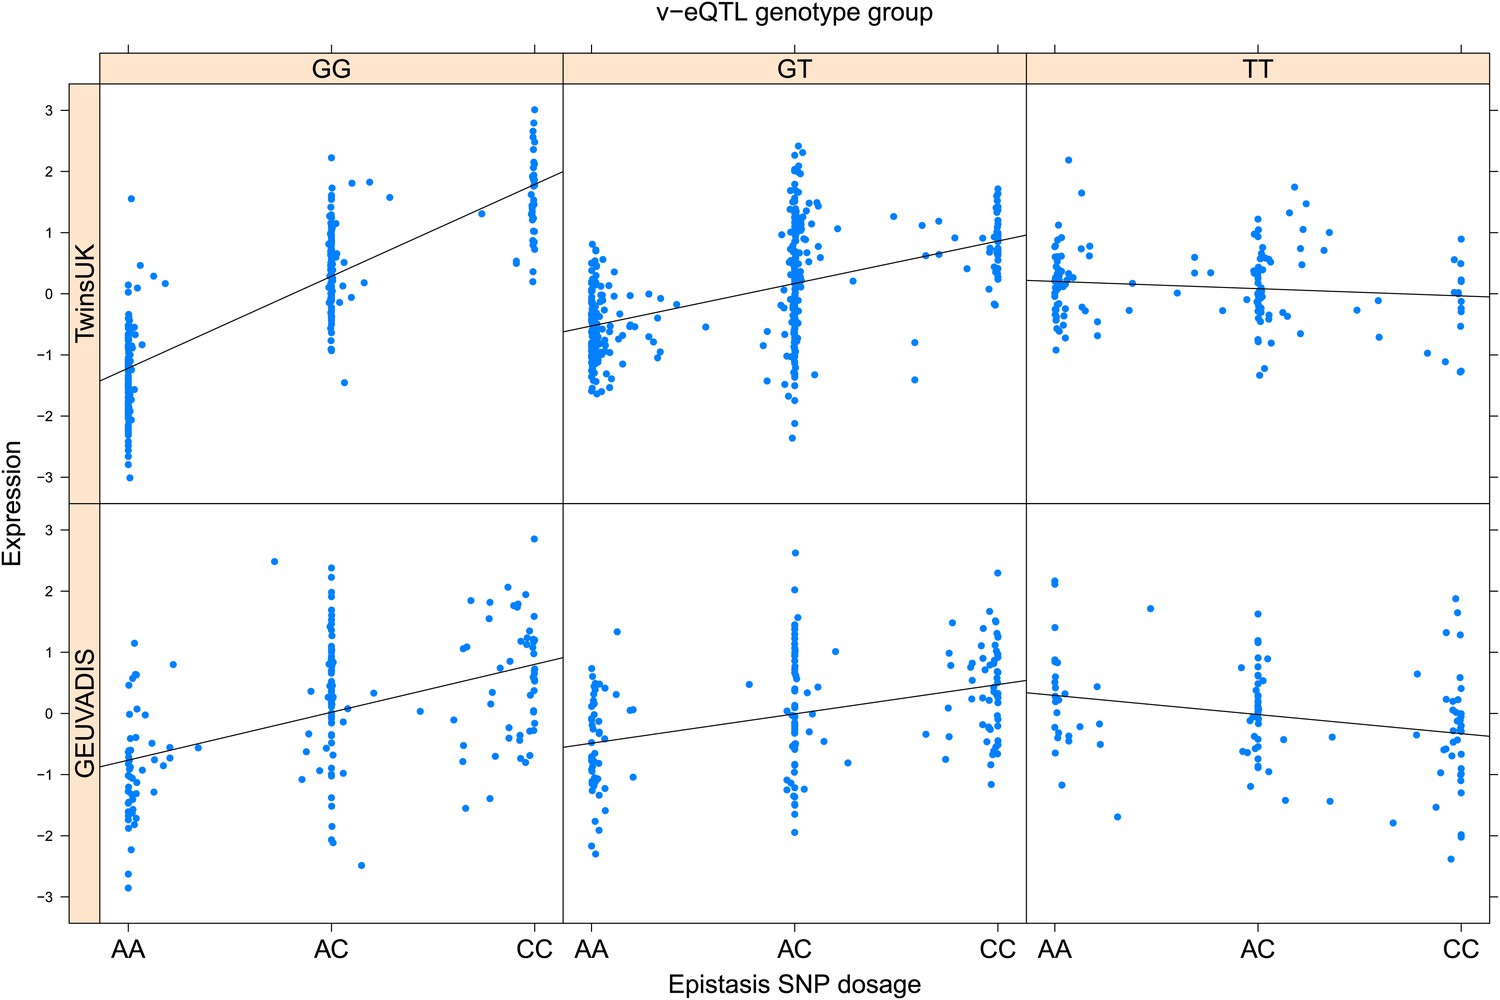
Figure 2—figure supplement 4
ENSG00000232629 (HLA-DQB2) expression is affected by an interaction between two SNPs in both TwinsUK and GEUVADIS cohorts.
Expression of HLA-DQB2 is shown, with a separate panel for each v-eQTL (rs114183935) genotype group. Relationship between expression and imputed genotype dosage of the epistasis SNP (rs1049130) is shown to be conditional on v-eQTL genotype. Expression from TwinsUK individuals is shown in the upper panels, GEUVADIS individuals in the lower panels. Best fit lines indicate the different epistatic SNP effects in the different v-eQTL genotype groups and are illustrative only. These lines are constructed ignoring twin structure in the case of the TwinsUK sample and population in the GEUVADIS cohort and do not represent model fit for the analysis performed.
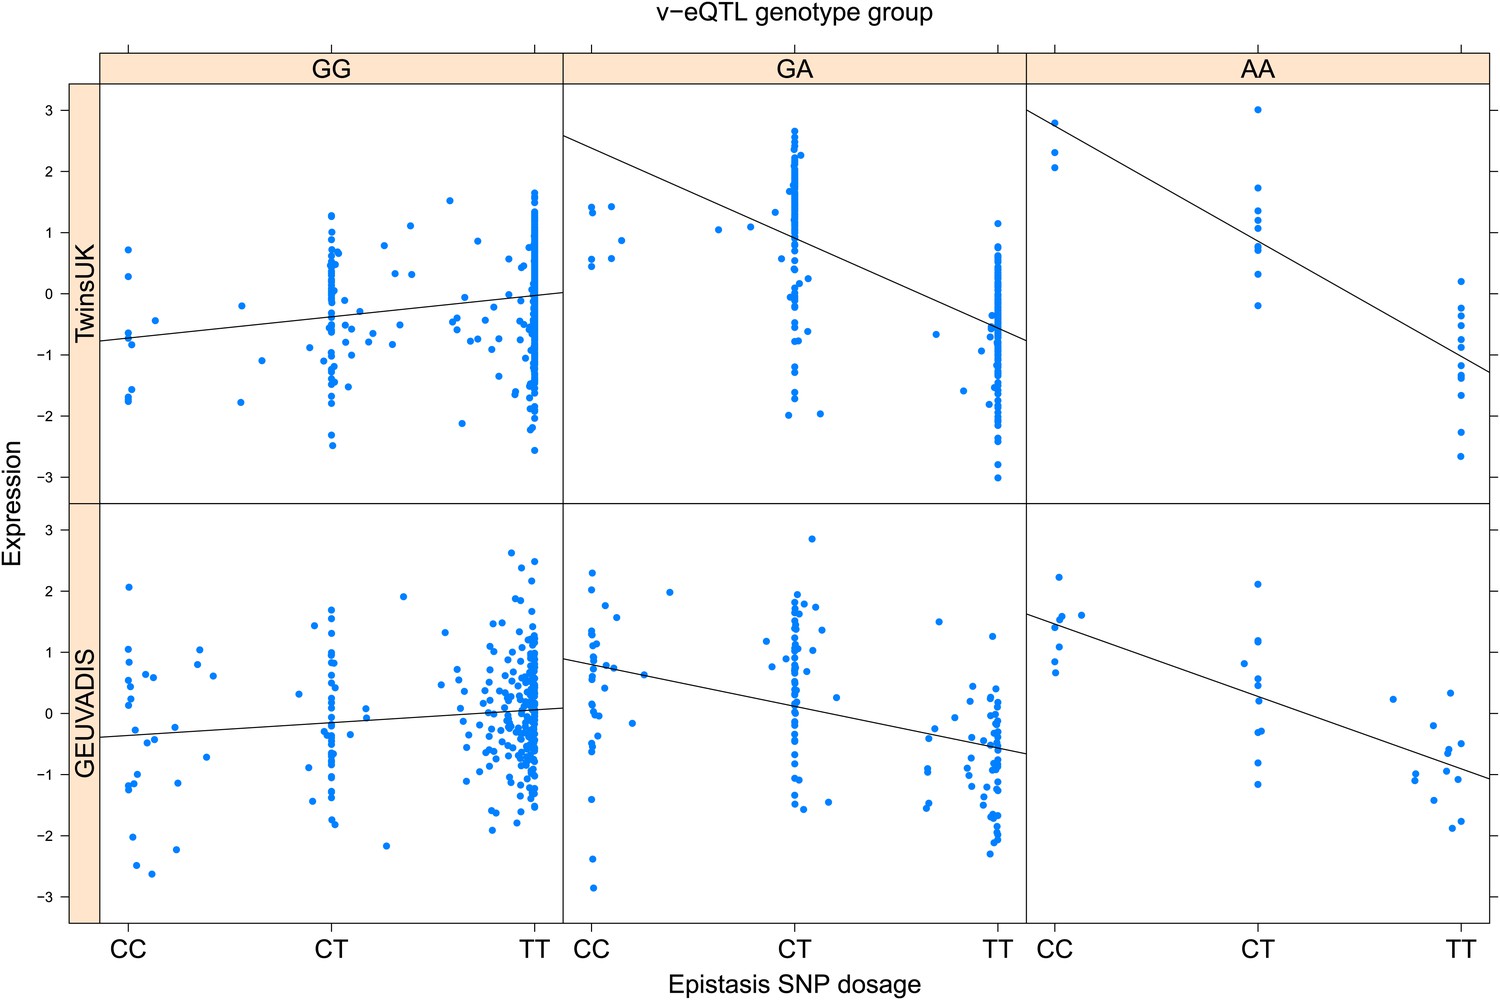
Figure 2—figure supplement 5
ENSG00000232629 (HLA-DQB2) expression is affected by an interaction between two SNPs in both TwinsUK and GEUVADIS cohorts.
Expression of HLA-DQB2 is shown, with a separate panel for each v-eQTL (rs114183935) genotype group. Relationship between expression and imputed genotype dosage of the epistasis SNP (rs9274666) is shown to be conditional on v-eQTL genotype. Expression from TwinsUK individuals is shown in the upper panels, GEUVADIS individuals in the lower panels. Best fit lines indicate the different epistatic SNP effects in the different v-eQTL genotype groups and are illustrative only. These lines are constructed ignoring twin structure in the case of the TwinsUK sample and population in the GEUVADIS cohort and do not represent model fit for the analysis performed.
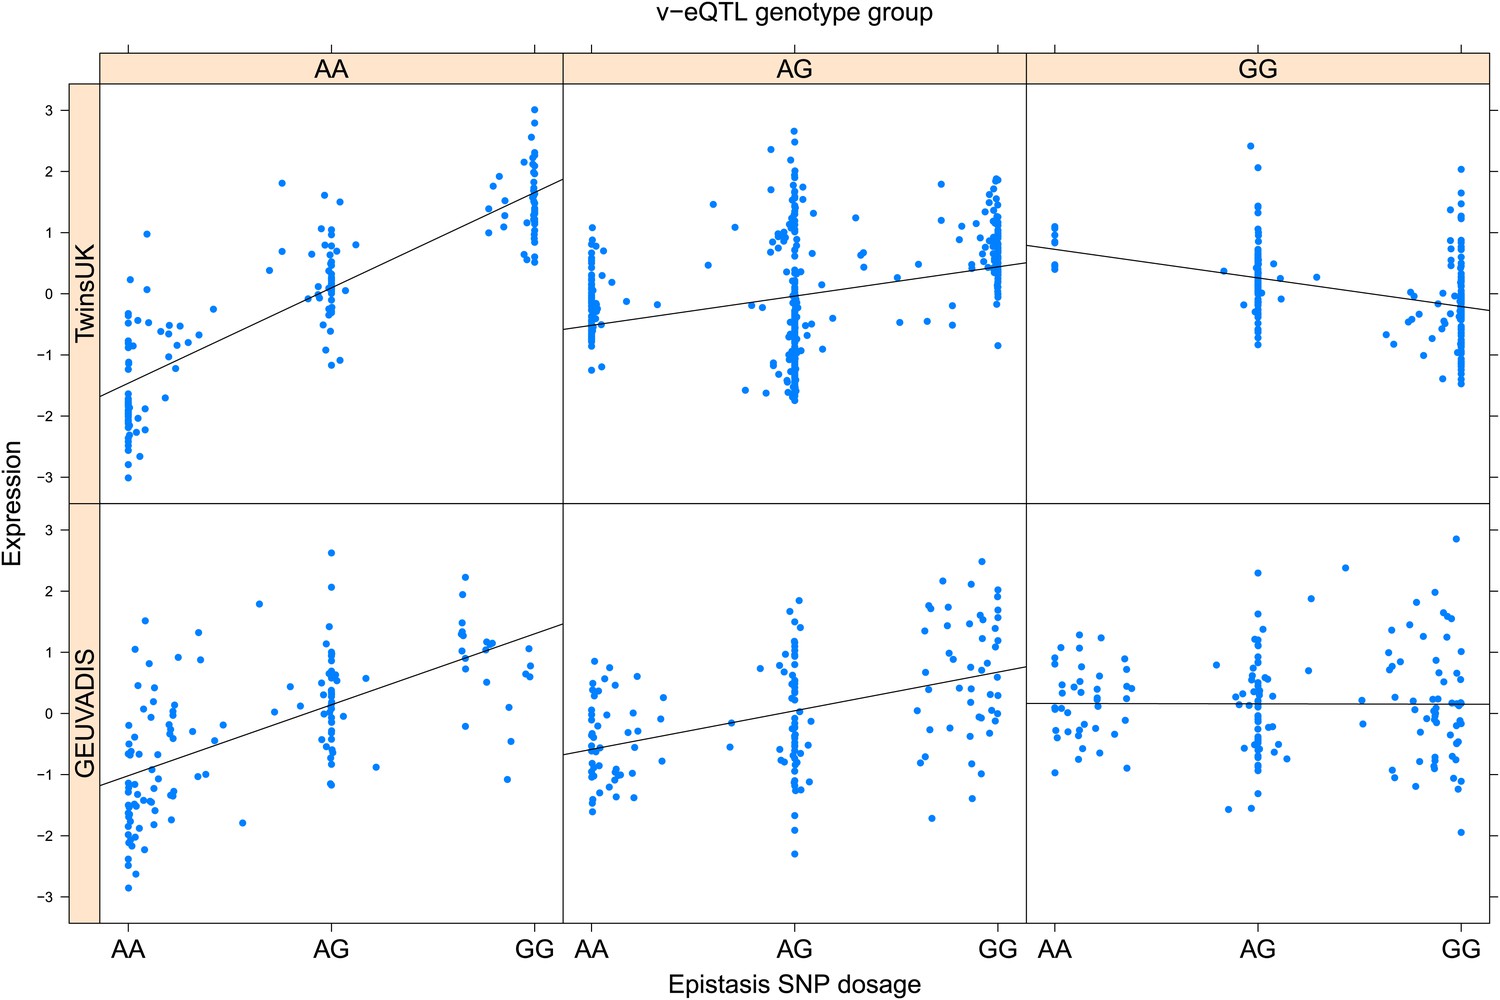
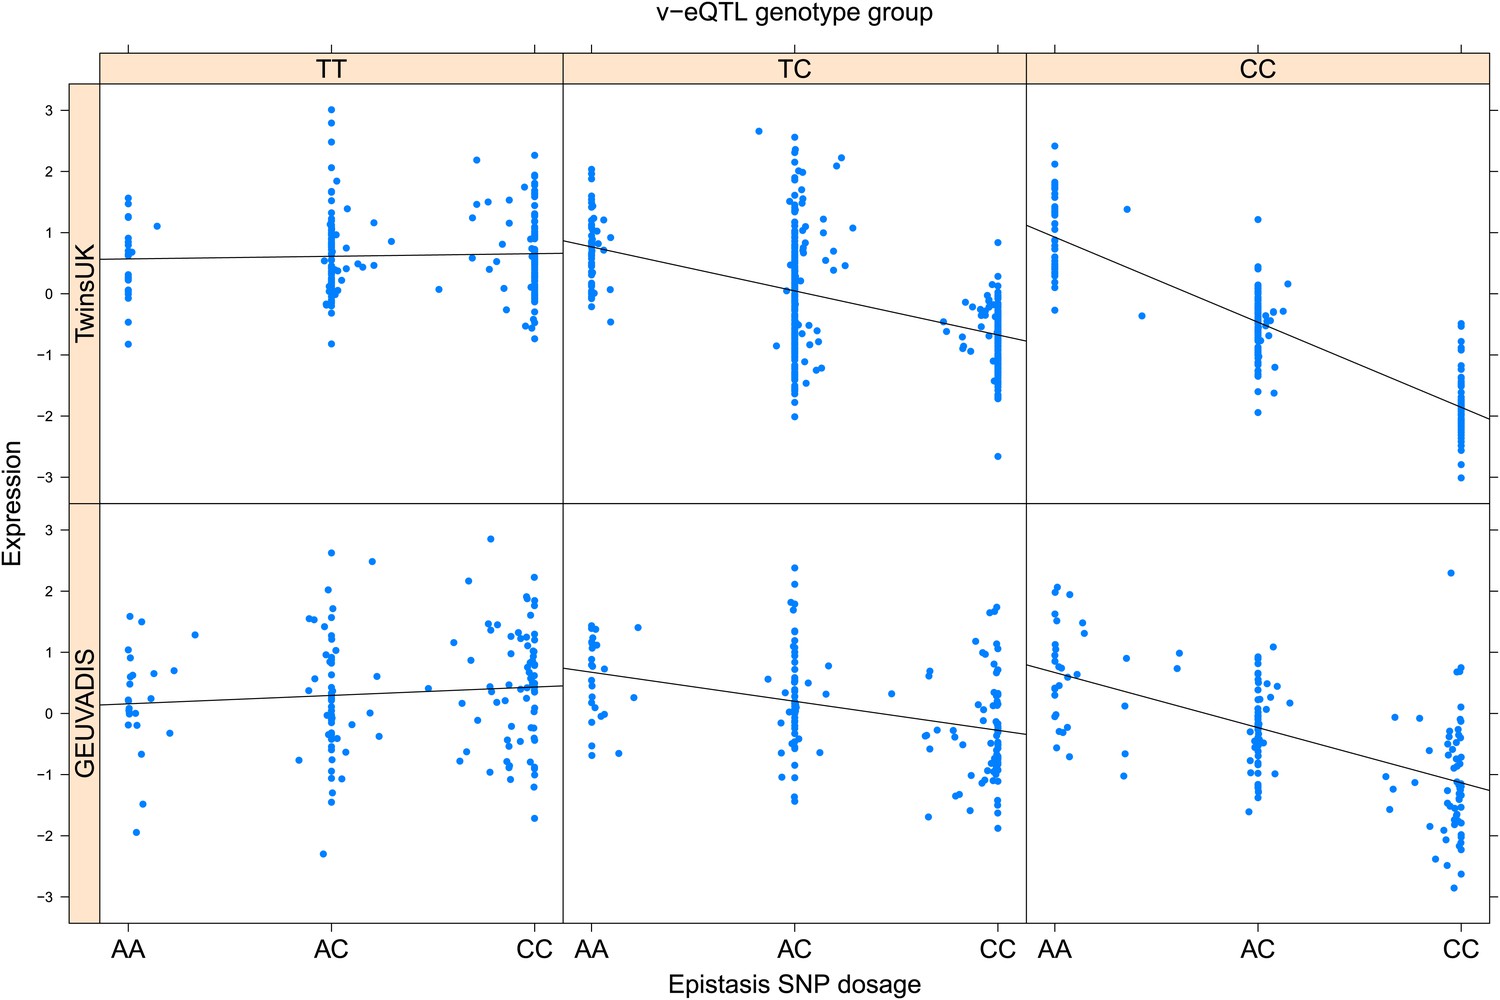
Figure 2—figure supplement 6
ENSG00000006282 (SPATA20) expression is affected by an interaction between two SNPs in both TwinsUK and GEUVADIS cohorts.
Expression of SPATA20 is shown, with a separate panel for each v-eQTL (rs12943759) genotype group. Relationship between expression and imputed genotype dosage of the epistasis SNP (rs1122634) is shown to be conditional on v-eQTL genotype. Expression from TwinsUK individuals is shown in the upper panels, GEUVADIS individuals in the lower panels. Best fit lines indicate the different epistatic SNP effects in the different v-eQTL genotype groups and are illustrative only. These lines are constructed ignoring twin structure in the case of the TwinsUK sample and population in the GEUVADIS cohort and do not represent model fit for the analysis performed.
Figure 2—figure supplement 7
ENSG00000204531 (POU5F1) expression is affected by an interaction between two SNPs in both TwinsUK and GEUVADIS cohorts.
Expression of POU5F1 is shown, with a separate panel for each v-eQTL (rs116627368) genotype group. Relationship between expression and imputed genotype dosage of the epistasis SNP (rs115631087) is shown to be conditional on v-eQTL genotype. Expression from TwinsUK individuals is shown in the upper panels, GEUVADIS individuals in the lower panels. Best fit lines indicate the different epistatic SNP effects in the different v-eQTL genotype groups and are illustrative only. These lines are constructed ignoring twin structure in the case of the TwinsUK sample and population in the GEUVADIS cohort and do not represent model fit for the analysis performed.
Figure 2—figure supplement 8
ENSG00000021355 (SERPINB1) expression is affected by an interaction between two SNPs in both TwinsUK and GEUVADIS cohorts.
Expression of SERPINB1 is shown, with a separate panel for each v-eQTL (rs318452) genotype group. Relationship between expression and imputed genotype dosage of the epistasis SNP (rs6940344) is shown to be conditional on v-eQTL genotype. Expression from TwinsUK individuals is shown in the upper panels, GEUVADIS individuals in the lower panels. Best fit lines indicate the different epistatic SNP effects in the different v-eQTL genotype groups and are illustrative only. These lines are constructed ignoring twin structure in the case of the TwinsUK sample and population in the GEUVADIS cohort and do not represent model fit for the analysis performed.
Figure 2—figure supplement 9
ENSG00000164111 (ANXA5) expression is affected by an interaction between two SNPs in both TwinsUK and GEUVADIS cohorts.
Expression of ANXA5 is shown, with a separate panel for each v-eQTL (rs6857766) genotype group. Relationship between expression and imputed genotype dosage of the epistasis SNP (rs12511956) is shown to be conditional on v-eQTL genotype. Expression from TwinsUK individuals is shown in the upper panels, GEUVADIS individuals in the lower panels. Best fit lines indicate the different epistatic SNP effects in the different v-eQTL genotype groups and are illustrative only. These lines are constructed ignoring twin structure in the case of the TwinsUK sample and population in the GEUVADIS cohort and do not represent model fit for the analysis performed.
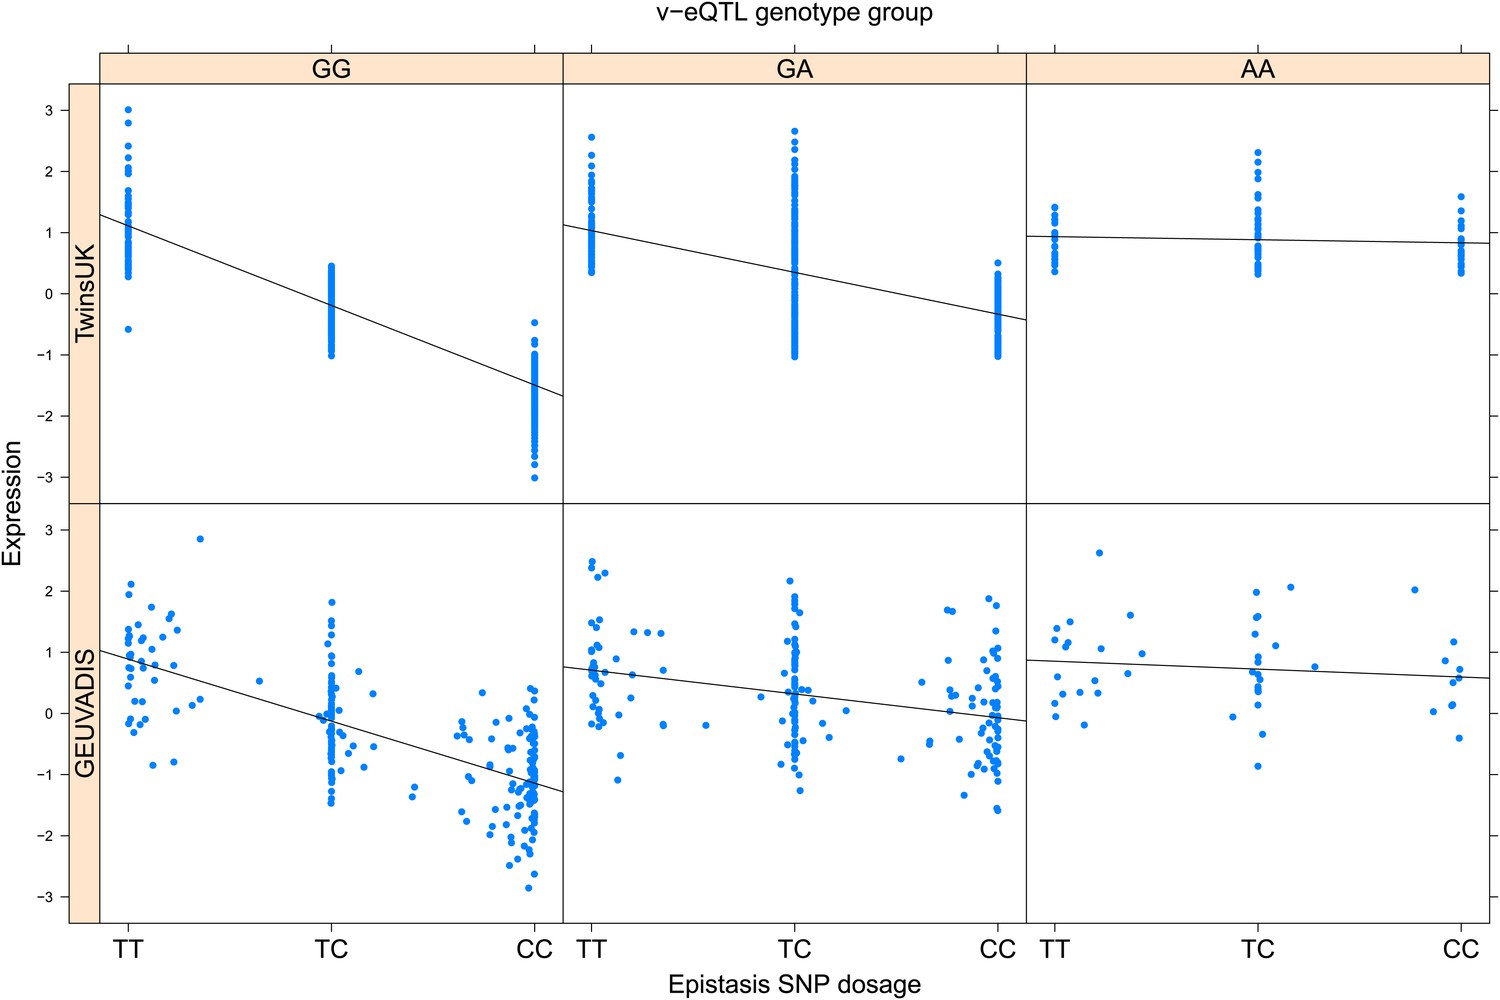
Figure 2—figure supplement 10
ENSG00000137310 (TCF19) expression is affected by an interaction between two SNPs in both TwinsUK and GEUVADIS cohorts.
Expression of TCF19 is shown, with a separate panel for each v-eQTL (rs115523621) genotype group. Relationship between expression and imputed genotype dosage of the epistasis SNP (rs115921994) is shown to be conditional on v-eQTL genotype. Expression from TwinsUK individuals is shown in the upper panels, GEUVADIS individuals in the lower panels. Best fit lines indicate the different epistatic SNP effects in the different v-eQTL genotype groups and are illustrative only. These lines are constructed ignoring twin structure in the case of the TwinsUK sample and population in the GEUVADIS cohort and do not represent model fit for the analysis performed.
Figure 2—figure supplement 11
ENSG00000204525 (HLA-C) expression is affected by an interaction between two SNPs in both TwinsUK and GEUVADIS cohorts.
Expression of HLA-C is shown, with a separate panel for each v-eQTL (rs114916097) genotype group. Relationship between expression and imputed genotype dosage of the epistasis SNP (rs116012228) is shown to be conditional on v-eQTL genotype. Expression from TwinsUK individuals is shown in the upper panels, GEUVADIS individuals in the lower panels. Best fit lines indicate the different epistatic SNP effects in the different v-eQTL genotype groups and are illustrative only. These lines are constructed ignoring twin structure in the case of the TwinsUK sample and population in the GEUVADIS cohort and do not represent model fit for the analysis performed.
Figure 2—figure supplement 12
ENSG00000176531 (PHLDB3) expression is affected by an interaction between two SNPs in both TwinsUK and GEUVADIS cohorts.
Expression of PHLDB3 is shown, with a separate panel for each v-eQTL (rs10409591) genotype group. Relationship between expression and imputed genotype dosage of the epistasis SNP (rs2682547) is shown to be conditional on v-eQTL genotype. Expression from TwinsUK individuals is shown in the upper panels, GEUVADIS individuals in the lower panels. Best fit lines indicate the different epistatic SNP effects in the different v-eQTL genotype groups and are illustrative only. These lines are constructed ignoring twin structure in the case of the TwinsUK sample and population in the GEUVADIS cohort and do not represent model fit for the analysis performed.
Figure 2—figure supplement 13
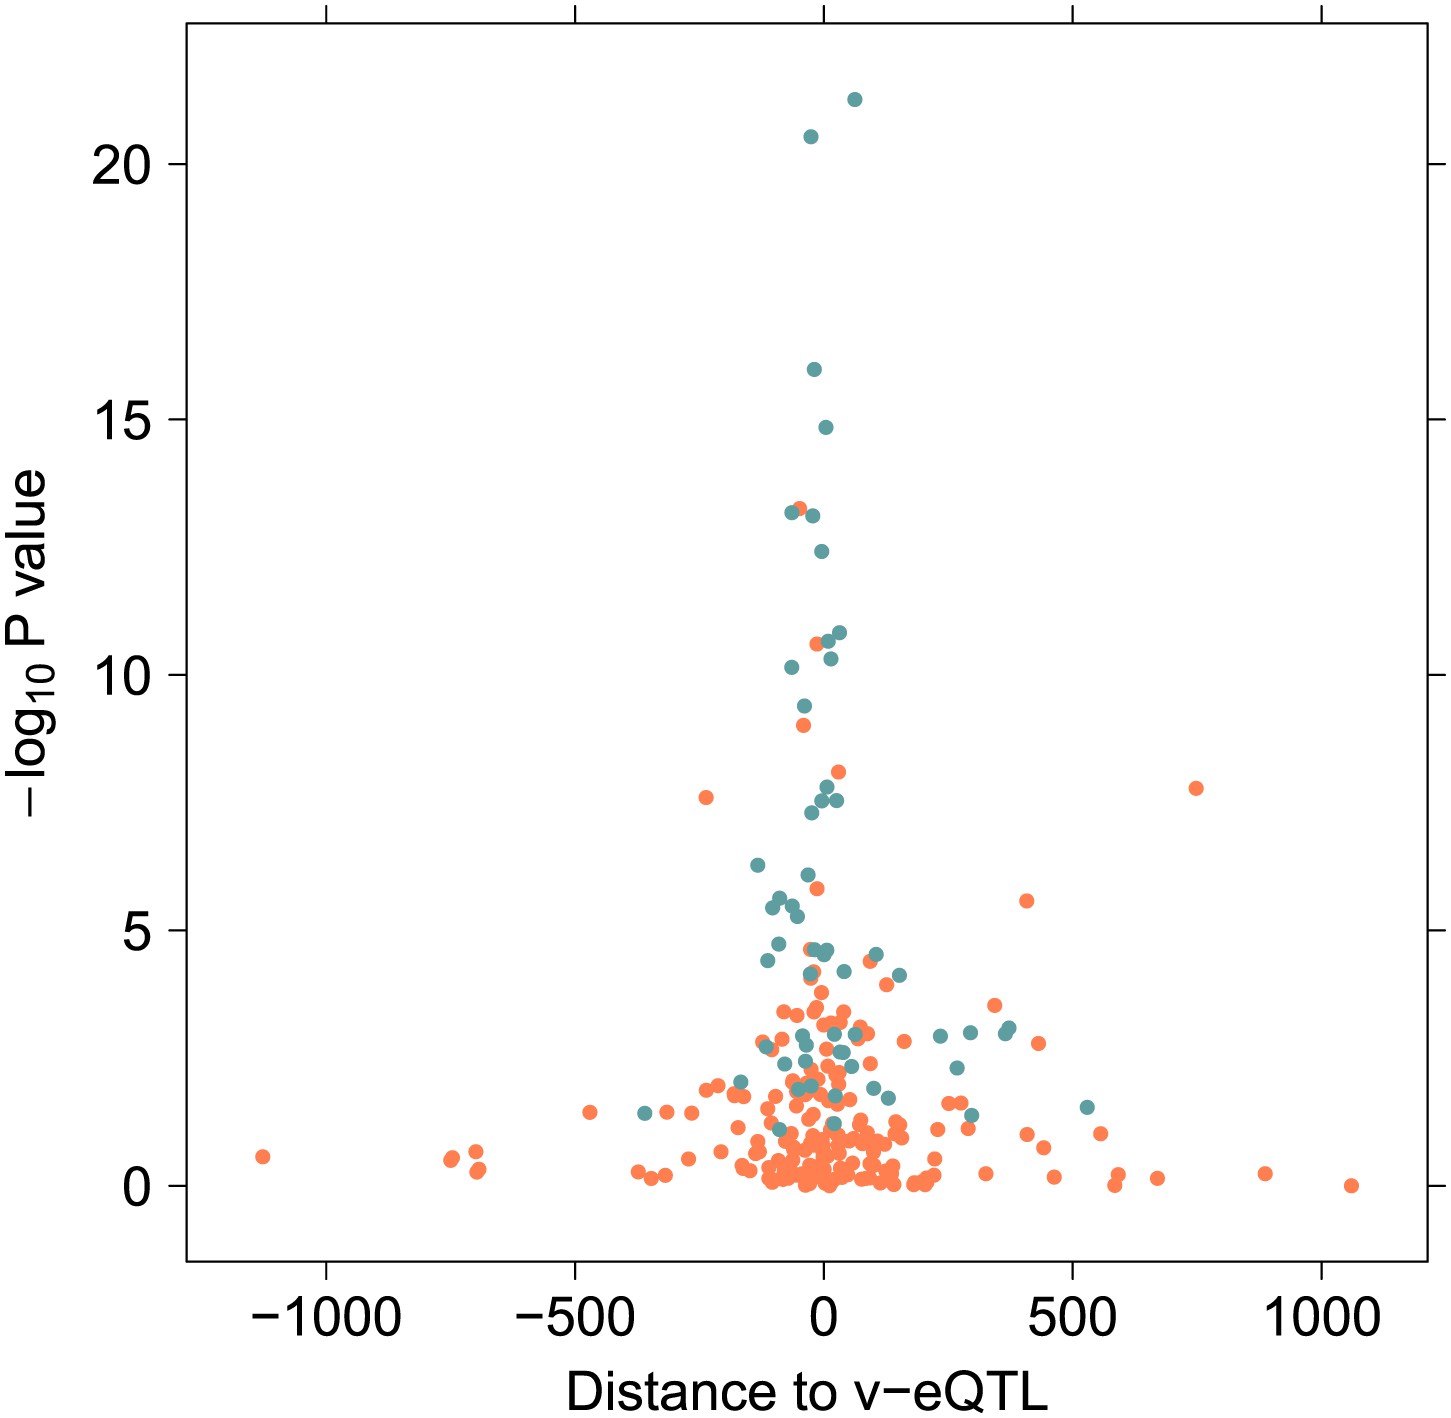
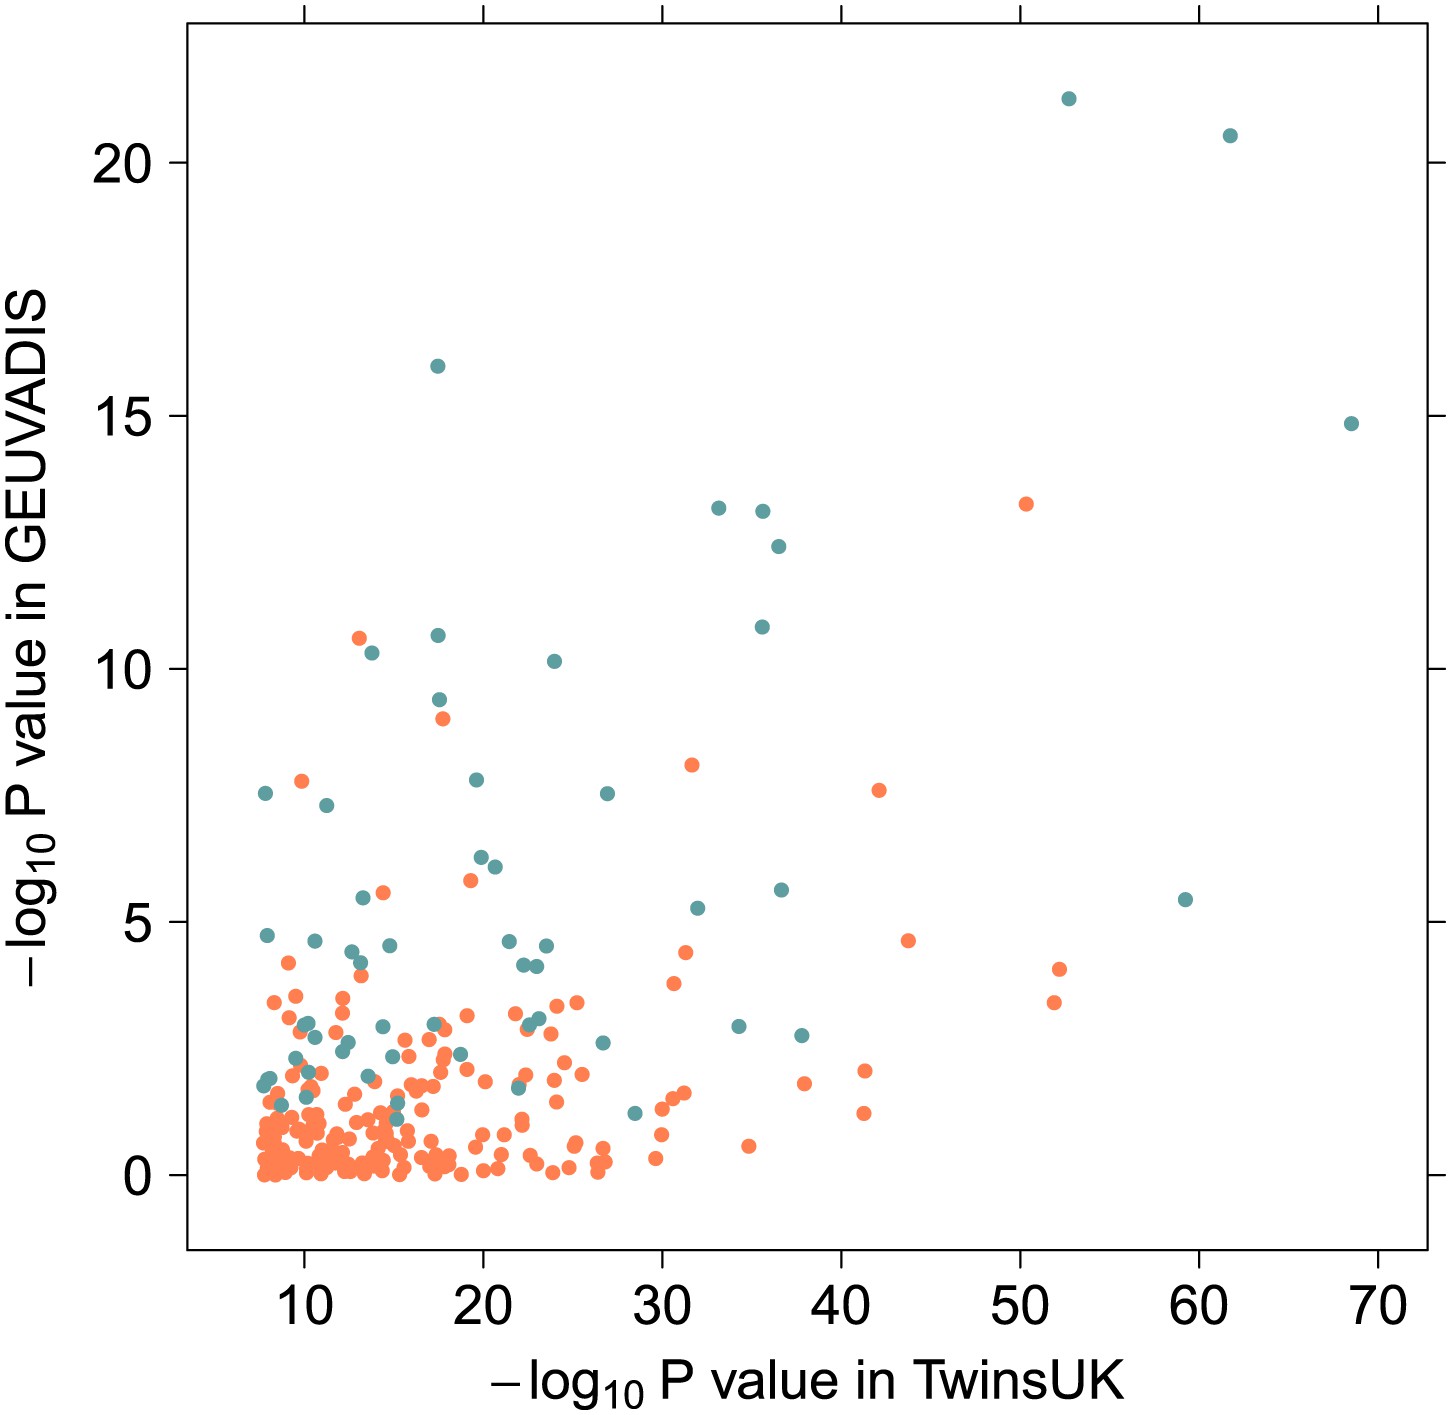
The distance in kilobases from the 246 variants in epistasis to the v-eQTL, plotted against the –log10 p value in 1000 Genomes sample.
Using the p value in the replication sample avoids inflation by winners curse. The blue dots are the 57 replicated associations after removing haplotype effects.
Figure 3

Variance explained by additive and interacting variants for 57 replicated examples of epistasis in the GEUVADIS cohort.
We show the variation explained by the interaction of two SNPs on phenotype, compared to the additive contribution of the SNPs.
Figure 4
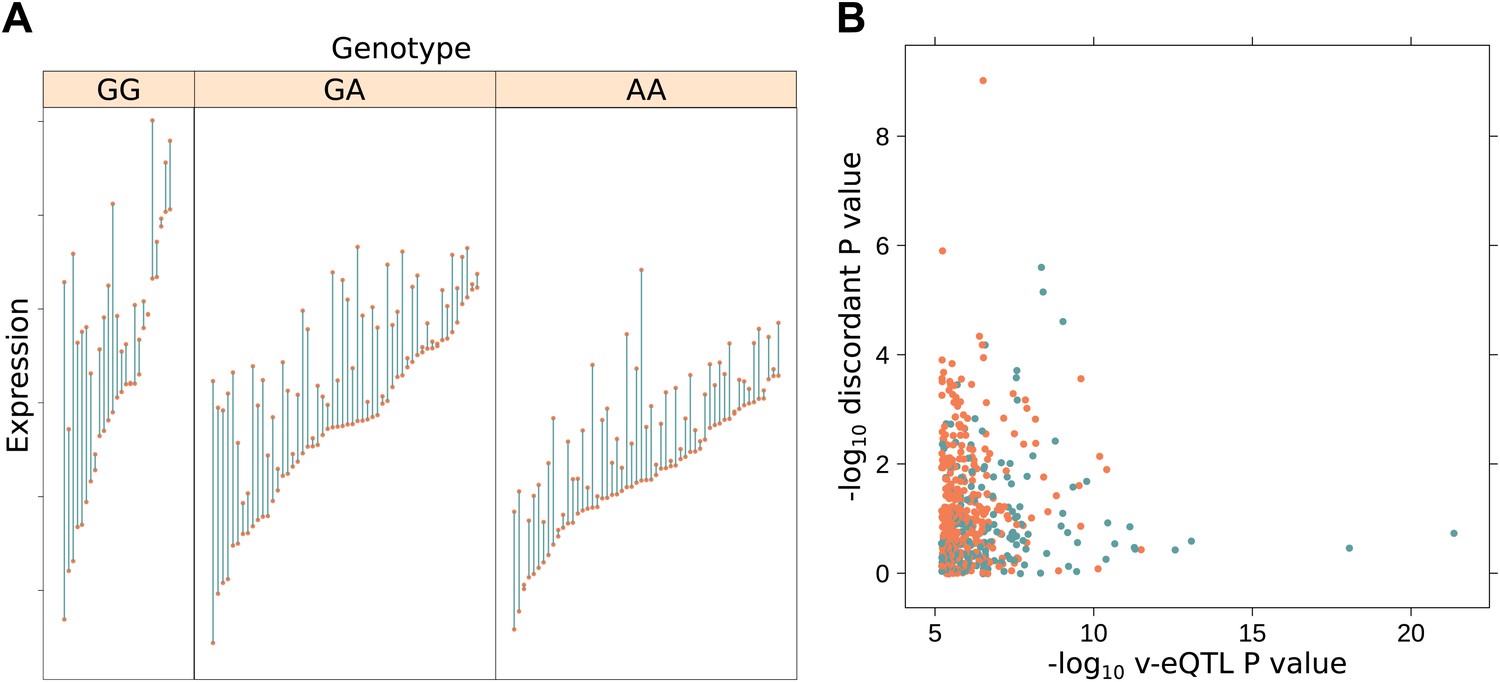
Increased discordance within MZ twin pairs identifies GxE interactions.
(A) We show discordance in expression between MZ twin pairs for the gene BAMBI broken down by v-eQTL genotype (rs10826519). Discordance is greatest in the GG genotype group (mean difference between MZ twins is 1.12), decreasing with each additional copy of the A allele (mean discordance is 0.85 for GA genotype group, 0.60 for AA). Since MZ twins are genetically identical, genotype dependent discordance in expression must be a consequence of environment, pointing to GxE. We observe that the SNP also has an effect on the mean level of expression (p = 5.42 × 10⁻¹⁹). (B) −log10 p values for genotype dependent discordance in MZ twins against −log10 p values for peak v-eQTL. The blue dots represent points where there is a significant epistasis hit with the v-eQTL, orange where no such interaction was detected. For many of the strong v-eQTL with little evidence of discordance we can identify an epistatic interaction which explains the increase in variance. However, for some loci with strong evidence of genotype dependent MZ discordance we also detect an epistatic interaction, suggesting both epistasis and GxE acts on these genes.
Tables
Table 1
Replication analysis
| Test | Threshold | Associations (available for testing in GEUVADIS) | Replicate, FDR <0.05 (% success) | Same direction of effect (% success) | π1 |
|---|---|---|---|---|---|
| v-eQTL | FDR <0.05 | 508 (485) | 28 (5.8%) | 26 (93%) | 0.30 |
| v-eQTL | Bonf <0.05 | 23 (23) | 16 (70%) | 15 (94%) | 0.72 |
| Epistasis | Bonf <0.05 | 256 (246) | 137 (56%) | 131 (96%) | 0.71 |
-
Significant associations (at FDR and Bonferroni thresholds) from the TwinsUK sample were replicated in GEUVADIS samples. The number of overlapping SNPs and genes in both datasets per analysis is shown, as well as the percentage of replicated associations. π1 is an estimate of the proportion of replicating loci in the GEUVADIS cohort (Storey, 2002).
Table 2
Effect size estimates and significance for the ten most significant replicated interactions in TwinsUK and GEUVADIS
| Gene | Chr | v-eQTL | Interacting epistasis SNP | Interaction variance in TwinsUK | Interaction variance in GEUVADIS | Additive variation in GEUVADIS | p-value in TwinsUK | p-value in GEUVADIS |
|---|---|---|---|---|---|---|---|---|
| NUDT2 | 9 | rs10972055 | rs10814083 | −0.328 | −0.128 | 0.310 | 1.88 × 10−53 | 5.43 × 10⁻²² |
| HLA-DQB2 | 6 | rs114183935 | rs1049130 | −0.337 | −0.161 | 0.099 | 1.83 × 10−62 | 2.91 × 10⁻²¹ |
| HLA-DQB2 | 6 | rs114183935 | rs9274666 | −0.368 | −0.119 | 0.158 | 3.45 × 10⁻¹⁸ | 1.04 × 10⁻¹⁶ |
| SPATA20 | 17 | rs12943759 | rs1122634 | 0.301 | 0.078 | 0.404 | 3.12 × 10−69 | 1.42 × 10⁻¹⁵ |
| POU5F1 | 6 | rs116627368 | rs115631087 | 0.311 | 0.116 | 0.008 | 6.95 × 10⁻³⁴ | 6.63 × 10⁻¹⁴ |
| SERPINB1 | 6 | rs318452 | rs6940344 | −0.227 | −0.102 | 0.117 | 2.40 × 10−36 | 7.66 × 10⁻¹⁴ |
| ANXA5 | 4 | rs6857766 | rs12511956 | −0.411 | −0.104 | 0.056 | 3.09 × 10−37 | 3.81 × 10⁻¹³ |
| TCF19 | 6 | rs115523621 | rs115921994 | −0.585 | −0.076 | 0.201 | 2.59 × 10−36 | 1.48 × 10⁻¹¹ |
| HLA-C | 6 | rs114916097 | rs116012228 | 0.160 | 0.077 | 0.183 | 3.35 × 10⁻¹⁸ | 2.17 × 10⁻¹¹ |
| PHLDB3 | 19 | rs10409591 | rs2682547 | −0.270 | −0.0858 | 0.0569 | 1.67 × 10⁻¹⁴ | 4.83 × 10⁻¹¹ |
-
Effect sizes are reported as the proportion of variance explained by the interaction. Sign of effect size reflects direction of interaction effect: positive implies combined effect of the alternate alleles is an increase in expression greater than predicted by separate additive effects, and negative that it is less.
Additional files
-
Supplementary file 1
A: peak vQTL hits in TwinsUK cohort with evidence of eQTL and discordant QTL and replication evidence in GEUVADIS cohort. B: significant epistasis hits in TwinsUK cohort with p values and effect size estimates in GEUVADIS cohort. C: contribution of cis variants, trans variants, interactions between the two and unique environment to variation in gene expression.
- https://doi.org/10.7554/eLife.01381.034
-
Supplementary file 2
R functions applied to data from the TwinsUK cohort to test individual SNPs for variance effects, to map all independent epistatic interactions with the v-eQTL in the cis window and to eliminate dominance effects from list of epistatic interactions.
- https://doi.org/10.7554/eLife.01381.035
-
Supplementary file 3
R workspace containing replication data from the GEUVADIS cohort (Lappalainen et al., 2013) together with functions to repeat the replication analysis.
- https://doi.org/10.7554/eLife.01381.036
-
Supplementary file 4
Read me file explaining objects present in SM2.
- https://doi.org/10.7554/eLife.01381.037
Download links
A two-part list of links to download the article, or parts of the article, in various formats.
Downloads (link to download the article as PDF)
Open citations (links to open the citations from this article in various online reference manager services)
Cite this article (links to download the citations from this article in formats compatible with various reference manager tools)
Genetic interactions affecting human gene expression identified by variance association mapping
eLife 3:e01381.
https://doi.org/10.7554/eLife.01381


