Synaptotagmin 7 functions as a Ca2+-sensor for synaptic vesicle replenishment
- Howard Hughes Medical Institute, University of Wisconsin–Madison, United States
Figures
Figure 1

Normal spontaneous and single AP evoked EPSCs in KO neurons.
(A) Representative miniature EPSC (mEPSC; recorded in the presence of TTX) traces from WT and KO hippocampal neurons. (B) Representative mEPSCs from WT (grey) and KO (red) neurons. (C–E) mEPSC amplitude (C, WT: 20.78 ± 1.26 pA; KO: 20.46 ± 2.38 pA), charge (D, WT: 116 ± 12 fC; KO: 119 ± 18 fC) and frequency (E, WT: 2.32 ± 0.44 Hz; KO: 2.83 ± 0.63 pA) were the same between WT and KO neurons. (F–J) Analysis of single AP evoked EPSCs recorded from WT and KO neurons in the presence of 10 mM [Ca2+]o. (F) Representative EPSCs recorded from WT and KO neurons. (G–I) EPSC amplitude (G, WT: 0.25 ± 0.05 nA; KO: 0.24 ± 0.03 nA), peak latency (H, WT: 17.03 ± 2.22 ms; KO: 18.27 ± 2.29 ms) and rise time (I, WT: 4.8 ± 0.53 ms; KO: 5.21 ± 0.74 ms) were the same between WT and KO neurons. (J) The normalized cumulative total charge was fitted with a double exponential function (solid line). WT and KO neurons had identical charge transfer kinetics. (K) Representative single AP evoked EPSCs recorded from WT and KO neurons in the presence of the indicated [Ca2+]o. (L–M) EPSC amplitudes (L) and relative amplitudes (M) plotted vs [Ca2+]o. The n values indicate the number of neurons from two independent litters of mice; these values are provided in the bars in all figures in this study. All data represent mean ± SEM. Statistical significance was analyzed using the Student’s t test.
Figure 2
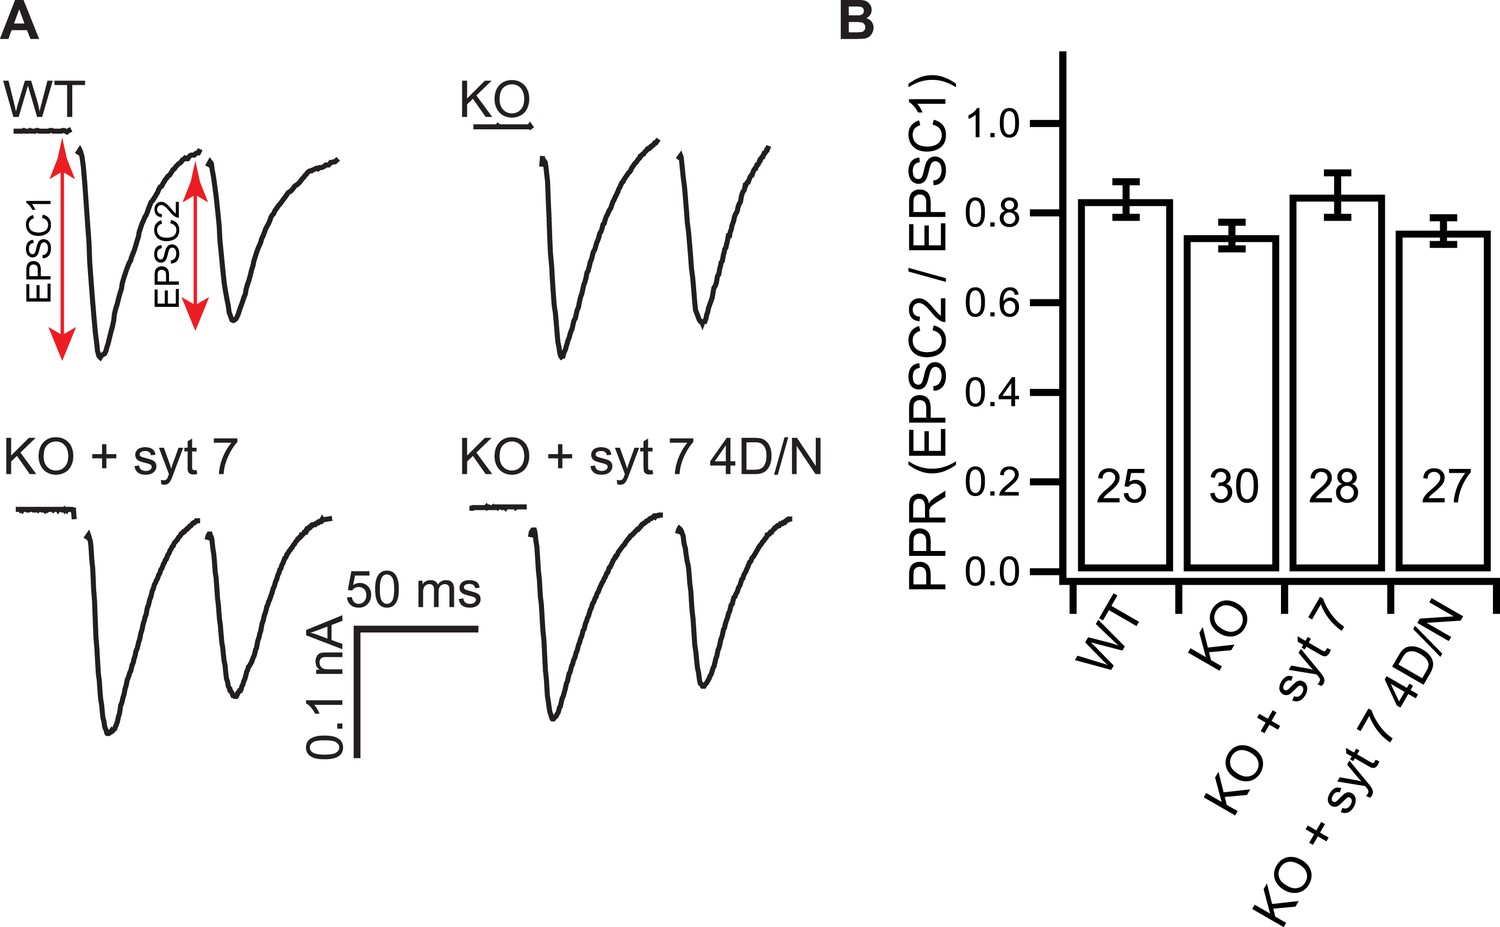
Loss of syt 7 does not affect the PPR.
(A) Representative EPSCs recorded in paired-pulse experiments, with 50 ms inter-stimulus intervals, from WT, KO, or KO neurons expressing either WT (KO + syt 7) or the Ca2+ ligand mutant form (KO + syt 7 4D/N) of syt 7. (B) The PPRs were the same among all groups (WT: 0.83 ± 0.04; KO: 0.75 ± 0.03; KO + syt 7: 0.84 ± 0.05; and KO + syt 7 4D/N: 0.76 ± 0.03). The n values indicate the number of neurons, obtained from three independent litters of mice, used for these experiments. All data represent mean ± SEM. Statistical significance was analyzed by one-way ANOVA.
Figure 3 with 5 supplements
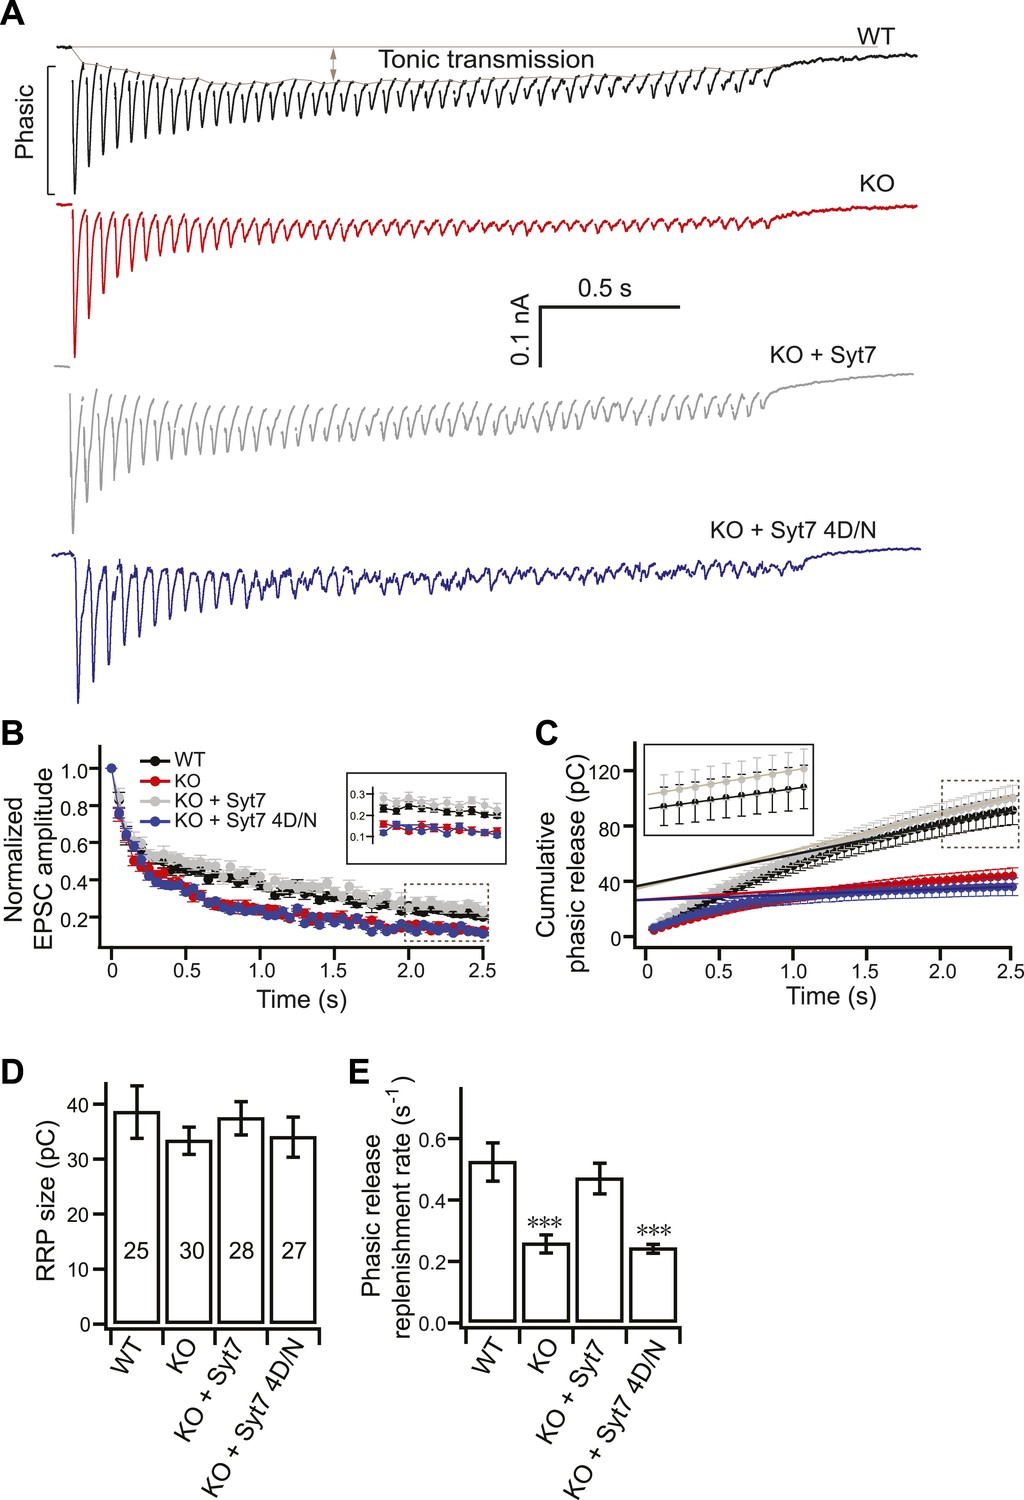
SV replenishment is reduced in KO neurons.
(A) Representative EPSC traces (20 Hz/2.5 s) recorded from WT (black), KO (red), or KO neurons expressing either WT (KO + syt 7, gray) or the 4D/N mutant form of syt 7 (KO + syt 7 4D/N, blue). The phasic and tonic components of transmission are indicated within the representative WT trace. (B) The peak amplitude of each EPSC was divided by the peak of the first response and plotted vs time. Inset: expansion of the last 10 responses. (C) Plot of cumulative total phasic charge transfer vs time. Data points from the last ten EPSCs were fitted with a linear function to calculate the RRP size (y-intercept in panel D), and SV replenishment rate (the slope divided by the RRP size; panel E). Inset: expansion of the last ten responses. (D) The RRP size is the same among all groups (WT: 38.70 ± 4.78 pC; KO: 33.49 ± 2.48 pC; KO + syt 7: 37.58 ± 3.02 pC; and KO + syt 7 4D/N: 34.16 ± 3.63 pC). (E) The SV replenishment rate was reduced in KO (0.26 ± 0.03 s−1) as compared to WT neurons (0.52 ± 0.06 s−1). WT (0.47 ± 0.05 s−1), but not 4D/N mutant syt 7 (0.24 ± 0.02 s−1), rescued SV replenishment. The n values indicate the number of neurons, obtained from three independent litters of mice, used for these experiments. All data shown represent mean ± SEM. ***p<0.001, analyzed by one-way ANOVA, compared to WT.
Figure 3—figure supplement 1
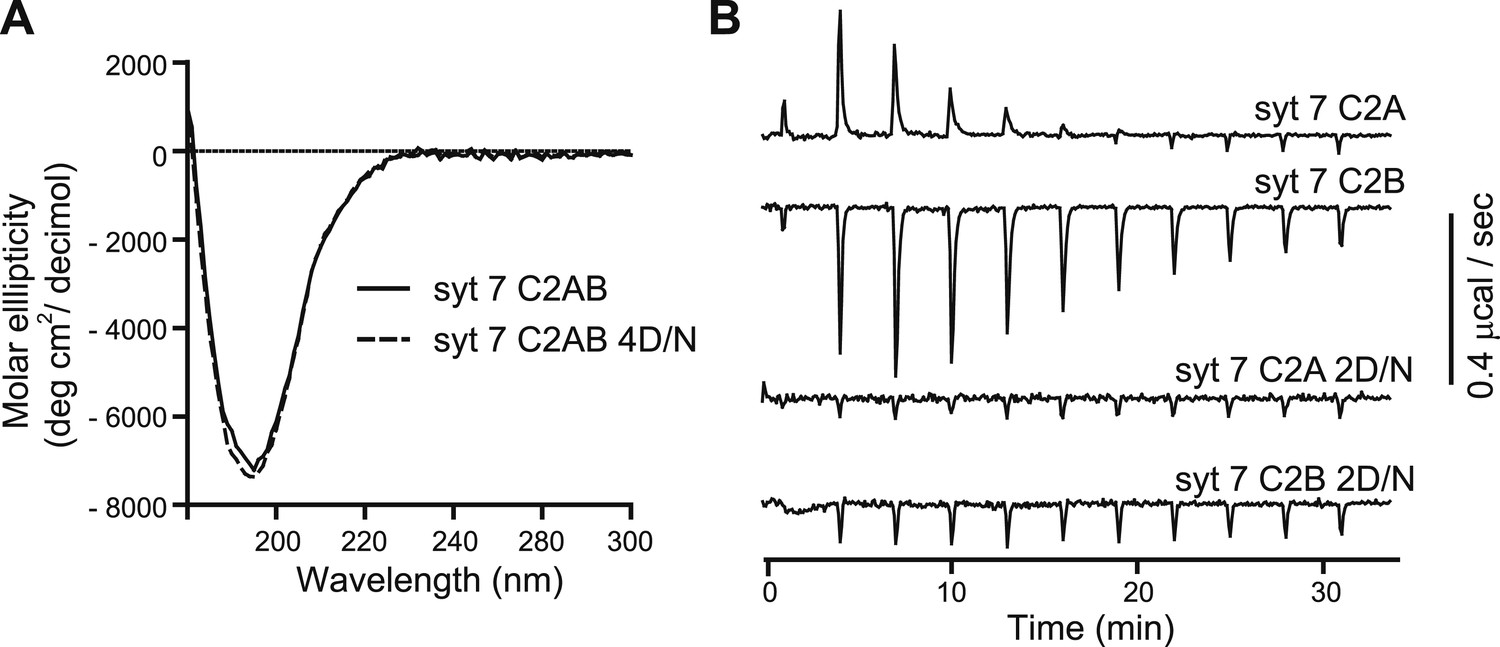
Ca2+-ligand mutations disrupt Ca2+ binding, but not proper folding, of syt 7.
(A) CD spectra of WT (syt 7 C2AB; solid lines) and the 4D/N mutant (syt 7 C2AB 4D/N, dashed line) versions of syt 7 C2AB domains; the spectra were identical. (B) ITC experiments utilizing the isolated C2-domains of WT (syt 7 C2A, syt 7 C2B) and mutant forms of each domain in which two putative acidic Ca2+ ligands were changed to Asn (syt 7 C2A 2D/N, syt 7 C2B 2D/N). Ca2+-binding to C2A and C2B was endothermic and exothermic, respectively; neither of the mutant C2-domains appeared to bind Ca2+ under these experimental conditions.
Figure 3—figure supplement 2
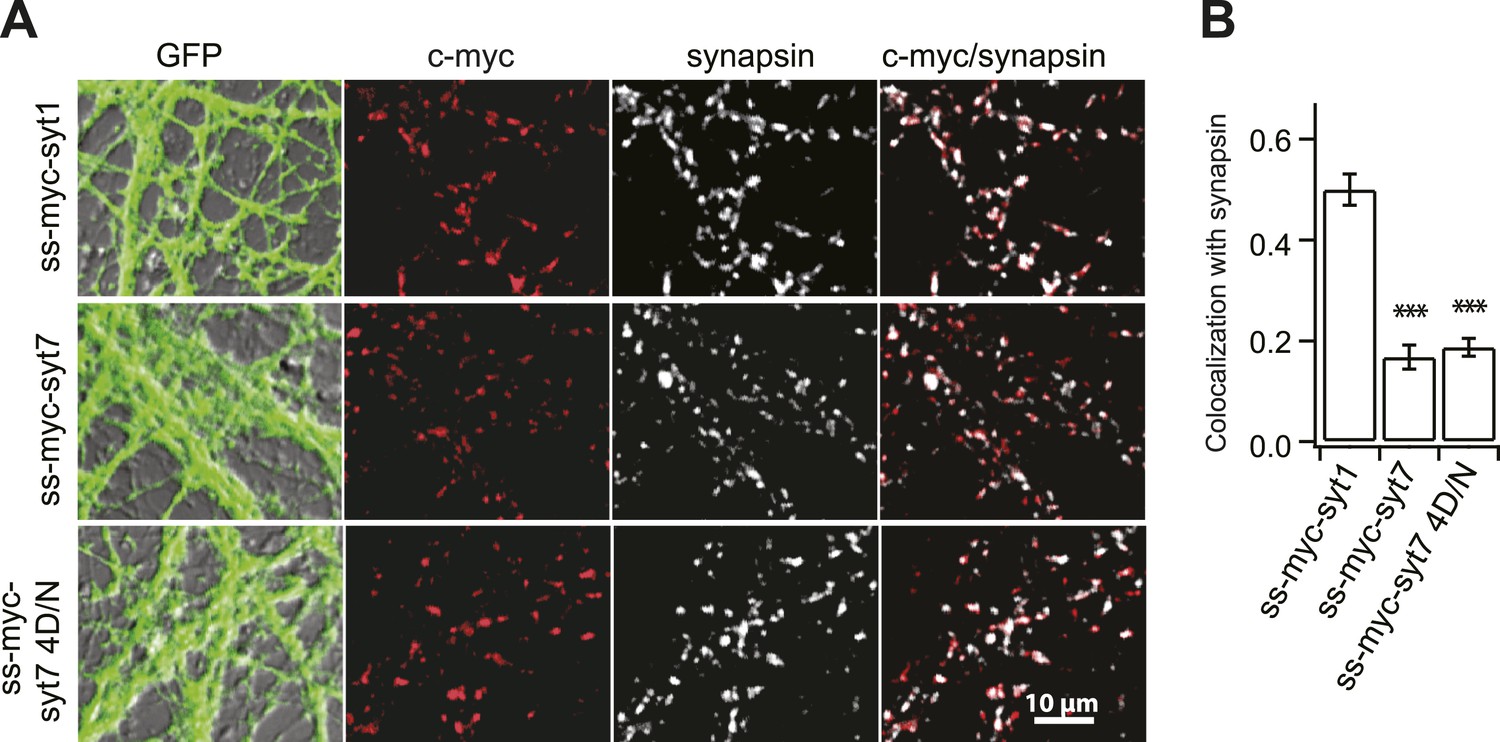
Syt 7 is not localized to SVs.
(A) A c-myc tag with a signal sequence was fused to the N-terminus of syt 7 (ss-myc-syt 7), syt 7 4D/N (ss-myc-syt 7 4D/N), and 1 (ss-myc-syt 1) as described in 'Materials and methods', and the resultant fusion protein was expressed in KO hippocampal neurons using lentivirus; cells were immunostained with antibodies against c-myc, the SV marker synapsin, or against GFP that was expressed via an independent promoter. (B) Analysis of the c-myc signals relative to the synapsin signals revealed that syt 1 (0.48 ± 0.03), but not syt 7 (0.18 ± 0.02) and syt 7 4D/N (0.19 ± 0.01), co-localized with SVs. Average colocalization, from 12 fields of view (∼100 boutons per field) from six coverslips, two coverslips each from three independent litters of mice. All data shown represent mean ± SEM. ***p<0.001, analyzed by one-way ANOVA, compared to WT.
Figure 3—figure supplement 3
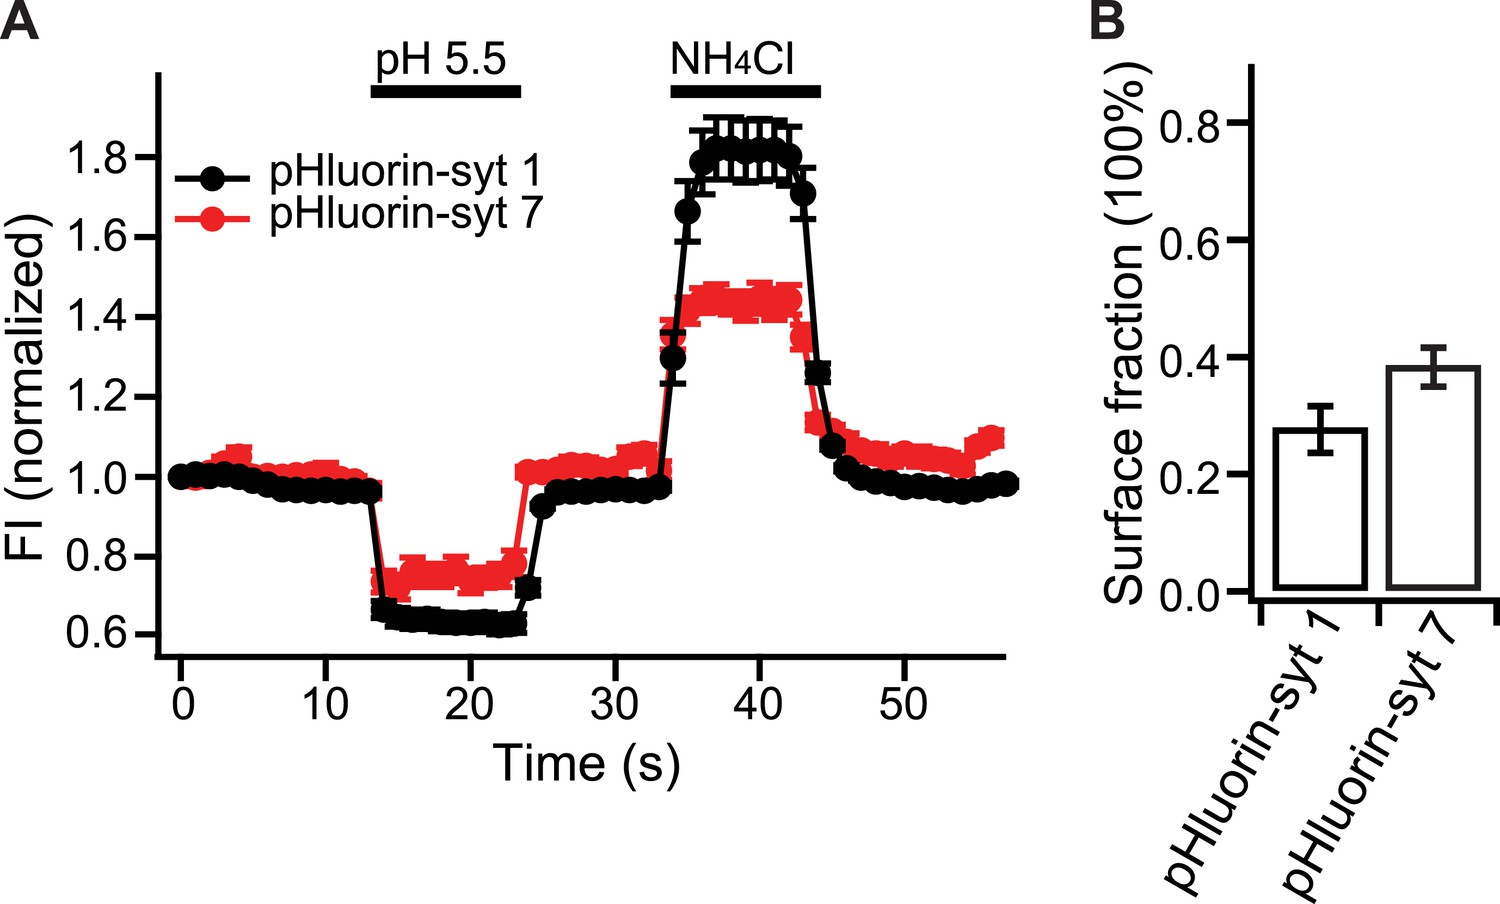
Relative distribution of syt 7 in the plasma membrane, vs internal compartments, in hippocampal neurons.
(A) Average fluorescence signals from pHluorin-syt 1 (black) and pHluorin-syt 7 (red) during perfusion with a low pH solution (pH 5.5) to quench surface fluorescence, and during perfusion with NH4Cl to neutralize acidic internal compartments and thus reveal internal pHluorin signals. (B) Quantitation of the surface fraction of syt 7 and syt 1; the majority of the signal is internal, but significant fractions of each protein are present in the plasma membrane. Data are averages from ∼300 boutons; 50 boutons from each of six coverslips, two coverslips per mouse, three independent litters of mice. All data shown represent mean ± SEM. Statistical significance was analyzed by the Student's t test.
Figure 3—figure supplement 4
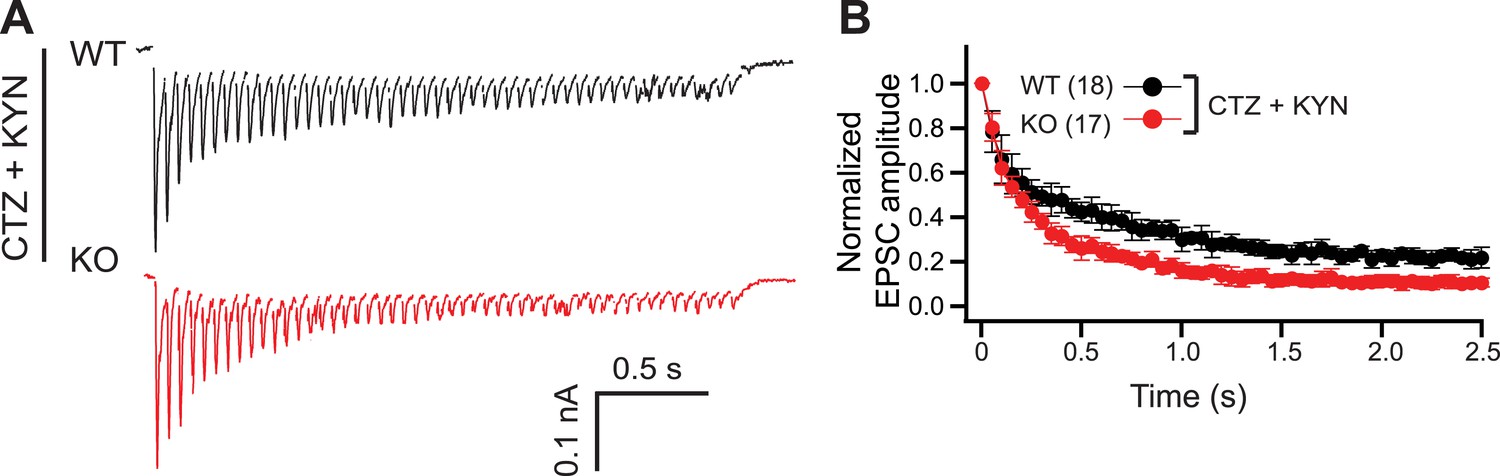
Postsynaptic receptor desensitization and saturation do not contribute to the KO phenotype.
(A) Representative EPSC traces (20 Hz/2.5 s) recorded from WT (black) and KO (red) neurons, in the presence of both CTZ and KYN. (B) The peak amplitude of each EPSC was normalized to the peak of the first response and plotted vs time. The n values indicate the number of neurons, obtained from three independent litters of mice, used for these experiments. All data shown represent mean ± SEM.
Figure 3—figure supplement 5
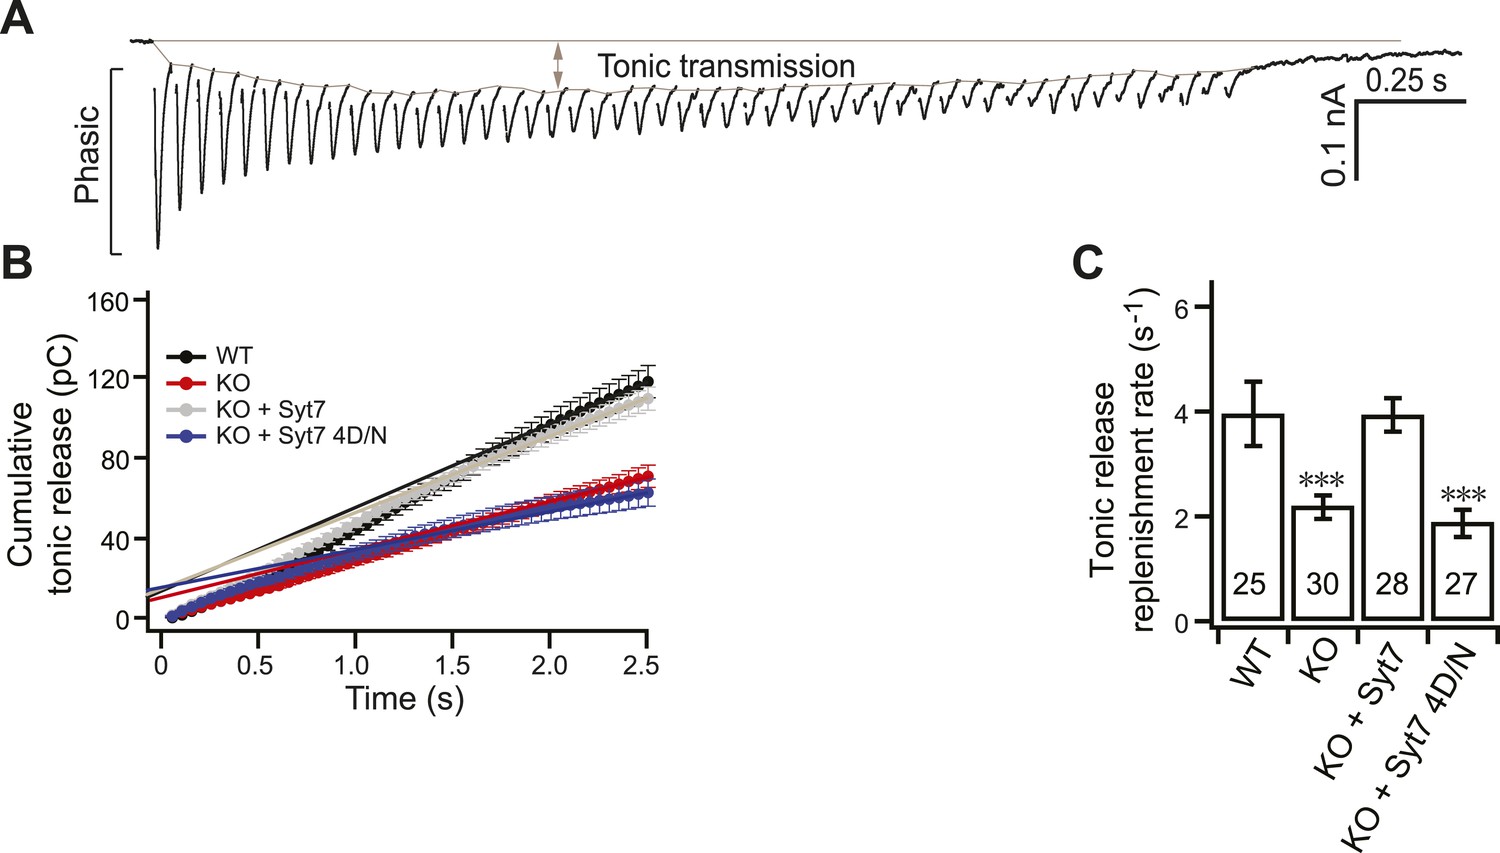
Replenishment of the tonic component of transmission is reduced in KO neurons.
(A) Representative EPSC traces from WT neurons illustrating both phasic and tonic release as shown in Figure 3A. (B) Plot of cumulative total tonic charge transfer vs time. Data were fitted and analyzed as described in Figure 3C. (C) SV replenishment was reduced in KO (2.19 ± 0.22 s−1) as compared to WT neurons (3.95 ± 0.61 s−1). WT (3.93 ± 0.31 s−1), but not the 4D/N mutant form (1.88 ± 0.26 s−1) of syt 7, rescued replenishment. The n values indicate the number of neurons, obtained from three independent litters of mice, used for these experiments. All data shown represent mean ± SEM. ***p<0.001, analyzed by one-way ANOVA, compared to WT.
Figure 4 with 1 supplement
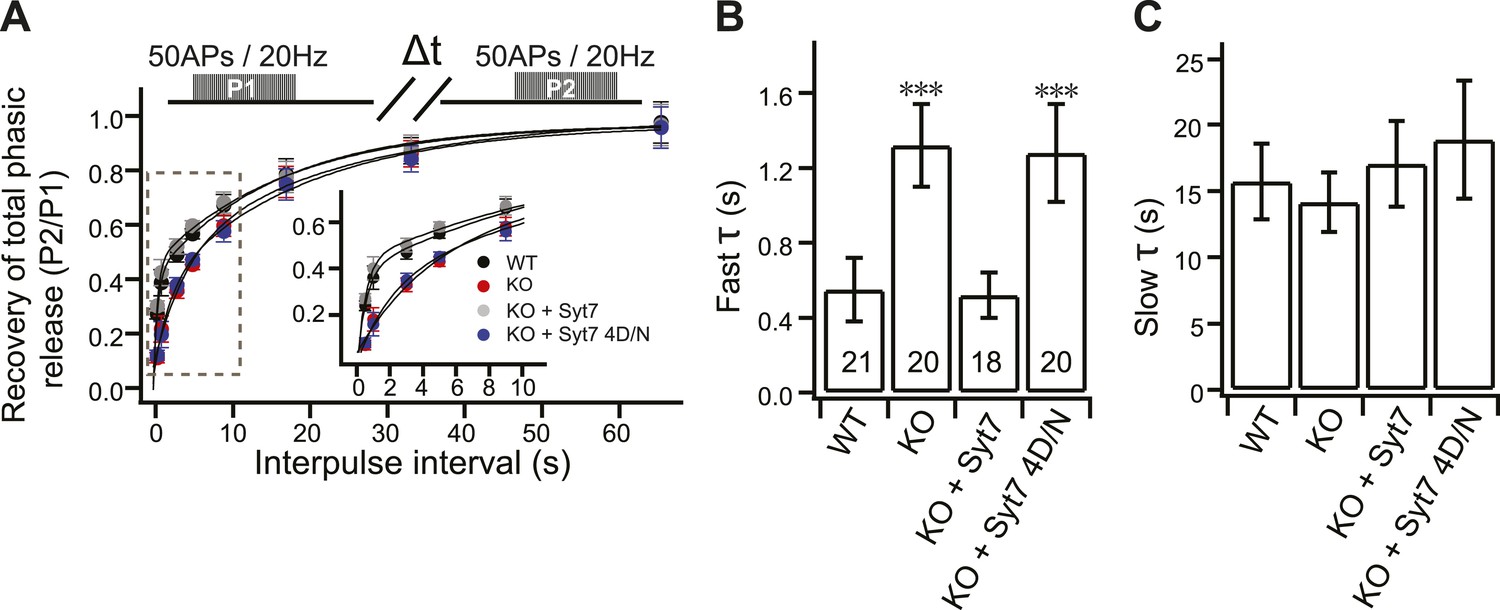
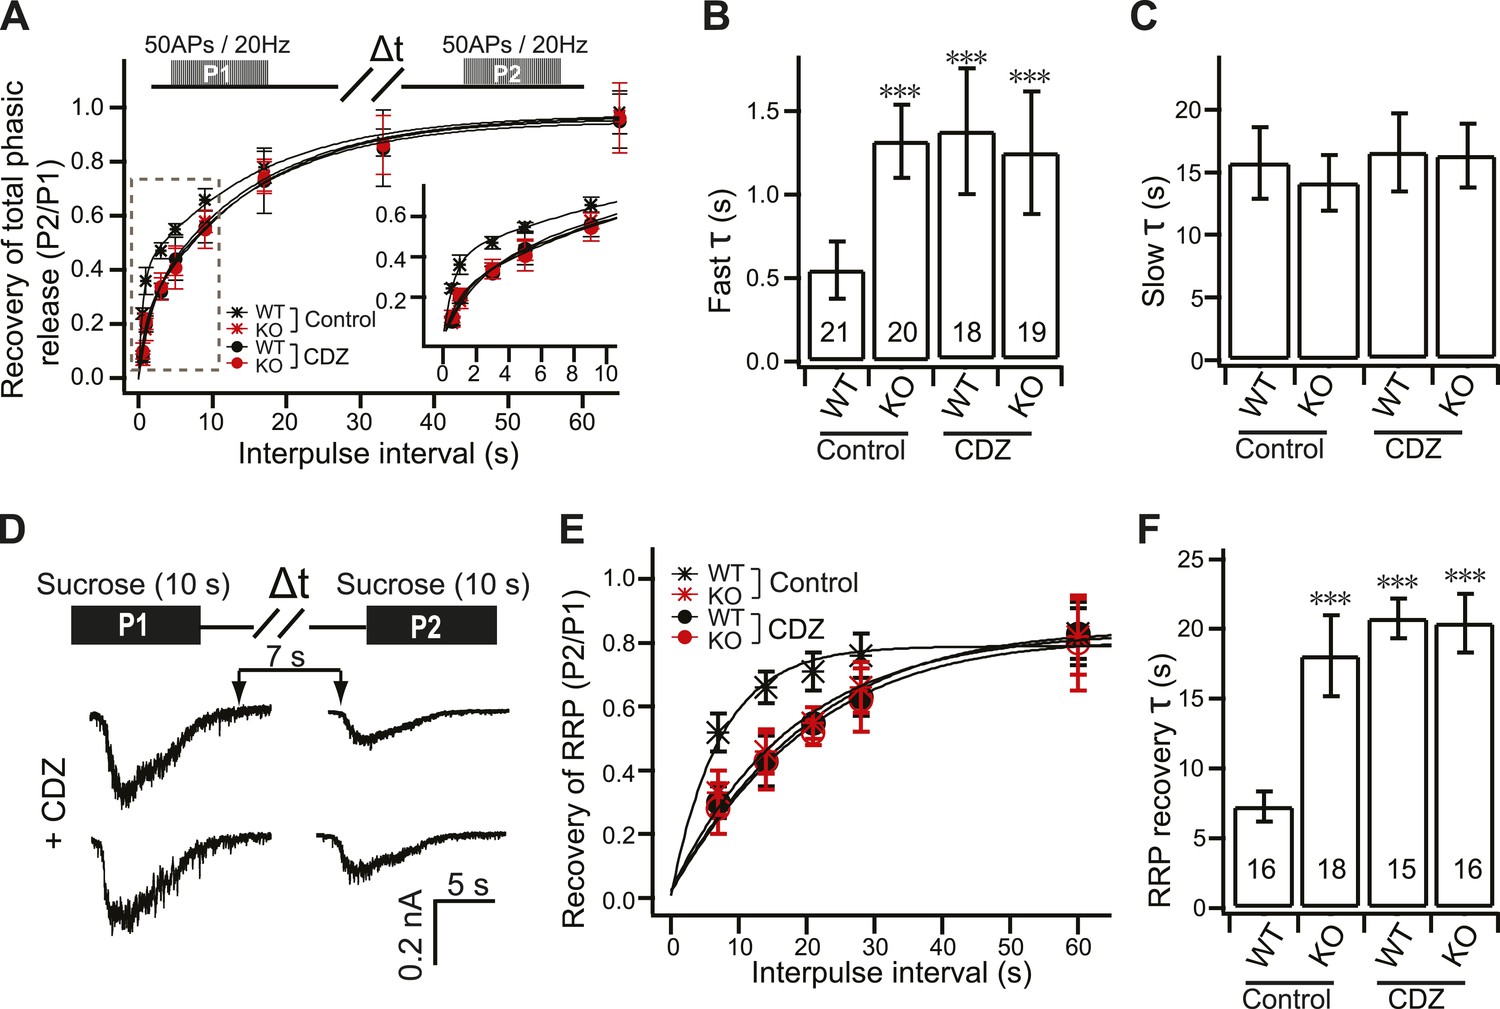
Impaired fast recovery of phasic transmission in KO neurons.
(A) Time course for the recovery of phasic release (Δt = 0.5, 1, 3, 5, 9, 17, 33 and 65 s). Data were fitted using a double exponential function, yielding fast (B) and slow (C) recovery. The upper diagram is the stimulation protocol. Inset: expansion of the early phase of the plot. (B) The fast recovery time constant was increased in KO (1.32 ± 0.22 s) as compared to WT neurons (0.55 ± 0.17 s). WT syt 7 (0.52 ± 0.12 s), but not the 4D/N mutant (1.28 ± 0.26 s), rescued the SV replenishment rate in KO neurons. (C) The slow recovery time constant was invariant among all groups. (WT: 15.72 ± 2.85 s; KO: 14.13 ± 2.24 s; KO + syt 7: 17.03 ± 3.24 s; and KO + syt 7 4D/N: 18.88 ± 4.45 s). The n values indicate the number of neurons, obtained from three independent litters of mice, used for these experiments. All data shown represent mean ± SEM. ***p<0.001, analyzed by one-way ANOVA, compared to WT.
Figure 4—figure supplement 1
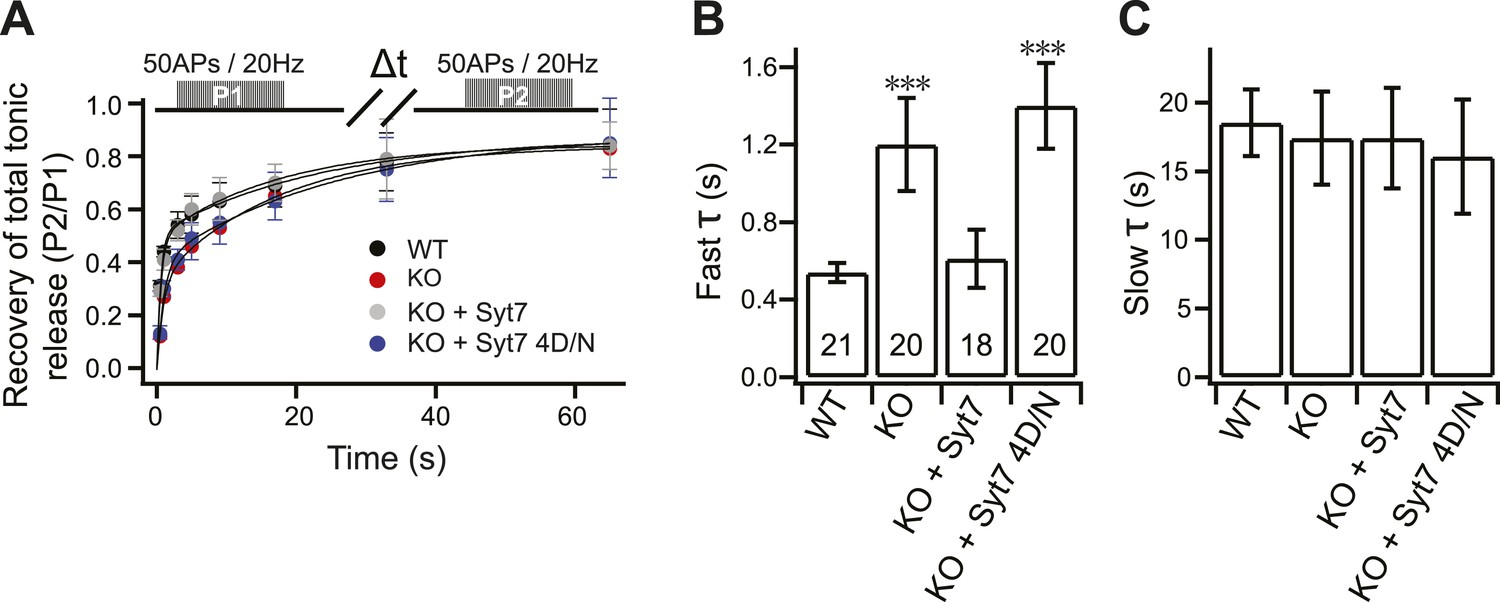
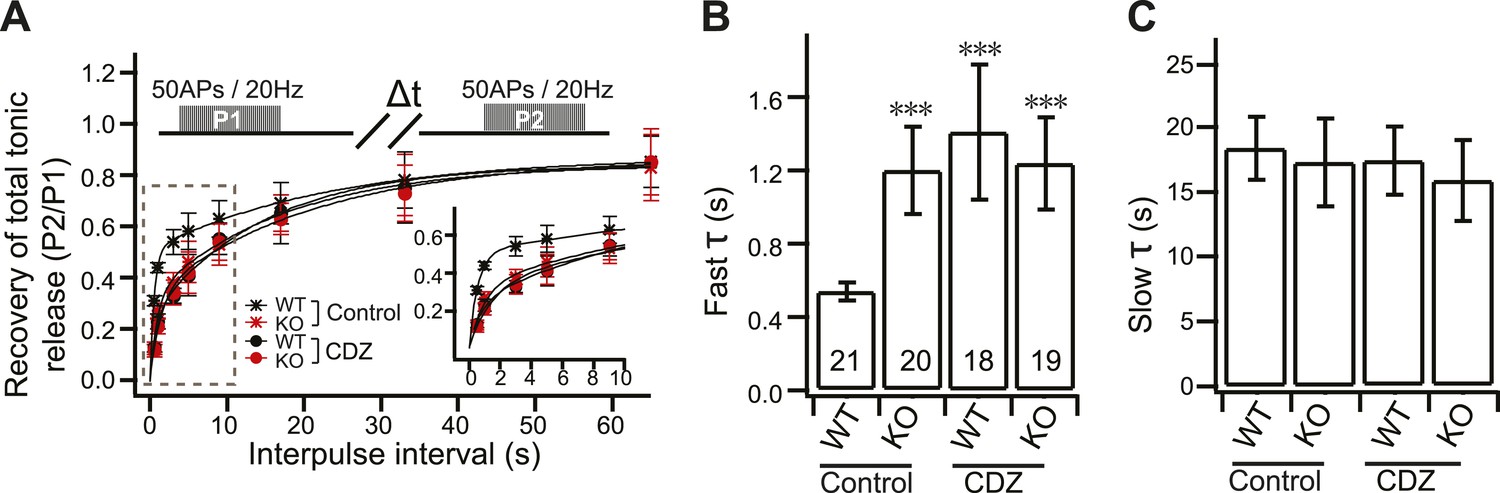
The fast recovery component of tonic transmission is impaired in KO neurons.
(A) Time course for the recovery of tonic release. Data were fitted and analyzed as described in Figure 4A. Upper panel depicts the HFS protocol (Δt = 0.5, 1, 3, 5, 9, 17, 33 and 65 s). (B) The fast recovery time constant for tonic release was increased in KO (1.20 ± 0.24 s) as compared to WT neurons (0.54 ± 0.05 s). WT (0.61 ± 0.15 s), but not the 4D/N mutant form (1.4 ± 0.22 s) of syt 7, rescued SV replenishment. (C) The slow recovery time constant for tonic release was the same among all groups. (WT: 18.52 ± 2.43 s; KO: 17.43 ± 3.39 s; KO + syt 7: 17.42 ± 3.65 s; and KO + syt 7 4D/N: 16.07 ± 4.15 s). The n values indicate the number of neurons, obtained from three independent litters of mice, used for these experiments. All data shown represent mean ± SEM. ***p<0.001, analyzed by one-way ANOVA, compared to WT.
Figure 5

The reduction in SV release in KO neurons during HFS is independent of vesicle recycling.
(A) Representative image showing the sypHy signal from the same synapse upon stimulation in the absence, and presence, of bafilomycin. (B) Averaged traces of sypHy in WT (black) and KO (red) neurons in response to stimulation in the presence of bafilomycin. KO neurons displayed a significant reduction in sustained SV release as compared to WT neurons. Data were collected for ∼300 boutons per condition as follows: ∼50 boutons per coverlip, from six coverslips (two each from three independent litters of mice). All data shown represent mean ±SEM. ***p<0.001 analyzed by two-way ANOVA. The initial response, indicated by the tan rectangle, is expanded in panel C. (C) KO neurons display reduced sypHy responses early in the train. *p<0.05, analyzed using the Student’s t test. (D–G) ESPC recordings, in response to HFS, in the presence of bafilomycin. (D) The peak amplitude of each EPSC was normalized to the peak of the first response and plotted vs time. (E) Plot of cumulative total phasic charge transfer vs time. Data were fitted and analyzed as described in Figure 3C. (F) The size of the RRP is the same in WT and KO neurons (WT: 35.42 ± 5.07 pC; KO: 32.07 ± 4.54 pC). (G) Reduction in the SV replenishment rate in KO neurons in the presence of bafilomycin (WT: 0.49 ± 0.06 s−1; KO: 0.23 ± 0.03 s−1). The n values indicate the number of neurons, obtained from three independent litters of mice, used for these experiments. All data shown represent mean ± SEM. ***p<0.001, analyzed using the Student’s t test.
Figure 6
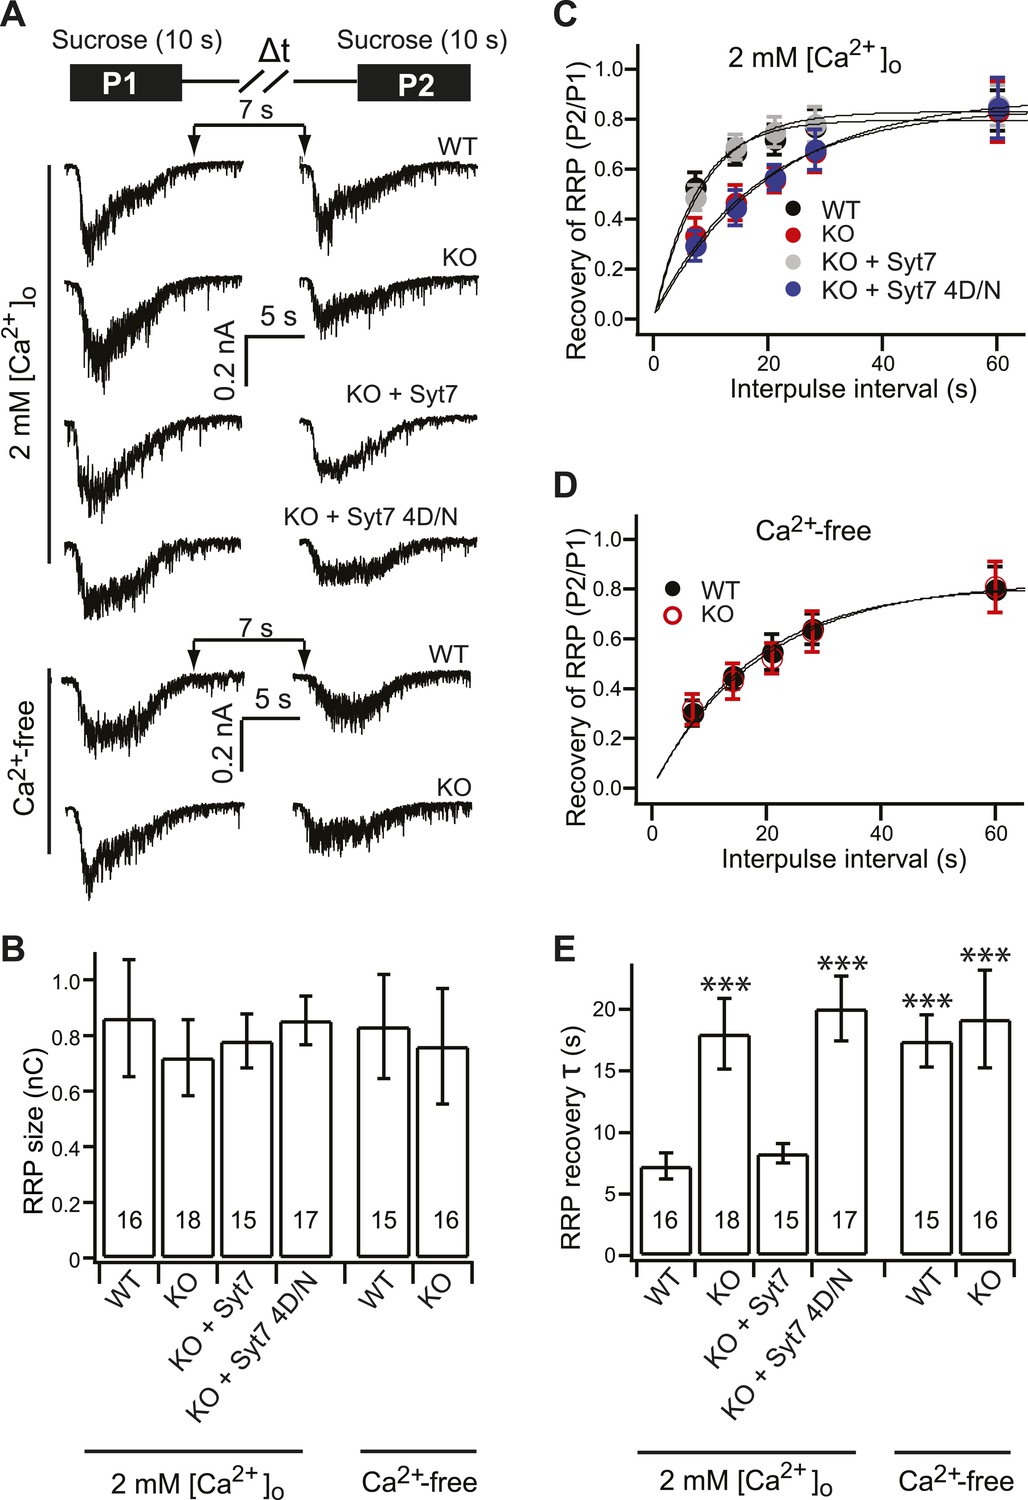
Syt 7 functions as a Ca2+-sensor for Ca2+-dependent SV replenishment.
(A) Upper panel illustrates the sucrose application protocol (Δt = 7, 14, 21, 28 and 60 s). Lower panel shows typical responses to sequential application of sucrose (7 s interval) from different groups in 2 mM [Ca2+]o or Ca2+-free conditions. (B) The RRP size, calculated from the first sucrose response, was same among the all groups (in 2 mM [Ca2+]o, WT: 0.86 ± 0.21 nC; KO: 0.72 ± 0.14 nC; KO + syt 7: 0.78 ± 0.09 nC; and KO + syt 7 4D/N: 0.85 ± 0.08 nC; in Ca2+-free conditions, WT: 0.83 ± 0.18 nC; KO: 0.76 ± 0.2 nC). (C) The time course of RRP recovery in 2 mM [Ca2+]o conditions between applications of hypertonic sucrose. Data were fitted with a single exponential function to calculate the recovery time constant in panel E. (D) The recovery of the RRP in Ca2+-free conditions. Data were fitted with a single exponential function to calculate the recovery time constant in panel E. (E) In 2 mM [Ca2+]o, recovery of the RRP was significantly slowed in KO (18.03 ± 2.87 s) neurons as compared to WT (7.29 ± 1.05 s) neurons, and was rescued by WT syt 7 (8.30 ± 0.79 s), but not the 4D/N mutant (20.07 ± 2.63 s). In Ca2+-free conditions, RRP recovery in WT neurons (17.42 ± 2.11 s) was slowed to the same level as in KO neurons (19.2 ± 3.95 s). The n values indicate the number of neurons, obtained from three independent litters of mice, used for these experiments. All data shown represent mean ± SEM. ***p<0.001, analyzed using one-way ANOVA, compared to WT.
Figure 7 with 1 supplement
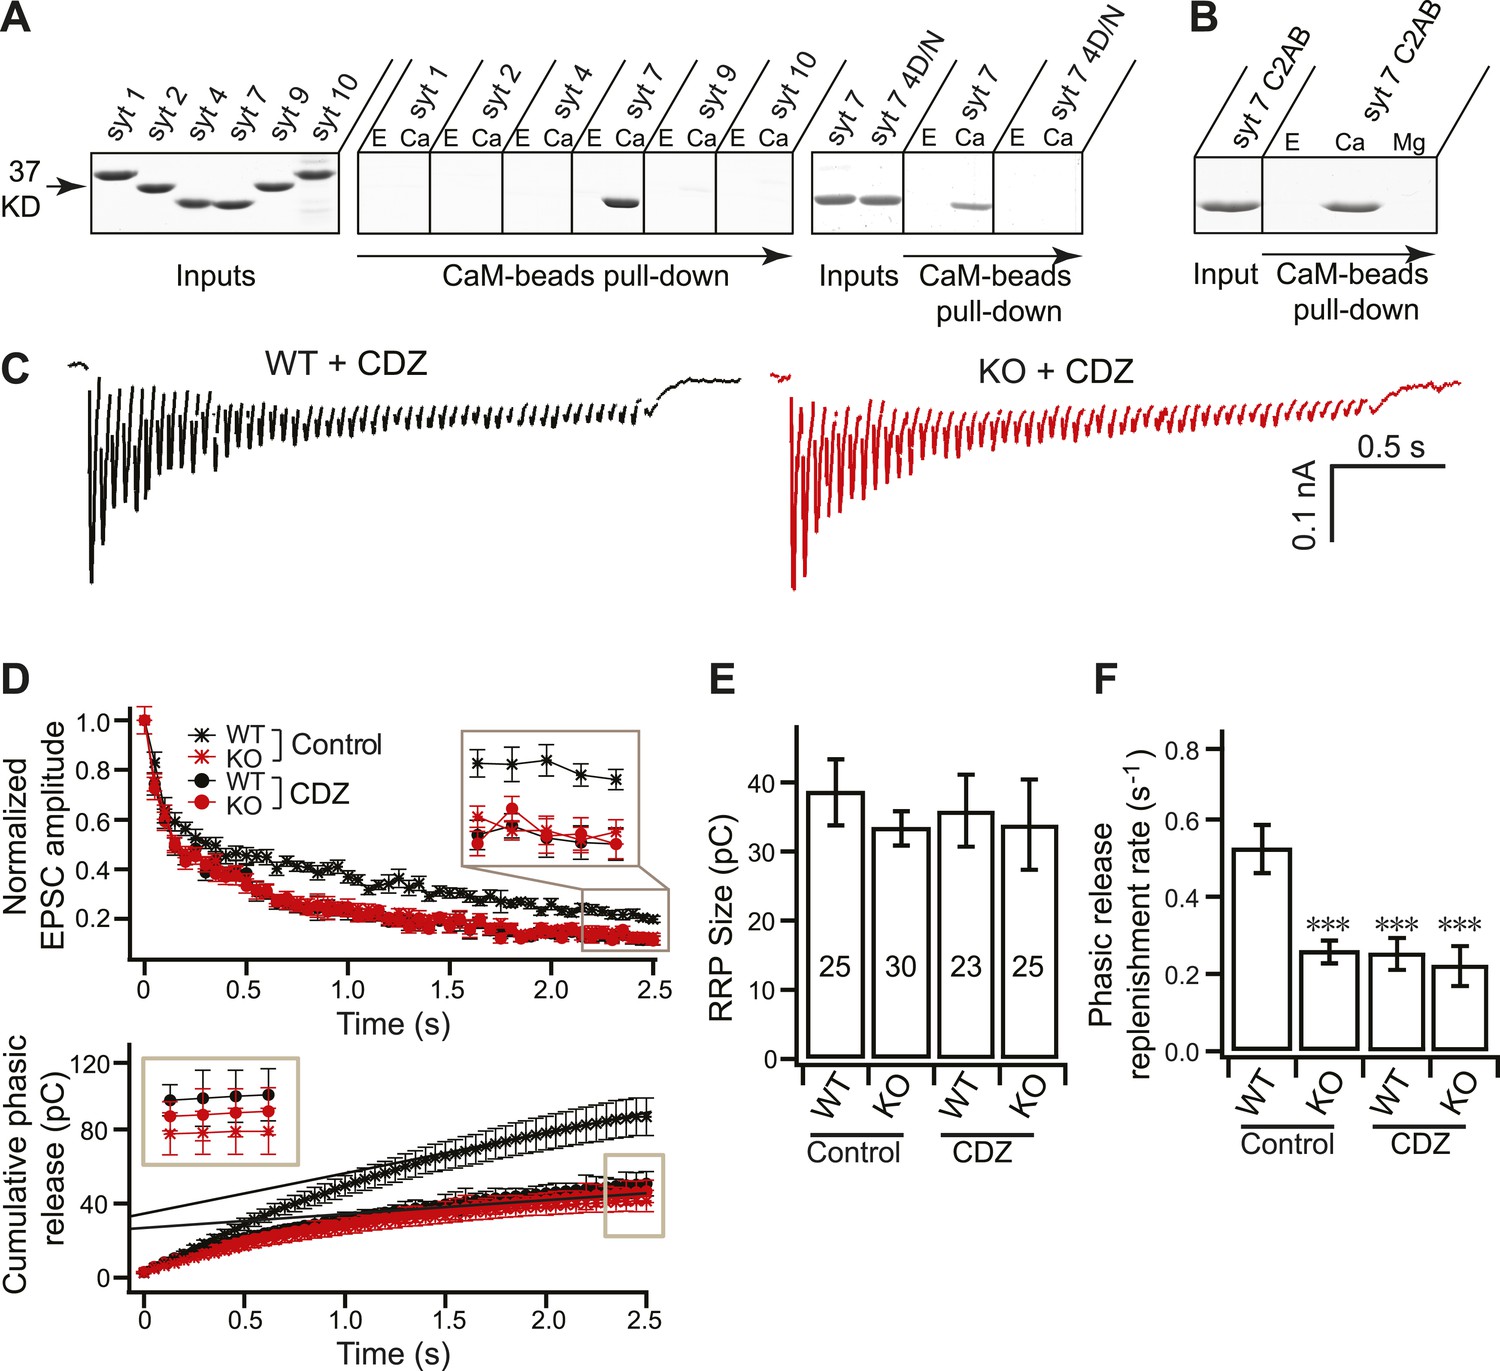
Syt 7 cooperates with CaM to regulate Ca2+-dependent SV replenishment.
(A) Immobilized CaM efficiently pulled-down the C2AB domain of syt 7, but not syt 1, 2, 4, 9 or 10, in the presence, but not the absence, of Ca2+; the syt 7 4D/N mutant failed to bind. E, 2 mM EGTA; Ca, 1 mM free Ca2+. Spaces between gels indicate samples that were run separately. Input corresponds to 25% of the starting material; 50% of the bound material was loaded per lane; no binding was observed when CaM was omitted from the beads (data not shown). (B) Mg2+ fails to promote binding of syt 7 C2AB to CaM. E, 2 mM EGTA; Ca, 1 mM free Ca2+; Mg, 1 mM free Mg2+. Gels were loaded as in panel A. (C) Representative EPSCs traces (20 Hz/2.5 s) recorded from WT (black) and KO (red) neurons in the presence of CDZ. (D) Plot of cumulative total phasic release charge vs time in the presence of CDZ. Data were analyzed as described in Figure 3C. (E) The size of the RRP was the same among all groups (in control: WT: 38.70 ± 4.78 pC; KO: 33.49 ± 2.48 pC; in CDZ treated neurons: WT: 36.85 ± 5.35 pC; KO: 34.77 ± 6.74 pC). (F) CDZ treatment reduced SV replenishment in WT neurons (0.24 ± 0.04 s−1 vs 0.52 ± 0.06 s−1 for controls), but had no effect on KO neurons (0.21 ± 0.05 s−1 vs 0.26 ± 0.03 s−1 for controls). The n values indicate the number of neurons, obtained from three independent litters of mice, used for these experiments. All data shown represent mean ± SEM. ***p<0.001, analyzed by one-way ANOVA, compared to WT.
Figure 7—figure supplement 1
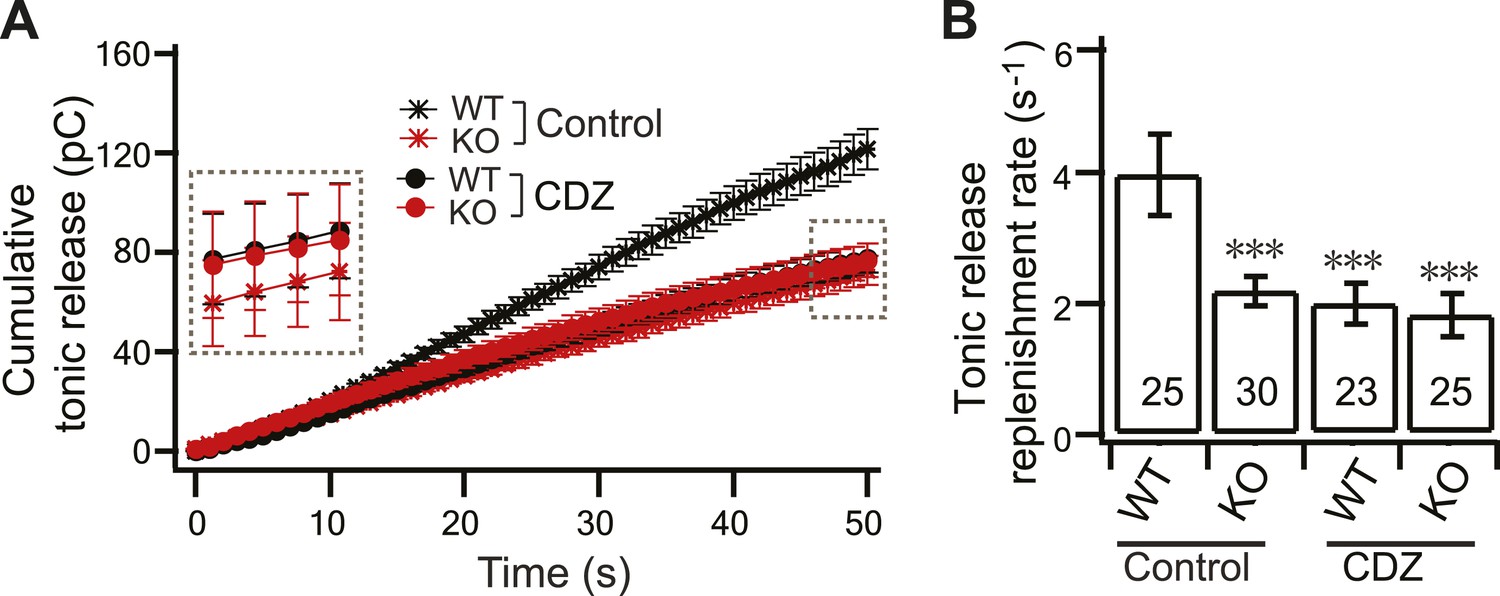
CDZ inhibits SV replenishment during tonic transmission in WT neurons.
(A) Plot of cumulative total tonic charge transfer vs time from WT and KO neurons, in the presence and absence of CDZ, during HFS. Data were fitted and analyzed as described in Figure 3C. (B) During tonic transmission, CDZ treatment reduced SV replenishment in WT neurons (1.88 ± 0.32 s−1 vs 3.95 ± 0.61 s−1 for controls), but had no effect on the already compromised replenishment rate in KO neurons (1.73 ± 0.34 s−1 vs 2.19 ± 0.22 s−1 for controls). The n values indicate the number of neurons, obtained from three independent litters of mice, used for these experiments. All data shown represent mean ± SEM. ***p<0.001, analyzed by one-way ANOVA, compared to WT.
Figure 8 with 2 supplements
CDZ inhibits RRP recovery in WT neurons, phenocopying the KO.
(A) Time course for the recovery of phasic release upon HFS; data were collected and analyzed as described in Figure 4A. The inset panel shows the expanded early phase of the plot. (B) CDZ slowed the time course of fast recovery of the RRP in WT neurons (1.35 ± 0.37 s vs 0.55 ± 0.17 s for control), phenocopying the KO neurons, which were not affected by CDZ (1.22 ± 0.36 s vs 1.32 ± 0.22 s for control). (C) The time course of slow recovery of the RRP was the same between WT and KO neurons with or without CDZ (WT: 16.02 ± 3.02 s vs 15.72 ± 2.85 s for controls; KO: 15.78 ± 2.5 s vs 14.13 ± 2.24 s for controls). (D) Typical responses to sequential (7 s) applications of sucrose to WT and KO neurons in 2 mM [Ca2+]o in the presence of CDZ. The upper diagram illustrates the protocol used (Δt = 7, 14, 21, 28 and 60 s). (E) Time course for the recovery of the RRP after depletion with hypertonic sucrose in 2 mM [Ca2+]o. Data were fitted with a single exponential function to calculate the recovery time constant (F). (F) CDZ increased the time constant for recovery of the RRP in WT neurons (20.69 ± 1.43 s vs 7.29 ± 1.05 s for controls), but had no effect on KO neurons (20.37 ± 2.1 s vs 18.03 ± 2.87 s for controls). The n values indicate the number of neurons, obtained from three independent litters of mice, used for these experiments. All data shown represent mean ±SEM. ***p<0.001, analyzed by one-way ANOVA, compared to WT.
Figure 8—figure supplement 1
CDZ impairs recovery of tonic transmission in WT neurons.
(A) Time course of recovery of tonic transmission. Data were fitted and analyzed as described in Figure 4A. Upper diagram describes the stimulation protocol (Δt = 0.5, 1, 3, 5, 9, 17, 33 and 65 s). Inset: expanded view of the initial section of the plot. (B) CDZ slowed the fast recovery component during tonic transmission in WT neurons (1.34 ± 0.35 s vs 0.54 ± 0.05 s for controls), but had no effect on KO neurons (1.18 ± 0.24 s vs 1.20 ± 0.24 s for controls). (C) The slow recovery time constant was the same between WT and KO neurons, with or without CDZ (WT: 17.32 ± 2.64 s vs 18.52 ± 2.43 s for controls; KO: 15.83 ± 3.13 s vs 17.43 ± 3.39 s for controls). The n values indicate the number of neurons, obtained from three independent litters of mice, used for these experiments. All data shown represent mean ± SEM. ***p<0.001, analyzed by one-way ANOVA, compared to WT.
Figure 8—figure supplement 2
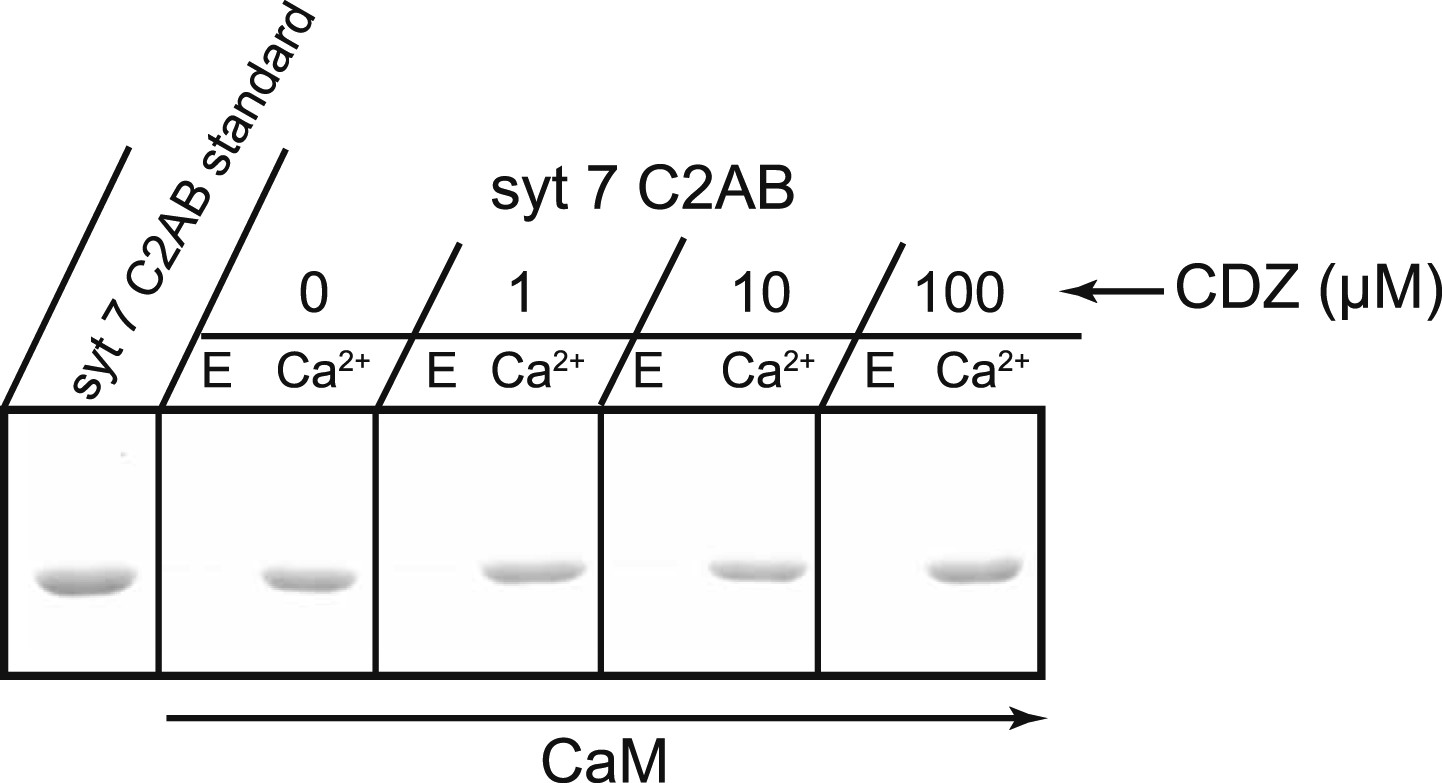
CDZ does not compete with syt 7 for binding to CaM.
The cytoplasmic domains of syt 7 (syt 7 C2AB) and different concentrations of CDZ were simultaneously incubated with immobilized CaM for 2 hr at 37°C in the presence and absence of Ca2+. CDZ had no effect on Ca2+-dependent binding of syt 7 to CaM. E, 2 mM EGTA; Ca, 1 mM free Ca2+.
Download links
A two-part list of links to download the article, or parts of the article, in various formats.
Downloads (link to download the article as PDF)
Open citations (links to open the citations from this article in various online reference manager services)
Cite this article (links to download the citations from this article in formats compatible with various reference manager tools)
Synaptotagmin 7 functions as a Ca2+-sensor for synaptic vesicle replenishment
eLife 3:e01524.
https://doi.org/10.7554/eLife.01524


