miR-142 orchestrates a network of actin cytoskeleton regulators during megakaryopoiesis
- Weizmann Institute of Science, Israel
- Cancer Research Center, Sheba Medical Center, Israel
- Hadassah Medical Center, Israel
- Institute of Nanotechnology and Advanced Materials, Bar-Ilan University, Israel
- Bar-Ilan University, Israel
- Tel Aviv University, Israel
Figures
Figure 1 with 1 supplement
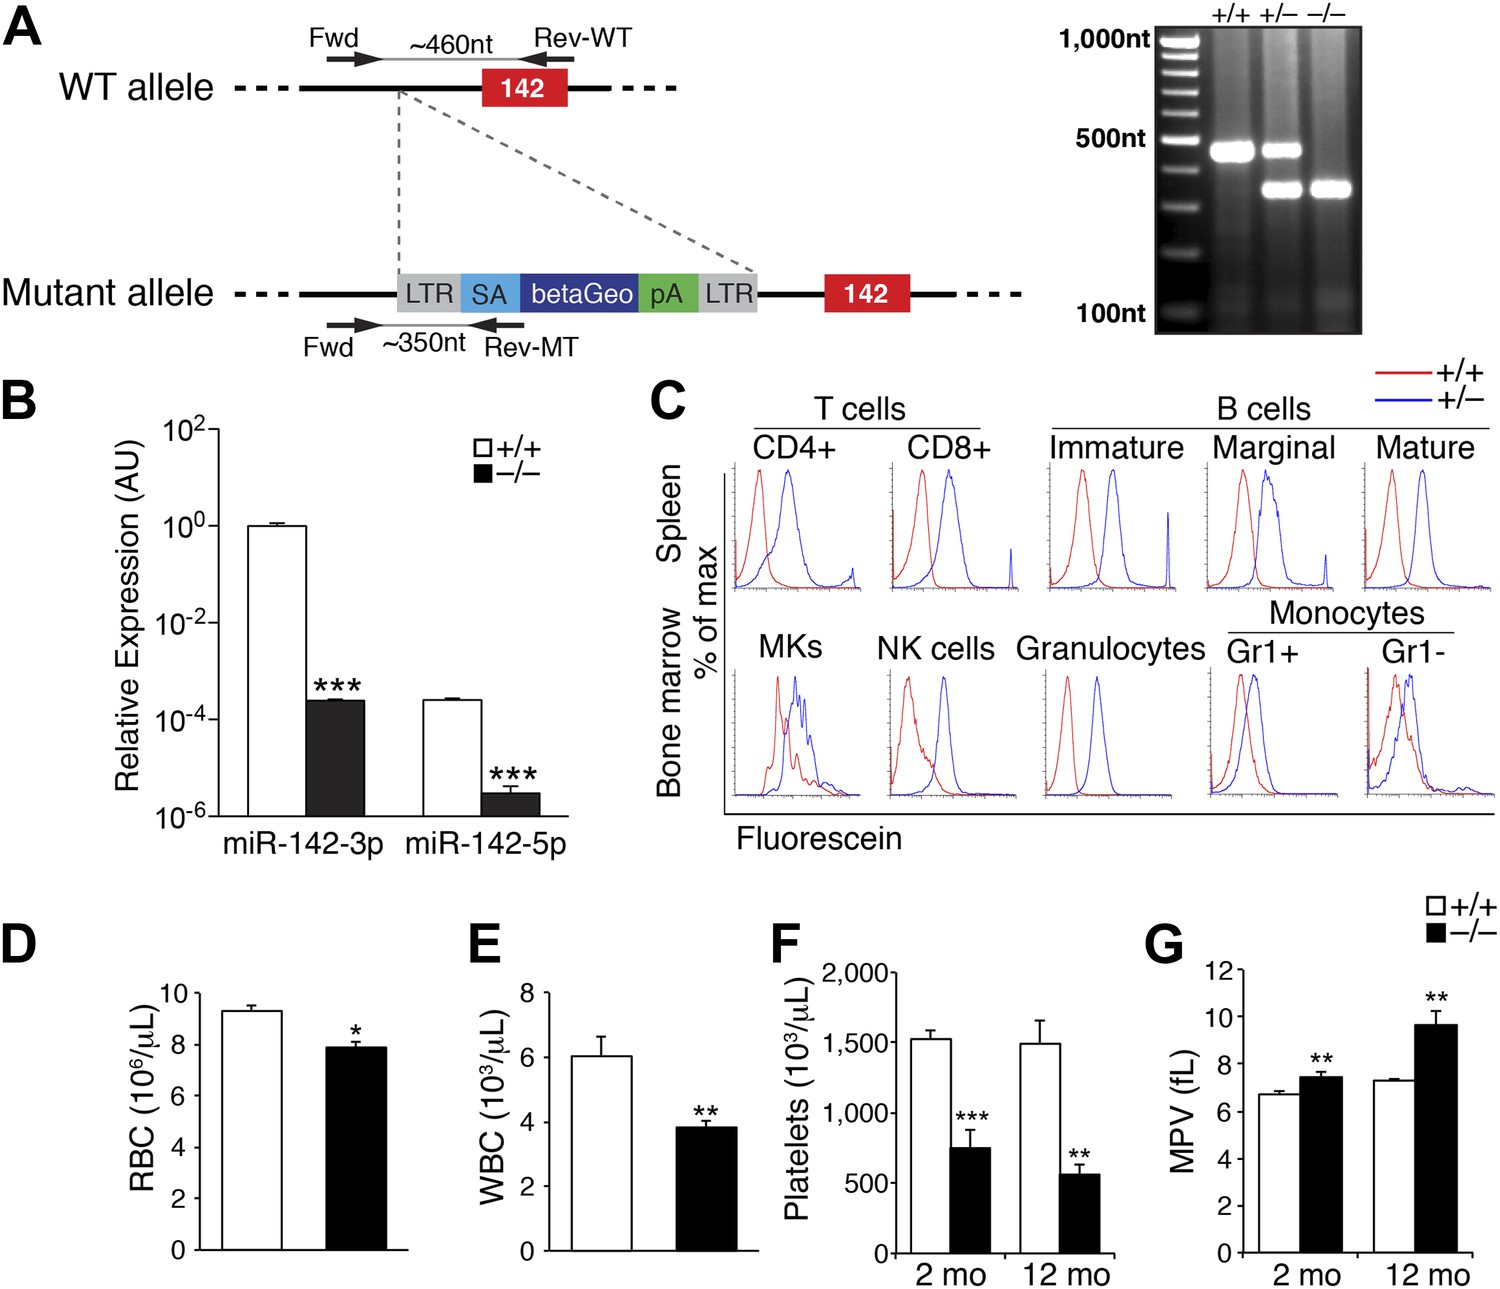
Pronounced thrombocytopenia in miR-142−/− mice.
(A) Left panel: schematic representation of the gene trap cassette targeting the murine miR-142 locus. The WT and mutant loci are shown with the gene trap-targeting vector. pre-miR-142 is shown as a red box. LTR, long terminal repeats; SA, splice acceptor; betaGeo, beta-galactosidase-Neomycin resistance fusion protein; pA, polyA signal. Right panel: Genomic PCR confirmation of miR-142 trap insertion. (B) Quantitative real-time (q) PCR performed on cDNA derived from peripheral blood mononuclear cells reveals nullification of miR-142-3p and miR-142-5p expression in miR-142−/− animals. Representative results from one of two independent experiments are shown (mean + SEM) with three animals in each group. ***p<0.0005. (C) Beta-galactosidase activity in ex vivo hematopoietic cell populations isolated from miR-142+/+ (red), and miR-142+/− (blue) mice as determined by fluorescence-activated cell sorting (FACS) of Fluorescein Di-beta-D-Galactopyranoside-treated cells. Assayed cell types include T-cells (CD4+ and CD8+) and B-cells (immature, marginal and mature) derived from the spleen, granulocytes, monocytes (Gr1+ and Gr1−), natural killer (NK) cells, and megakaryocytes (MKs) derived from the BM. (D and E) Significant decrease in circulating red blood cells (RBC, panel D) and white blood cells (WBC, panel E) in 2-month-old miR-142−/− mice. Representative results from one of two independent experiments are shown (mean + SEM) with at least five animals in each group. *p<0.05; **p<0.005. (F) Significant decrease in circulating platelet numbers in 2- and 12-month-old miR-142−/− mice. Representative results from one of two independent experiments are shown (mean + SEM) with at least five animals in each group. **p<0.005; ***p<0.0005. (G) Enlarged mean platelet volume (MPV) in 2- and 12-month-old miR-142−/− mice. Representative results from one of two independent experiments are shown (mean + SEM) with at least five animals in each group. **p<0.005; ***p<0.0005.
-
Figure 1—source data 1
Mendelian distribution of miR-142 intercrosses.
Genotypes of E14.5 and P21 offspring from miR-142+/− intercrosses reveals partial perinatal or juvenile lethality in miR-142−/− mice. The actual and expected number of mice for each genotype at the indicated stages is shown.
- https://doi.org/10.7554/eLife.01964.004
Figure 1—figure supplement 1
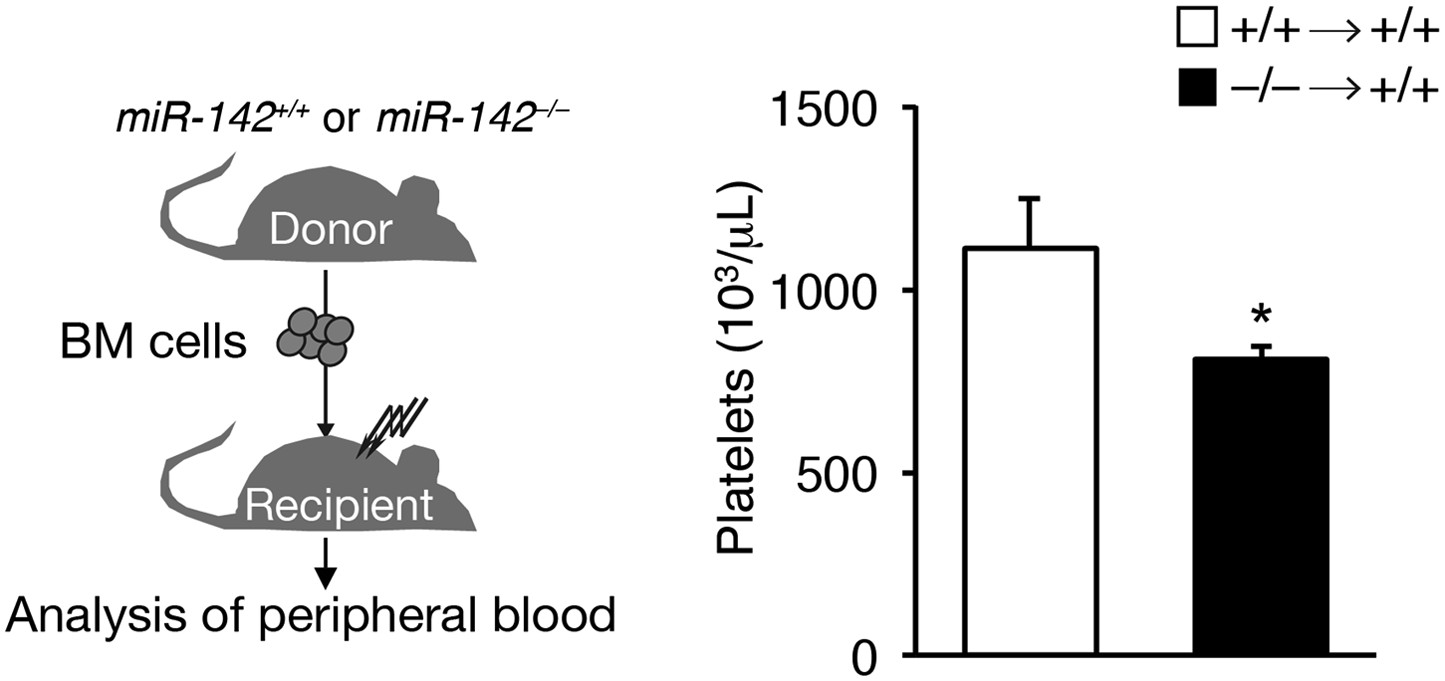
miR-142 hematopoietic-intrinsic expression is required for thrombopoiesis.
Schematic diagram of the experimental design for re-introduction of miR-142−/− BM into lethally irradiated WT mouse recipient (left panel), which results in reduced platelet counts relative to controls, 6 weeks after transfer (right panel). Data are gained from four animals per group (mean + SEM) *p<0.05.
Figure 2 with 2 supplements

Perturbed myeloerythroid development in the absence of miR-142.
(A) Diagram of gating strategy used to define the myeloerythroid progenitor populations (top panel), and representative FACS profiles of mutant miR-142−/− and WT BM cells (bottom panels). (B) Flow cytometric analysis of whole tibia BM-resident mega-erythroid progenitors (PreMegE; lin−c-kit+CD150+CD105−CD41−) and MK progenitors (MkP; lin−c-kit+CD41+), of 2-month-old animals. miR-142 deficiency results in increased MkP numbers and only modest, insignificant, changes in PreMegEs. Representative results from one of two independent experiments (mean + SEM) with at least three animals per group. *p<0. 05. (C and D) qPCR expression analysis of critical regulators of MK development: GATA binding protein 1 (Gata1), GATA binding protein 2 (Gata2), zinc finger protein, multitype 1 (Zfpm1), Kruppel-like factor 1 (Klf1), Friend leukemia integration 1 (Fli1), spleen focus forming virus proviral integration oncogene (Spi1), Runt-related transcription factor 1 (Runx1), and T cell acute lymphocytic leukemia 1 (Tal1) in miR-142−/− PreMegEs (C) and MkPs (D), relative to controls. Data normalized to Hprt expression and to the mRNA expression in WT controls and presented as mean + SEM. *p<0.05; **p<0.005. (E) Left panel, representative FACS profiles of mutant miR-142−/− and WT BM cells. Right panel, gating CD41+/CD42+ cells out of total BM, reveals increased mutant miR-142−/− MK numbers relative to WT controls. Representative results from one of two independent experiments (mean + SEM), at least three animals in each group. **p<0.005. (F) Increased numbers of von Willebrand factor (vWF)-positive MKs per high power field (hpf) in miR-142−/− BMs, relative to WT controls. Representative results from one of two independent experiments (mean + SEM), four cross-sections measured from each group. ***p<0.0005. (G) Left panel, CFU–MK assays demonstrate increased miR-142−/− MK numbers per colony. Scale bars, 50 μm. Right panel, increased numbers of MkPs in miR-142−/− BM, revealed by CFU–MK colony formation assay. Representative results from one of two independent experiments (mean + SEM), two biological samples in each group. *p<0. 05. (H) Schematic representation of the experimental design for competitive repopulation assay. (I) Representative FACS profiles for chimeric animals in competitive repopulation assay: [miR-142−/− (CD45.2)/WT (CD45.1) > WT (CD45.1)]. Flow cytometry performed 6 weeks after transplantation. (J) Quantification of CD45.2/CD45.1 ratios, calculated for each gate in three different animals. Dashed line indicates ratio of 1. Values >1 indicate that miR-142−/− (CD45.2) mutant cells out-compete WT (CD45.1) cells, whereas values <1 reveal the advantage of WT (CD45.1) cells. The CD45.2/CD45.1 ratio for B220-positive cells served as control. Representative results from one of two independent experiments (mean + SEM), three animals in each group. *p<0.05.
Figure 2—figure supplement 1

Gene expression in miR-142−/− MKs.
(A and B) qPCR expression analyses confirm nullification of miR-142-3p and miR-142-5p (A) and similar Bzrap1 expression (B) in miR-142−/− MKs, relative to WT controls. Representative results from one of two independent experiments (mean + SEM), three animals in each group. ***p<0.0005; (NS) not significant.
Figure 2—figure supplement 2
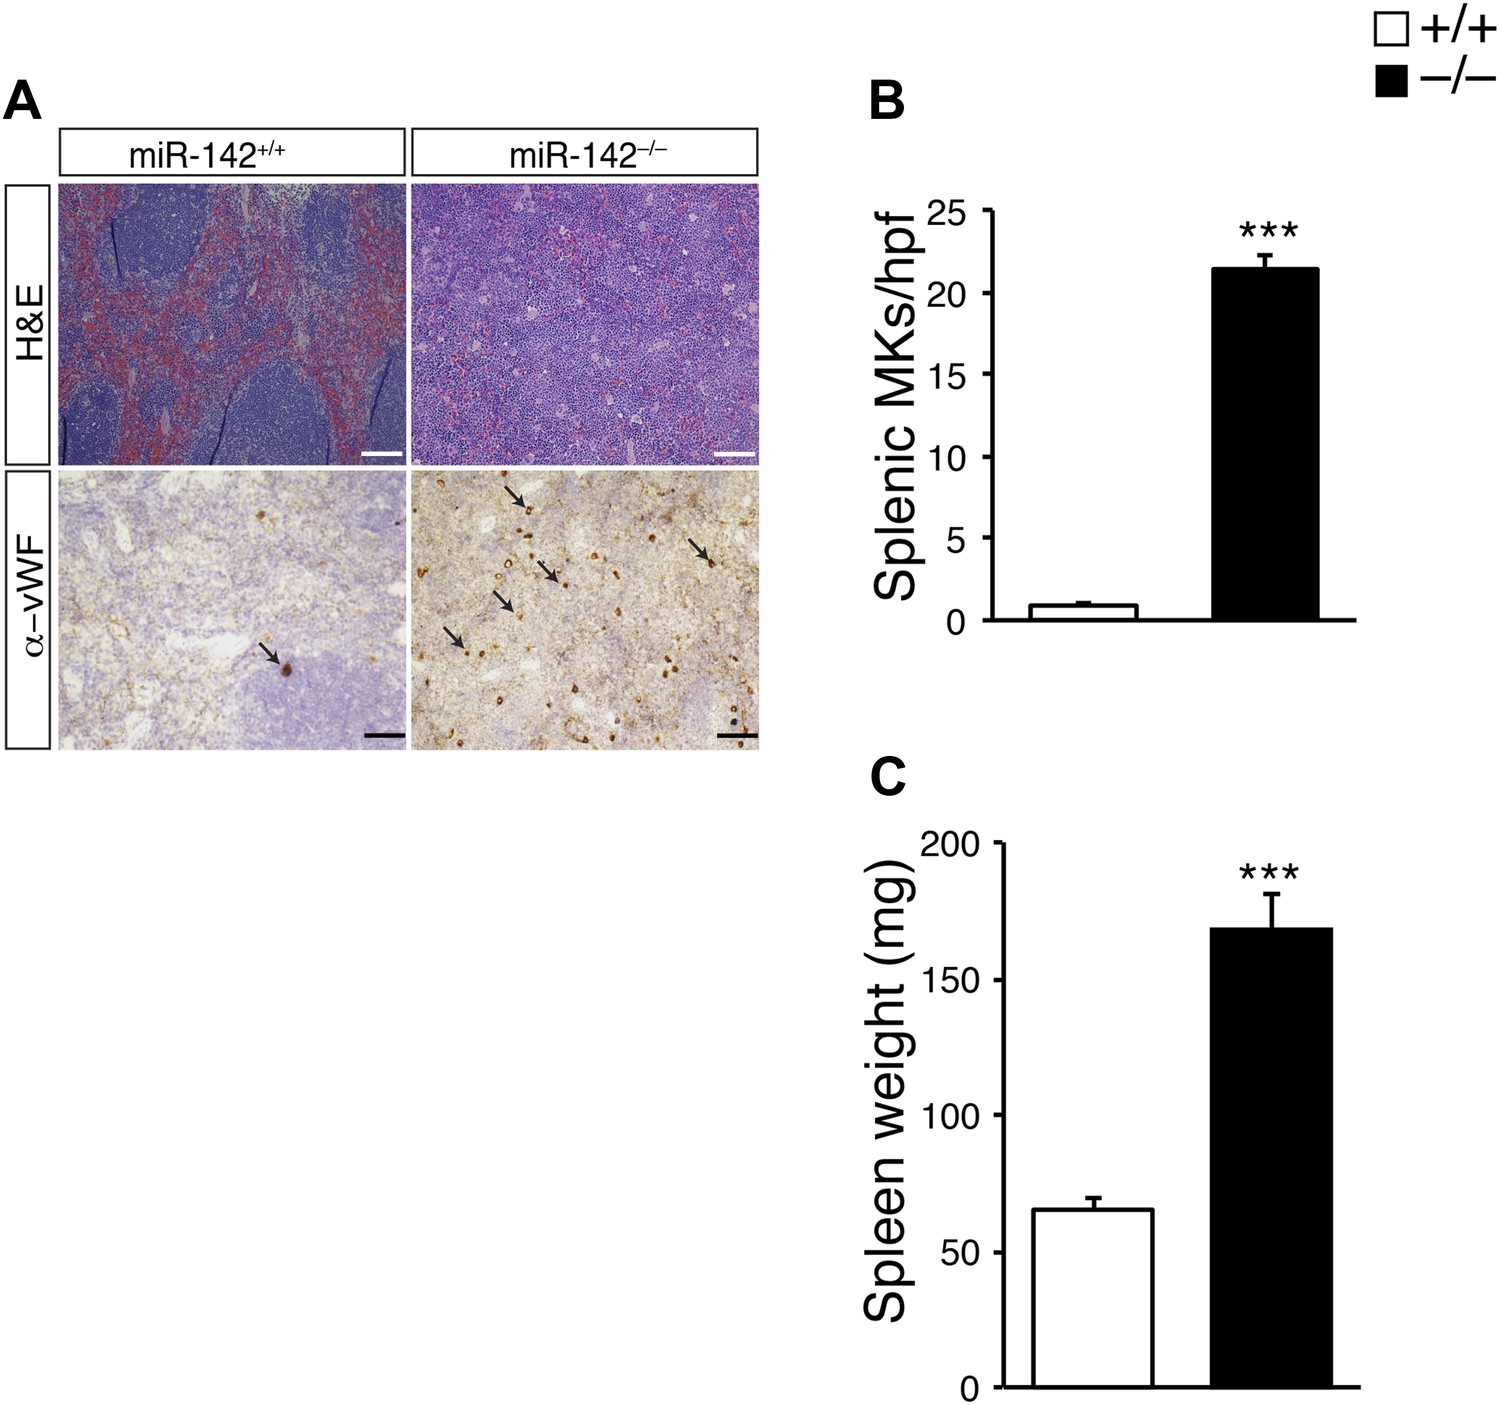
Splenomegaly and increased numbers of splenic MKs in miR-142−/− mice.
(A) Representative spleen sections were stained with hematoxylin and eosin (H&E, top panel) and anti-von Willebrand Factor (anti vWF; bottom panel). Arrows indicate MKs. Scale bars, 100 μm. (B) A significant increase in the number of splenic megakaryocytes per high power field (hpf) is observed in miR-142−/− mice. Data are obtained from four animals in each group (mean + SEM). ***p<0.0005. (C) Splenomegaly is detected in miR-142−/− mice. Data are obtained from four animals in each group (mean + SEM). ***p<0.0005.
Figure 3 with 1 supplement
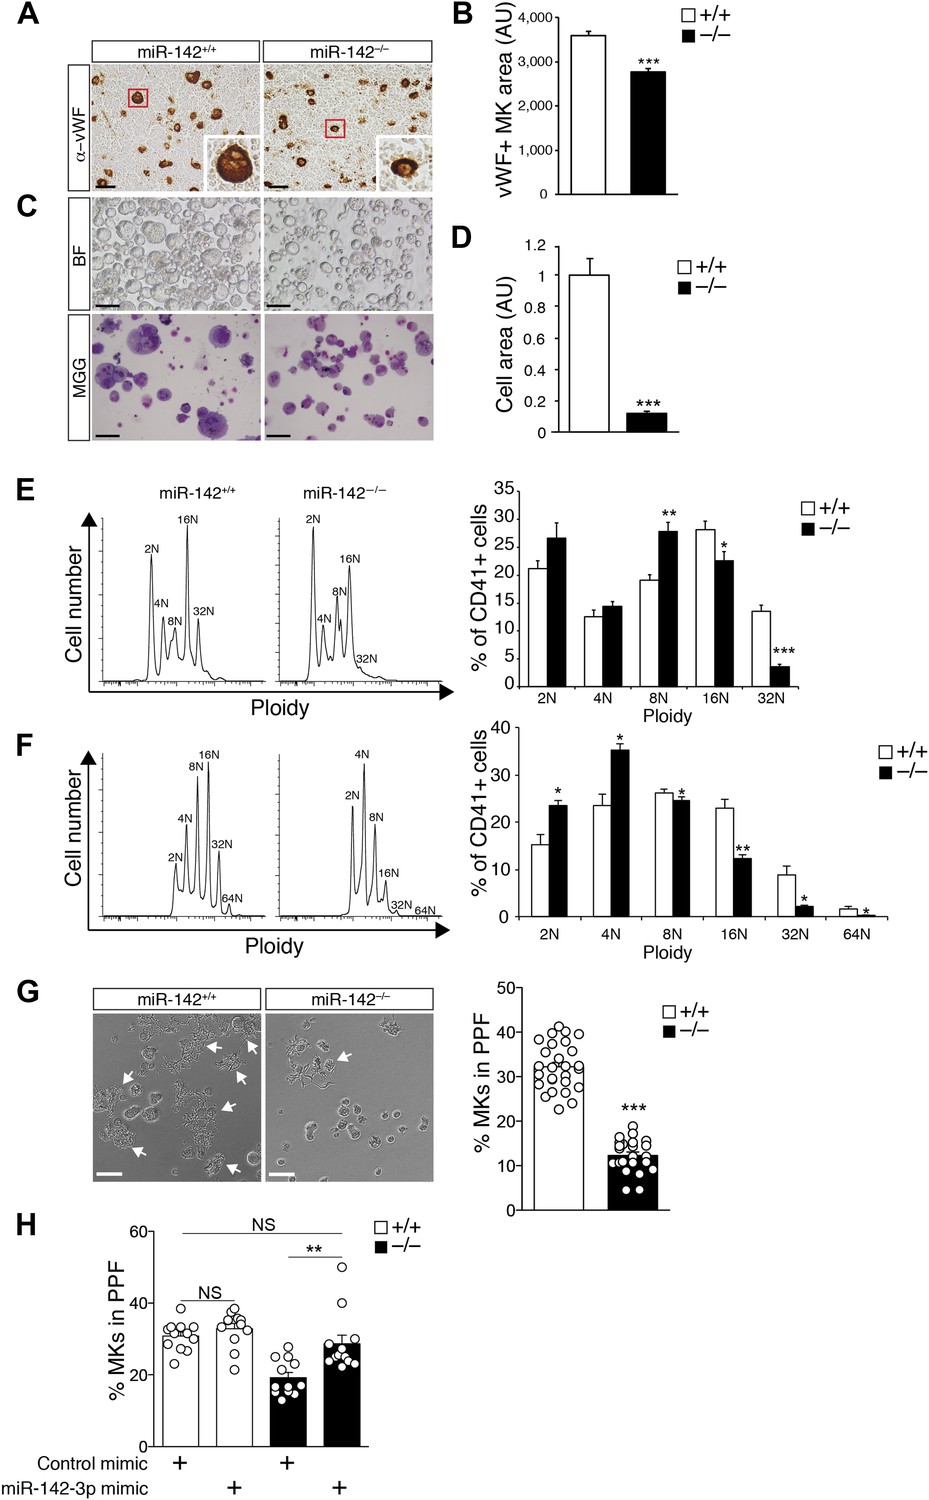
Impaired maturation of miR-142−/− MKs.
(A) Representative BM sections of miR-142−/− vs WT controls, stained with anti-von Willebrand Factor (anti vWF). In the bottom right corner of each section there is an enlarged image of a representative vWF-positive MK. Scale bars, 50 μm. (B) Reduced diameter of vWF-positive MKs in miR-142−/− BM relative to WT controls. Representative results from one of two independent experiments (mean + SEM). Data collected from four cross-sections measured and >100 cells per group. ***p<0.0005. (C) Representative brightfield (BF, top panel) and May–Grünwald Giemsa-stained (MGG, bottom panel) micrographs of FL-derived MK cultures, following enrichment by a BSA density gradient. Scale bars, 100 μm. (D) Size quantification of FL-derived MK, measured as pixel area and normalized to WT controls, reveals reduction of miR-142−/− MK cell area. Representative results from one of two independent experiments (mean + SEM), >20 cells measured per group. ***p<0.0005. (E) Representative FACS plot of DNA content analysis for FL-derived MKs stained for CD41 and DAPI (left) and quantification of ploidy in FL-derived MKs, presented as a percentage of cells out of total CD41+ cells (right). AU, arbitrary units. Representative results from one of two independent experiments (mean + SEM) ≥4 animals in each group. *p<0.05; **p<0.005; ***p<0.0005. (F) Representative FACS plot of DNA content analysis for BM-derived MKs stained for CD41 and DAPI (left) and quantification of ploidy in BM-derived MKs, presented as percentage of cells out of total CD41+ cells (right). AU, arbitrary units. Representative results from one of two independent experiments are shown (mean + SEM) ≥4 animals in each group. *p<0. 05; **p<0.005. (G) Left panel: representative micrographs of proplatelet formation (PPF) in FL-derived WT or miR-142−/− MKs (white arrows denote MKs extending proplatelets). Scale bars, 50 μm. Right panel: quantification revealed reduced PPF levels in miR-142−/− FL-derived MKs. Representative results from one of two independent experiments a (mean ± SEM), three animals in each group, each animal represented by 7–9 experimental repeats in distinct wells and each dot is a representation of a single well. ***p<0.0005. (H) Re-introduction of miR-142-3p using dsRNA mimetics was sufficient to restore WT PPF levels to miR-142-deficient differentiated MKs. Overexpression of miR-142-3p mimic did not result in significant increase in PPF levels in WT MKs. Each dot represents data from a single well. **p<0.005; (NS) not significant.
Figure 3—figure supplement 1
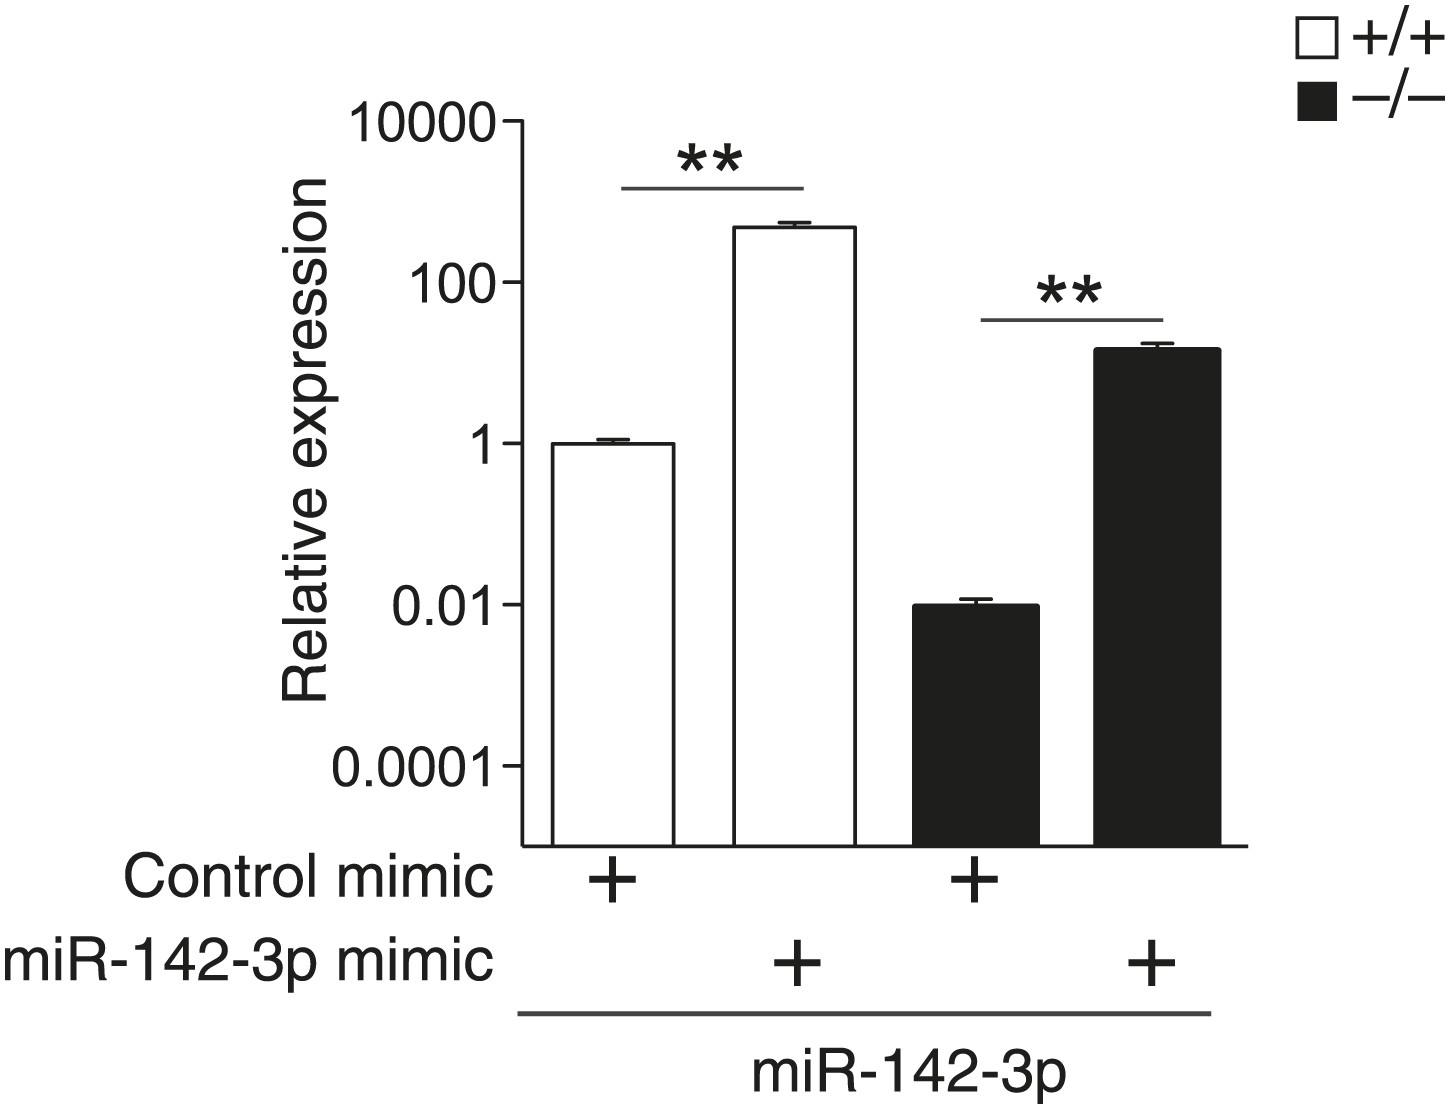
miR-142-3p expression in differentiated MKs following transfection of dsRNA mimetics. qPCR expression analyses confirm overexpression of miR-142-3p in WT and miR-142−/− FL-derived MKs transfected with miR-142-3p mimic, relative to MKs transfected with control mimics.
**p<0.005.
Figure 4

Disturbed actin cytoskeletal architecture and dynamics in the absence of miR-142.
(A) Representative micrographs of WT and miR-142−/− FL-derived MKs, cultured for 5 days with TPO and subsequently plated on fibronectin-coated cover-slips for 3 hr. F-actin (phalloidin, red), tubulin (green). The merged panels also depict DAPI in blue. Scale bars, 20 μm. (B) Circularity of FL-derived MKs (on an arbitrary scale of 0–1), measured using ImageJ software. miR-142−/− MKs were more circular than WT controls, reflecting immaturity and relative deficiency of proplatelet-like structures. Representative results from one of two independent experiments (mean + SEM), >100 cells measured per group ***p<0.0005. (C) Representative flow cytometry-based single-cell images of FL-derived MKs as obtained by ImagestreamX flow cytometer, stained with anti - CD61 antibody (yellow), FITC-Phalloidin (F-actin, green), Alexa594-DNaseI (G-actin, red) and DAPI (blue). Scale bar, 10 μm. (D–G) Reduced F-actin/G-actin ratio in FL-derived MKs (D), reduced cell area (E), increased circularity (F), and increased F-actin polarity (G), in miR-142−/− MKs relative to WT controls revealed by Imagestream analysis. Four animals per group (mean + SEM). *p<0.05; ***p<0.0005. (H) Representative micrographs of WT and miR-142−/− MKs stained with Phalloidin–Rhodamine for detection of actin stress fibers after cytochalasin D (CytoD) washout. Left panel depicts MKs stained following 30 min of CytoD treatment. Middle and right panels depict MKs stained 1 hr and 2 hr after CytoD washout, respectively. Scale bars, 50 μm. (I) The fraction of WT MKs exhibiting stress fibers at 1 hr and 2 hr after CytoD washout is larger relative to miR-142−/− MKs. Representative results from one of two independent experiments (mean + SEM), >50 cells counted in each group. ***p<0.0005.
Figure 5 with 4 supplements
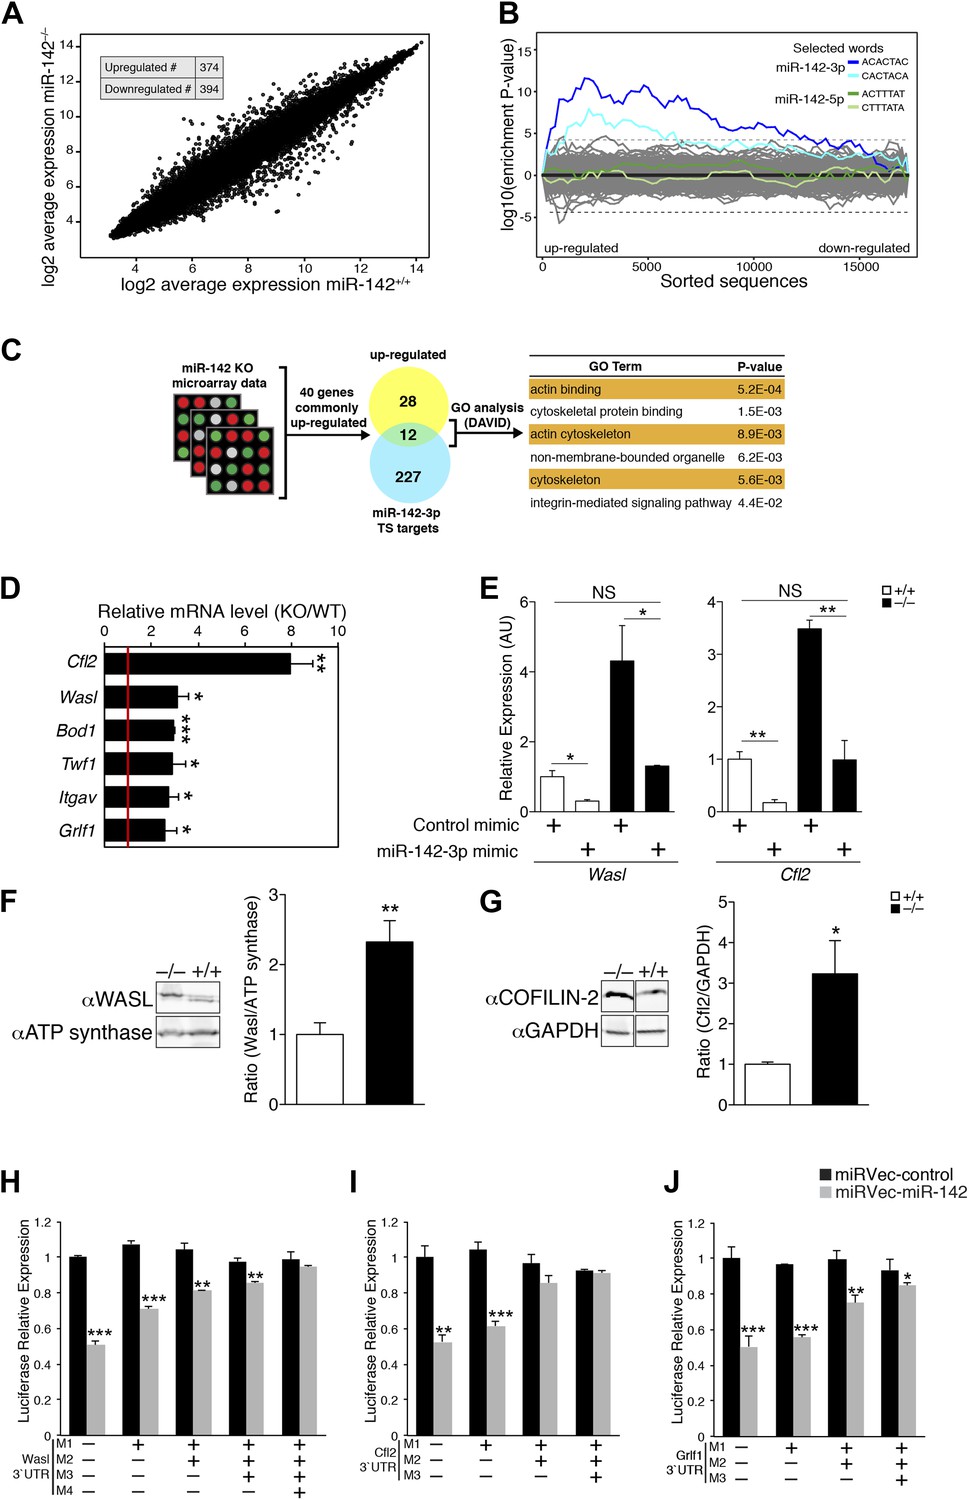
miR-142 Regulates a group of cytoskeletal regulatory genes during megakaryopoiesis.
(A) A log2-scale scatter plot, presenting the expression of mRNAs from FL-derived WT MKs (x axis), and miR-142−/− MKs (y axis). The inset table depicts the number of genes that are significantly up- or down-regulated (> 2 fold change, p<0.05). (B) Enrichment landscape plot for all 876 7mer motifs complementary to canonical mouse miRNA seed regions, gained by Sylamer analysis (van Dongen et al., 2008). Sorted 17,000 gene list ordered from mostly up-regulated to mostly down-regulated in the miR-142−/− MKs on the x axis reveal the enrichment of only two motifs, which are both corresponding to the expected impact of miR-142-3p ‘seed’ on MK transcriptome (blue, 7mer–m8; light blue, 7mer–A1). miR-142-5p seed motifs are not enriched (green, 7mer-m8; light green, 7mer-A1). Horizontal dotted lines represent a Bonferroni-corrected p value threshold of 0.05. (C) A schematic representation of bioinformatic pipeline. Genes that were commonly and significantly up-regulated in three expression arrays of miR-142−/− hematopoietic cells (CD24+ in vitro-derived dendritic cells [DCs], CD24− DCs and MKs), were superimposed with miR-142-3p TargetScan (TS)-predicted target genes. The resultant list was subjected to GO analysis using the DAVID bioinformatic tool. The majority of enriched GO categories were annotated to cytoskeletal and actin-binding genes. (D) qPCR expression analysis of a novel set of miR-142-3p target mRNAs: Cofilin-2 (Cfl2), Wiskott–Aldrich syndrome-like (Wasl), Biorientation of chromosomes in cell division 1 (Bod1), Twinfilin-1 (Twf1), Integrin alpha V (Itgav) and Glucocorticoid receptor DNA binding factor 1 (Grlf1) genes in miR-142−/− MKs, relative to controls, normalized to Hprt expression and to the mRNA expression in WT controls. Data are presented as mean + SEM. *p<0.05; **p<0.005; ***p<0.0005. (E) Reintroducing miR-142-3p using dsRNA mimetics was sufficient to restore Wasl (left panel) and Cfl2 (right panel) expression levels in miR-142-deficient differentiated MKs (black bars). In addition, overexpression of the miR-142-3p mimic resulted in significant reduction of Wasl (left panel) and Cfl2 (right panel) expression levels in WT MKs (white bars). *p<0.05; **p<0.005; (NS) not significant. (F and G) Western blot analysis of representative miR-142-3p target genes. Cell lysates from WT and miR-142−/− FL-derived MKs were subjected to SDS-polyacrylamide gel electrophoresis. WASL (F) and COFILIN-2 (G) were immunodetected and assessed by densitometry (right panel in F and G). ATP-synthase and GAPDH are indicators of protein loading levels, respectively (left panels in F and G). Representative results from one of two independent experiments (mean + SEM), four biological samples in each group. *p<0.05; **p<0.005. (H–J) Relative luciferase activity of reporters that harbor the 3′UTR of novel miRNA targets: Wasl (H), Cfl2 (I), and Grlf1 (J). Luciferase reporter activity is repressed by transfection of miR-142 expression vector (gray bars) in HEK-293T cells, whereas reporters that harbor a mutated version of the 3′UTR are insensitive to miR-142. Data normalized to the activity of firefly luciferase that is co-expressed from the dual reporter and to a negative control miRNA vector and presented as mean + SEM. *p<0.05; **p<0.005; ***p<0.0005.
-
Figure 5—source data 1
GO analysis for differentially regulated genes (>twofold) in miR-142−/− MKs.
- https://doi.org/10.7554/eLife.01964.013
-
Figure 5—source data 2
Genes commonly up-regulated (>1.5-fold) in miR-142−/− MKs and DCs (CD24+ and CD24−).
TargetScan predicted targets of miR-142-3p miR-142-5p are indicated.
- https://doi.org/10.7554/eLife.01964.014
Figure 5—figure supplement 1
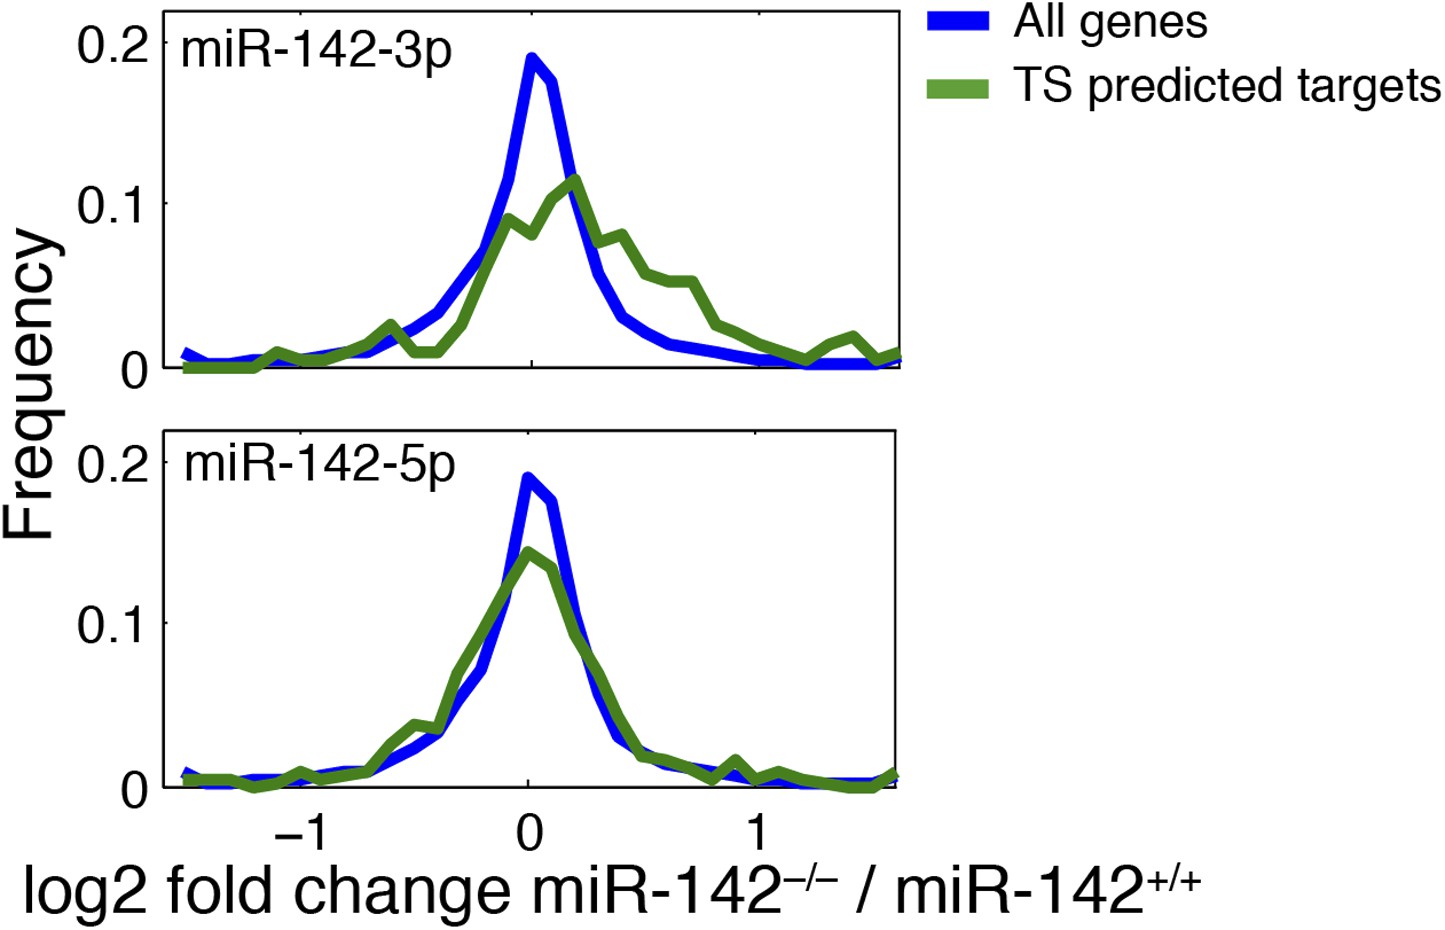
Expression distribution plot of miR-142 putative targets.
miR-142-3p TargetScan-predicted targets (blue right panel) are over-represented among genes upregulated in miR-142−/− FL-derived MKs (p<10E−16). miR-142-5p TargetScan-predicted targets (blue, left panel) show same distribution as the background.
Figure 5—figure supplement 2
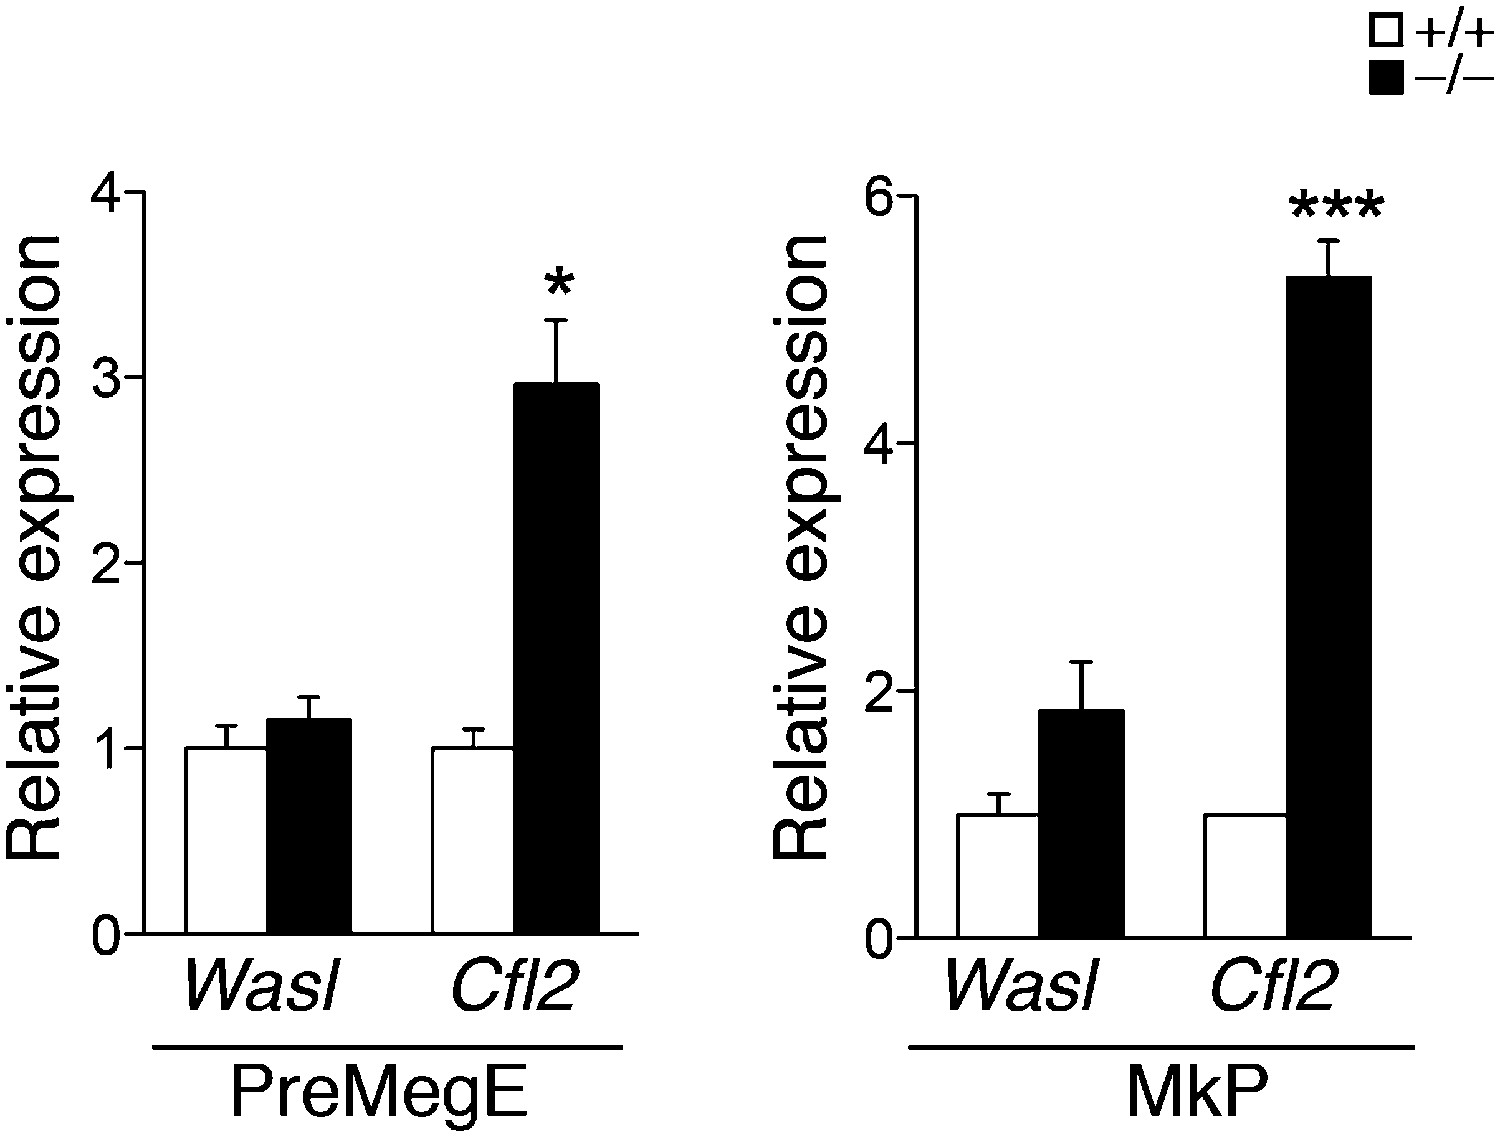
qPCR expression analysis of miR-142 putative targets in precursor cell populations.
qPCR expression analysis of Wasl and Cfl2 in PreMegE (left panel) and MkP (right panel) precursor cell populations sorted from miR-142−/− and WT BMs. *p<0.05; ***p<0.0005.
Figure 5—figure supplement 3
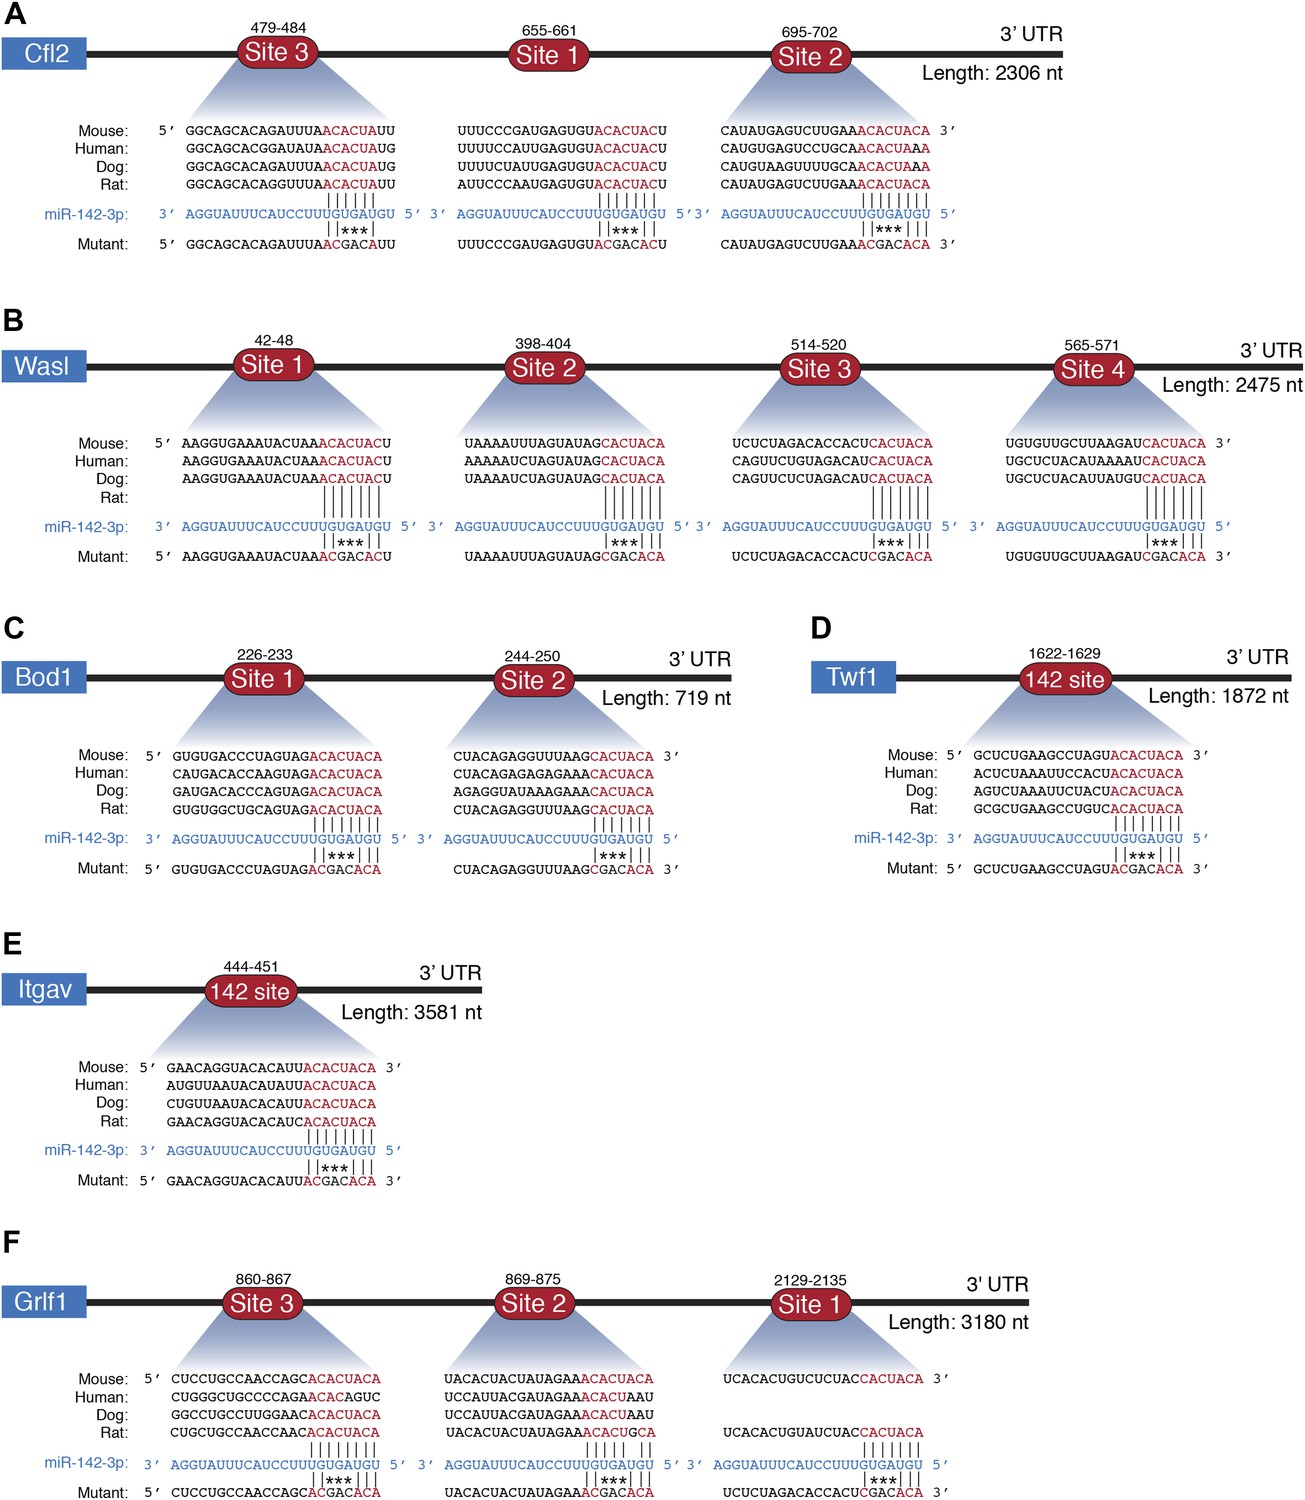
miR-142-3p directly regulates cytoskeletal genes.
Schematic representations of 3′UTRs of cytoskeletal genes (A) Cfl2, (B) Wasl, (C) Bod1, Twf1, (E) Itgav, (F) Grfl1 with miR-142-3p binding sites and the corresponding mutations made to test direct interactions with miR-142-3p. Conserved bases within the seed region are indicated in red. Not drawn to scale.
Figure 5—figure supplement 4
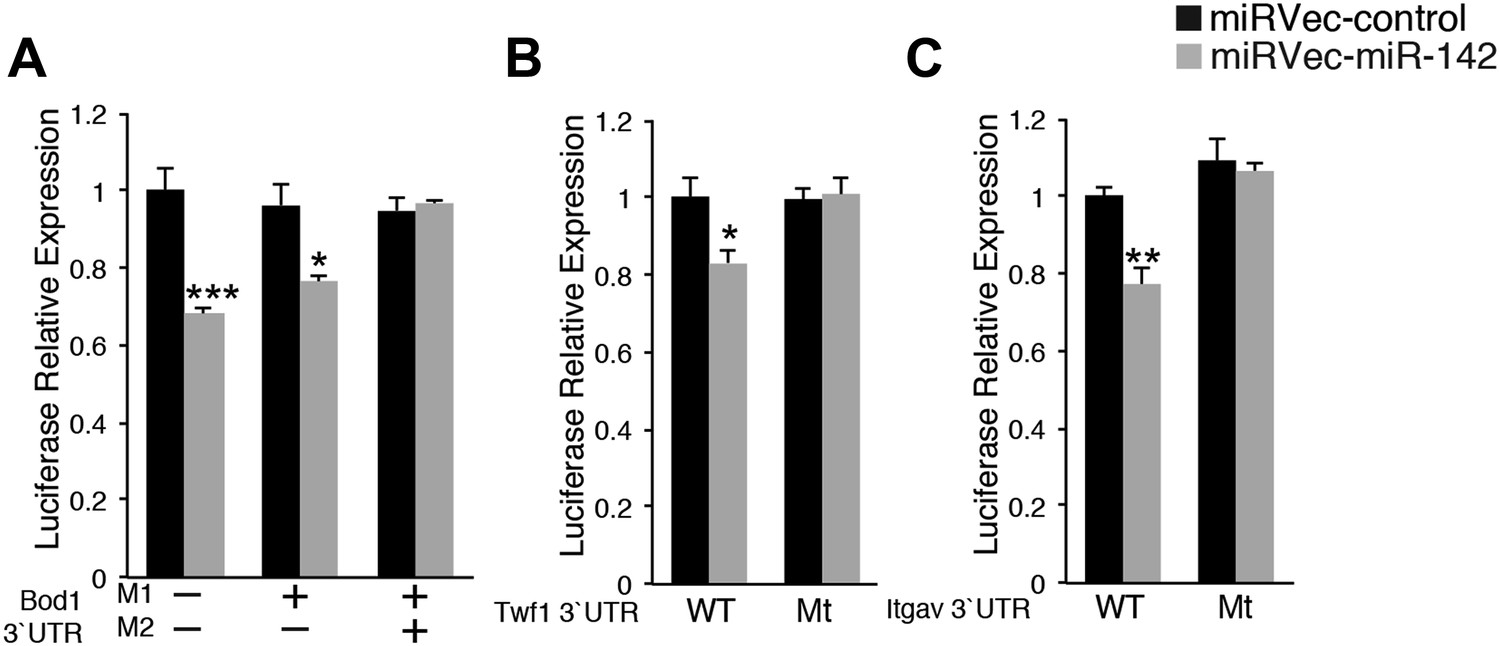
miR-142-3p directly regulates cytoskeletal genes.
Relative luciferase activity of reporters that harbor the 3′UTR of novel miR-142-3p targets: Bod1 (A), Twf1 (B), and Itgav (C). Luciferase reporter activity is repressed by introduction of miR-142 (grey bars) into HEK-293T cells, whereas mutated reporters become insensitive to miR-142. Data are normalized to the activity of firefly luciferase that is co-expressed from the dual reporter and to a negative control miRNA vector.
Figure 6 with 2 supplements
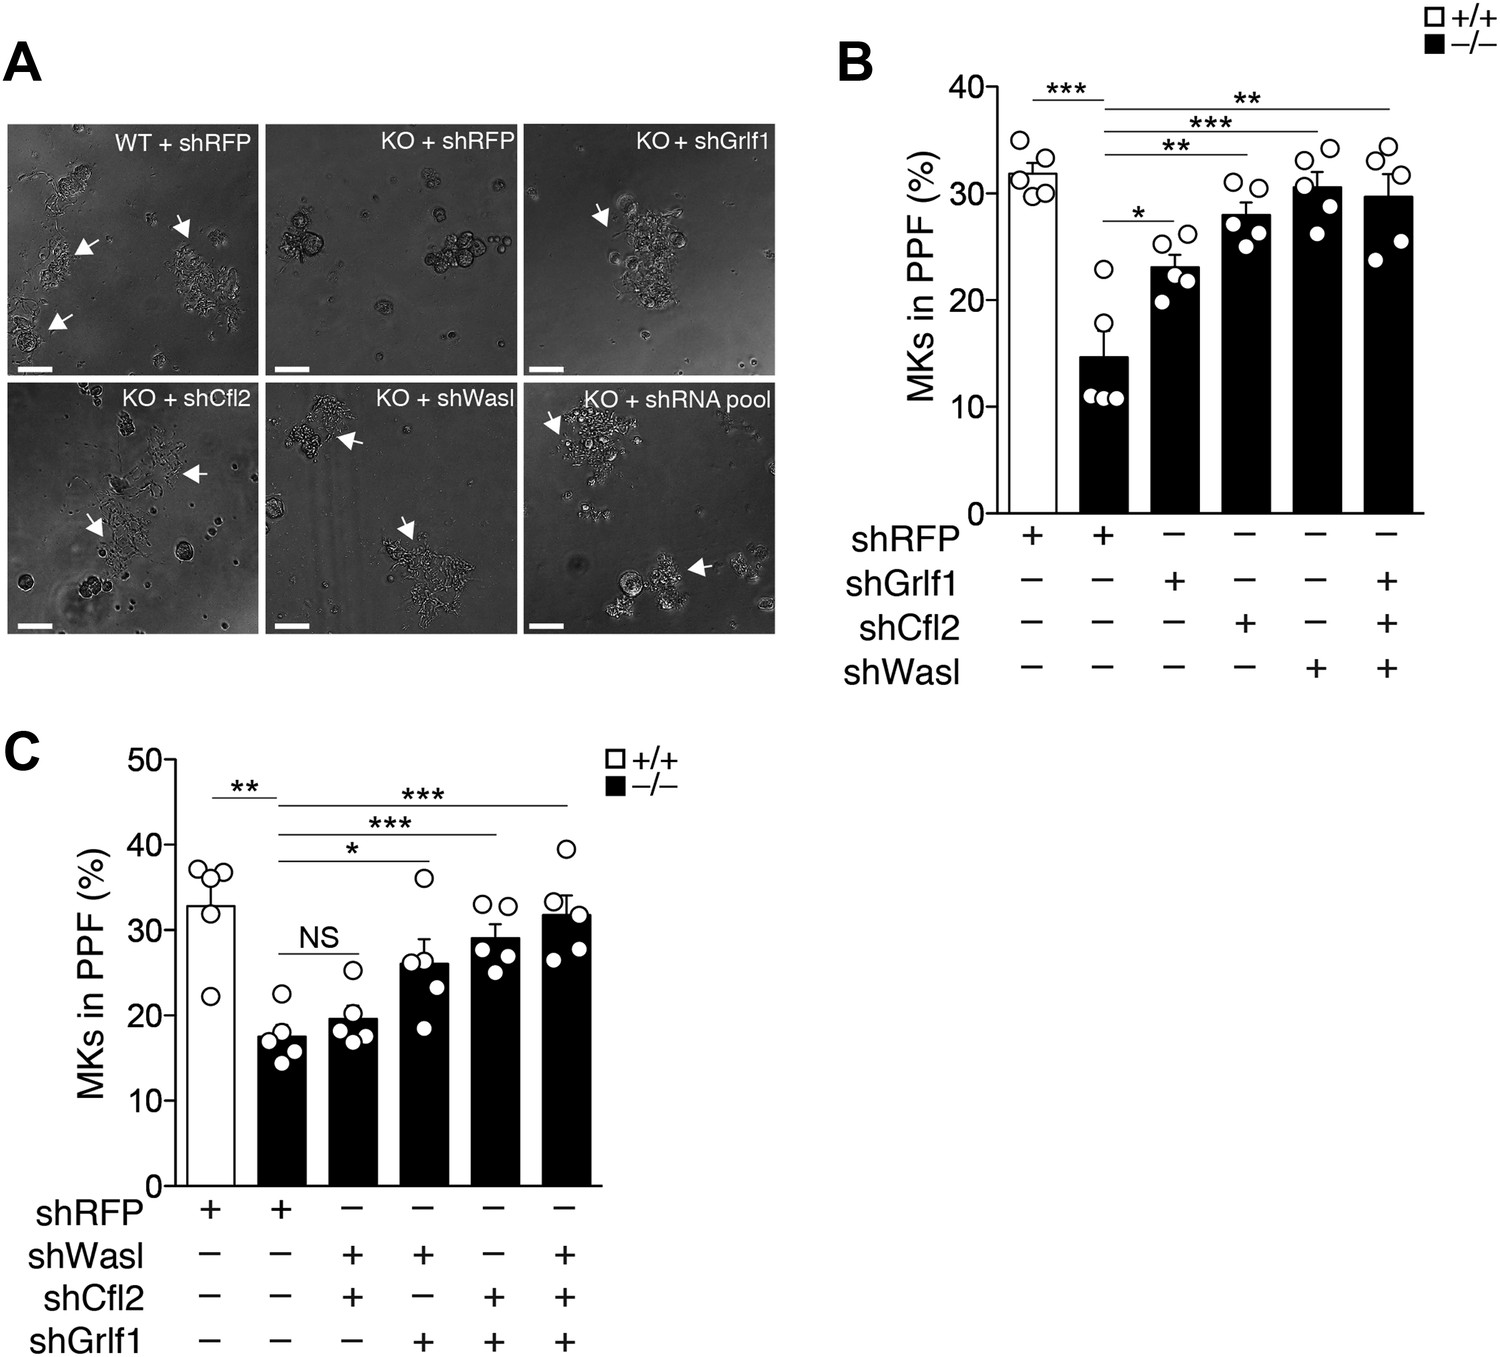
miR-142-3p targets a battery of actin cytoskeleton regulators to facilitate proplatelet formation.
(A) Representative micrographs of WT and miR-142−/− (KO) FL-derived MKs, transduced with the indicated shRNA vectors and cultured for 48 hr with TPO. White arrows denote MKs extending proplatelets. Scale bars, 50 μm. (B and C) miR-142−/− MKs transduced with shRNAs targeting individual (B), paired (C), or a combined set (B and C) of miR-142-3p targets restore PPF levels. WT MKs were transduced with a control shRNA-targeting RFP. Representative results from one of two independent experiments (mean + SEM), five experimental repeats in each group (white dots). *p<0.05; **p<0.005; ***p<0.0005; (NS) not significant.
Figure 6—figure supplement 1
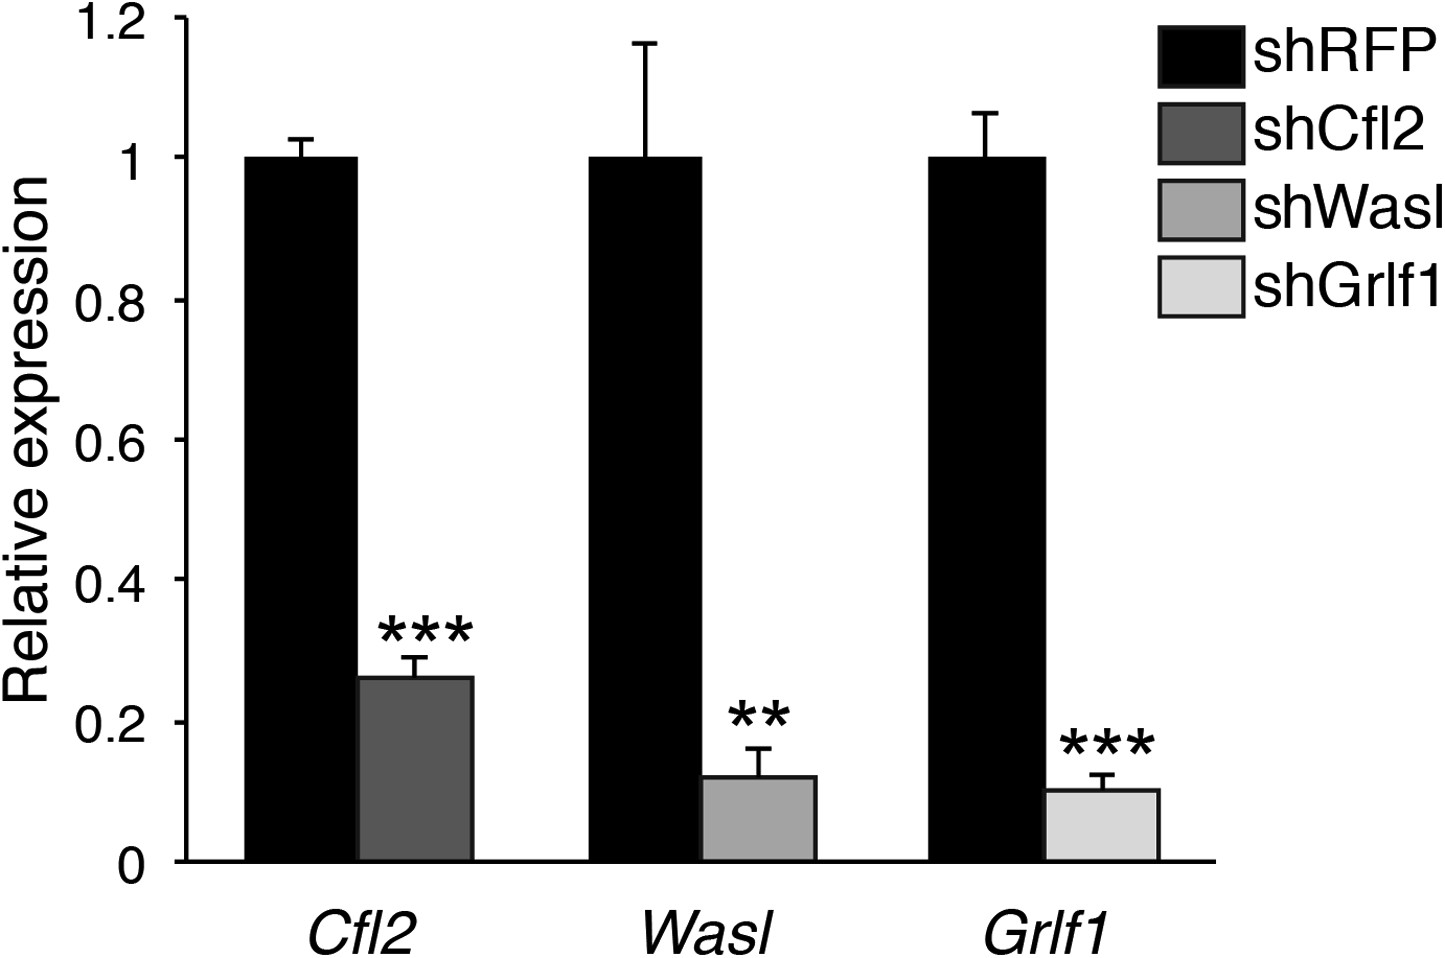
Knockdown validation of miR-142-3p targets.
qPCR expression analysis of Cfl2, Wasl, and Grlf1 genes in NIH-3T3 fibroblasts that were transduced with either lentivrial vectors encoding shRNAs directed against miR-142-3p targets (shCfl2, shWasl, shGrlf1; grey bars), or with lentivirus harboring control shRNA directed against RFP (shRFP; black bars). Data are presented as mean + SEM, and normalized to Hprt expression and to the mRNA expression in shRFP-transduced cells. **p<0.005; ***p<0.0005.
Figure 6—figure supplement 2
Knockdown of miR-142-3p targets in WT MKs has no effect on proplatelet formation.
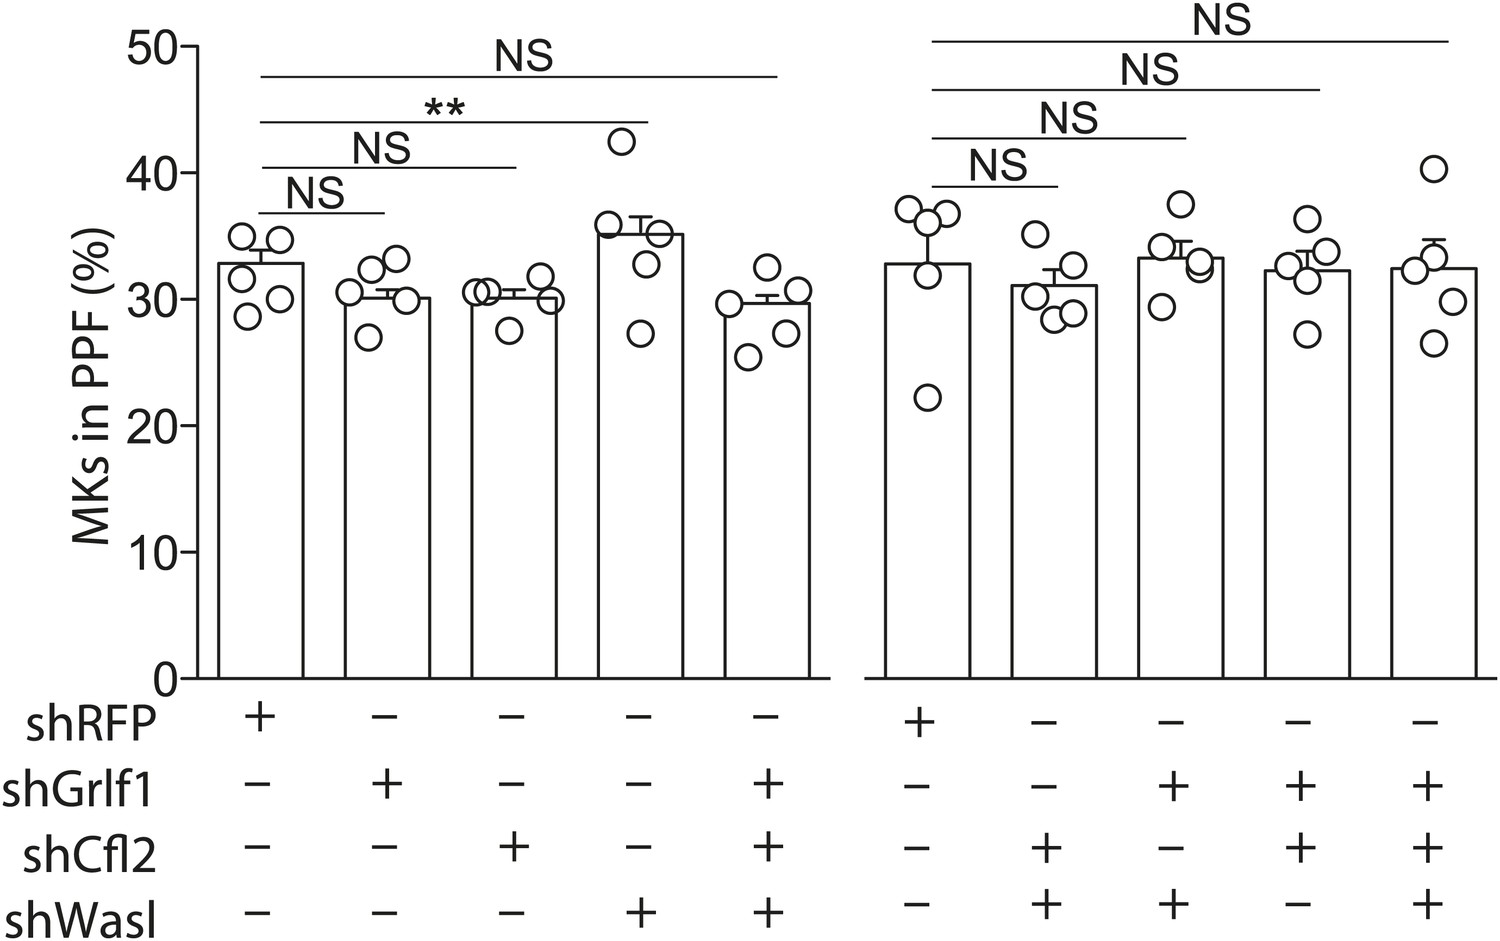
WT MKs transduced with shRNAs targeting miR-142-3p targets exhibited PPF levels slightly higher than WT MKs that were transduced with a control shRNA-targeting RFP. Representative results from one of two independent experiments (mean + SEM), five biological samples in each group. **p<0.005.
Additional files
-
Supplementary file 1
Sequences of primers used in this study.
- https://doi.org/10.7554/eLife.01964.022
Download links
A two-part list of links to download the article, or parts of the article, in various formats.
Downloads (link to download the article as PDF)
Open citations (links to open the citations from this article in various online reference manager services)
Cite this article (links to download the citations from this article in formats compatible with various reference manager tools)
miR-142 orchestrates a network of actin cytoskeleton regulators during megakaryopoiesis
eLife 3:e01964.
https://doi.org/10.7554/eLife.01964


