Subcellular and supracellular mechanical stress prescribes cytoskeleton behavior in Arabidopsis cotyledon pavement cells
- California Institute of Technology, United States
- University of Cambridge, United Kingdom
- Lund University, Sweden
- INRA-CNRS-UCBL-ENS Lyon, France
- Bruker Nano GmbH, Germany
- Howard Hughes Medical Institute, California Institute of Technology, United States
Figures
Figure 1 with 3 supplements

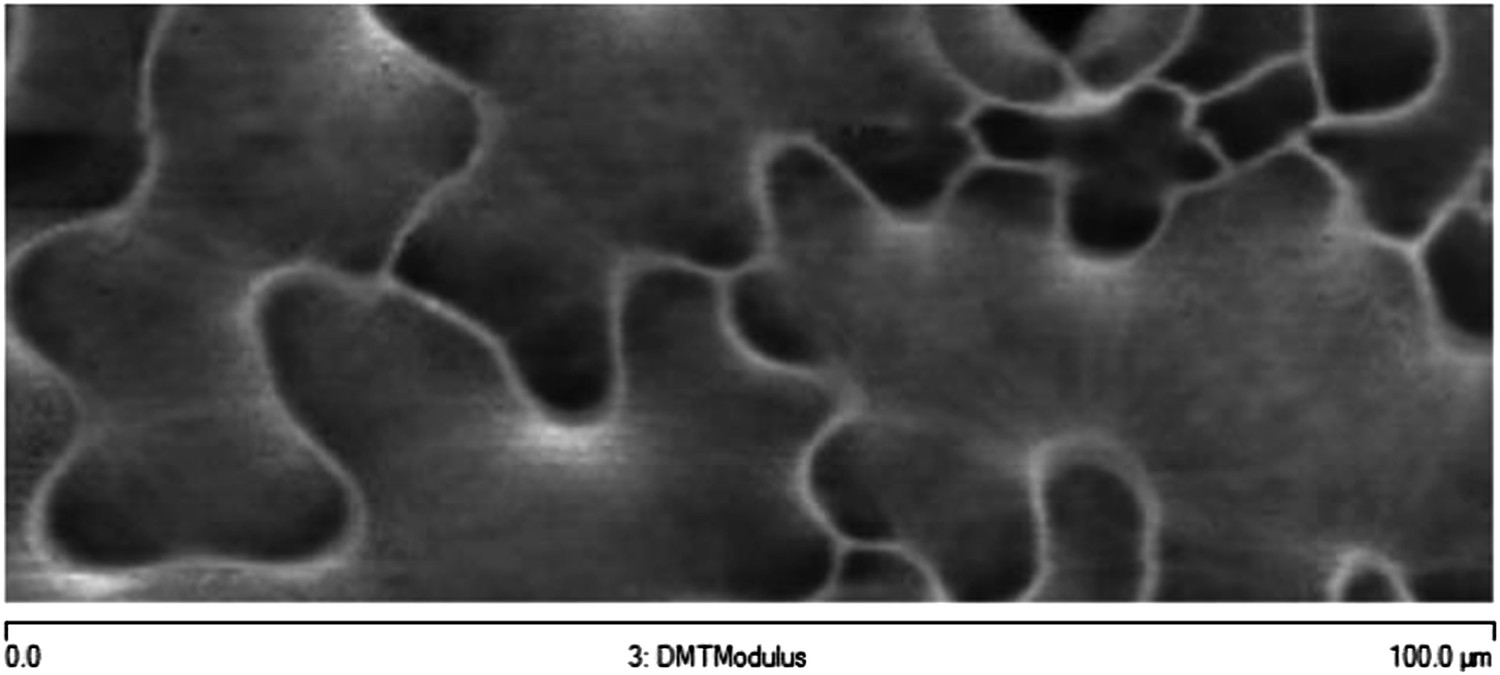
Mechanical heterogeneity of pavement cells correlates with microtubule patterns.
(A) Microtubule bundling persits in indenting regions of pavement cells over time. Scale bars 20 μm. (B) Microtubule anisotropy over time, lines represent average orientation of microtubule arrays at different time points within the region of interest (dashed box in A). Longer lines indicate higher degree of anisotropy. (C) Stiffness map of the outer walls in two guard cells obtained by atomic force microscopy revealing transverse wall reinforcements. Gray scale bar represents scale of the observed elastic modulus in MPa. (D) Siffness map of the outer walls in pavement cells obtained by atomic force microscopy (same scale bar). Indenting regions exhibit striations with increased values of elastic modulus, reflecting regions with strong mechanical anisotropy. (E) 3D rendering of pavement cell topography as obtained by atomic force microscopy.
Figure 1—figure supplement 1
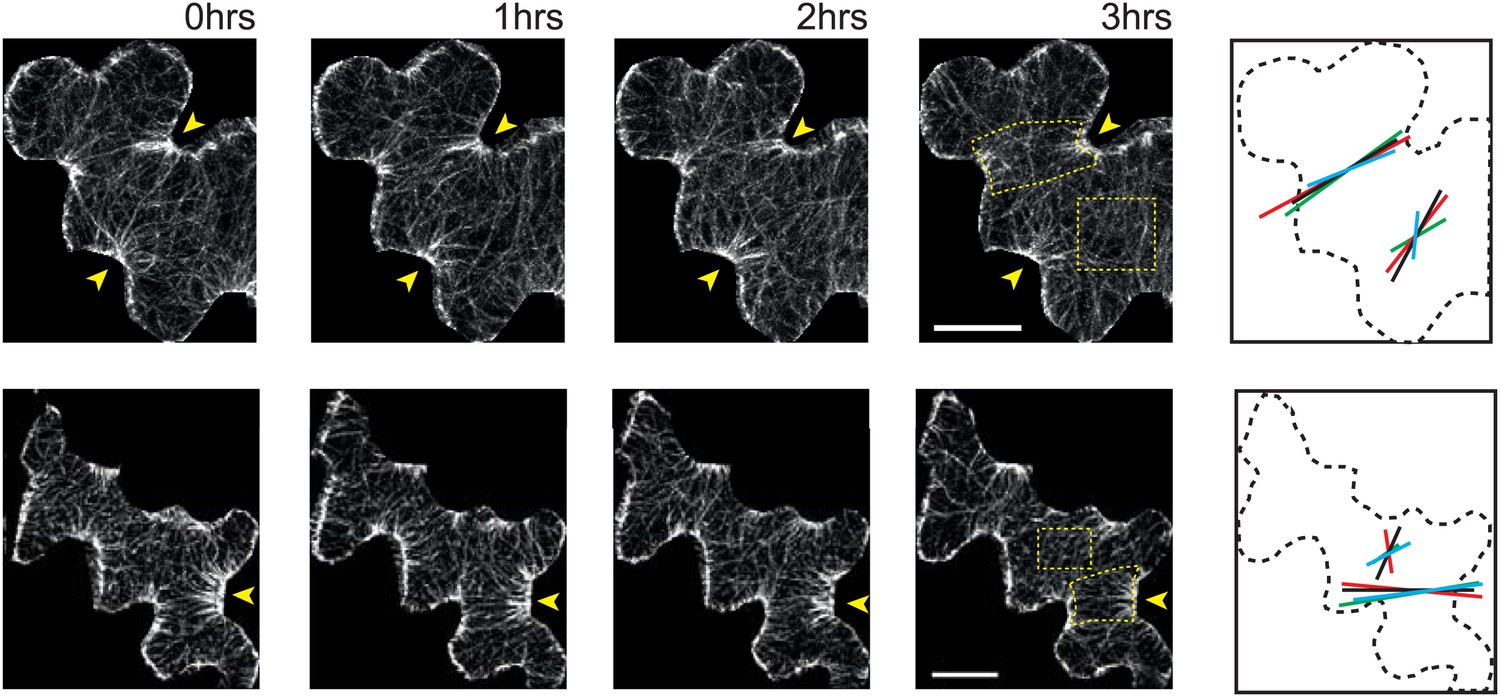
Microtubule organization and mechanical heterogeneity.
Additional examples of microtubule bundling persisting along the indenting regions of pavement cells over time, far right panels shows lines representing the average orientation of microtubule arrays at different time points within the region of interest (dashed box). Length of the line indicates strength of anisotropy (longer lines indicate higher degree of anisotropy). Scale bars 25 μm.
Figure 1—figure supplement 2
Microtubule organization and mechanical heterogeneity.
Additional example of stiffness map of the outer walls in another cotyledon obtained with AFM.
Figure 1—figure supplement 3
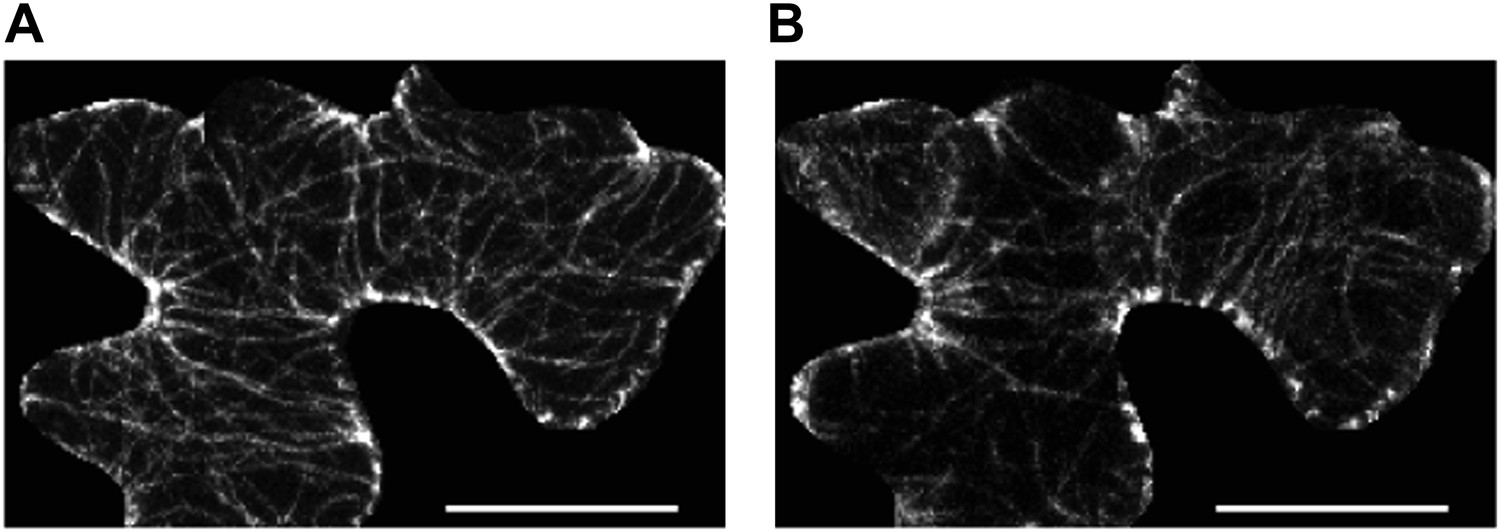
Microtubule organization and mechanical heterogeneity.
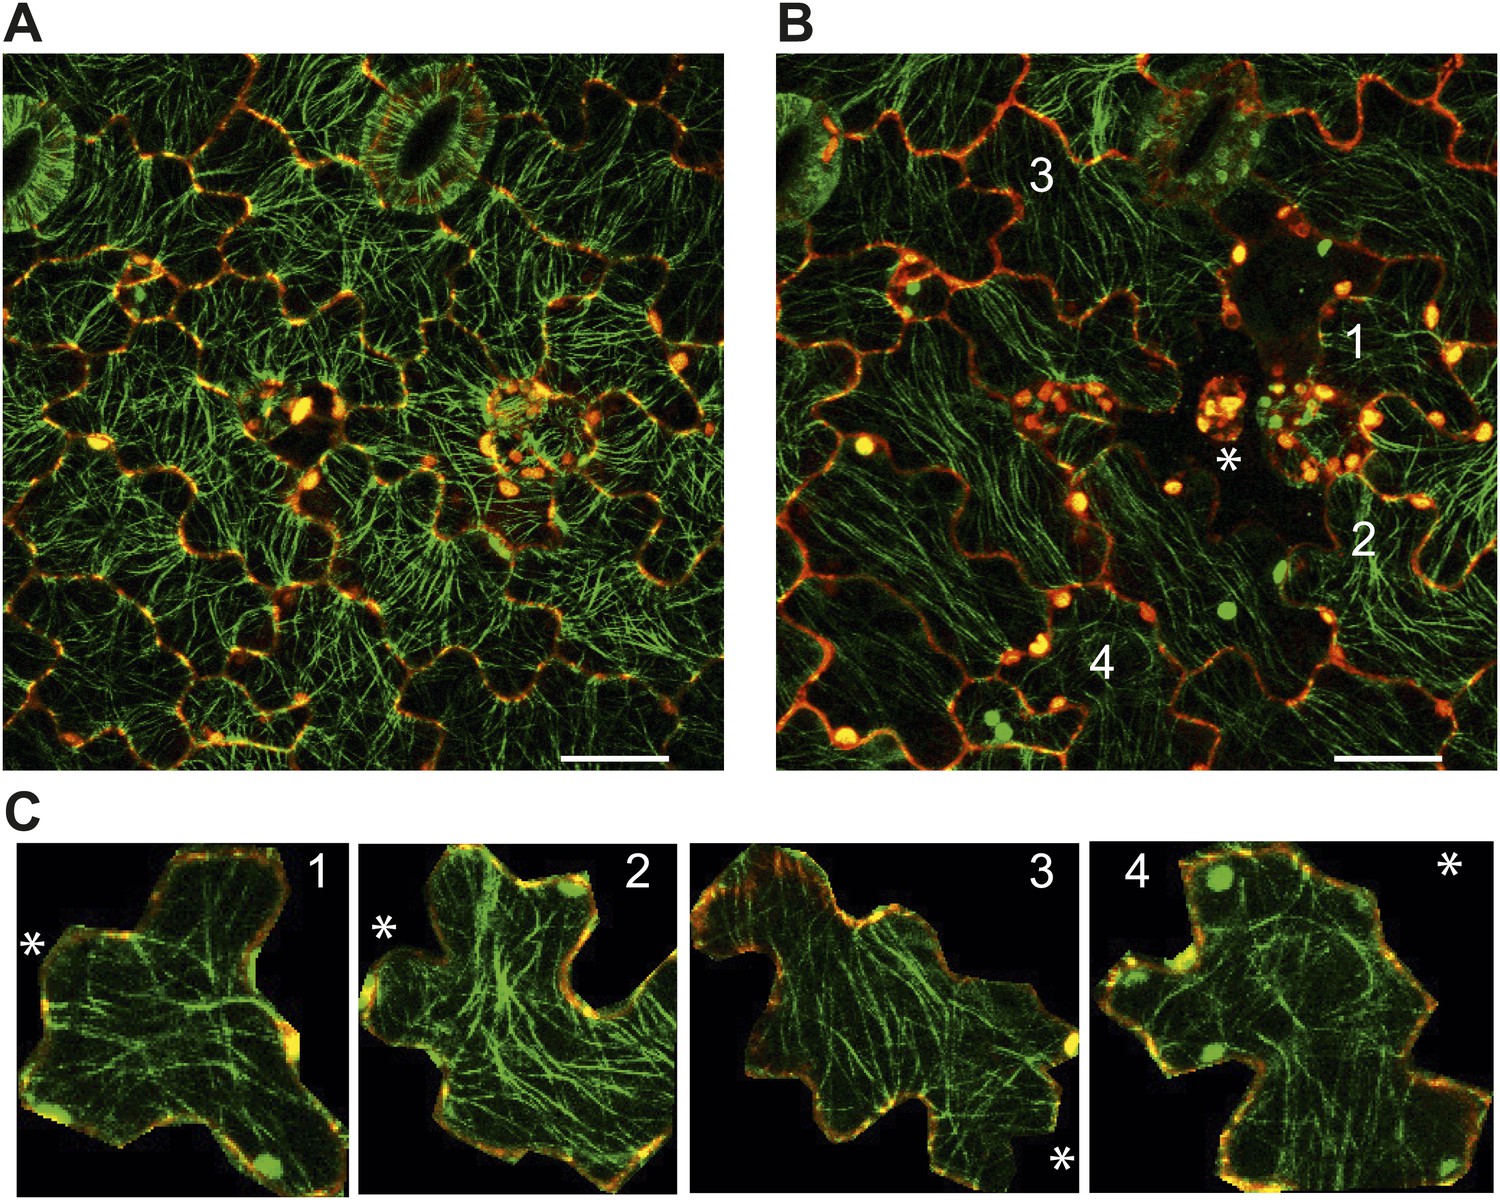
(A and B) Microtubule orientation on the outer (A) and inner (B) side of epidermal pavement cells Scale bar 25 μm.
Figure 2 with 3 supplements
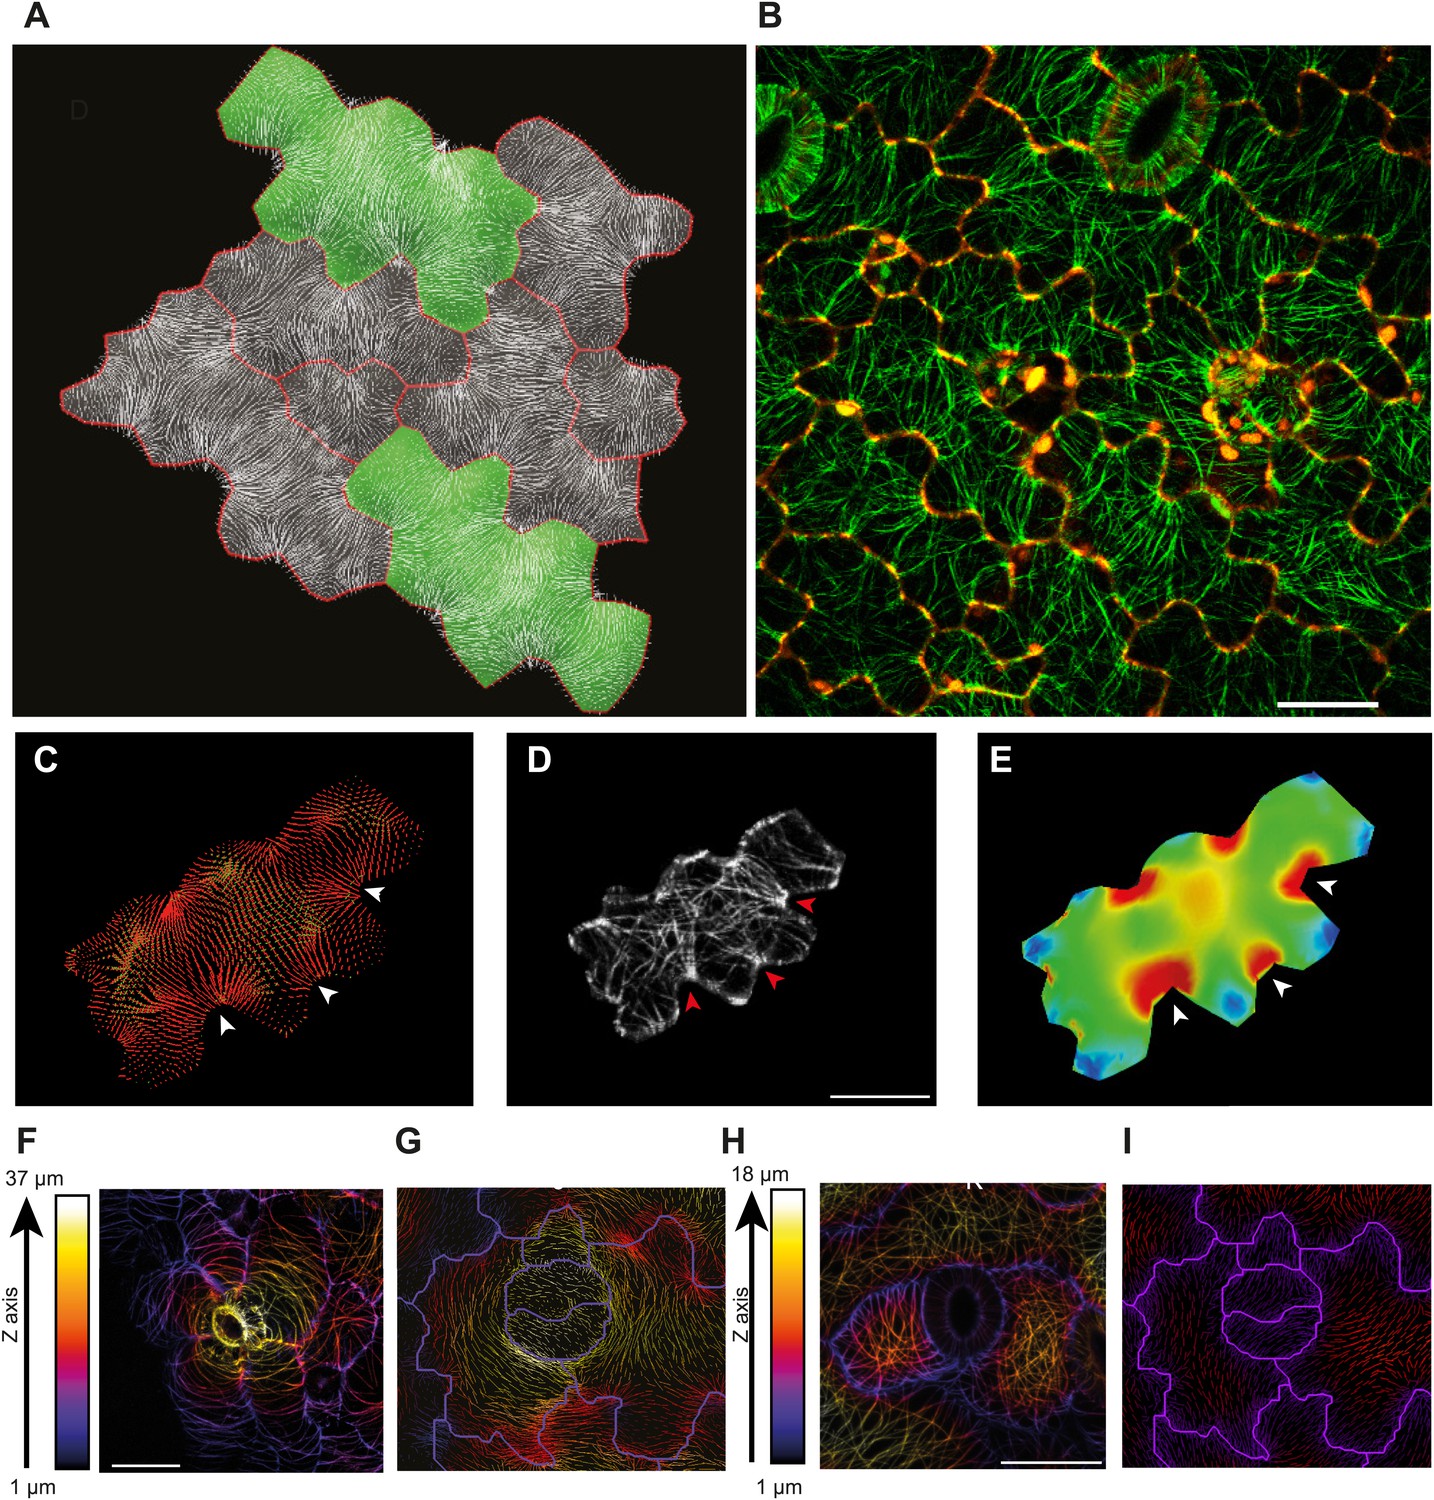
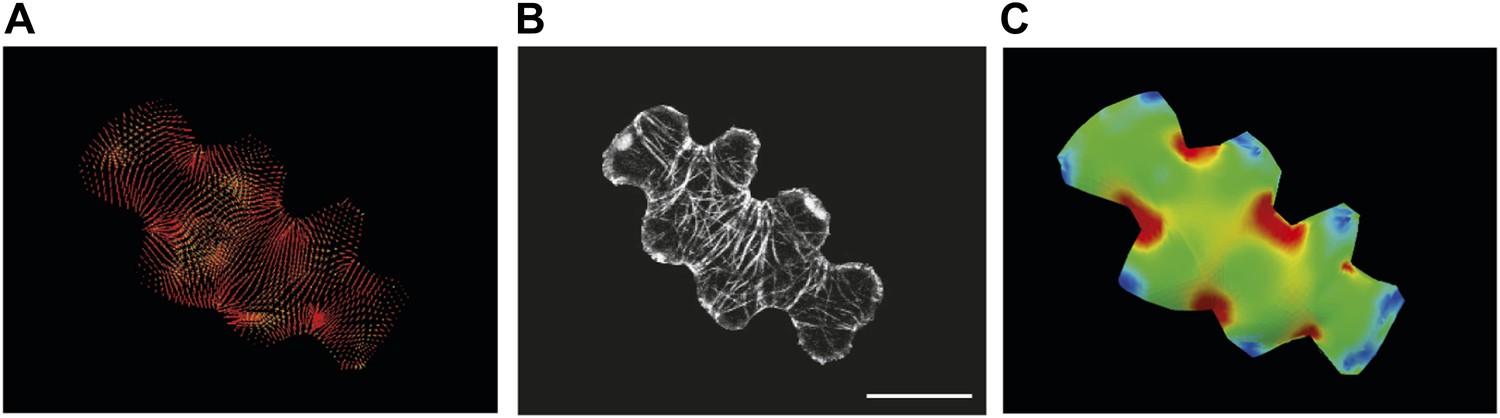
Microtubule patterns correlate with physical stress patterns.
(A) Mesh showing stress directions, with the corresponding microtubule organization shown in panel B. Highlighted cells in green are represented in panels C–E and Figure 2—figure supplement 1A–C. (C) Largest stress direction (red) and second principal stress direction (green) in mechanical models of the pavement cell. White arrowheads indicate regions of convergence of directional tensile stresses in necks of pavement cells. (D) Microtubule (YFP-MBD) orientations correlate with the maximal stress direction predicted in the mechanical model. (E) Heat map showing the magnitude of stress distribution in the mechanical model. Arrowheads indicate regions of highest stress magnitude in neck regions. Scale bars 20 μm. (F) Circumferential distribution of microtubules surrounding elevated guard cells represented as a depth color-coded Z-stack. (G) Mechanical model of stress patterns around a stomata reproduce the observed arrangements of microtubules surrounding guard cells. (H) Microtubule organization around a non-elevated stoma and a mechanical model of stress patterns of the same (I). Scale bars 25 μm.
Figure 2—figure supplement 1
Microtubule organization and correlation with stress patterns.
(A–C) Example cell from Figure 2A showing correlation between predicted physical stresses and microtubule organization. Scale bars 20 μm.
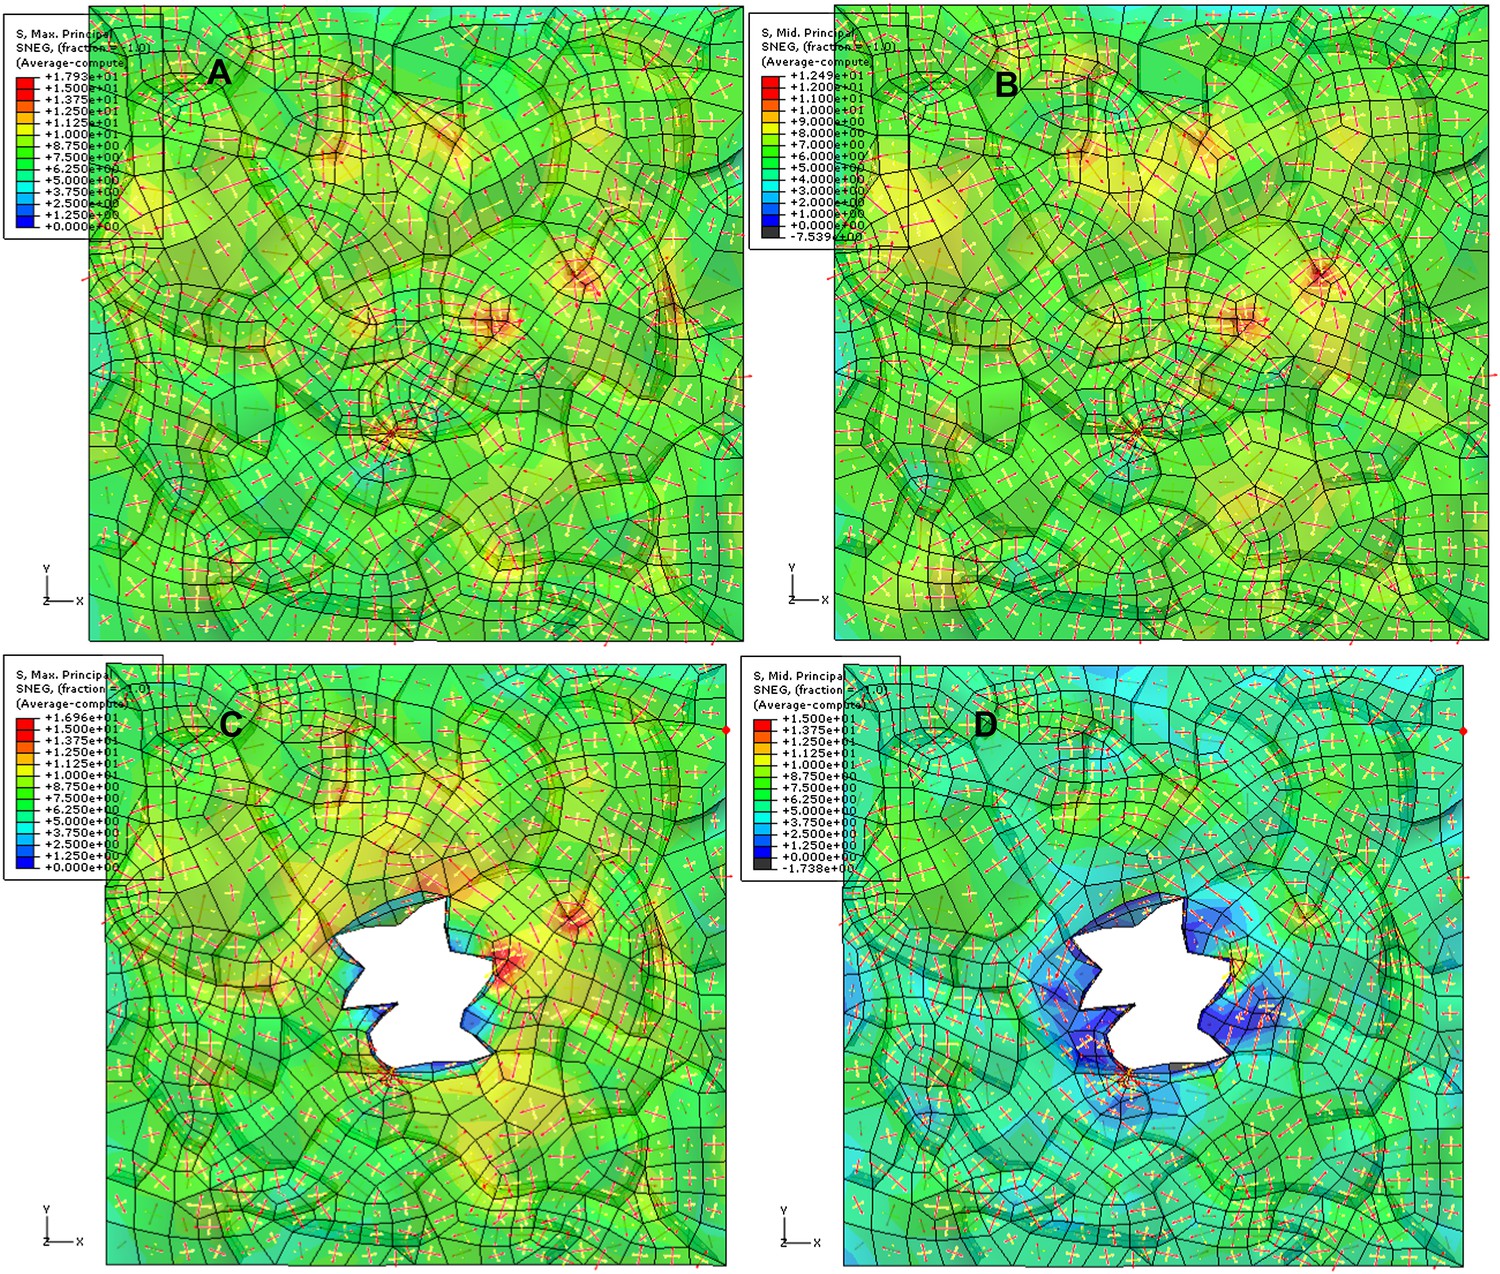
Figure 2—figure supplement 2
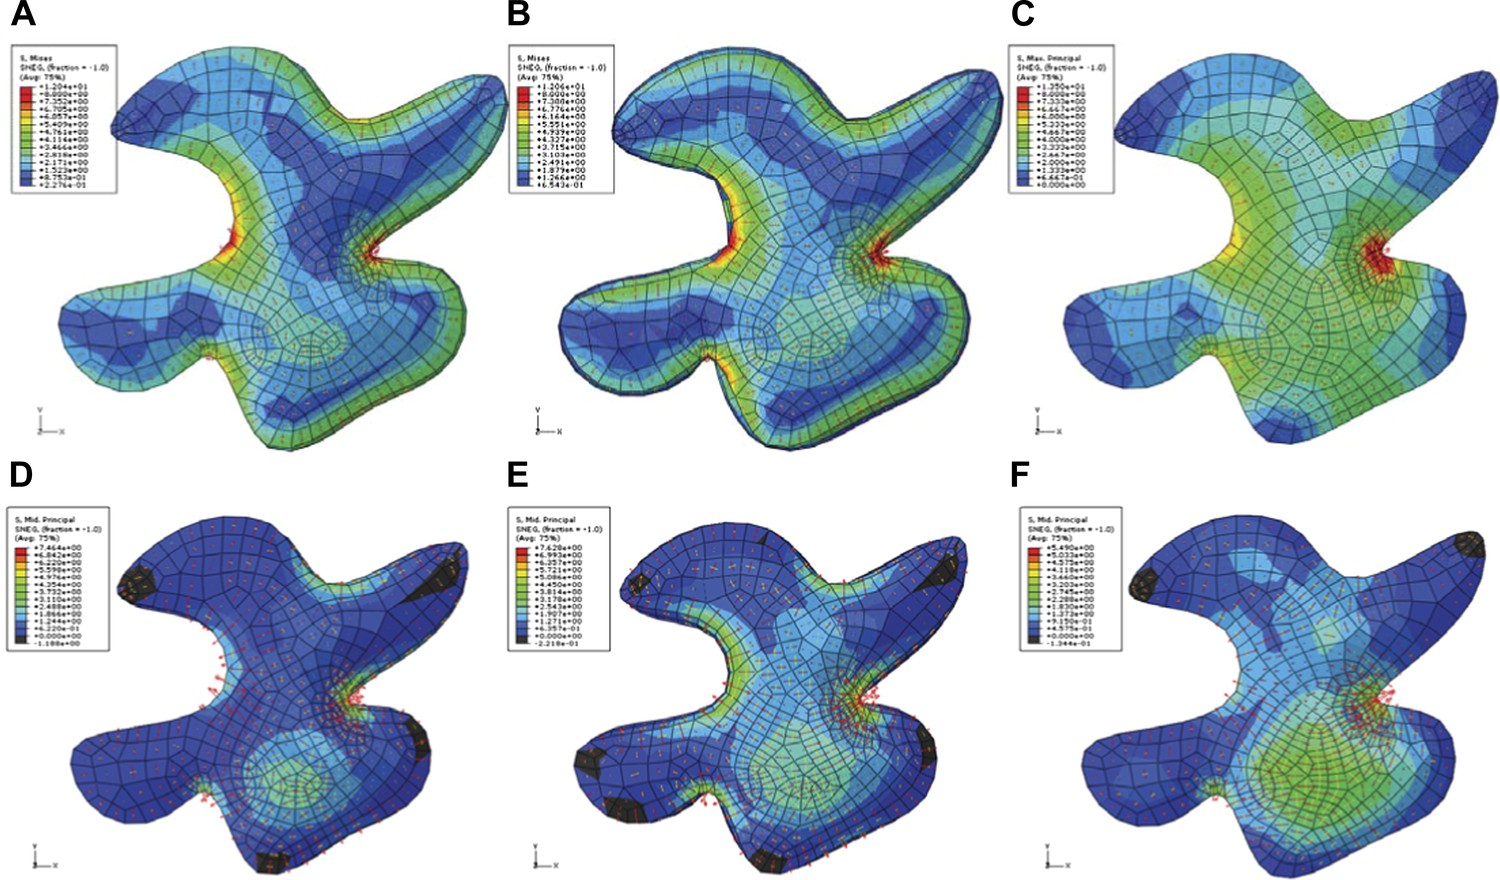
Simulation of single pressurized pavement cell shape A and D.
3D cell with epidermal, bottom, and anticlinal wall. (B and E) The bottom wall removed and replaced with boundary conditions at the bottom of the anticlinal wall. (C and F) Surface model of epidermal wall only with anticlinal walls replaced by boundary condition. (A–C) The color map (Blue to Red) shows the value of the first principal stresses. (D–F) The color map shows the value of second principal stresses. Blue to red mark positive values (tension). The black is negative values (compression).
Figure 2—figure supplement 3
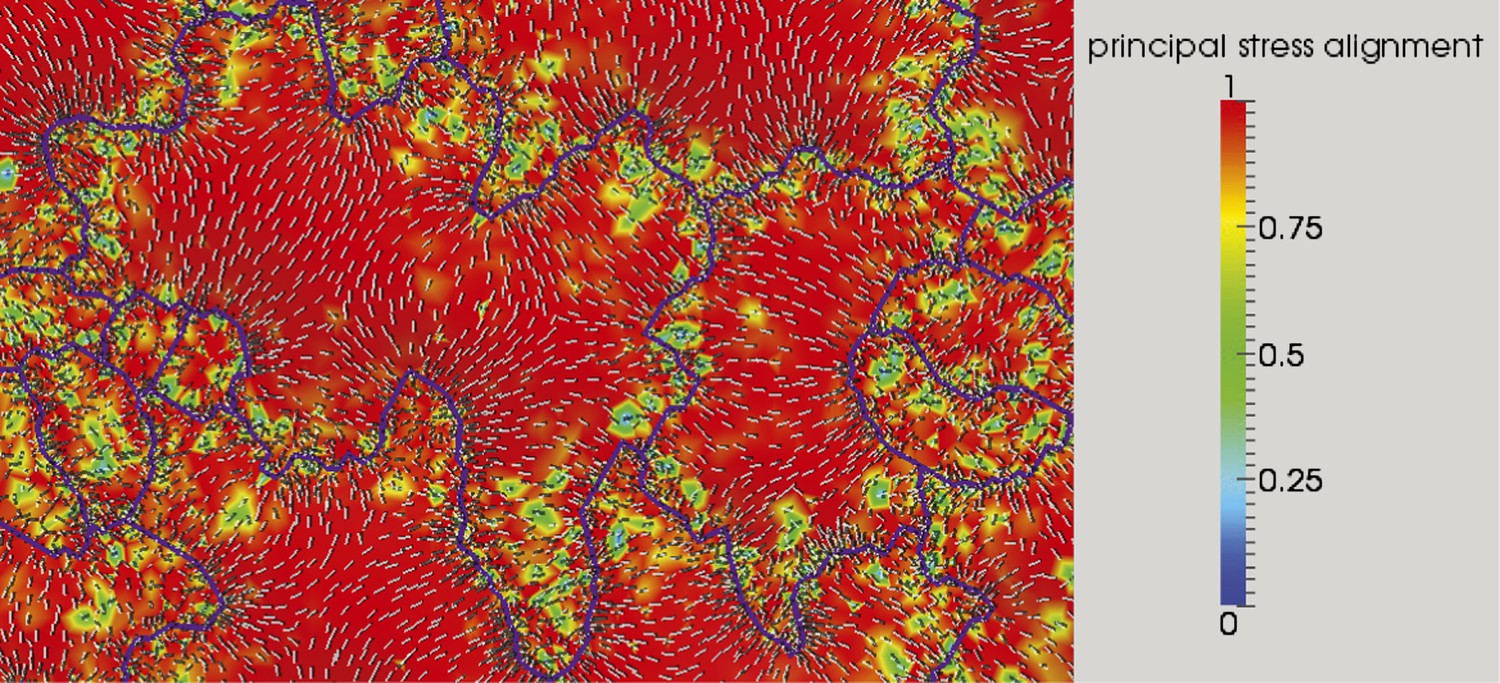
Microtubule organization and correlation with stress patterns.
Color map of the cosine of angle between first principal stress without (white lines) and with anisotropic material and feedback to stress direction (black lines).
Figure 3 with 4 supplements
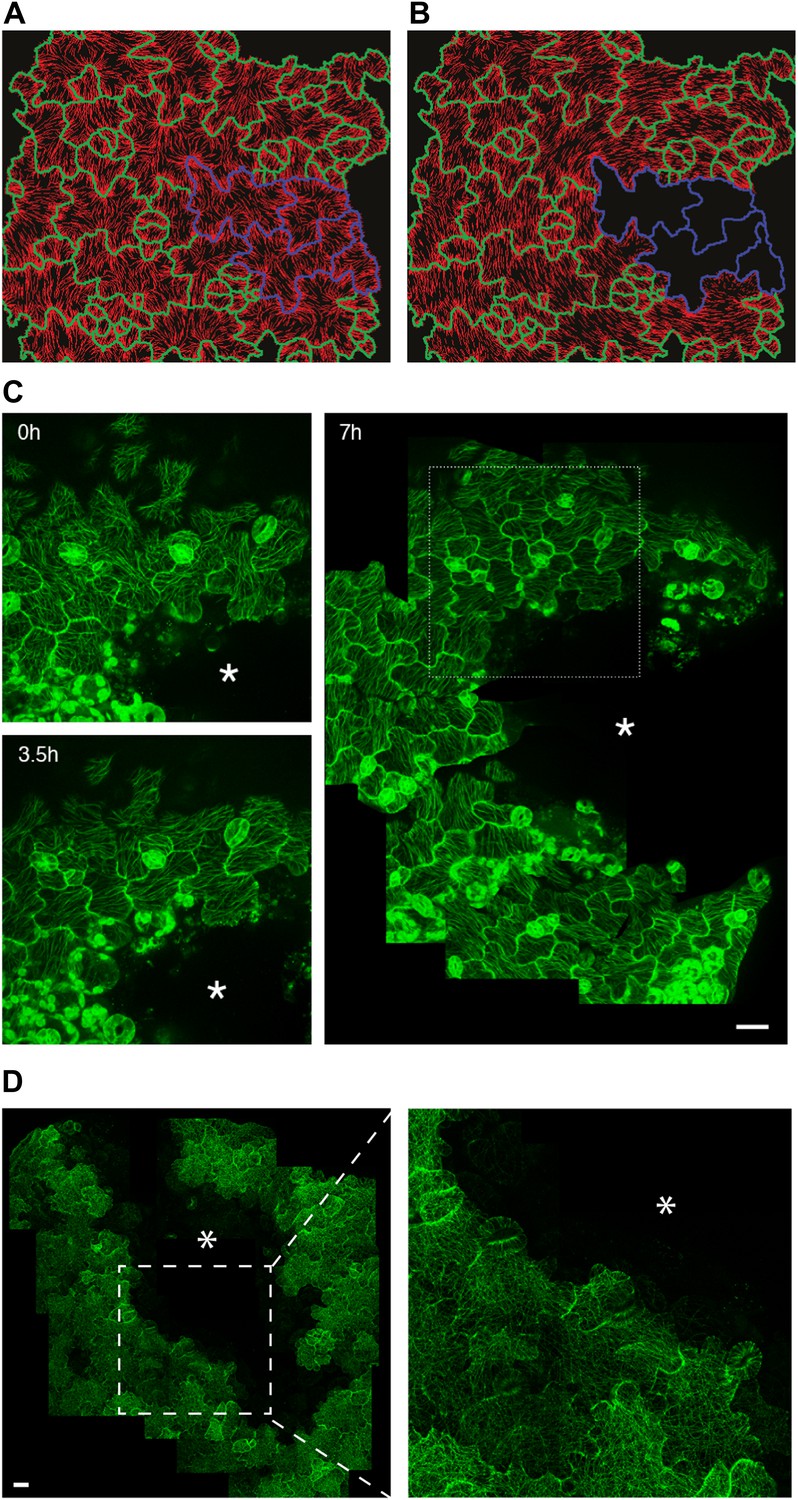
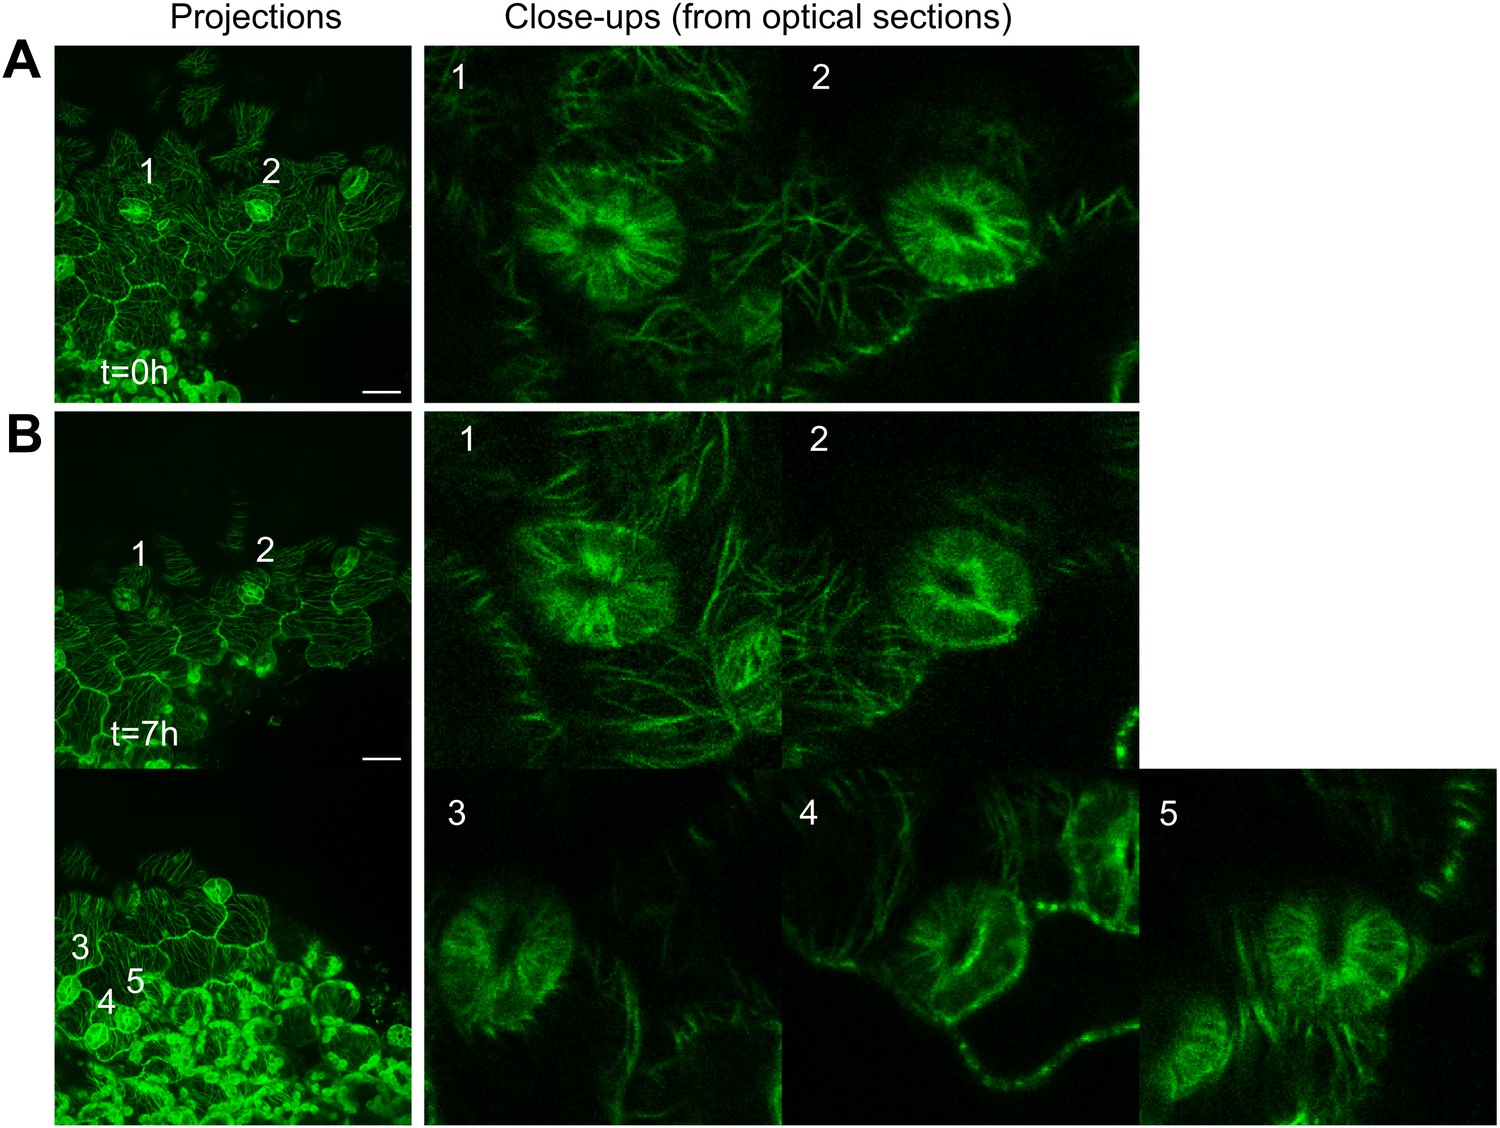
Extrinsic perturbation of mechanical forces induce directional changes in microtubule arrays.
(A and B) Mechanical models showing changes in stress directions upon ablation. (C) Large scale ablation of cotyledons result in circumferential distribution of microtubule arrays around the site of physical perturbations, reproducing the results of the physical model. (D) Microtubule arrays in pavement cells of mutant botero 1-7 shows random organization 7 hr after perturbation. Asterisk marks site of laceration. Scale bar 25 μm.
Figure 3—figure supplement 1
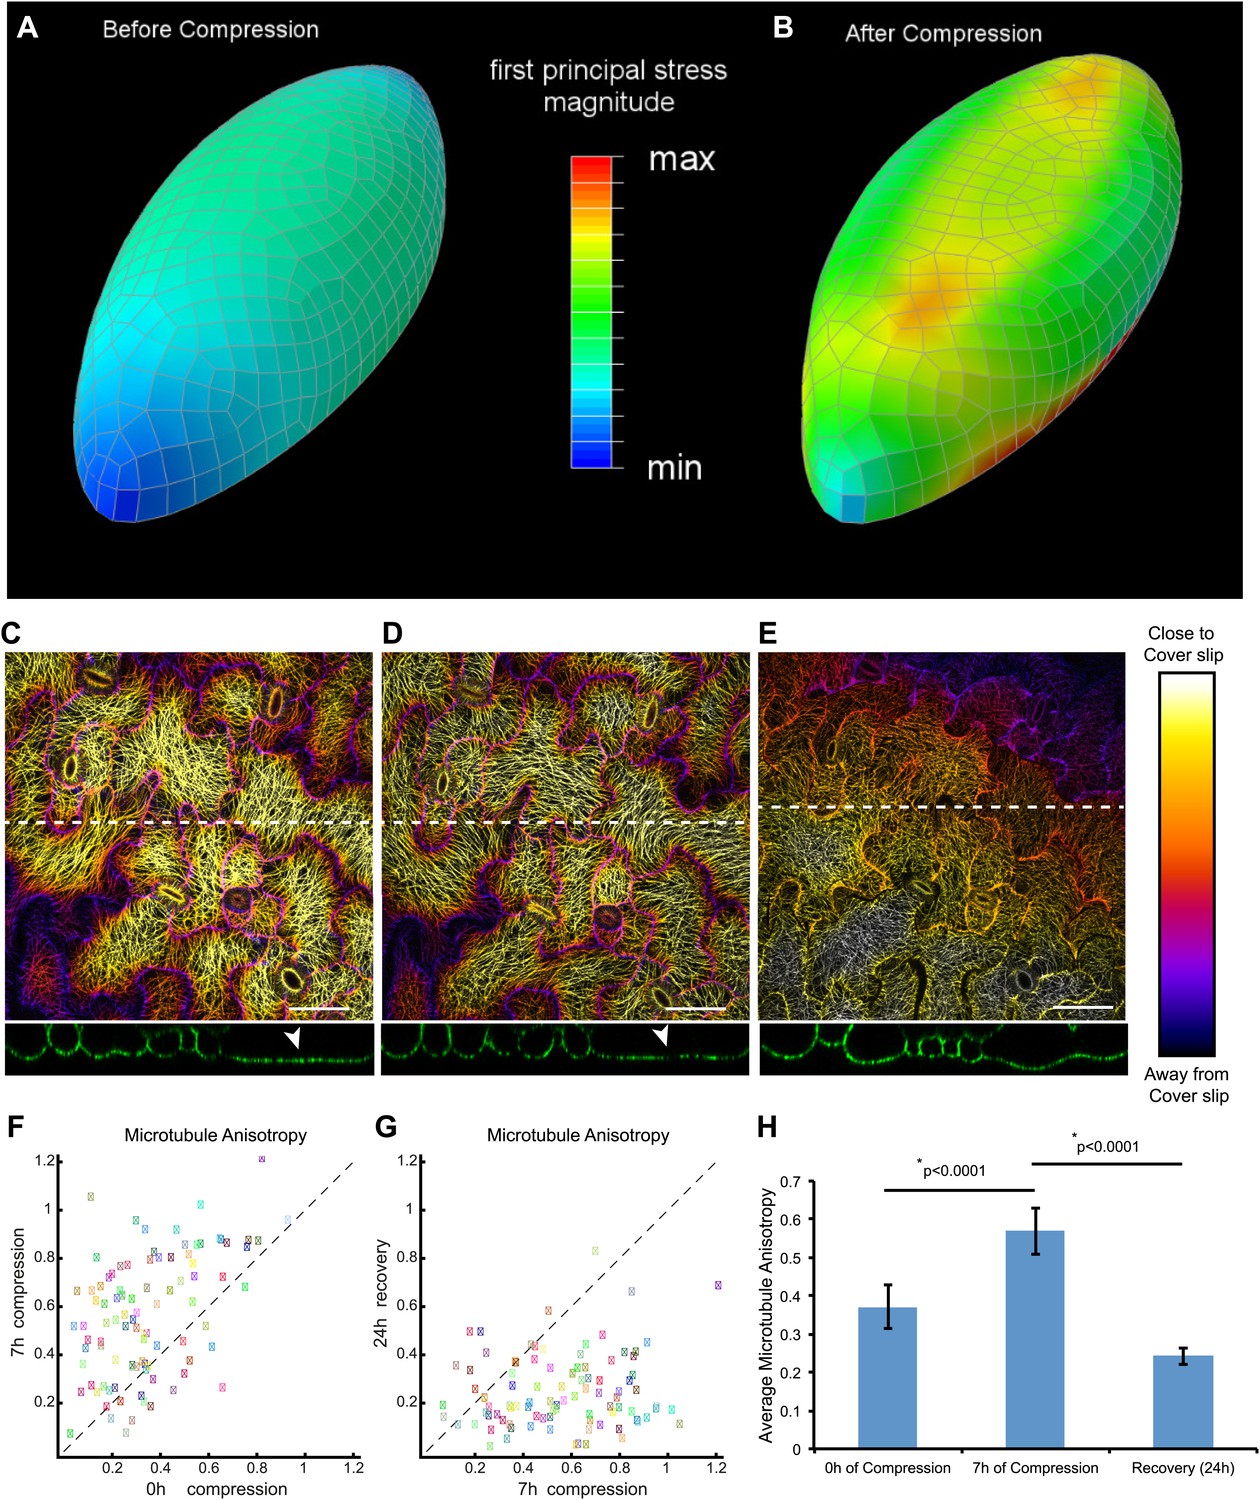
Mechanical compression leads to increased microtubule anisotropy in pavement cells.
(A and B) Mechanical models predict an increase in mechanical stress compression. (C and D) Depth color-coded Z-stack of microtubules, immediately after applying compressive forces (C) and after 7 hr of compression (D). (E) Recovery of microtubule arrays 24 hr after release of compression. Lower panels show orthogonal projections along dashed lines showing flattening of cells due to compression, and recovery from compression. Arrowhead indicates flattened region. Far right panel shows color bar representing scale along the Z axis. (F and G) Scatter plots comparing nematic tensor values of individual cells showing increase of microtubule anisotropy 7 hr after compression (F) and decrease following release of compression (G). Colored boxes represent identical cells in both plots. (H) Histogram of average microtubule anisotropy values under each condition. Error bars represent standard error. Asterisk shows significance (p values derived from Mann–Whitney U test), N = 5 seedlings, 95 cells per treatment. Scale bar 50 μm.
Figure 3—figure supplement 2
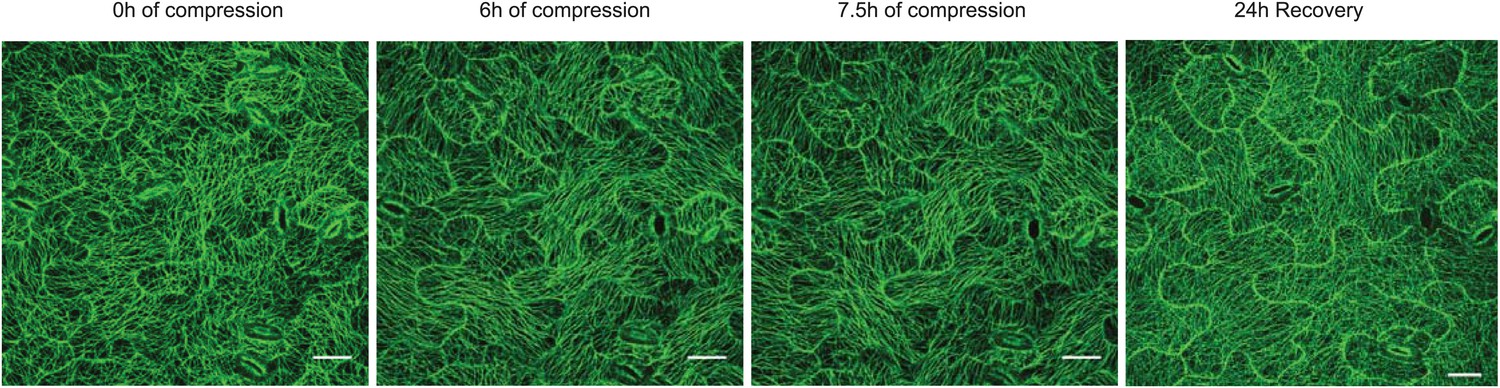
Compression of pavement cells results in stabilization of microtubule array orientation.
Note the increased MT anisotropy during compression and reduced MT anisotropy upon release of compression.Scale bars 25 μm.
Figure 3—figure supplement 3
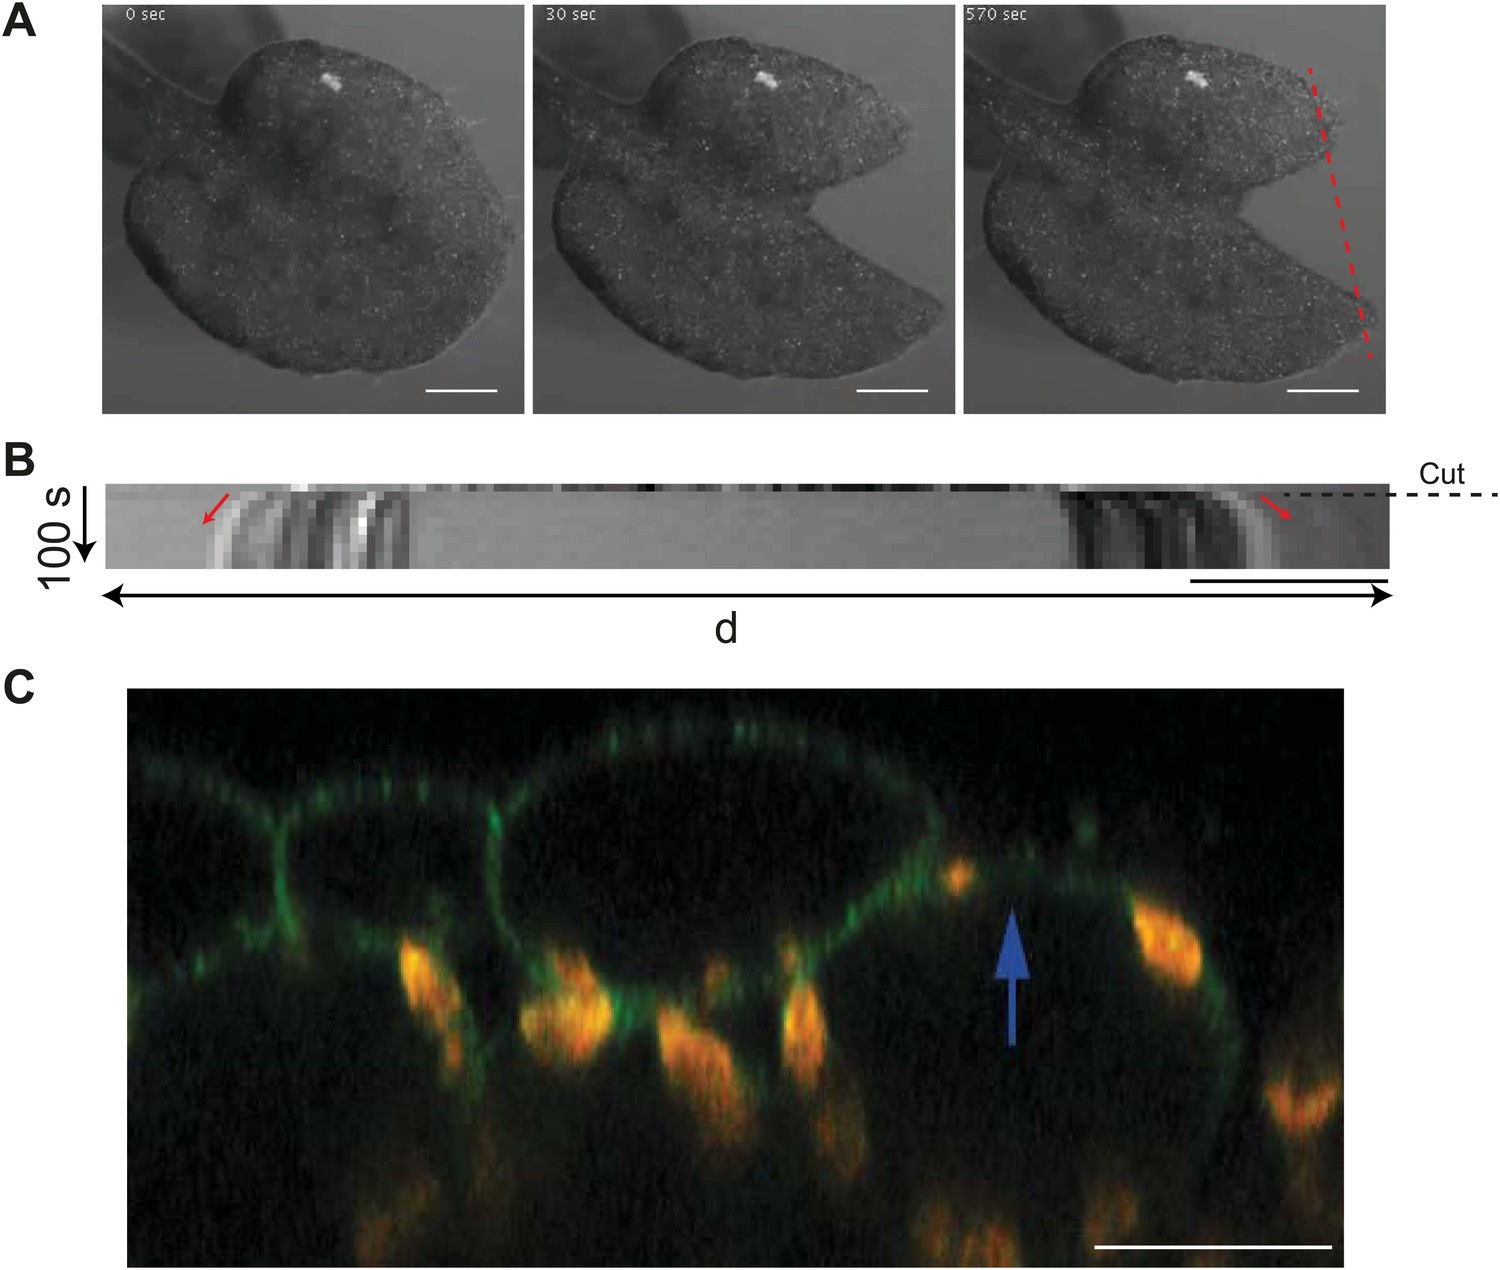
Cotyledon epidermis is under tension.
(A) Time series images of a cut cotyledon. Scale bar 500 μm. (B) Kymograph along the dashed red line in panel (A) showing gap opening immediately after physical laceration of the cotyledon, and consistent with release of tension. Dashed line indicates point of laceration and red arrows indicate displacement of the tissue in either direction. Scale bar 100 μm. (C) Removal of epidermis in the microtubule reporter line (MBD:GFP) by laser ablation shows an upward shift in the position of mesophyll cells of cotyledon tissue, consistent with mesophyll being under compression. Scale bar 20 μm.
Figure 3—figure supplement 4
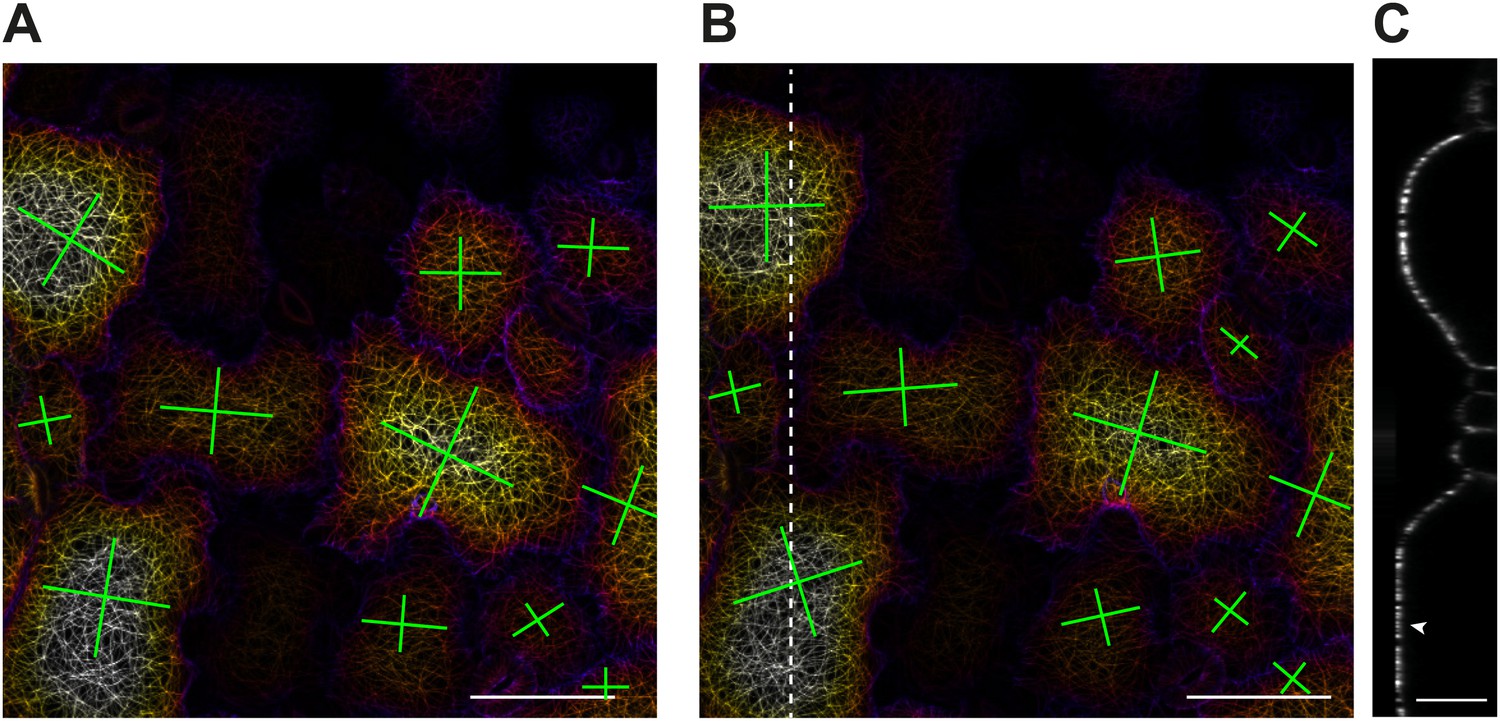
Microtubule response to changes in physical forces in katanin mutant.
Depth color-coded Z stack of microtubule arrays before (A) and 8 hr after compression in botero 1-7 (B). Scale bar 50 μm. (C) Transect along dashed line in (B) showing flattening of cell due to compression. Crosses represent strength of microtubule alignment in one direction or the other. Scale bar 25 μm.
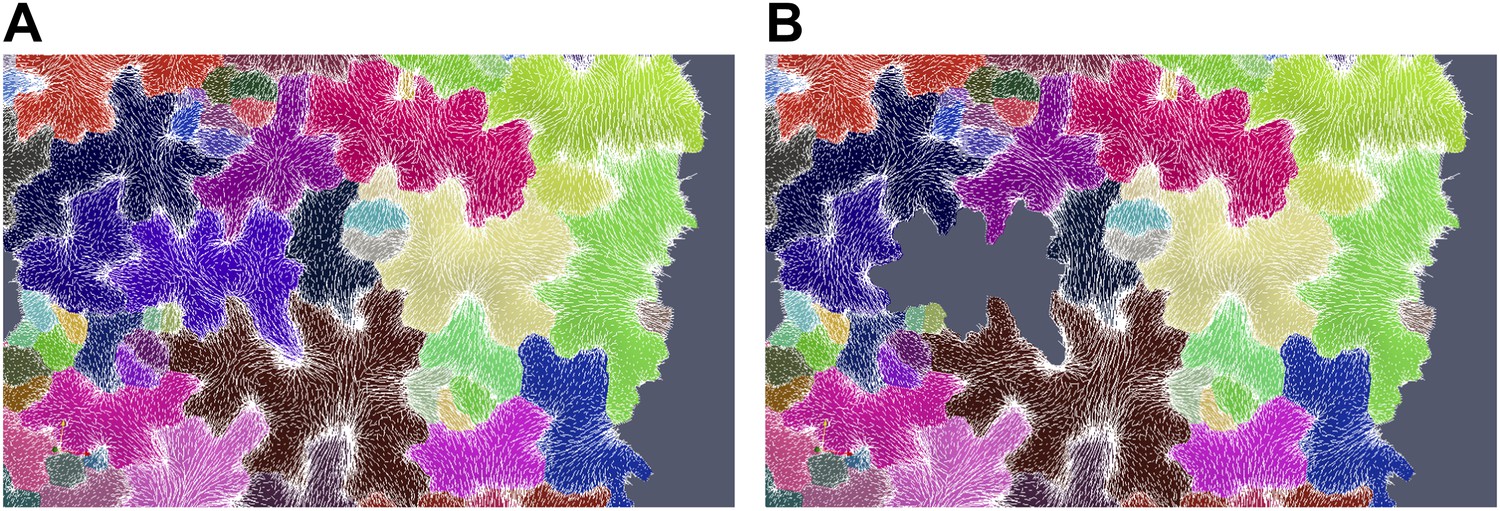
Figure 4 with 2 supplements
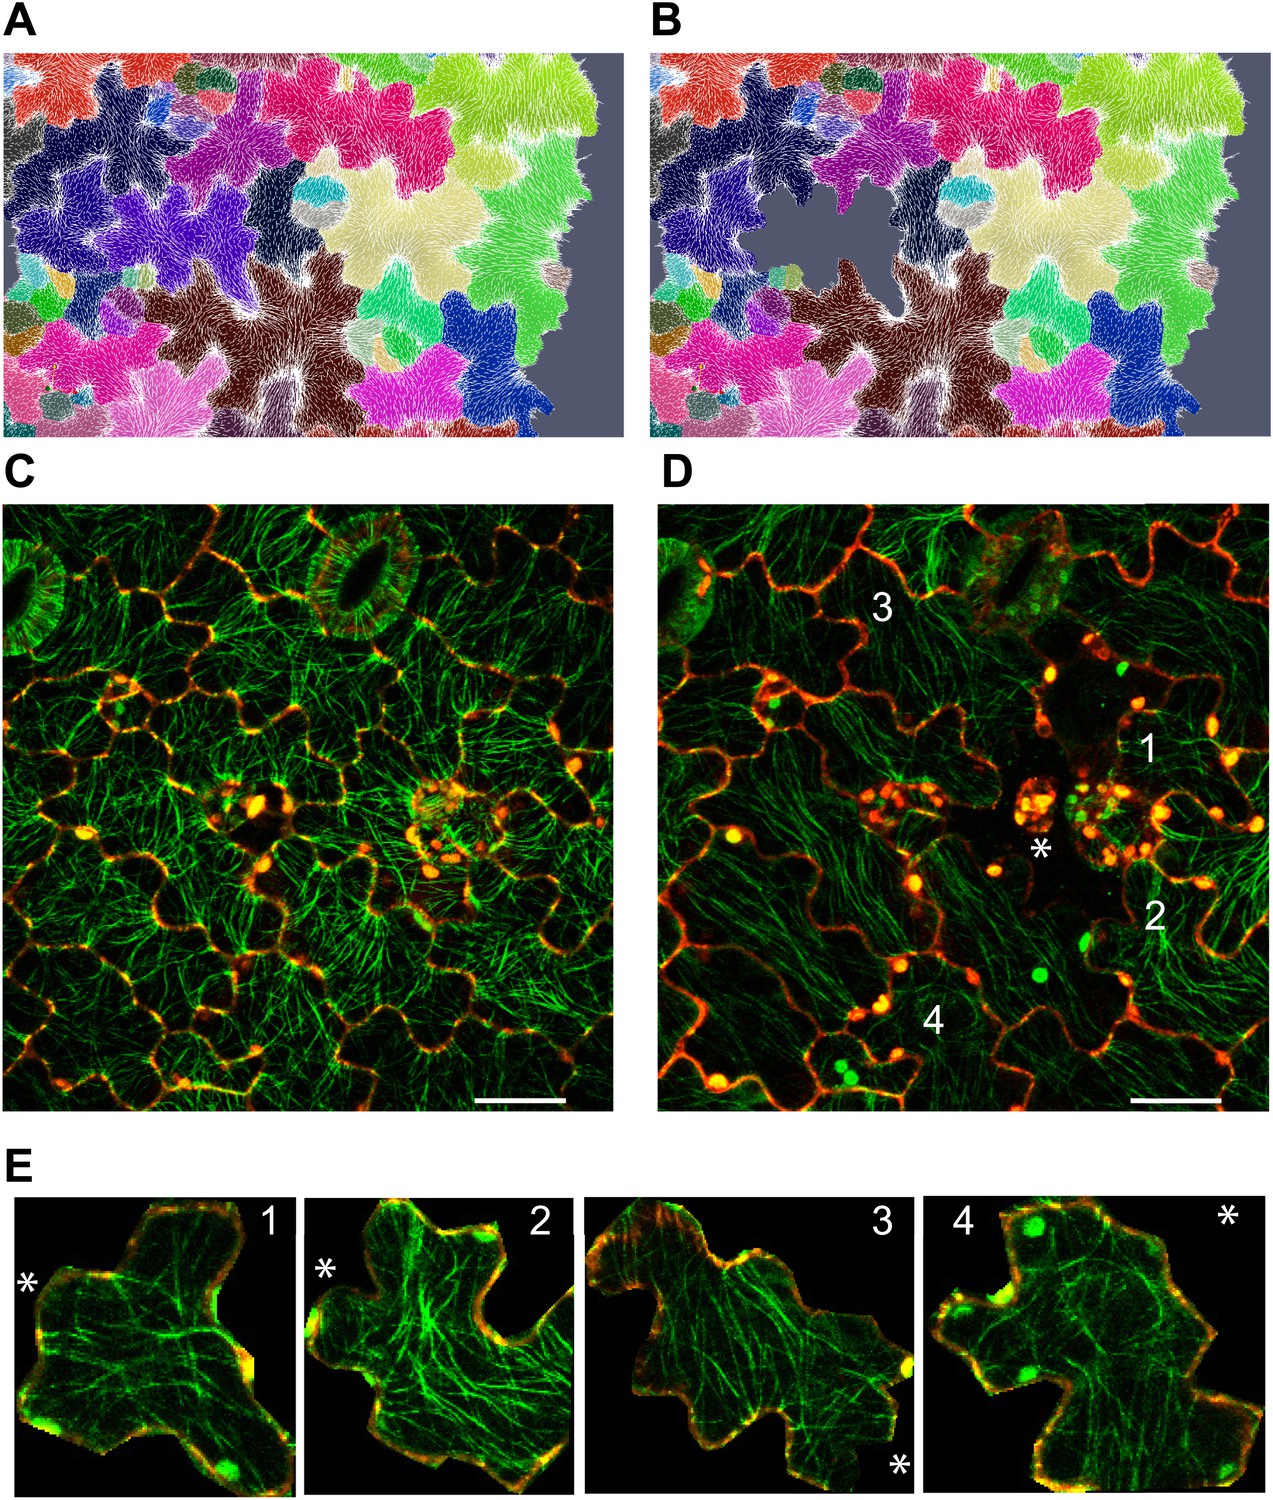
Stress intensity regulates microtubule alignment.
(A and B) Simulation showing less pronounced circumferential rearrangements of stresses after ablation of single cell. Images of microtubule reporter line before (C) and 7 hr after (D) ablation of single cell, showing aligned microtubule arrays not completely circumferential after ablation of single cell. Scale bars 50 μm. (E) Magnified images of cells in figure D (Images not to scale). Asterisk shows the location of the ablated cell.
Figure 4—figure supplement 1
Microtubule array organization in guard cells remains unaffected by changes in directional force field.
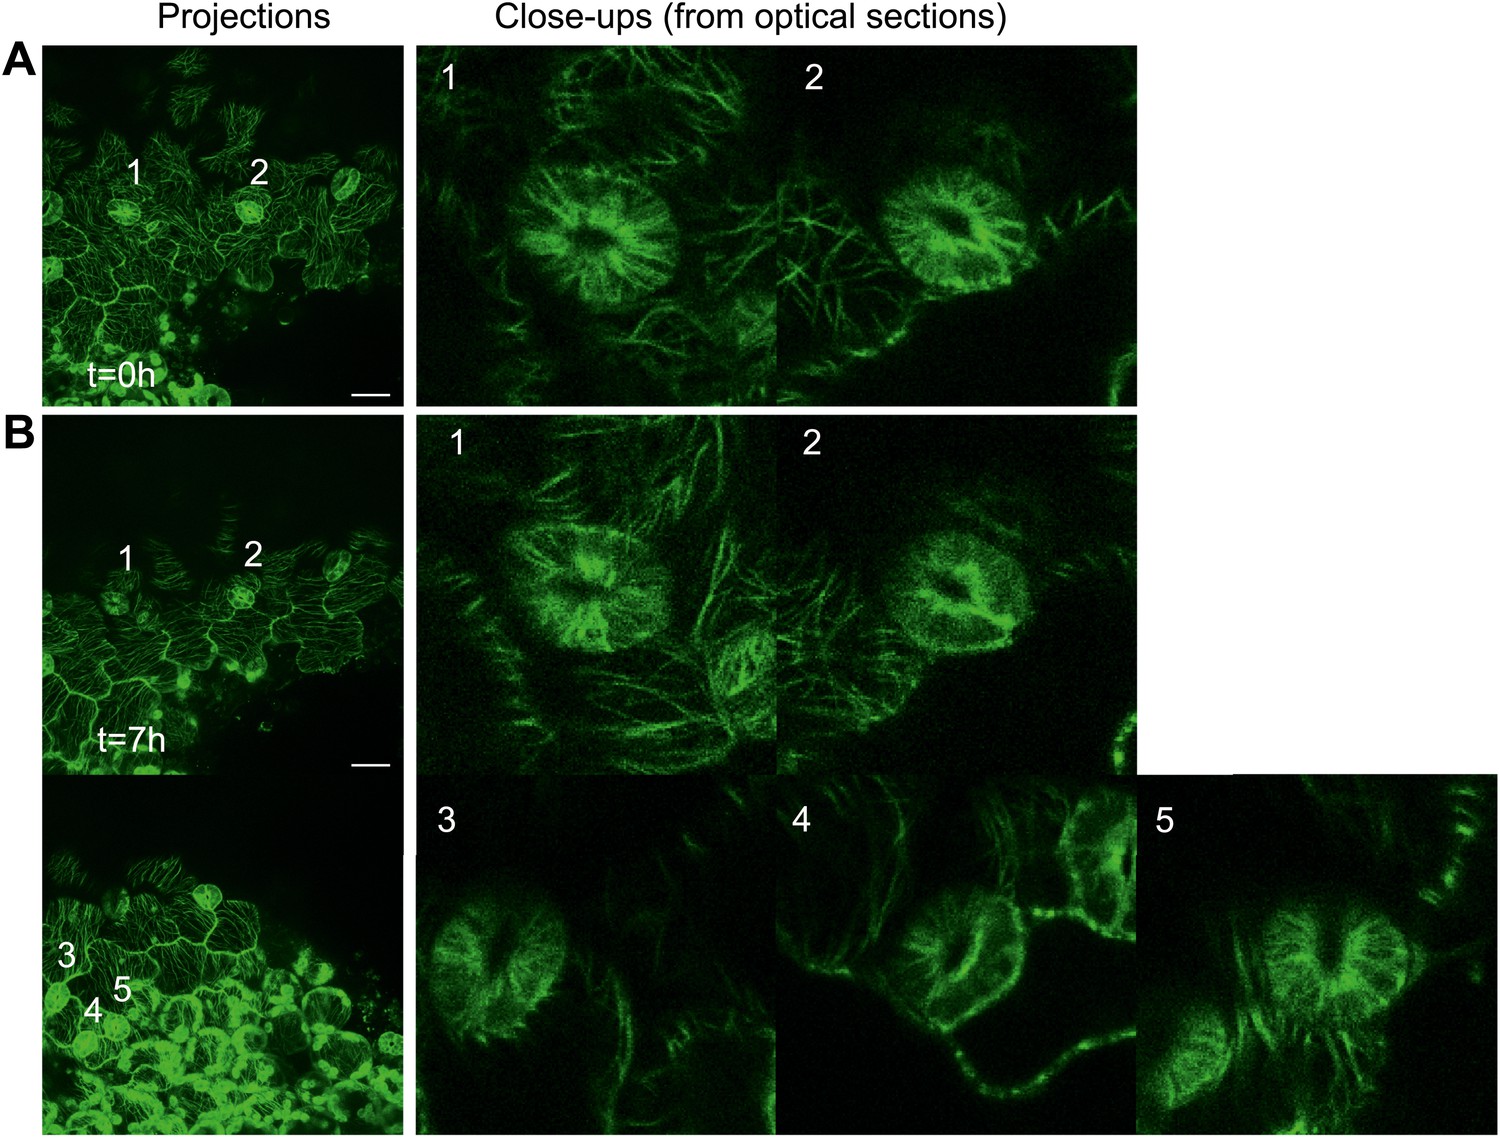
Close up image of microtubule arrays in guard cell before (A) and 7 hr after (B) large-scale ablation. Majority of the guard cells retain the transverse pattern of microtubule arrays after laceration. Scale bars 25 μm.
Figure 4—figure supplement 2
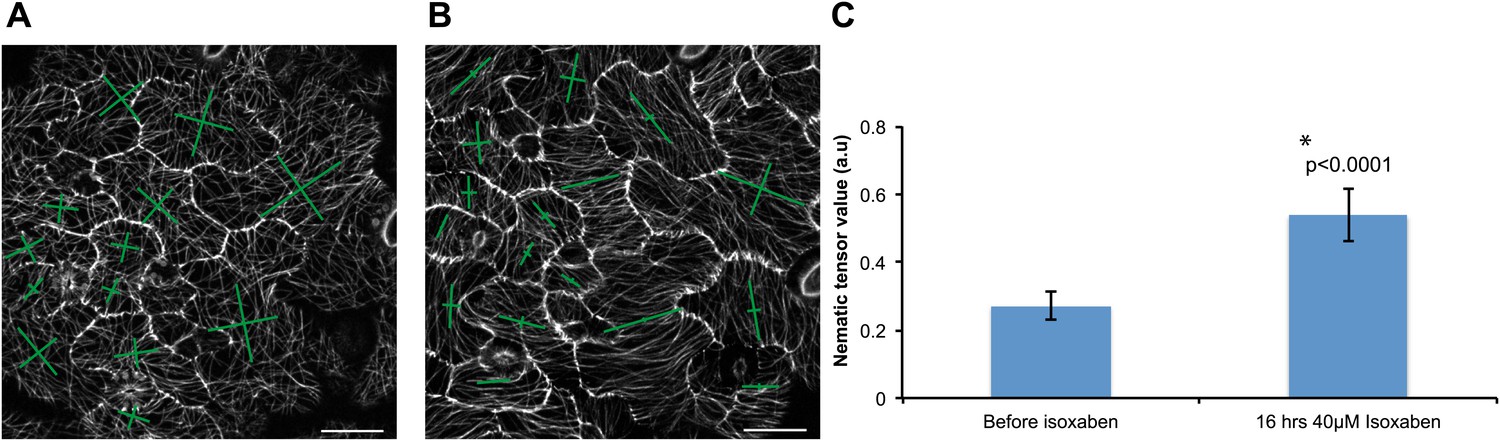
Microtubule response to isoxaben treatment.
Changes in microtubule arrays before (A) and after treatment with 40 μM isoxaben for 16 hr (B). (C) Histogram showing increase in nematic tensor values after isoxaben treatment. Error bars represent standard error, asterisk shows significance (Mann–Whitney U test; p<0.0001). Scale bars 20 μm.
Figure 5
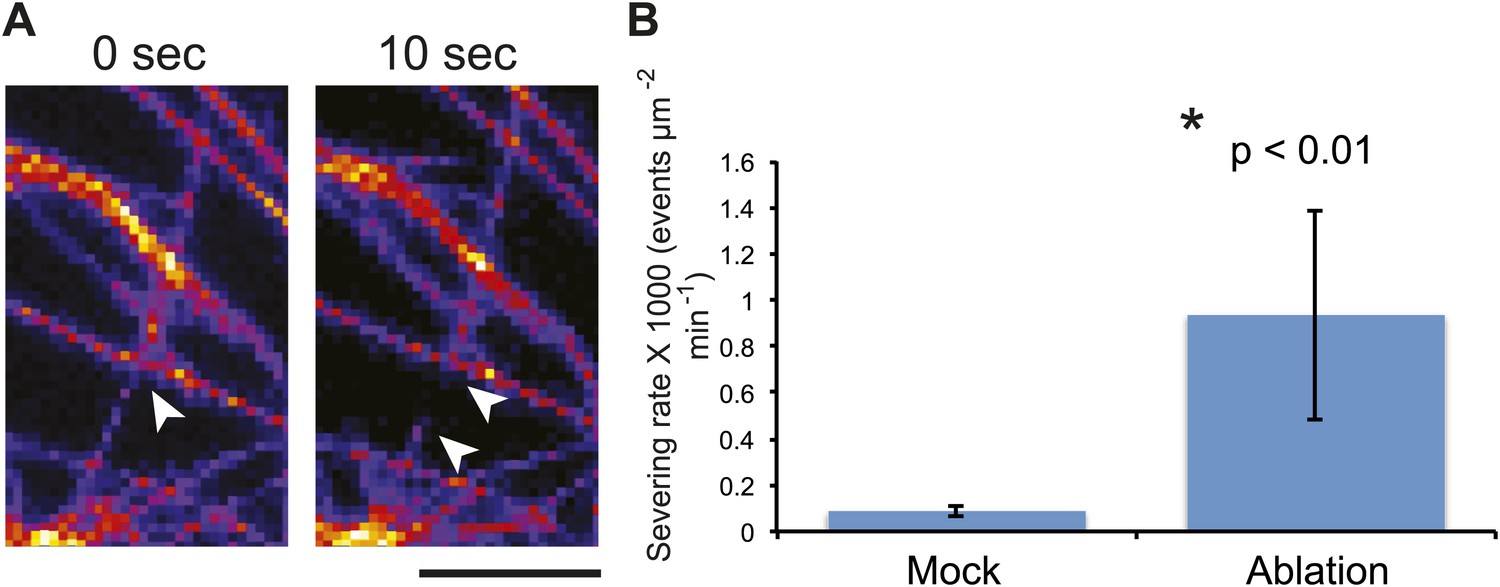
Mechanical perturbations increase bundling by promoting severing.
3D surface plot of YFP microtubule time series images representing a typical microtubule severing event (A), arrowheads indicate microtubule-severing at a crossover sites. Scale bar 5 μm. (B) Histogram representing microtubule severing rates of mock treated seedlings and in seedling of cells adjacent to site of ablation after 4 hours. Error bars represent standard deviation. Asterisk shows significance. (Student’s t test). N = 16 cells, 4 seedlings, total area of 2.99 × 10 μm for mock and N = 16 cells, 4 seedlings, total area of 1.5 × 10 μm for ablation.
Figure 6
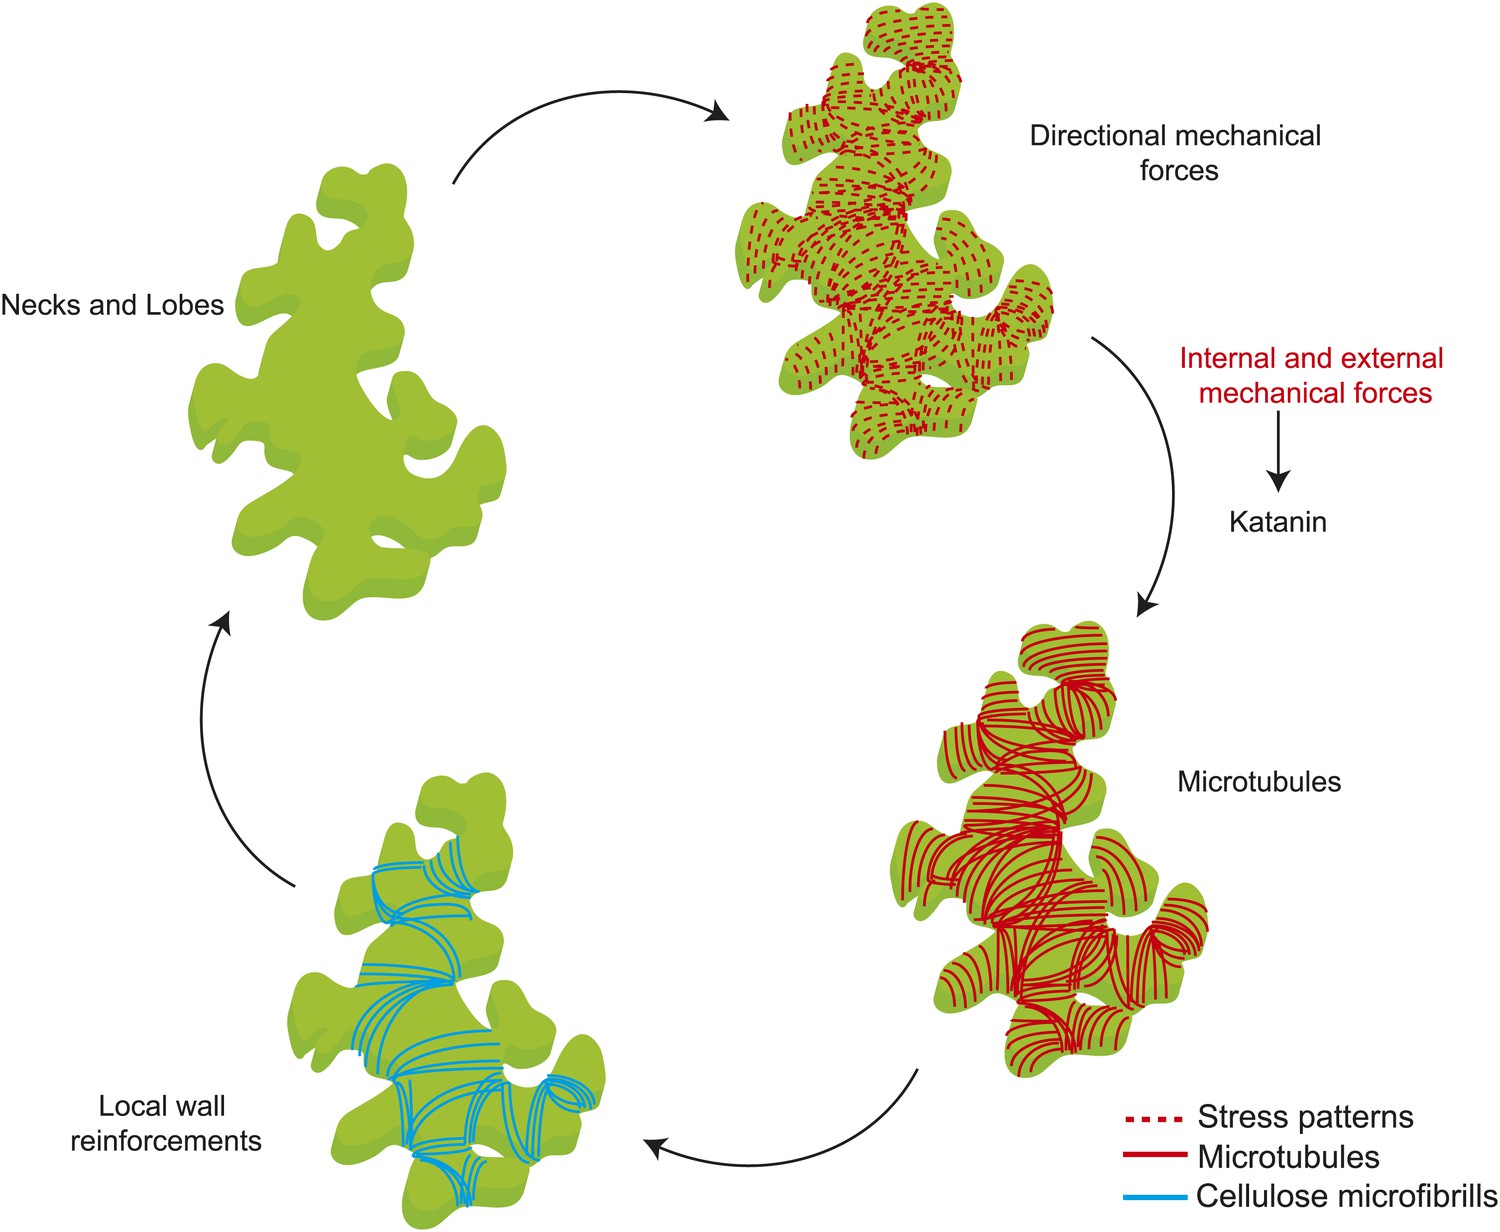
Mechanical forces regulate pavement cell shape by controlling microtubule organization and cellulose deposition.
https://doi.org/10.7554/eLife.01967.025
Author response image 1

Simulation of pressurized doubly curved, saddle-like shape.
The color map shows the value of the second principal stress. Blue-low, red-high, black-values below zero. The region in the valley close to the boundary is under compression, which transforms to tension at the top as the curvature changes. This demonstrates the complex stress pattern depending on the geometry, loading and boundary conditions.
Author response image 2

Simulation of single pressurized pavement cell shape.
A and D. 3D cell with epidermal, bottom and anticlinal wall. B and E. The cell model with bottom wall removed and replaced with boundary conditions at the bottom of anticlinal walls. C and F surface model of epidermal wall only with anticlinal walls replaced by boundary condition. A to C. The color map shows the value of the second principal stresses. Blue to red mark positive values (tension). The black represents negative values (compression). D to F. The color map shows (blue to red) shows the value of the first principal stresses. No compression is observed.
Author response image 3
Simulation of ablation with 3D anticlinal walls included. The color map shows the value of first (A, C) and second (B, D) principal stresses (blue-low, red-high) before (A, B) and after (C, D) ablation. Red and yellow arrows (red: first principal stress, yellow: second principal stress). We observe circumferential rearrangement of main principal (tensile) stress around the ablation in the epidermal wall with some compressive (black in color scale) second principal stress in anticlinal walls.
Author response image 4
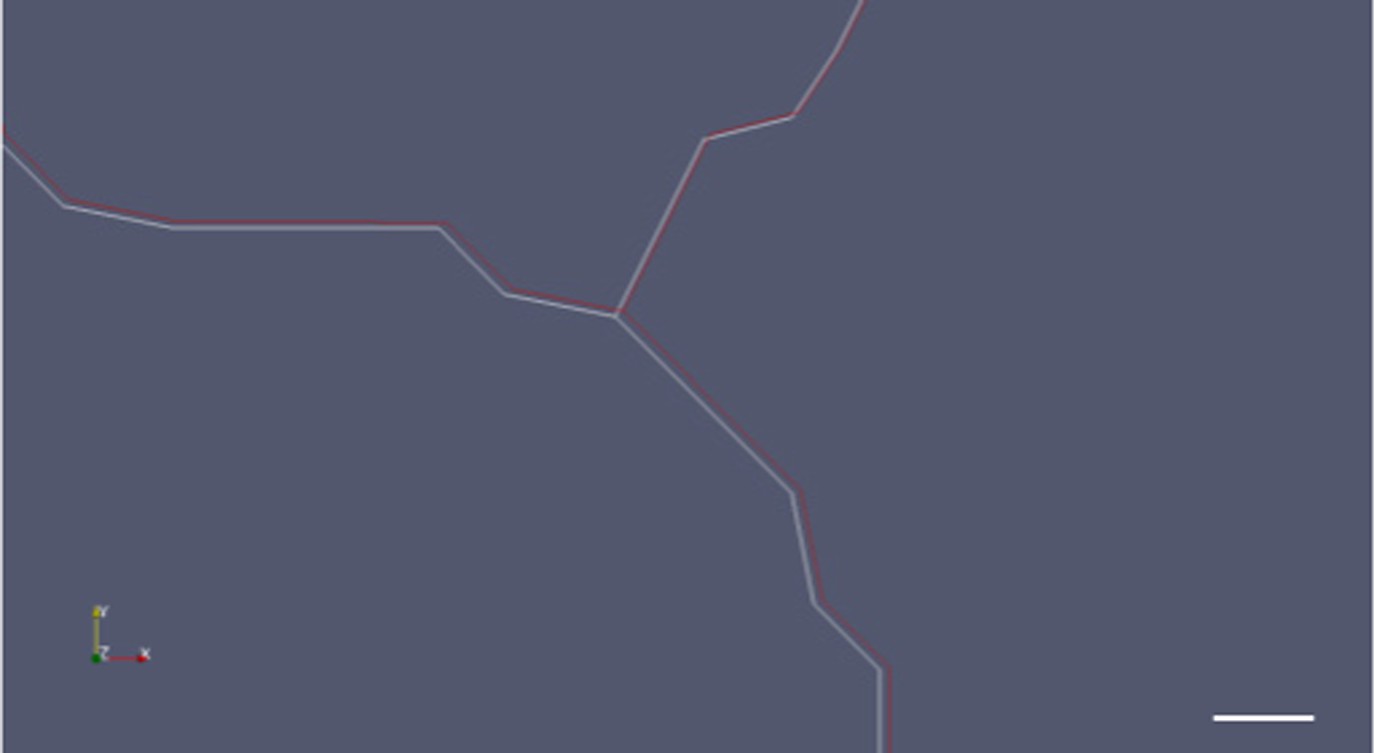
Close up of a merged image of cell boundary movement before (white) and after (red) ablation.
Scale bar 1 micrometer.
Author response image 5
Simulation showing less pronounced circumferential rearrangements of stresses (white lines indicate maximal tensile stress directions) after ablation of a single cell (grey cell). (A) Before ablation (B) After ablation.
Author response image 6
Images of microtubule reporter line before (A) and 7h after (B) ablation of single cell, showing aligned microtubule arrays not completely circumferential after ablation of single cell. Scale bars 50 μm. E Magnified images of cells in figure C (Images not to scale). Asterisk shows the location of the ablated cell.
Author response image 7
Close up image of microtubule arrays in guard cell before and after large-scale ablation.
Majority of the guard cells retain the transverse pattern of microtubule arrays after laceration.
Author response image 8
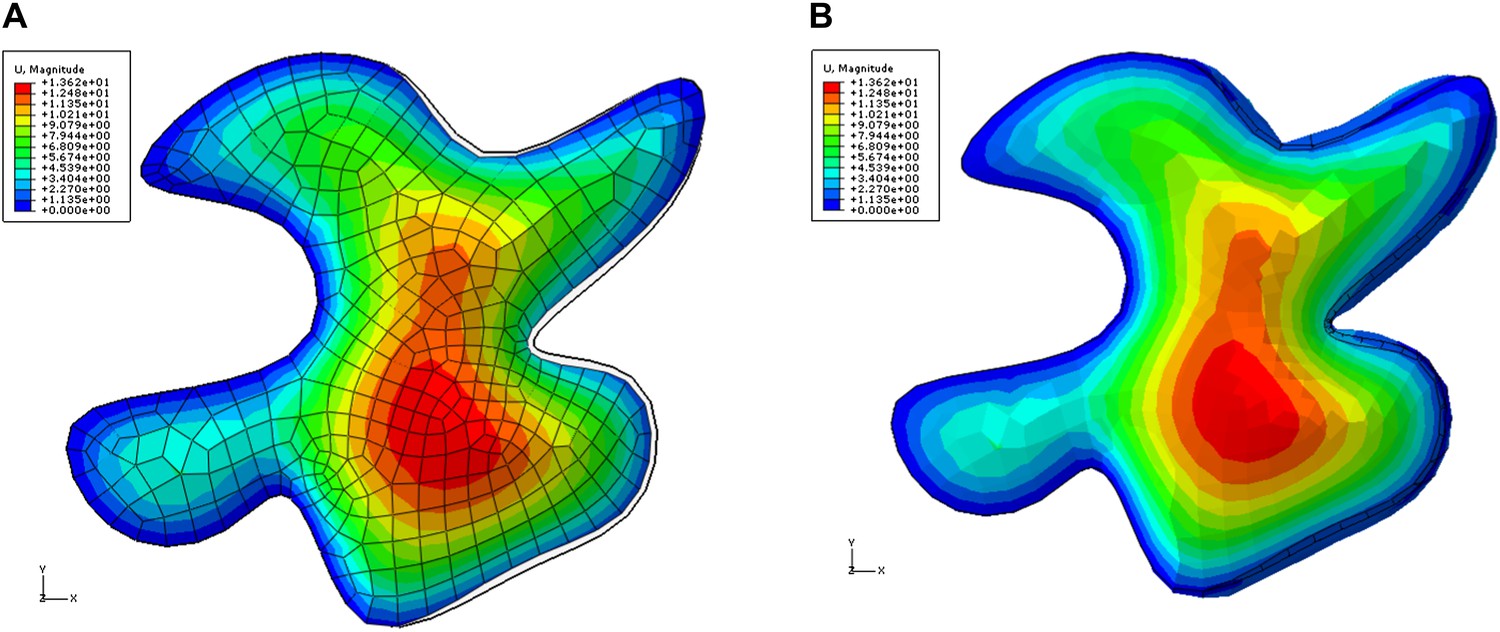
Color map shows total displacement (including z coordinate) in a single pressurized 3D pavement cell model.
The left edges of the cell were fixed, simulating attachment to unaltered tissue. The right side of the cell is next to ablated region. The tips of the lobes in ablation neighborhood show low values of displacements (blue). The displacement of the necks is larger . The black outline shows initial position of the edges. A) Deformation of the epidermal wall alone. B) Deformation including anticlinal walls.
Videos
Video 1
Depth color-coded time series images showing changes in microtubule organization following compression.
Scale bar 20 µm.
Video 2
Laceration of cotyledon shows outward displacement of cut edges.
Scale bar 500 µm.
Video 3
Video of computational simulation showing circumferential distribution of stress and increase in MT anisotropy after ablation.
https://doi.org/10.7554/eLife.01967.018
Video 4
Depth color-coded time series images showing microtubule arrays in botero 1-7 does not induce hyper-alignment of microtubule arrays after compression.
Scale bar 50 µm.
Video 5
Video showing severing of microtubule immediately after and 4 hr post ablation of cells. Red dots mark sites of microtubule severing.
Scale bar 25 µm.
Additional files
-
Supplementary file 1
Additional information about computational models.
- https://doi.org/10.7554/eLife.01967.026
Download links
A two-part list of links to download the article, or parts of the article, in various formats.
Downloads (link to download the article as PDF)
Open citations (links to open the citations from this article in various online reference manager services)
Cite this article (links to download the citations from this article in formats compatible with various reference manager tools)
Subcellular and supracellular mechanical stress prescribes cytoskeleton behavior in Arabidopsis cotyledon pavement cells
eLife 3:e01967.
https://doi.org/10.7554/eLife.01967


