Mof-associated complexes have overlapping and unique roles in regulating pluripotency in embryonic stem cells and during differentiation
- Institut de Génétique et de Biologie Moléculaire et Cellulaire (IGBMC), CNRS UMR 7104 - Inserm U 964, Université de Strasbourg, France
Figures
Figure 1
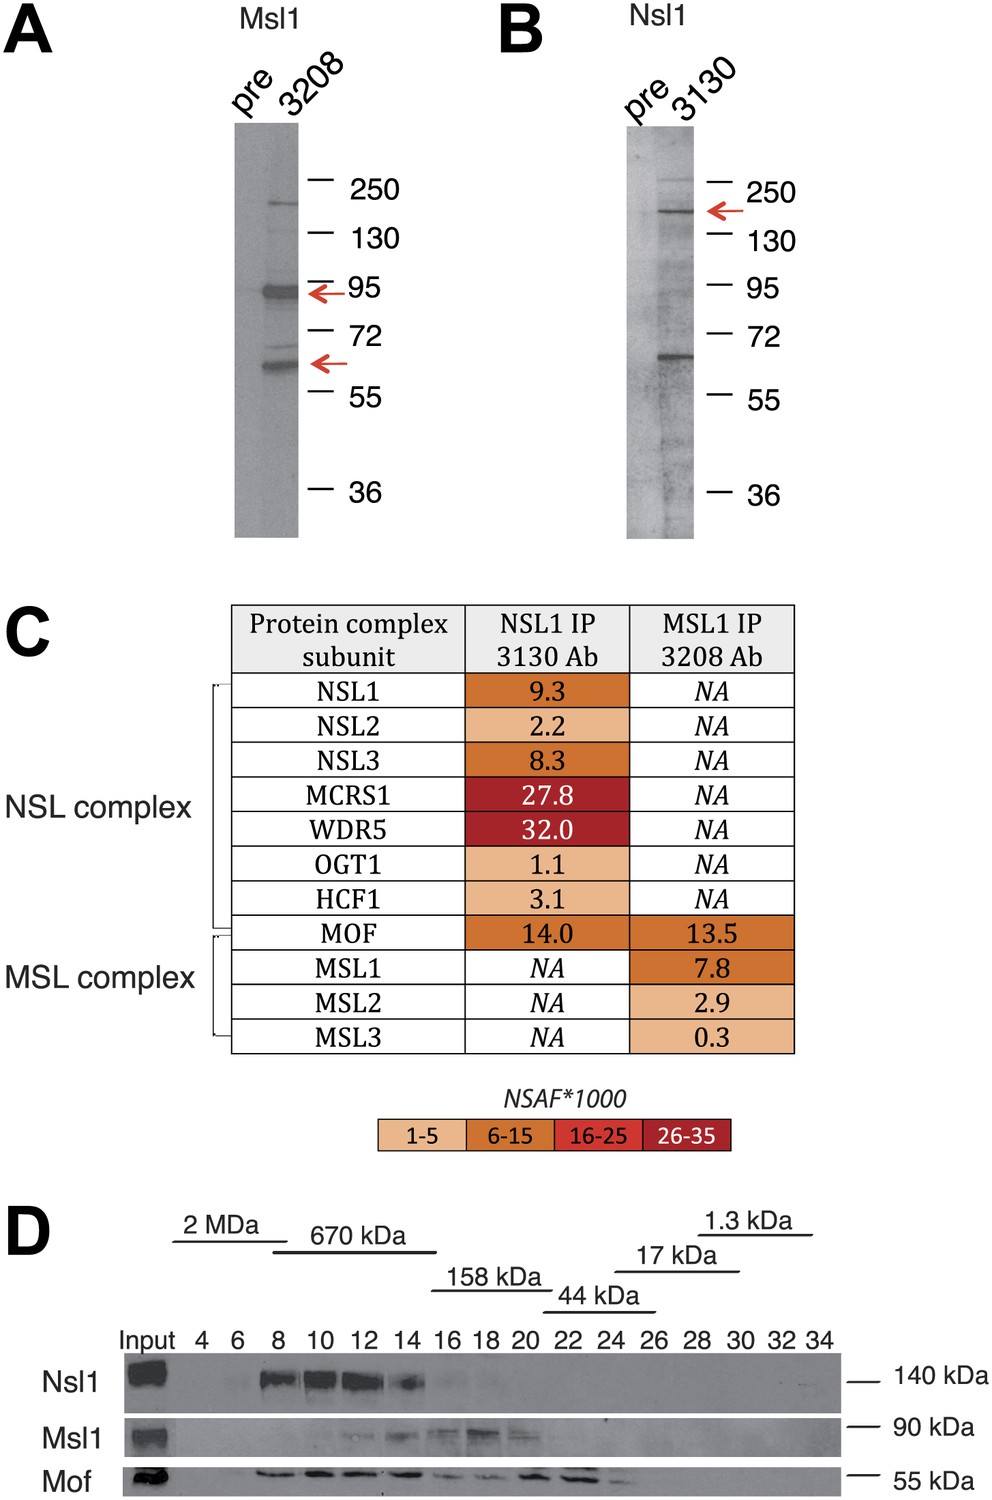
Msl1 and Nsl1 incorporate into endogenous complexes in mESCs.
(A and B) Western Blot analysis using the raised anti-Msl1 (3208) or anti-Nsl1 (3130) antibodies on nuclear extracts. Preimmune sera (pre) were used as negative controls. (C) Anti-Msl1 (3208) or anti-Nsl1 (3130) antibodies were used to immunoprecipitate protein complexes from mESC nuclear extracts. The IP-ed complexes were then analysed by multidimensional protein identification technology (MudPIT). The identified MSL- or NSL-containing complex proteins and their relative protein abundance in the samples are represented by normalized spectral abundance factor (NSAF) (Zybailov et al., 2006). NSAF allows the comparison of abundance of individual proteins in multiple independent samples and in multiprotein complexes (Florens et al., 2006; Paoletti et al., 2006). The colour intensity reflects of the NSAF values multiplied by 1000 (as indicated). (D) Gel filtration of mESC nuclear extracts. Every second fraction eluted from a Superose 6 column was analysed for the presence of Nsl1, Msl1, and Mof by Western Blot. Molecular weight markers for the corresponding fractions are indicated on the top of the panel.
-
Figure 1—source data 1
List of identified proteins of MudPIT analyses.
SAF and NSAF values of all significantly enriched proteins in the Msl1 3208 or Nsl1 3130 IP in NE of mESCs.
- https://doi.org/10.7554/eLife.02104.004
Figure 2 with 2 supplements
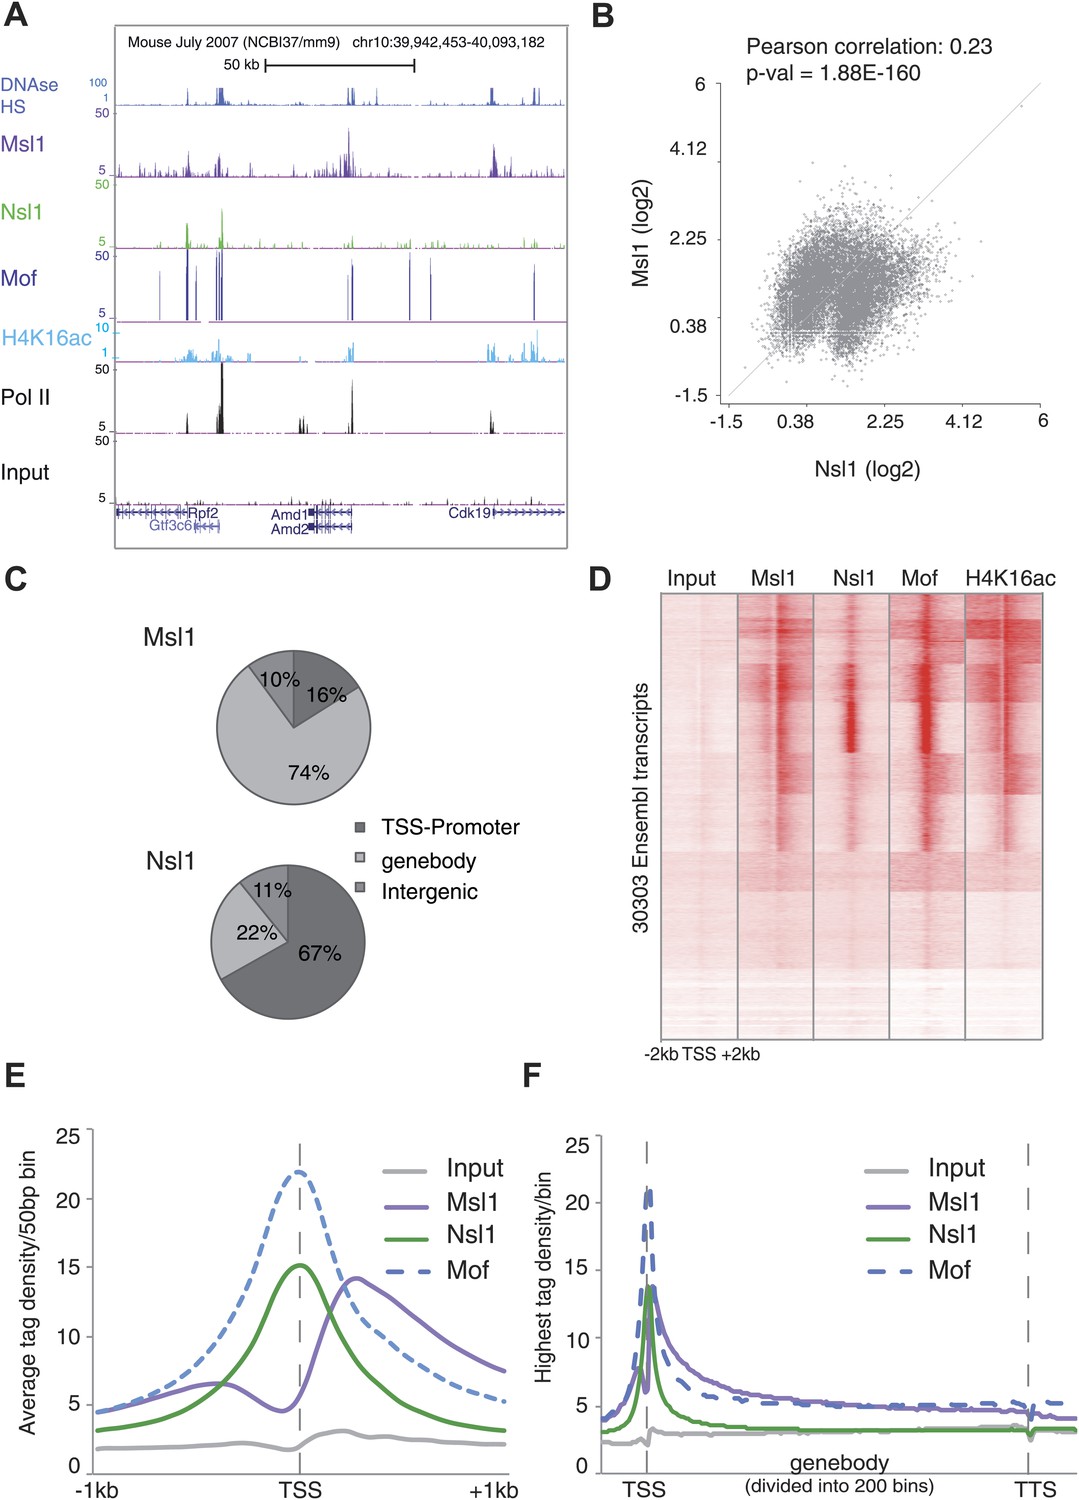
Distinct binding profiles of Msl1 and Nsl1 at active genes.
(A) UCSC genome browser tracks representing Msl1, Nsl1, H4K16ac, Mof and Pol II ChIP-seq data. The Input serves as control. (B) Scatter Plot showing the Pearson correlation between Msl1 and Nsl1 densities at all identified MACS14 peak regions. Densities were normalized to the control (Input) and represented as log2 values. (C) Mapping of Msl1 and Nsl1 identified MACS14 peaks to different genomic regions (promoter-TSS, genebody [GB] or intergenic regions) using HOMER (Heinz et al., 2010). Identified peaks are listed in Figure 2—figure supplement 1A and Figure 2—source data 1. Validation of identified peaks is shown in Figure 2—figure supplement 1B,C. (D) Heatmap showing k-means clustering of Msl1, Nsl1, Mof and H4K16ac using the TSSs of all ENSEMBL transcript IDs as reference coordinates. Densities are presented ±2 kb around reference coordinates. Input serves as negative control. (E and F) Average binding profiles of Msl1, Nsl1 and Mof (E) at a region of +1 kb around the annotated TSSs and (F) 1 kb upstream of the TSS, in the GB and 1 kb downstream of the TTS. Only Nsl1 or Msl1 positive genes were taken into consideration. The Input serves as control and tag densities were normalized to the input. See Figure 2—figure supplement 2 for validation of ChIP-seq data.
-
Figure 2—source data 1
List of Msl1 and Nsl1 MACS14 peaks.
- https://doi.org/10.7554/eLife.02104.006
-
Figure 2—source data 2
List of Msl1 and Nsl1 positive genes.
- https://doi.org/10.7554/eLife.02104.007
Figure 2—figure supplement 1
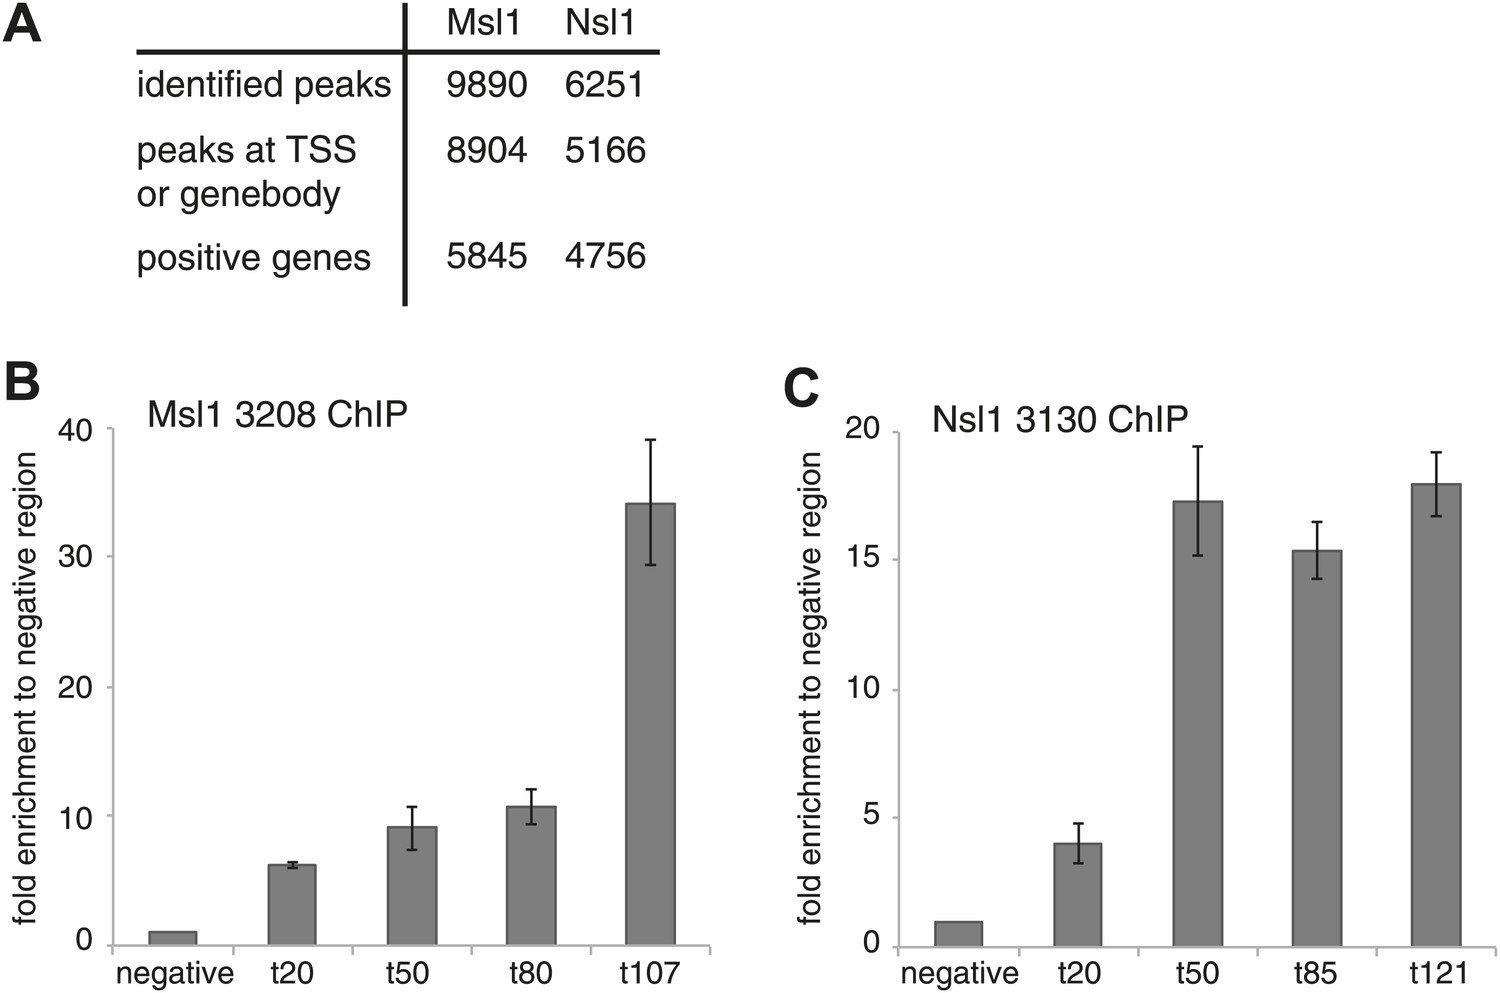
Identification and validation of Msl1 and Nsl1 binding sites.
(A) Identified binding sites of Msl1 and Nsl1 using MACS14 (p-value<10−5) (Zhang et al., 2008), their presence at the promoter (TSS) or genebody (GB) of ENSEMBL transcript IDs and the total number of positive ENSEMBL genes. The annotation was conducted with HOMER (Heinz et al., 2010). (B and C) ChIP-qPCR in mESCs using the anti-Msl1 (3208) or anti-Nsl1 (3130) antibodies as indicated. Primers were designed at randomly selected MACS14 peaks with increasing tag densities (t).
Figure 2—figure supplement 2
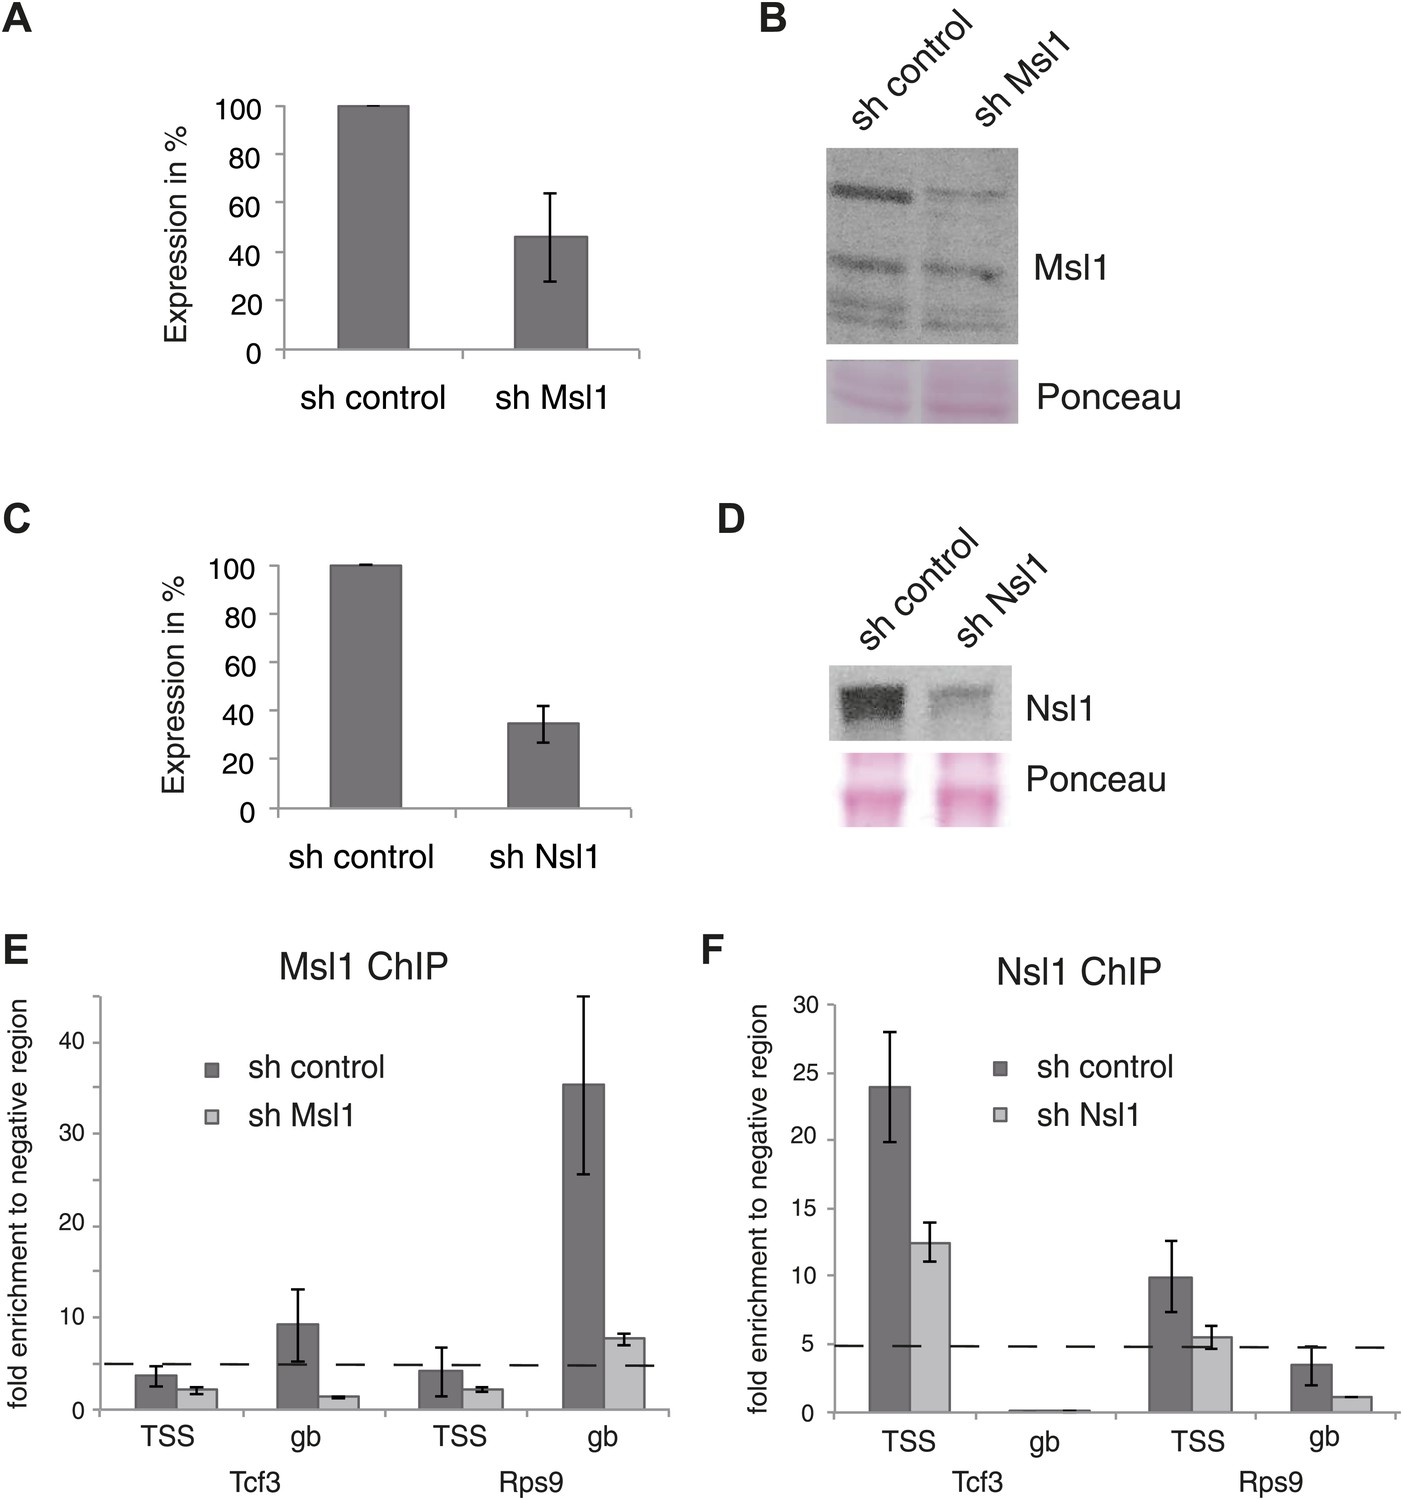
Knockdown (KD) of Msl1 or Nsl1 through lentiviral shRNA vectors.
(A and C) ESCs were treated with sh control, sh Msl1 or sh Nsl1 expressing lentiviral vectors, 5 days after lentiviral infection total RNA was isolated and RT-qPCR was carried out. Samples were normalized to actin and the sh control was set to 100%. Error bars represent standard deviation of three independent experiments. (B and D) Validation of the Msl1 or Nsl1 downregulation in sh control or shRNA conditions by Western Blot. 20 μg of proteins were loaded per lane and normalized by ponceau staining. (E and F) anti-Msl1 (E) or anti-Nsl1 (F) ChIP was carried out on sh control (E) or sh Nsl1 (F) KD-treated cells. The results of ChIP-qPCR amplifications at selected genes (TSS or genebody [gb] regions) are shown. Fold enrichment higher than five is defined as binding.
Figure 3
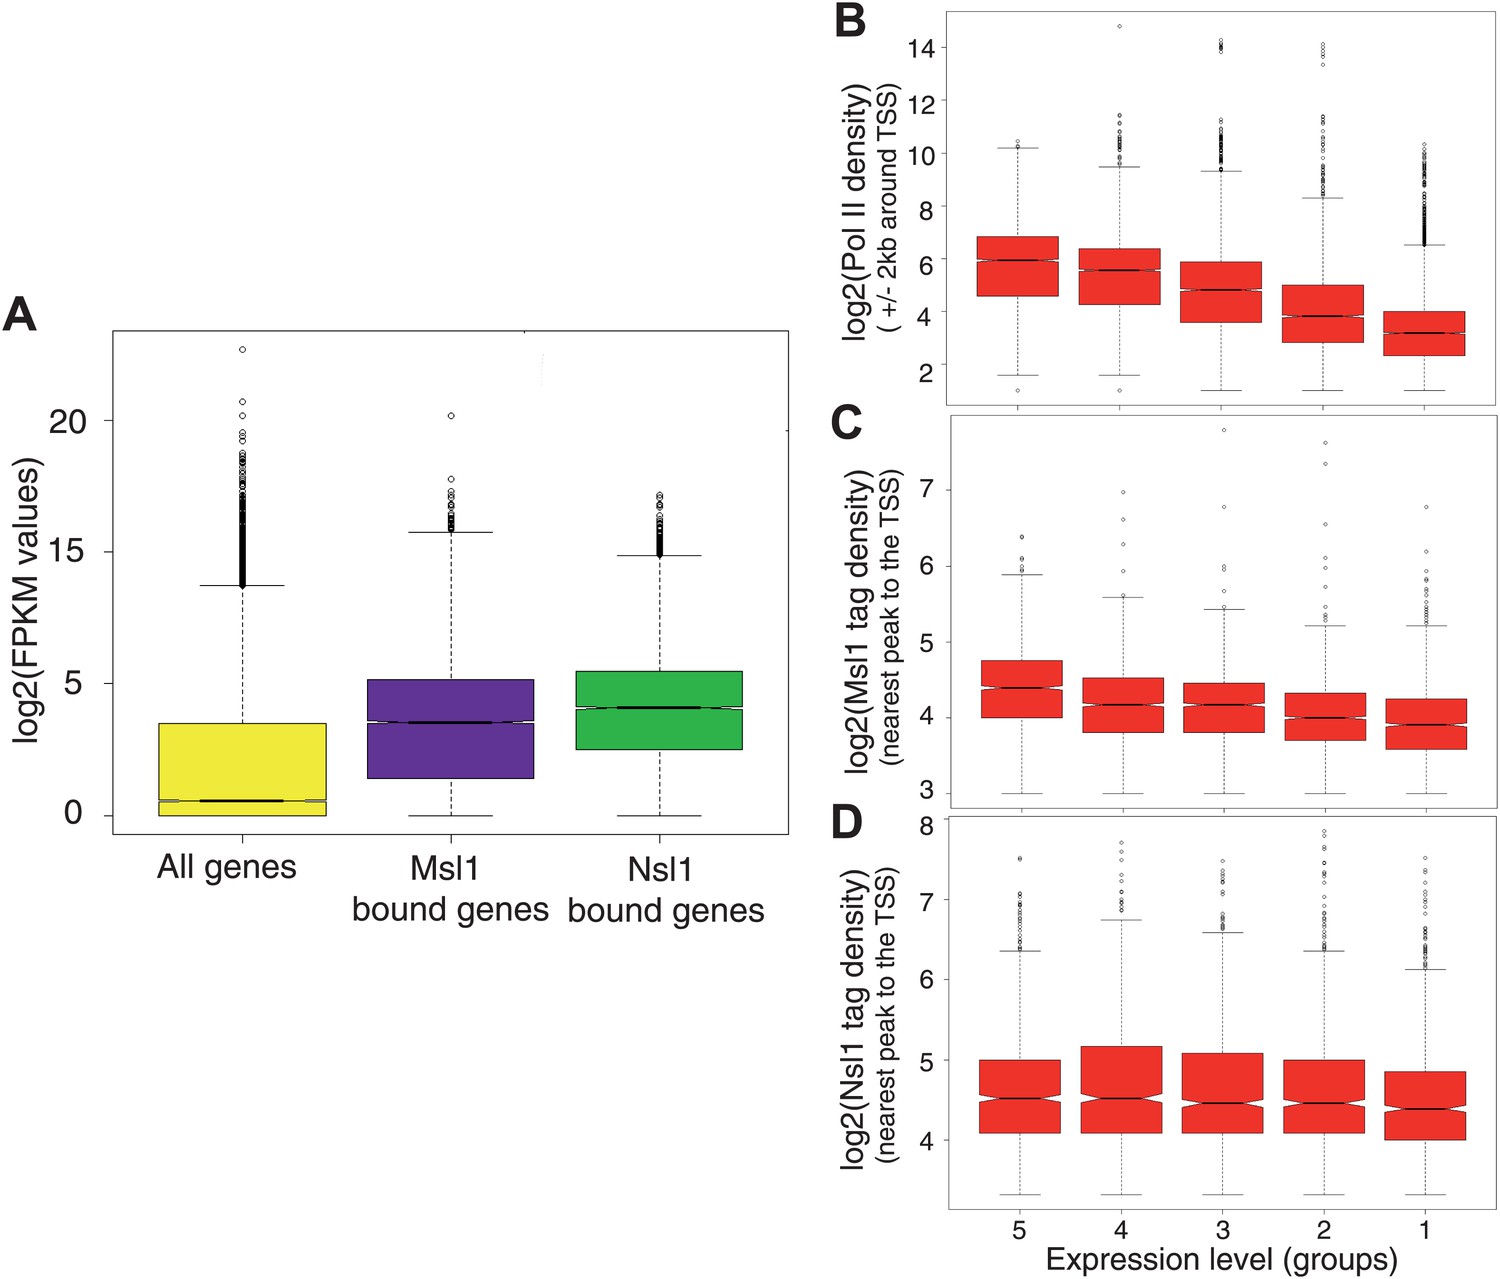
Msl1 and Nsl1 bind to active genes, but participate differentially to gene expression.
(A) Boxplots showing the log2 of RNA FPKM expression values from mESCs of all analysed, Msl1-, or Nsl1-bound ENSEMBL genes. (B, C and D) RNA expression values are ranked into five groups, where group 5 represents the highest RNA expression level and group 1 the lowest (see bottom of panels B–D). Boxplots show the tag density of the nearest peak to the TSS for (B) Pol II, (C) Msl1 and (D) Nsl1 tag densities around the TSSs at the five groups. Only density values higher than zero were taken into consideration. The median is different between groups, if the notches of the boxplots do not overlap.
Figure 4
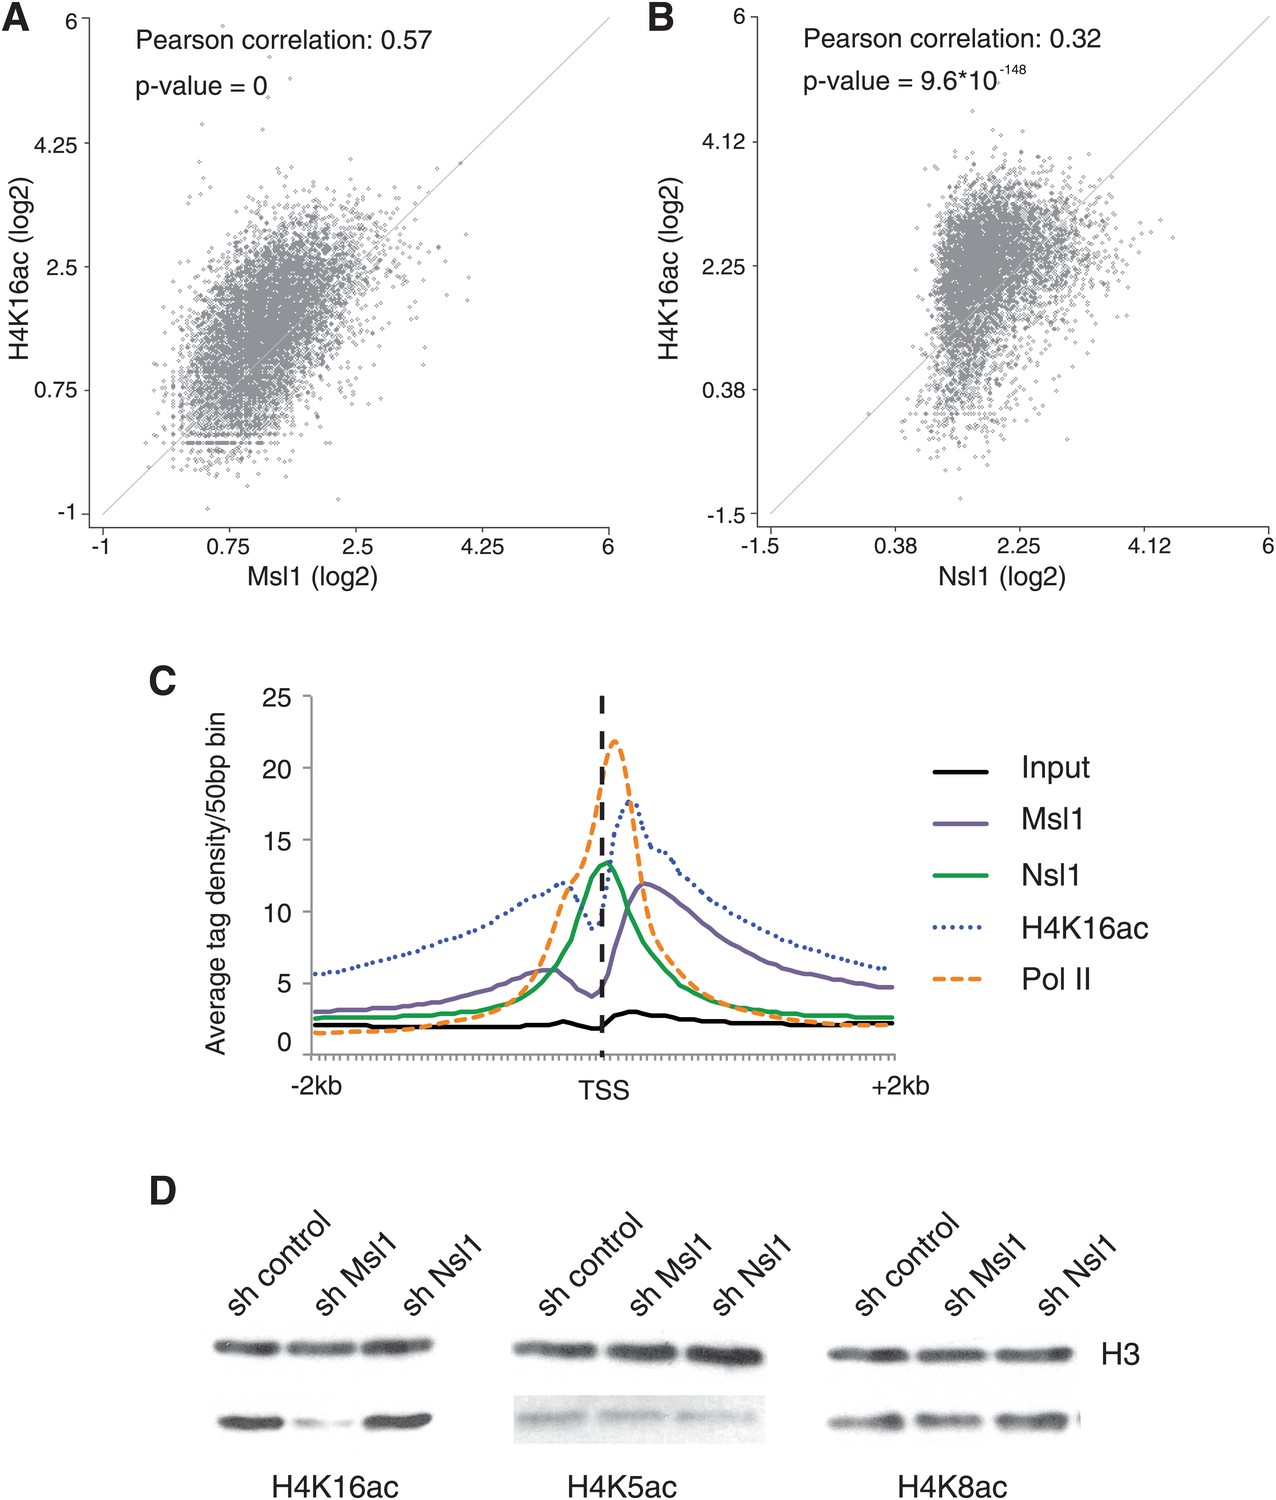
MSL affects H4K16 acetylation in mESCs.
(A and B) Scatter Plots indicating the Pearson correlation and Pearson p-values between H4K16ac and Msl1 (A) or Nsl1 (B) densities at Msl1 peaks or Nsl1 peaks. Log2 represented tag densities were calculated at peak regions and normalized to the control (Input) data set. (C) Average binding profiles of Msl1, Nsl1, Pol II and H4K16ac at a region of +2 kb around all ENSEMBL promoters. Only Nsl1 and Msl1 positive genes are taken into consideration. The input serves as control and tag densities are normalized to the input. (D) mESCs were treated for 5 days with lentiviral vectors expressing sh control, sh Msl1, or sh Nsl1 interfering RNAs. Total histones were isolated by acidic extraction and H4K16ac, H4K5ac, and H4K8ac levels were analysed by western blot. Histones were normalized using an antibody against non-modified histone 3 (H3). KD efficiencies were tested in Figure 2—figure supplement 2A–D.
Figure 5 with 2 supplements
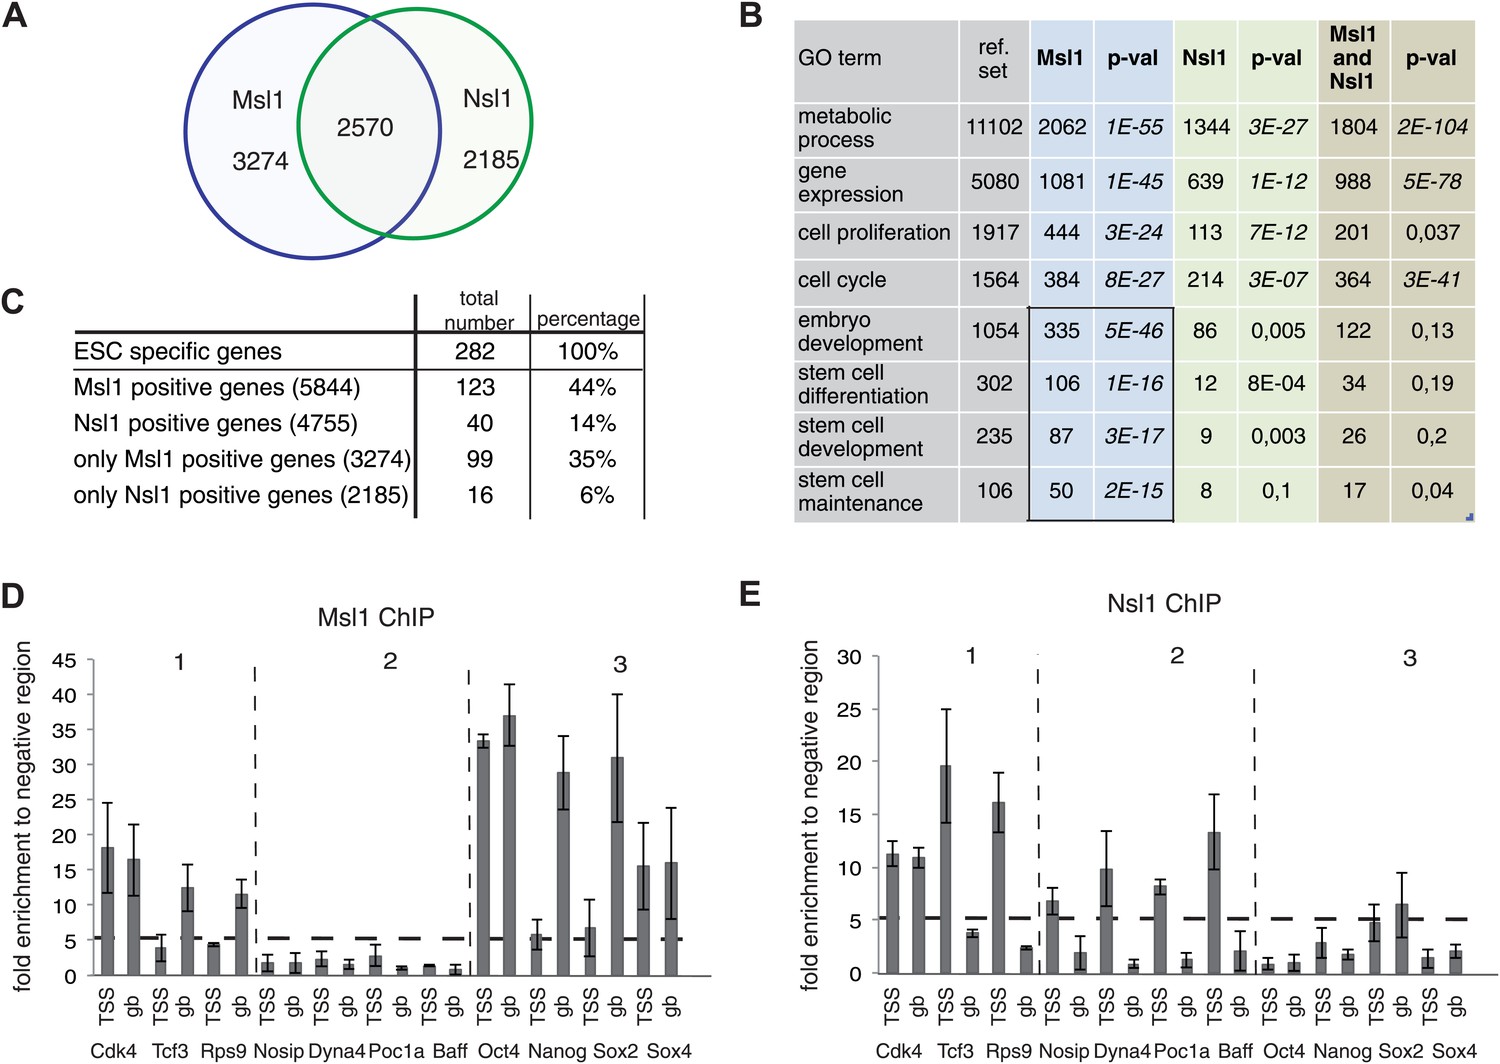
MSL and NSL bind to shared and specific gene sets.
(A) Venn Diagram showing the overlap between Msl1 and Nsl1 binding sites at ENSEMBL genes. For statistical analyses see Figure 5—figure supplement 1A–C. Binding at TSSs and gene bodies was considered together. Genes are listed in Figure 2—source data 2. (B) Gene ontology analysis using Manteia (Tassy and Pourquie, 2013) of only Msl1 binding sites, only Nsl1 binding sites, or common binding sites. Significant GO terms for only Msl1 binding sites are highlighted by a box. (C) Differentially expressed genes were identified with the DEseq analysis (Anders and Huber, 2010). The table represents genes expressed only in mESCs (when compared to NPCs). The overlap with all Msl1 positive, all Nsl1 positive or only complex specific genes was calculated. Statistical analyses in Figure 5—figure supplement 2A–D indicates significant enrichment of Msl1 at mESC-specific genes. (D and E) Bound genes were divided into three categories: Common (category 1), specific for Nsl1 (category 2) and specific for Msl1 (category 3). From these categories genes were chosen for ChIP-qPCR using the anti-Msl1 (D) or anti-Nsl1 (E) antibodies. Fold enrichment higher than five was defined as specific binding and Msl1 and Nsl1 presence was analysed at the indicated genes in each category. Bar charts represent the mean and standard deviation of 2–3 independent experiments.
Figure 5—figure supplement 1
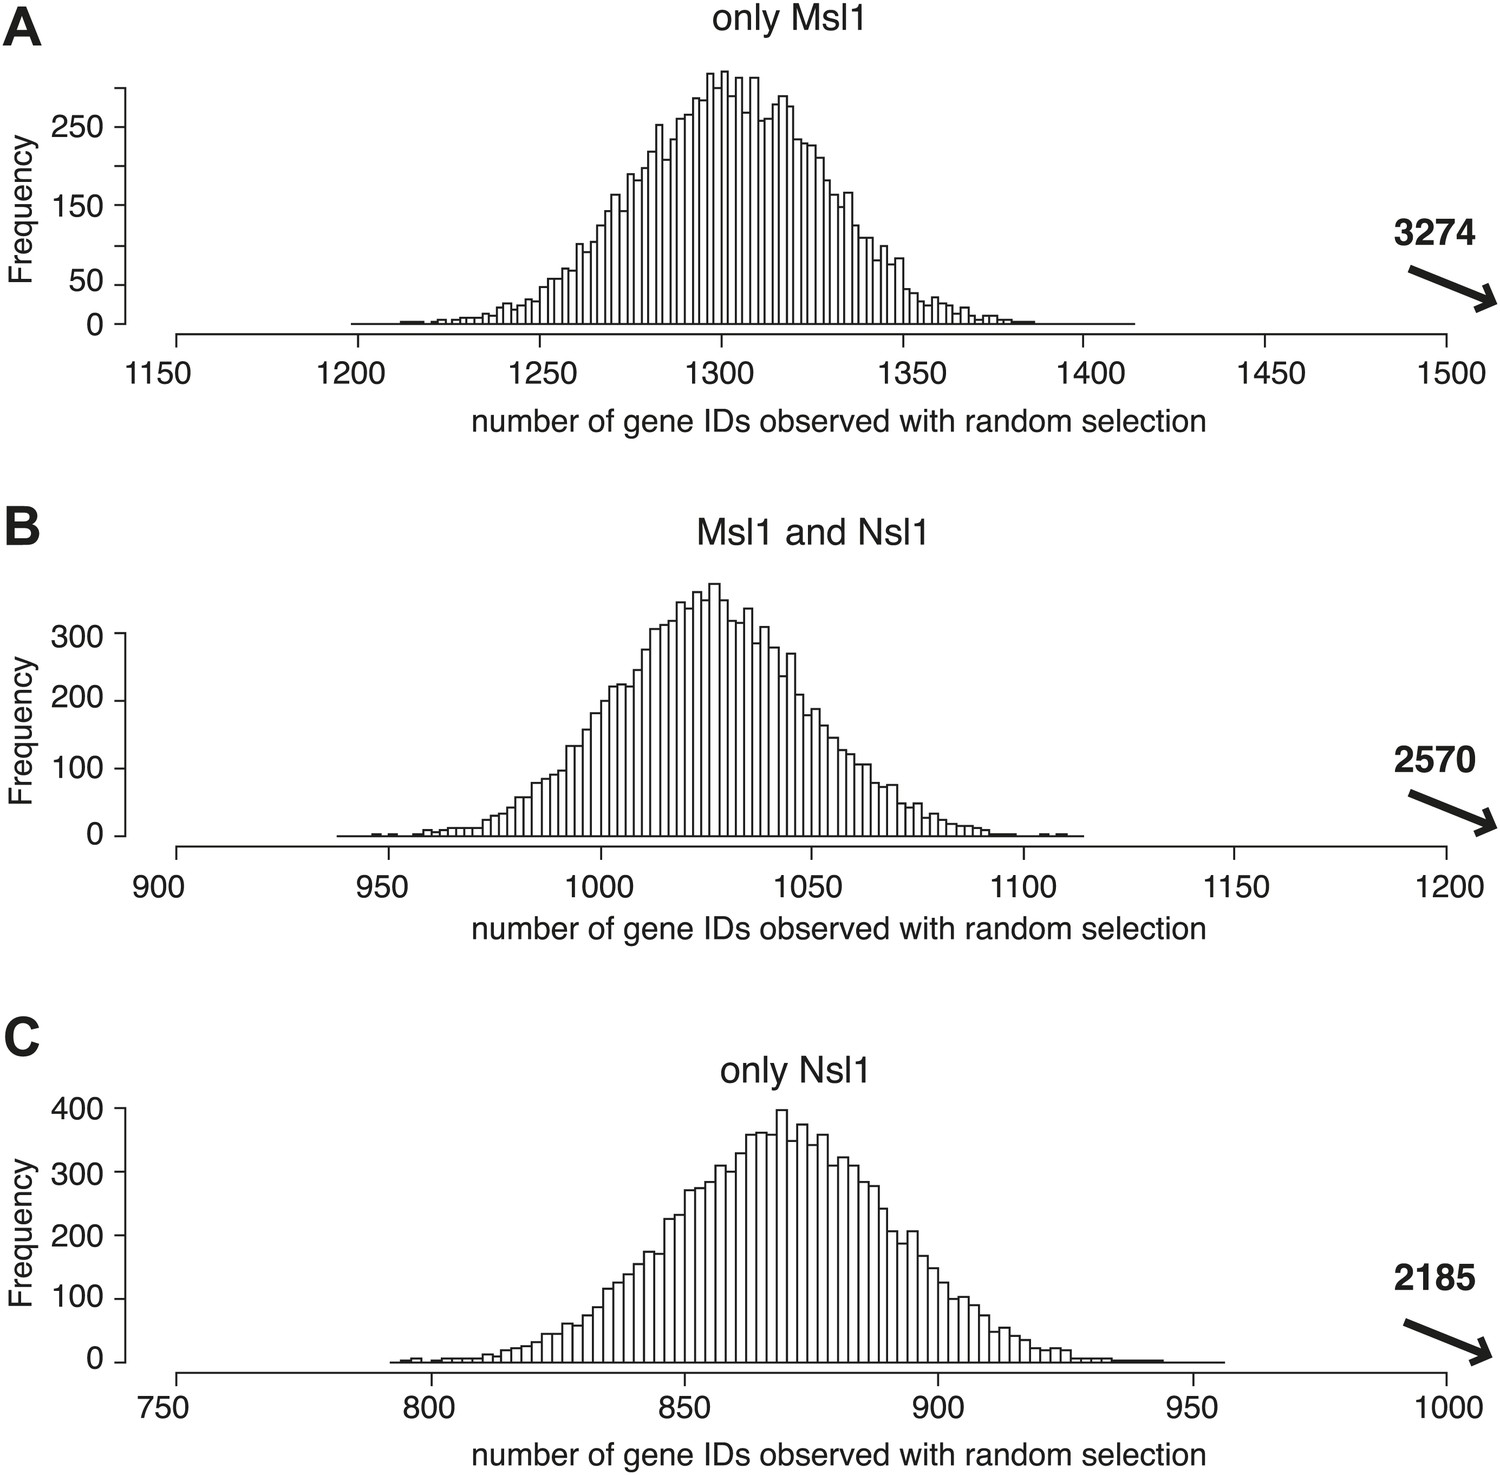
MSL and NSL significantly bind to shared and specific gene sets.
(A–C) Bootstrap statistical analyses (‘Materials and methods’) were carried out with a random selection of 10,600 genes (IDs) out of a total pool of 26,460 ENSEMBL IDs. Histograms represent the average numbers of observed IDs in the three random sets. The average numbers and SDs are: only Msl1 1303 ± 27 (A), Msl1 and Nsl1 1027 ± 23 (B) and for only Nsl1 870 ± 22 (C). These averages are significantly far from the experimentally determined numbers (p-value<1.0e−90) shown with an arrow in bold. The z-cores are 75 (only Msl1), 66 (Msl1 and Nsl1) and 60 (Nsl1).
Figure 5—figure supplement 2

MSL, but not NSL locates to mESC-specific genes.
(A–D) Bootstrap statistical analyses (‘Materials and methods’) were carried out with a random selection of 282 genes (IDs) out of a total pool of 26,460 ENSEMBL IDs. Histograms represent the average numbers of observed IDs in the four random sets. The average numbers and SDs are: 62 ± 7 (all MSL) (A), 35 ± 6 (only MSL) (B), 51 ± 7 (all NSL) (C) and 23 ± 5 (only NSL) (D). The averages obtained by random selection are significantly far from those obtained experimentally (shown with an arrow in bold) for MSL (A and B): p-value=3.27e−18 (all MSL) and 1.11e−31 (only MSL). However, the averages are not significantly different (shown with an arrow in bold) for NSL (C and D): p-value=0.107 (all NSL) and p-value=0.1177 (only NSL).
Figure 6 with 1 supplement

NSL influences cell growth and cell cycle of mESCs.
(A) Cell proliferation analyses by cell counting over 6 days of control, or indicated KD mESCs. Error bars represent the standard deviation of three independent experiments. See Figure 6—figure supplement 1A for validation of KD efficiency of sh Msl1/Nsl1 double KD mESCs. (B) Morphology of control and Msl1 and Nsl1 single or double KD mESCs at 6 days after lentiviral infection using a reverse-phase microscope with a 10x magnification. (C) Cell cycle analyses of control and KD mESCs by propidium iodide staining followed by FACS analyses. Cell numbers of G1-, S- or G2-phases are represented in percentages after analyses with CellQuest Pro software. See Figure 6—figure supplement 1B for apoptosis analysis.
Figure 6—figure supplement 1
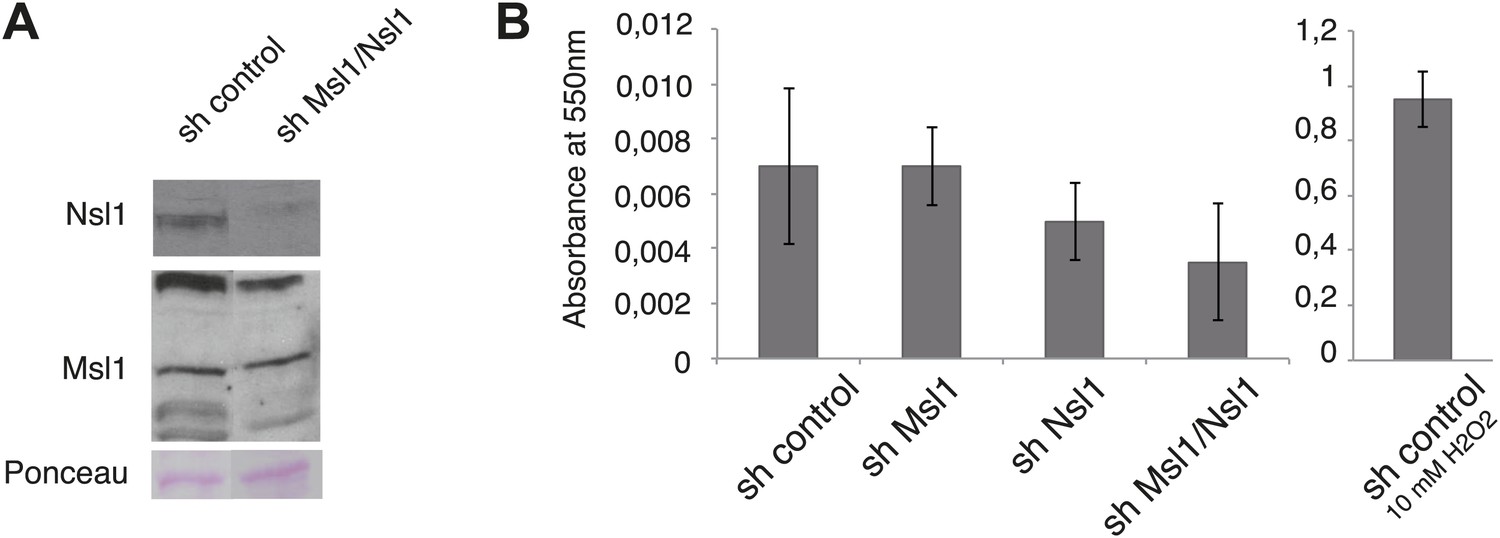
shMsl1, shNsl1 and double KD mESCs do not undergo apoptosis.
(A) mESCs were treated with sh control or a mix of sh Msl1 and sh Nsl1 (sh Msl1/Nsl1) expressing lentiviral vectors. 5 days after lentiviral infection Msl1 and Nsl1 downregulation in sh control or sh Msl1/Nsl1 mESCs was tested by Western Blot. 20 μg of proteins were loaded per lane and normalized by ponceau staining and the blots were revealed with the indicated antibodies. (B) Cell death analyses of sh control, sh Msl1, sh Nsl1 and sh Ms1/Nsl1 mESCs 6 days after lentiviral infection. Sh control mESCs treated with 10 mM of H2O2 were used as positive control. Phosphatidylserine appearance at the outer cell membrane of apoptotic cells was analysed by colorimetric measurement at 550 nm using the APOpercentage assay.
Figure 7 with 2 supplements

Analysis of Msl1 and Nsl1 regulated genes in mESCs.
(A and B) Venn Diagram of Msl1 (A) or Nsl1 (B) MACS14 binding sites at ENSEMBL genes and down- or upregulated genes in Msl1 or Nsl1 KD cells. Down- and upregulated genes are listed in Figure 7—source data 1. For validation of KD efficiencies see Figure 2—figure supplement 2A–D. (C and D) RT-qPCR validation of down- and up-regulated genes in sh Msl1 (C) or sh Nsl1 (D) mESCs. (E) GO analyses using Manteia (Tassy and Pourquie, 2013) of all downregulated genes in Msl1 KD, Nsl1 KD and Mof KO mESCs. See Figure 7—figure supplement 1 for further GO analyses. (F) Gene expression changes in Mof KO vs wild-type mESCs according to Li et al. (2012) of genes involved in stem cell maintenance, represented as fold change.
-
Figure 7—source data 1
Down- and upregulated genes in shMsl1 and shNsl1 mESCs.
- https://doi.org/10.7554/eLife.02104.018
Figure 7—figure supplement 1

Msl1, Nsl1 and Mof regulate mESC-unspecific genes.
(A) GO analysis (Tassy and Pourquie, 2013) of downregulated genes in sh Msl1, sh Nsl1 and Mof KO mESCs. (B) Oct4 expression in cell extracts prepared from sh control, sh Msl1, sh Nsl1 and sh Msl1/Nsl1 mESCs was analysed by Western Blot. Extracts from mouse embryonic fibroblasts (mEFs) were used as negative control. 20 μg of proteins were loaded per lane and normalized by ponceau staining, and the blots were developed with an anti-Oct4 antibody.
Figure 7—figure supplement 2
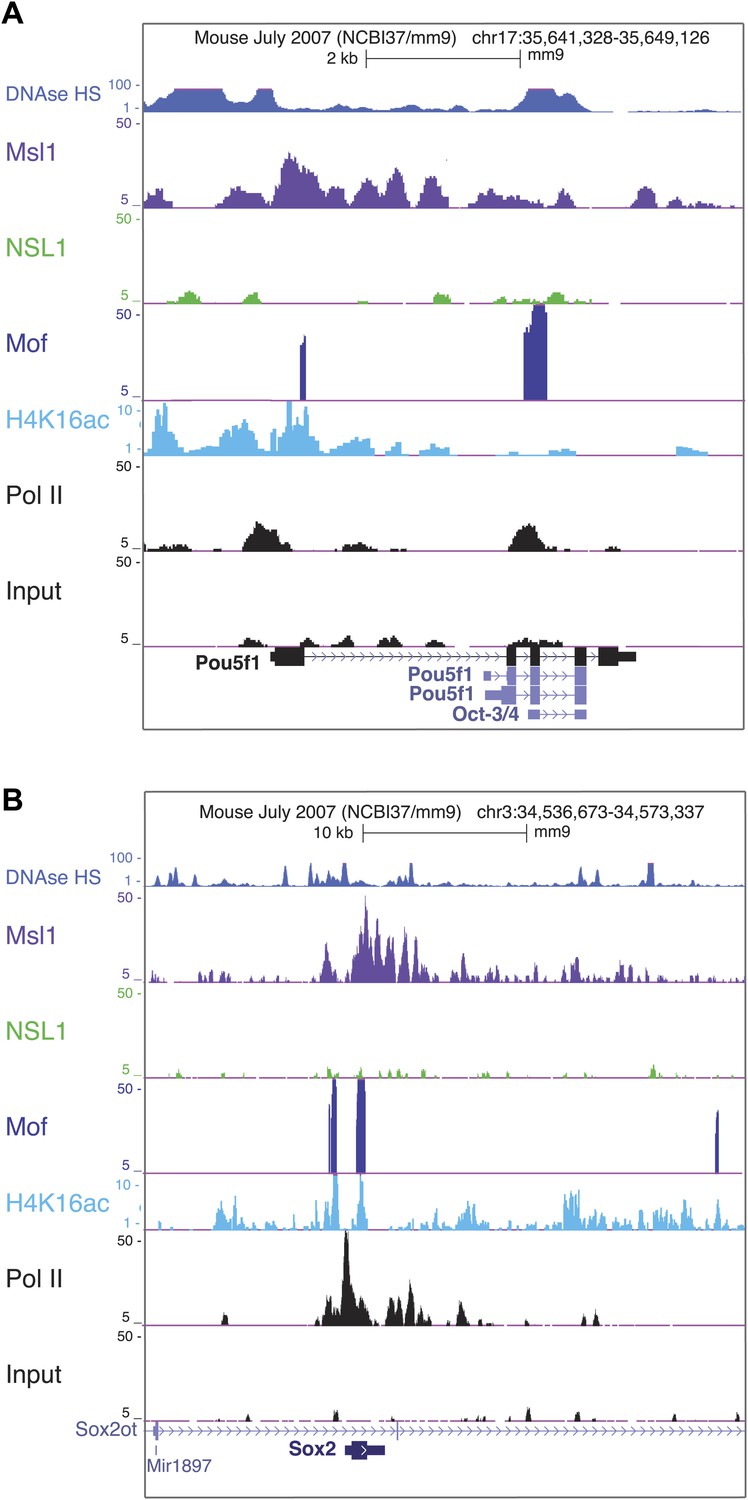
Msl1 and Mof binding at pluripotency genes.
(A and B) Msl1, Nsl1 and Mof binding together with Pol II and H4K16ac profiles at the (A) Pou5f1 (Oct4) and (B) Sox2 locus at the UCSC genome browser. The Input serves as control.
Figure 8 with 1 supplement

MSL regulates mESC differentiation.
(A) Msl1 binding together with Nsl1, H3K4me3, H3K27me3 and Pol II at the Nestin locus in mESCs. For the Hes5 gene locus see Figure 8—figure supplement 1A. (B) Heatmap showing k-means clustering of Msl1, Nsl1, Pol II, H3K4me3, Ezh2 and H3K27me3 using all Msl1 and Nsl1 binding sites as reference coordinates. Densities are presented −/+2 kb around reference coordinates. Based on the density profiles of all data sets, the heatmap is divided into different categories (as indicated). For statistical analyses of Msl1 positive bivalent genes in Cluster C see Figure 8—figure supplement 1B. (C and D) mRNA expression measurements by RT-qPCR of bivalent genes, which are also key markers for NPC differentiation, under sh control (dark grey) and sh Msl1 conditions (light grey) in pluripotent mESCs (C) or in mNPCs (D) NPC formation and KD efficiency of Msl1 in NPCs was validated in Figure 8—figure supplement 1C,D.
Figure 8—figure supplement 1

MSL binds to bivalent genes.
(A) H3K27me3 and Ezh2 profiles together with Nsl1, Msl1, H3K4me3 and Pol II at the bivalent Hes5 gene at the UCSC genome browser. The input serves as negative control. (B) Bootstrap statistical analyses (‘Materials and methods’) were carried out with a random selection of 13,505 genes (IDs) out of a total pool of 26,460 ENSEMBL IDs. The histograms represent the average numbers of observed IDs in the random sets. The average number and SD is: 165 ± 10 using a random selection (p-value=4.48e−66). The experimentally obtained 343 Msl1 positive bivalent genes in Cluster C (indicated by a bold arrow) is significantly far from the average of randomly selected gene IDs. (C and D) mESCs were treated with sh control or sh Msl1 expressing lentiviral vectors, 5 days after lentiviral infection mESCs were cultured without LIF. RA was added for additional 4 days to induce NPC formation. (C) Msl1 downregulation in sh control, or sh Msl1 conditions were tested by Western Blot as indicated. 20 μg of proteins were loaded per lane and normalized by tubulin and ponceau staining. (D) Morphology was analysed with a reverse-phase microscope using a 10x magnification.
Additional files
-
Supplementary file 1
The table contains all primer sequences used for cloning of Msl1, or Nsl1 cDNA fragments into the pET28b expression vector, used for Msl1 and NSl1 ChIP-qPCR and RT-qPCR to analyse gene expression profiles.
- https://doi.org/10.7554/eLife.02104.023
Download links
A two-part list of links to download the article, or parts of the article, in various formats.
Downloads (link to download the article as PDF)
Open citations (links to open the citations from this article in various online reference manager services)
Cite this article (links to download the citations from this article in formats compatible with various reference manager tools)
Mof-associated complexes have overlapping and unique roles in regulating pluripotency in embryonic stem cells and during differentiation
eLife 3:e02104.
https://doi.org/10.7554/eLife.02104


