Structure of bacterial cytoplasmic chemoreceptor arrays and implications for chemotactic signaling
- California Institute of Technology, United States
- Howard Hughes Medical Institute, United States
- University of Oxford, United Kingdom
- University of Massachusetts, United States
Figures
Figure 1
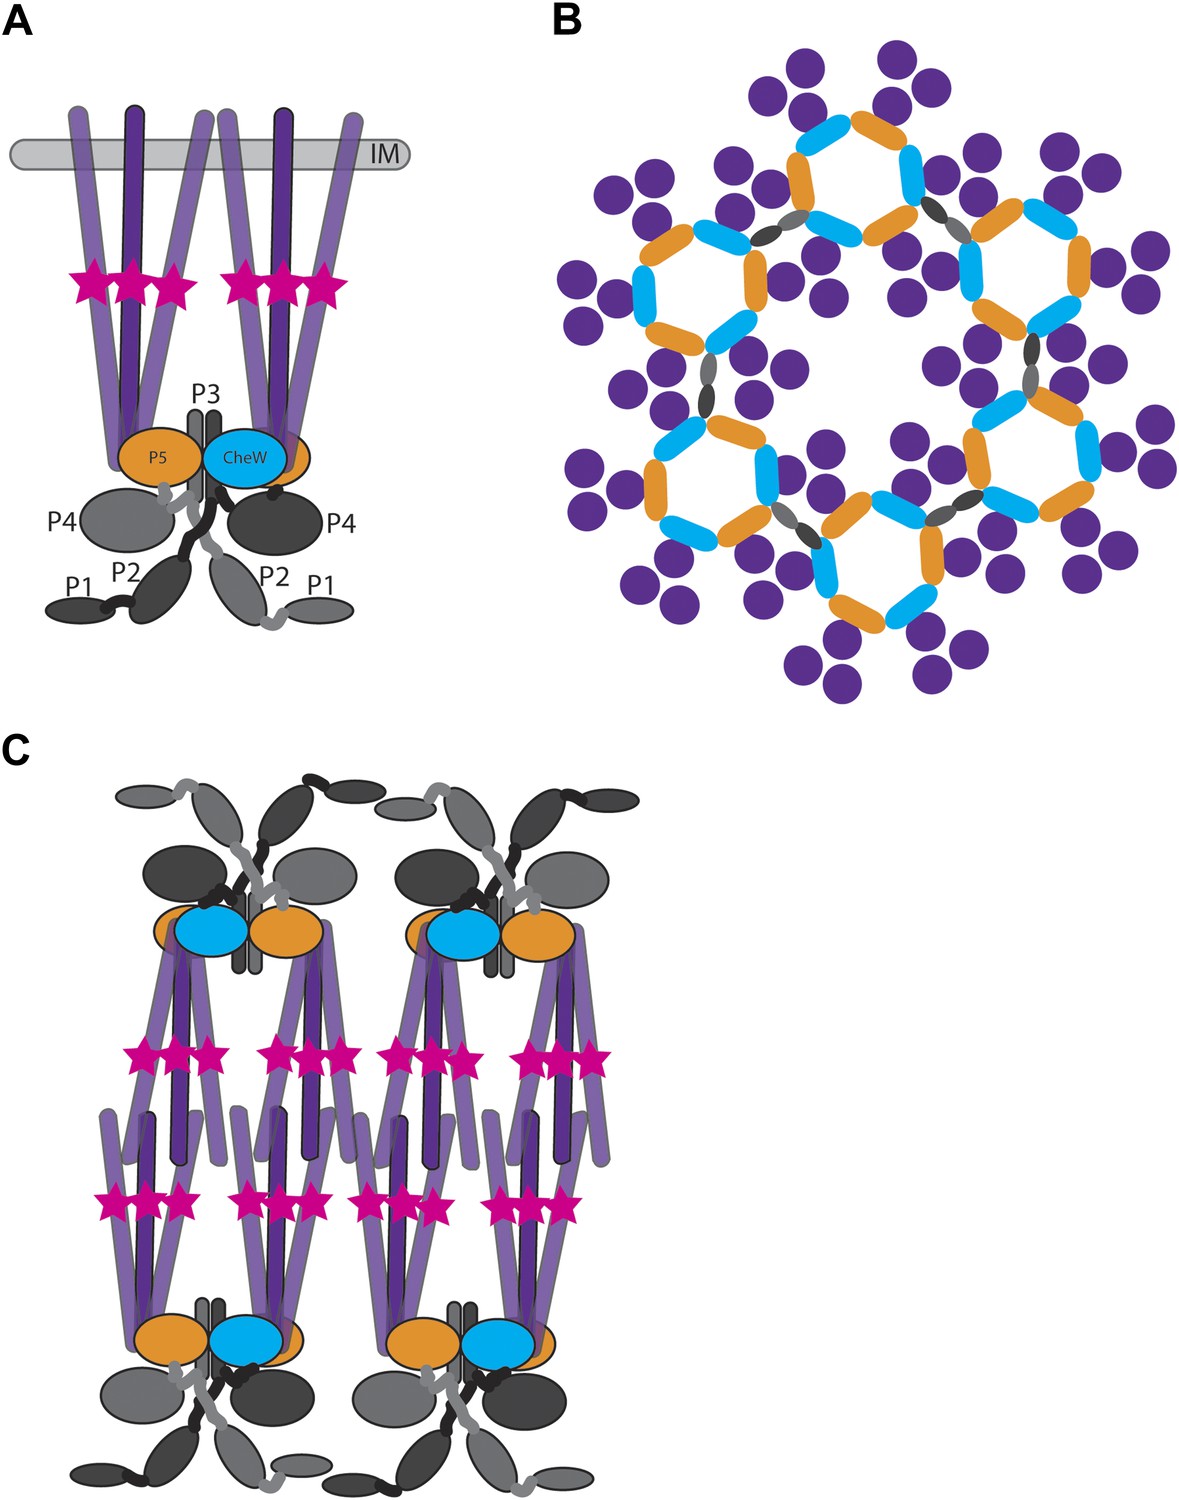
Structure of membrane-bound and cytoplasmic receptor complexes.
(A) Schematic showing the topology of receptor-trimers-of-dimers (purple), CheA (domains P1–P4 light gray/dark gray indicating domains in each CheA monomer, domain P5 orange), and CheW (blue) in membrane-bound arrays. The methylation region of each receptor dimer is indicated by a pink star. IM = inner membrane. (B) Top-view of the arrangement of the array components showing the interaction sites between the receptors, CheA and CheW, colored as in (A). (C) Schematic showing the topology of receptor, CheA, and CheW complexes in cytoplasmic arrays, colored as in (A). Cytoplasmic chemoreceptors assemble into two hexagonally packed arrays interacting at their presumably ligand-binding tips.
Figure 2
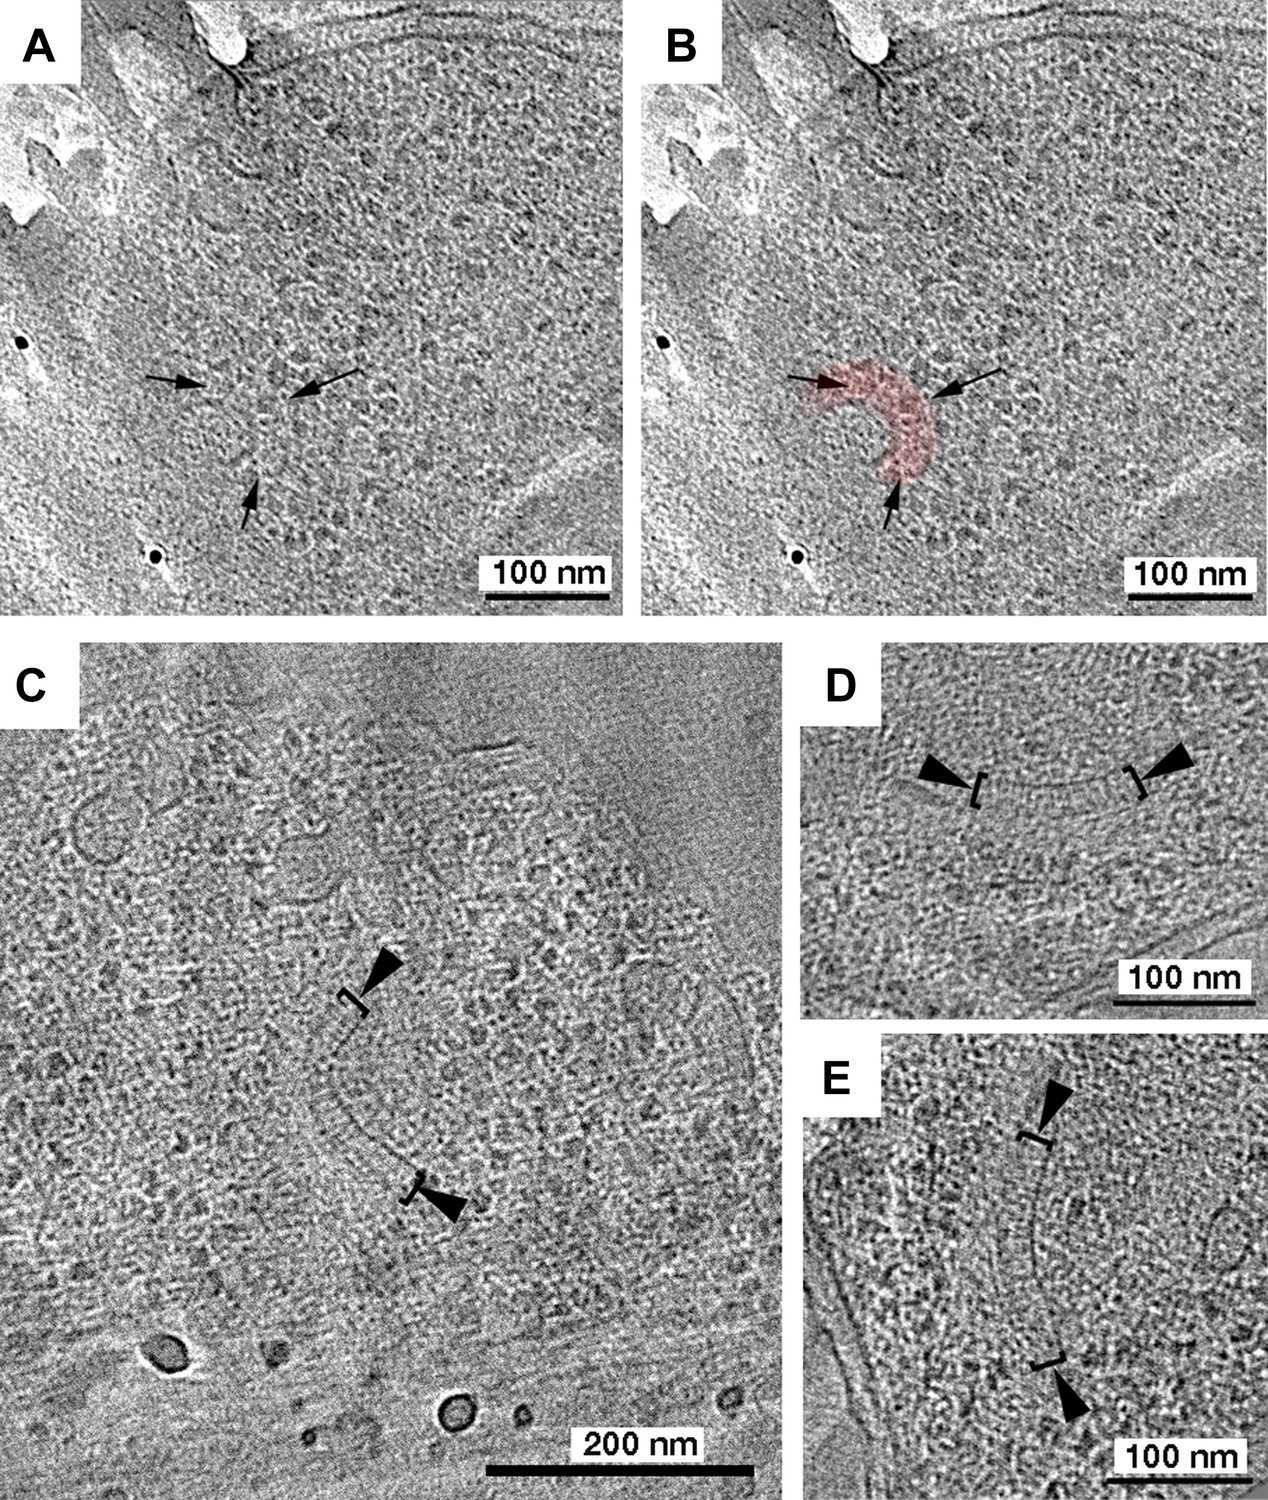
Tomography of R. sphaeroides cryosections reveals cytoplasmic clusters.
Tomographic slices of cryosections through R. sphaeroides cells expressing TlpC-GFP at wild-type (A and B) or overexpressed (C–E) levels. (A) Tomographic slice of a cell expressing TlpC-GFP, revealing a potential cytoplasmic chemoreceptor array (black arrows), pseudo-colored red in (B). (C–E) Cryosections of cells overexpressing cytoplasmic chemoreceptor components, including TlpC-GFP, contain similar structures to those observed under WT expression conditions: two curved layers approximately 27 nm apart (brackets), with perpendicular striations between them (black arrowheads).
Figure 3

Tomography of cytoplasmic clusters in freeze-substituted R. sphaeroides.
Dual-axis tomographic reconstruction of high-pressure frozen, freeze-substituted cells reveals cytoplasmic clusters in most cells. Clusters appear as partially circular structures, typically located near storage granules. (A) Reconstruction of a longitudinally sectioned cell showing a single cluster. Inset: high-magnification detail of the cluster in a single, 6.7-nm tomographic slice. Scale bar 50 nm. (B) Cell containing two cytoplasmic clusters located next to storage granules. Inset: high-magnification detail of one cluster. (C) Model (blue) superimposed over the tomogram shown in B, highlighting the clusters. Scale bars 200 nm.
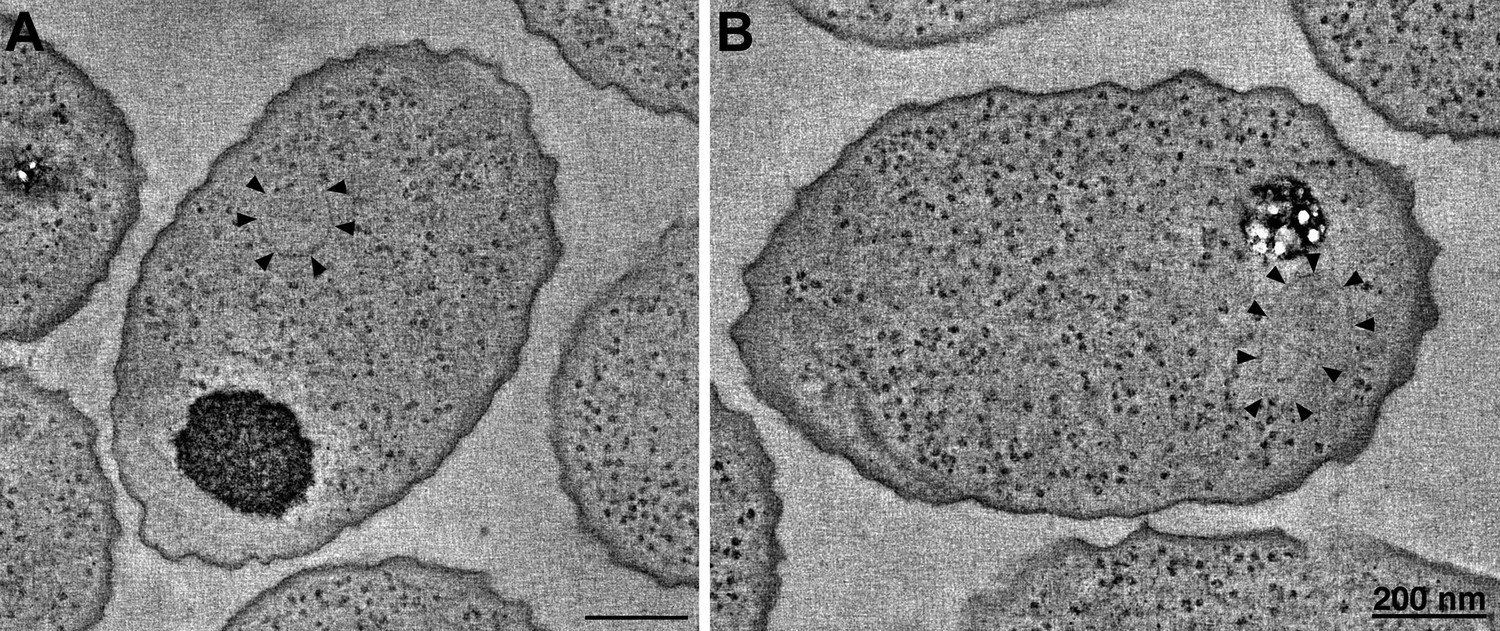
Figure 4
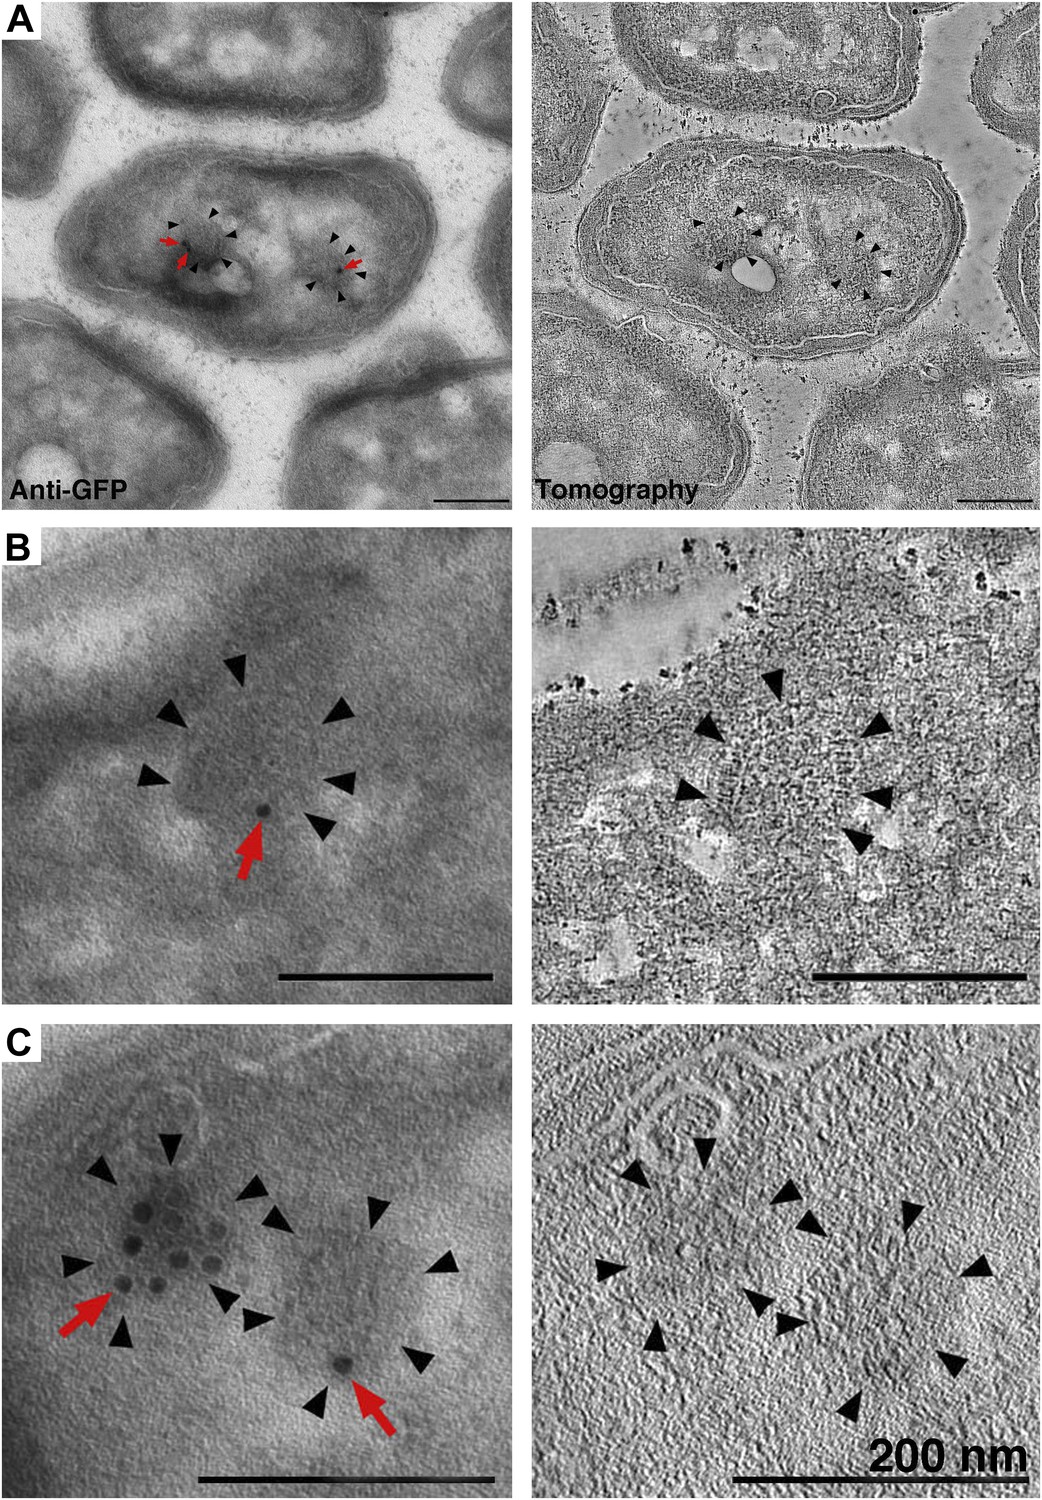
Identification of cytoplasmic clusters in R. sphaeroides by tomography of immunolabeled, negatively stained sections.
Sections were immunolabeled with antibodies against GFP and gold-conjugated secondary antibodies. (A–C) Three examples of immunolabeled cells (left) and corresponding tomographic slices (right). Clusters (black arrowheads) were typically labeled by 1–3 gold particles (red arrows), depending on the amount of antigen present on the section surface. The heavily labeled cluster in (C) is likely oriented en face and near the section surface, allowing for access to a larger number of GFP antigens. Scale bars 200 nm.
Figure 5
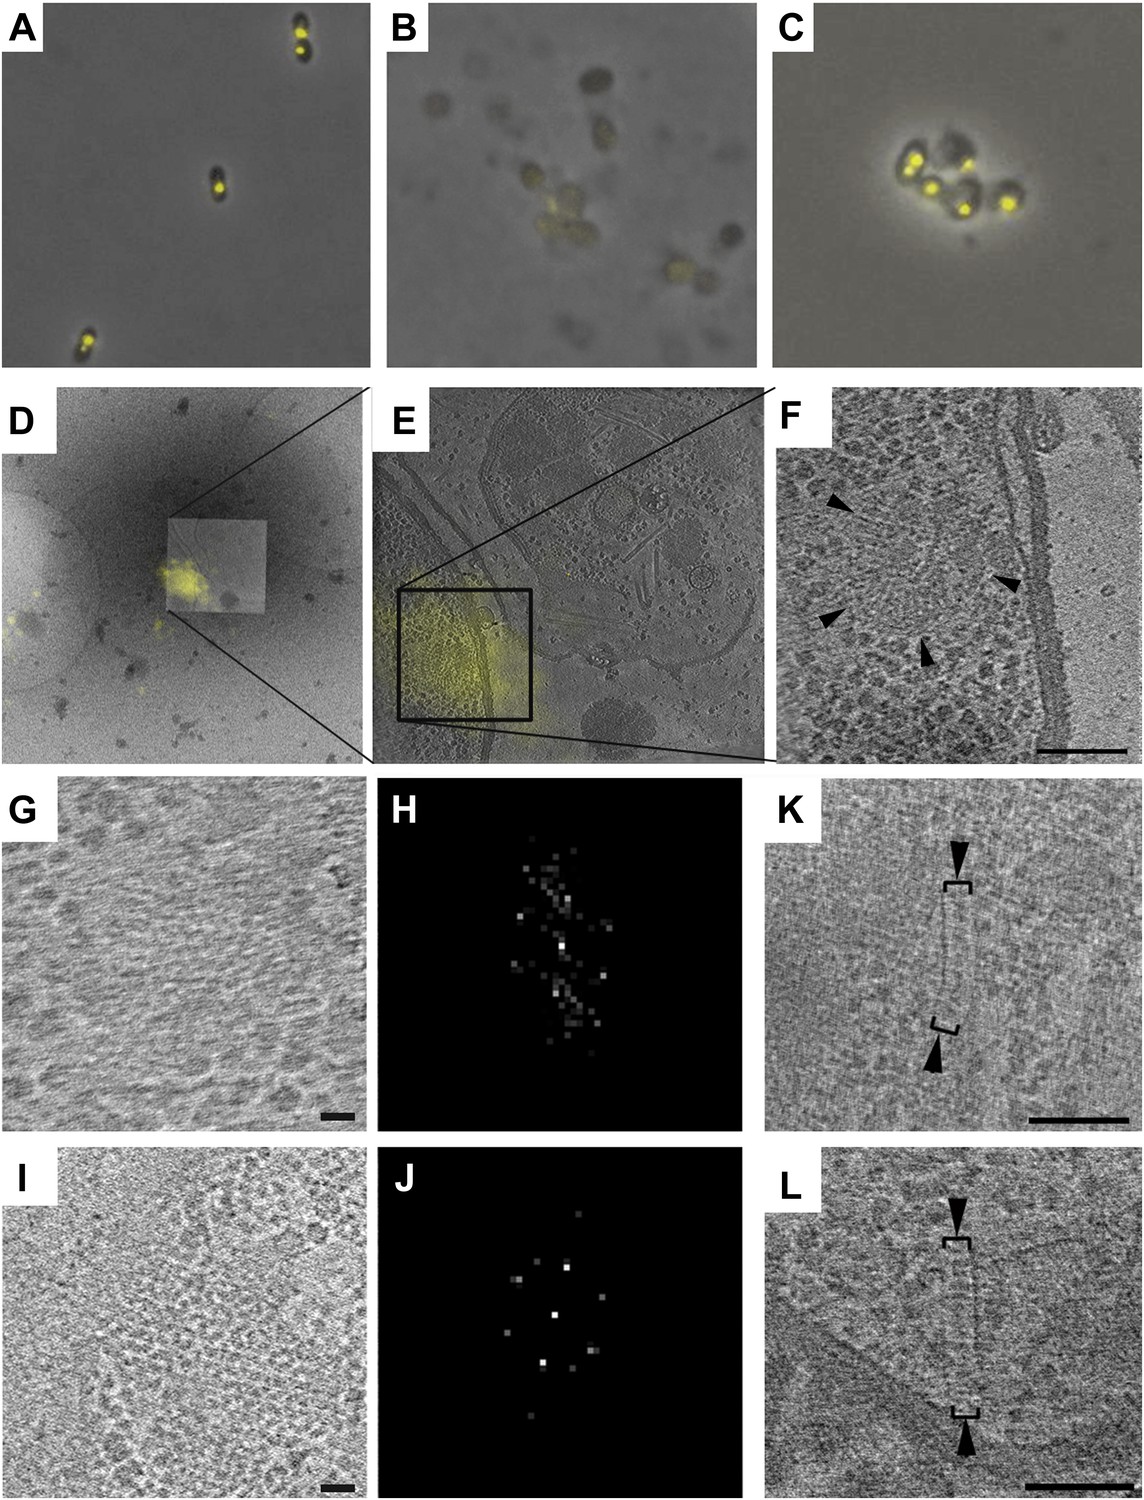
Correlative cryo-FLM/ECT of R. spheroides cytoplasmic arrays.
(A–C) Molecular crowding preserves cytoplasmic chemoreceptor clusters during lysis. Overlay of phase contrast and TlpT-YFP fluorescence images of R. sphaeroides cells of strain JPA1558OE before (A) and after lysis either in the absence (B) or presence (C) of 10% PVP. (D–F) Correlative cryo-FLM/ECT identifies a cytoplasmic array. (D) Overlay of fluorescent signal from TlpT-YFP (yellow) and a low magnification cryo-EM image of the same lysed cell. (E) Overlay of TlpT-YFP fluorescent signal (yellow) and a cross-section of a reconstructed tomogram corresponding to the same region, identifying the structure of a cytoplasmic chemoreceptor array. (F) An enlarged view of the cytoplasmic array reveals a partial ring consisting of two layers of chemoreceptors. Scale bar 100 nm. (G–J) Receptor packing is identical in R. sphaeroides cytoplasmic and transmembrane arrays. (G) Top view through one of the two layers of the array imaged in D–F and corresponding power spectrum (H) reveal a hexagonal receptor arrangement with center-to-center spacing of 12 nm. Scale bar 25 nm; power spectrum not to scale. (I) Top view through a membrane-bound chemoreceptor array and corresponding power spectrum (J) reveal hexagonal packing identical to that of the cytoplasmic array shown in (G–H). Scale bar 25 nm; power spectrum not to scale. (K–L) Additional examples of cytoplasmic chemoreceptor arrays (brackets with arrowheads) in tomograms of R. sphaeroides cells lysed with molecular crowding agents added. Distance between baseplates is approximately 30 nm. Scale bars 100 nm.
Figure 6
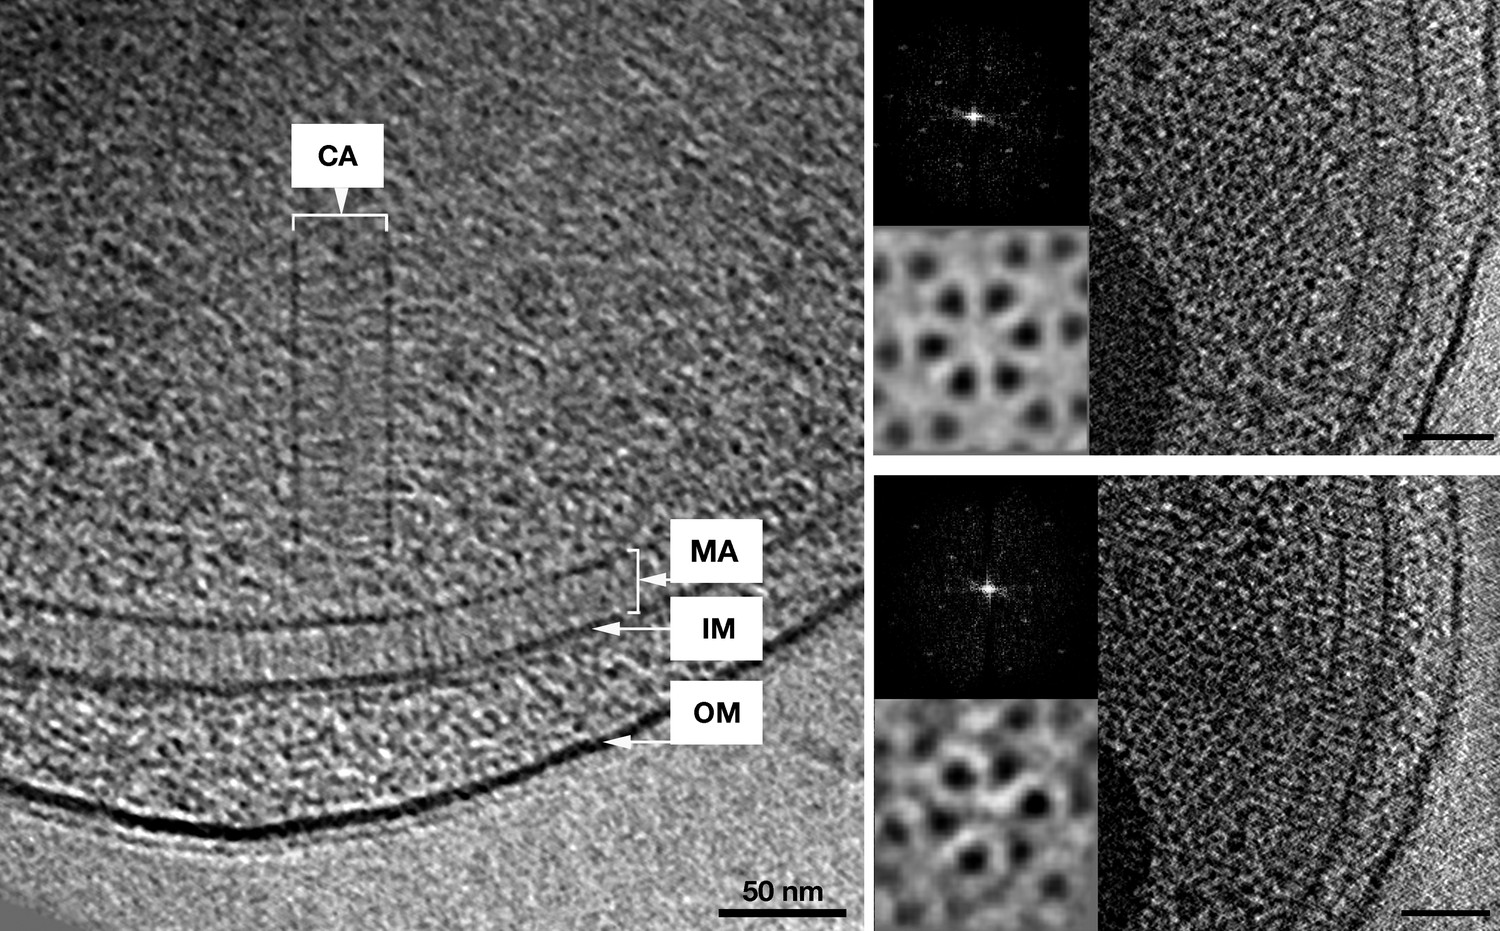
In vivo architecture of the V. cholerae cytoplasmic array.
Left: side view of a membrane-bound chemoreceptor array (MA) and a cytoplasmic chemoreceptor array (CA). The cytoplasmic array is composed of two parallel CheA/W baseplates approximately 35 nm apart. The chemoreceptors are sandwiched between the two baseplates and are hexagonally packed with a 12 nm center-to-center spacing. Right: top views of the receptor packing close to the CheA/CheW baseplate on either side and corresponding power spectra (top insets), as well as sixfold symmetrized subvolume averages (bottom insets) reveal that the hexagonal arrangement of the receptors is identical to that of the membrane bound array described previously (Briegel et al., 2009). Scale bars 50 nm. CA, Cytoplasmic chemoreceptor array; MA, membrane-bound chemoreceptor array; IM, inner membrane; OM, outer membrane. Power spectra not to scale.
Figure 7
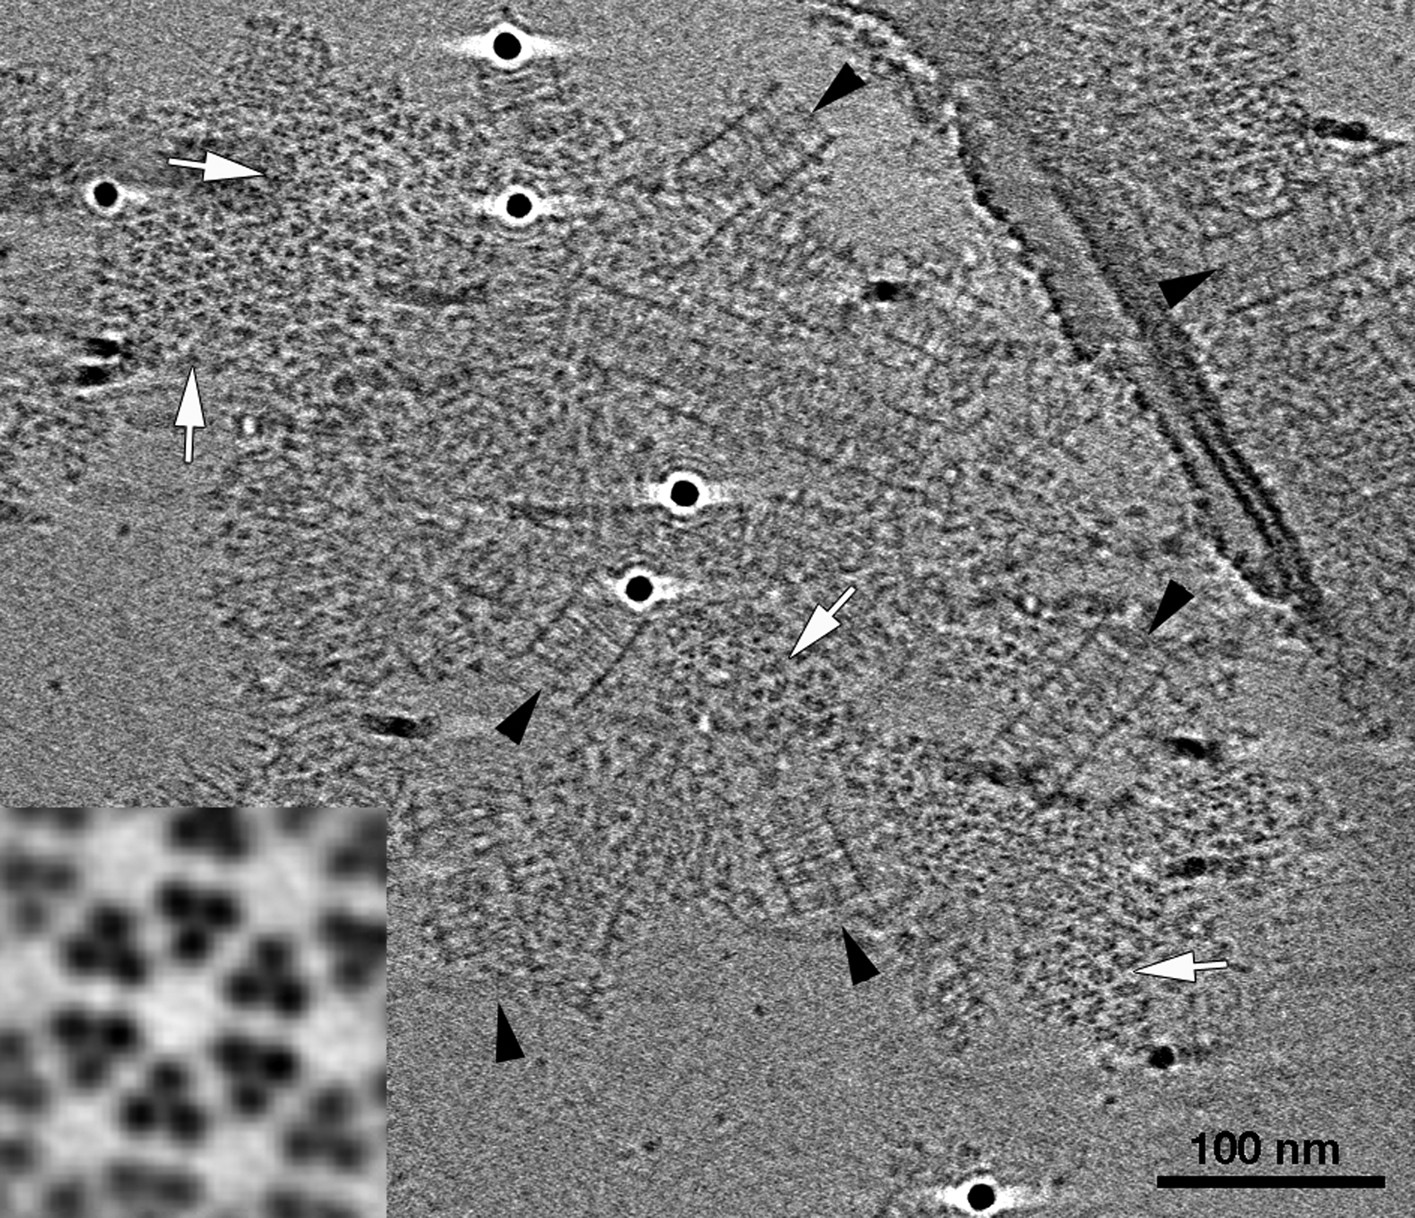
E. coli Tar chemoreceptors lacking transmembrane regions can form cytoplasmic-like arrays in the presence of CheA, CheW, and a molecular crowding agent.
Tomographic slice showing cytoplasmic fragments of Tar forming extended arrays in the presence of CheA, CheW, and molecular crowding agents. These arrays closely resemble the cytoplasmic chemoreceptor arrays seen in V. cholerae (Figure 6). Side-view (black arrowheads) reveals two flat, parallel CheA/W baseplates spaced approximately 31 nm apart. Top views of the chemoreceptors close to the baseplates (white arrows) reveal a well-ordered, hexagonal arrangement with a center-to-center spacing of 12 nm. Enlarged subvolume average (inset) confirms that the packing is identical to that of in vivo arrays. Scale bar 100 nm.
Figure 8
R. sphaeroides cytoplasmic arrays are inherently curved.
(A) Tomographic slice of a high-pressure frozen, freeze-substituted cell overexpressing native, untagged components of the cytoplasmic chemoreceptor cluster. Arrowheads indicate curved array. (B) Tomographic slice of a similarly treated cell lacking the partitioning protein PpfA. Arrowheads indicate curved cytoplasmic array. Scale bars 200 nm.
Tables
Table 1
Strains used in this study
| Strain | Relevant genotype | Source |
|---|---|---|
| JPA543 | WS8N TlpC-GFP | Wadhams et al., 2002 |
| JPA543OE | TlpC-GFP pIND-FliA | This study |
| JPA1558OE | TlpT-YFP pIND-FliA | This study |
| WS8NOE | pIND-FliA | This study |
| JPA1330OE | ΔppfA TlpC-GFP pIND-FliA | This study |
| MKW1383 | N16961 ΔctxAB::kan | Matthew Waldor |
Download links
A two-part list of links to download the article, or parts of the article, in various formats.
Downloads (link to download the article as PDF)
Open citations (links to open the citations from this article in various online reference manager services)
Cite this article (links to download the citations from this article in formats compatible with various reference manager tools)
Structure of bacterial cytoplasmic chemoreceptor arrays and implications for chemotactic signaling
eLife 3:e02151.
https://doi.org/10.7554/eLife.02151


