Natural variation reveals that intracellular distribution of ELF3 protein is associated with function in the circadian clock
- Max Planck Institute for Plant Breeding Research, Germany
- University of York, United Kingdom
- Biological Research Centre of the Hungarian Academy of Sciences, Hungary
Figures
Figure 1
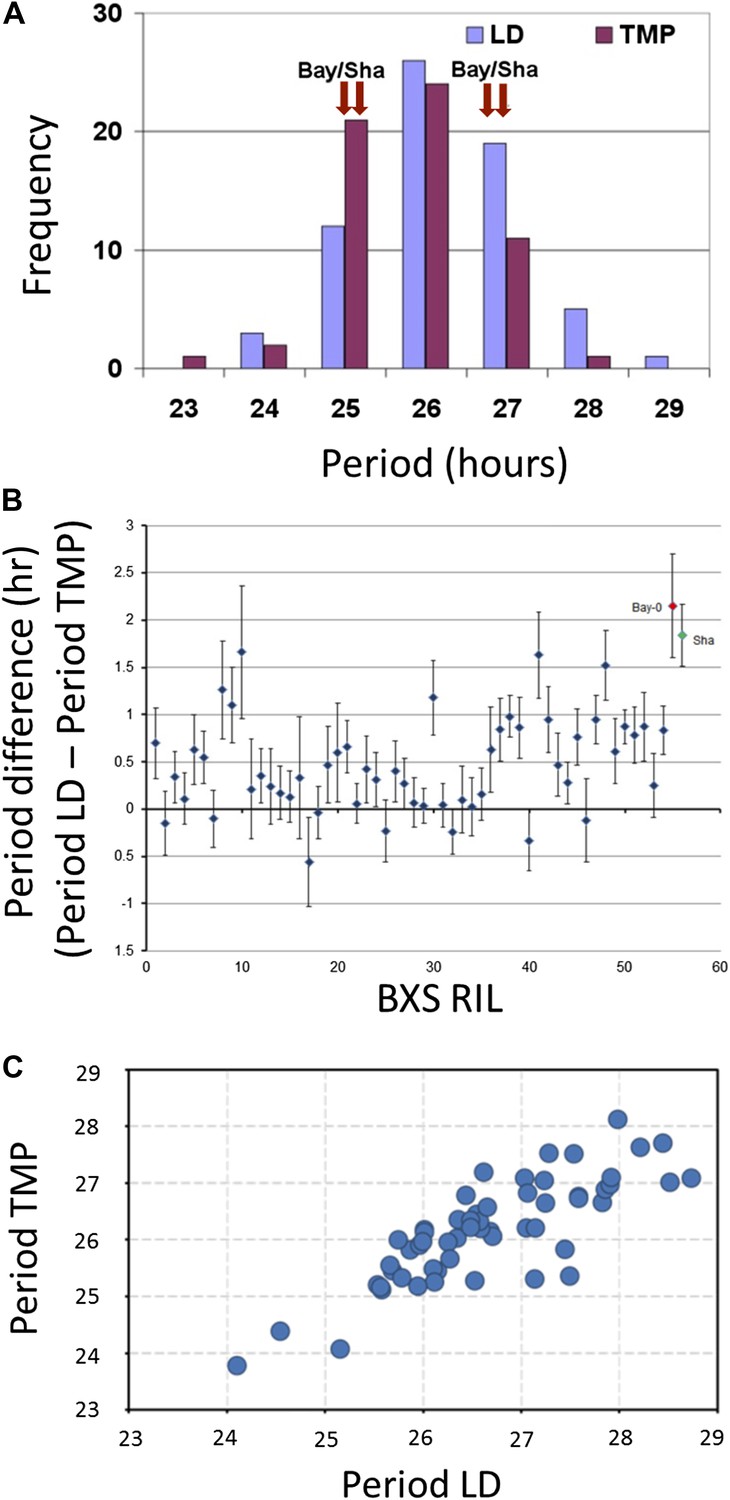
Illustrative and statistical features of CCR2 periodicity post-photic vs post-thermal entrainment in BxS populations.
(A) Normal frequency distribution of CCR2 periodicity in BxS individuals. Blue-colored bars represent periodicity after photic entrainment, and magenta-colored bars represent periodicity after thermal entrainment. Bay-0 and Sha denote the periodicity of CCR2 in the parental genotypes. Note the skew of temperature-entrained plants to shorter periodicity, when compared to photic-entrained plants. (B) Periodicity differences of CCR2 in BxS RIL lines. The x-axis denotes 54 RILs of which periodicity was assayed in both in LD and TMP entrainment (see Supplementary file 1 and Supplementary file 2). The y-axis represents the periodicity differences of thermal minus photic-entrained lines (calculated as PeriodLD–PeriodTMP). (C) A scatter plot for TMP vs LD periodicities from the BxS RILs described in the tables Supplementary file 1 and Supplementary file 2.
Figure 2
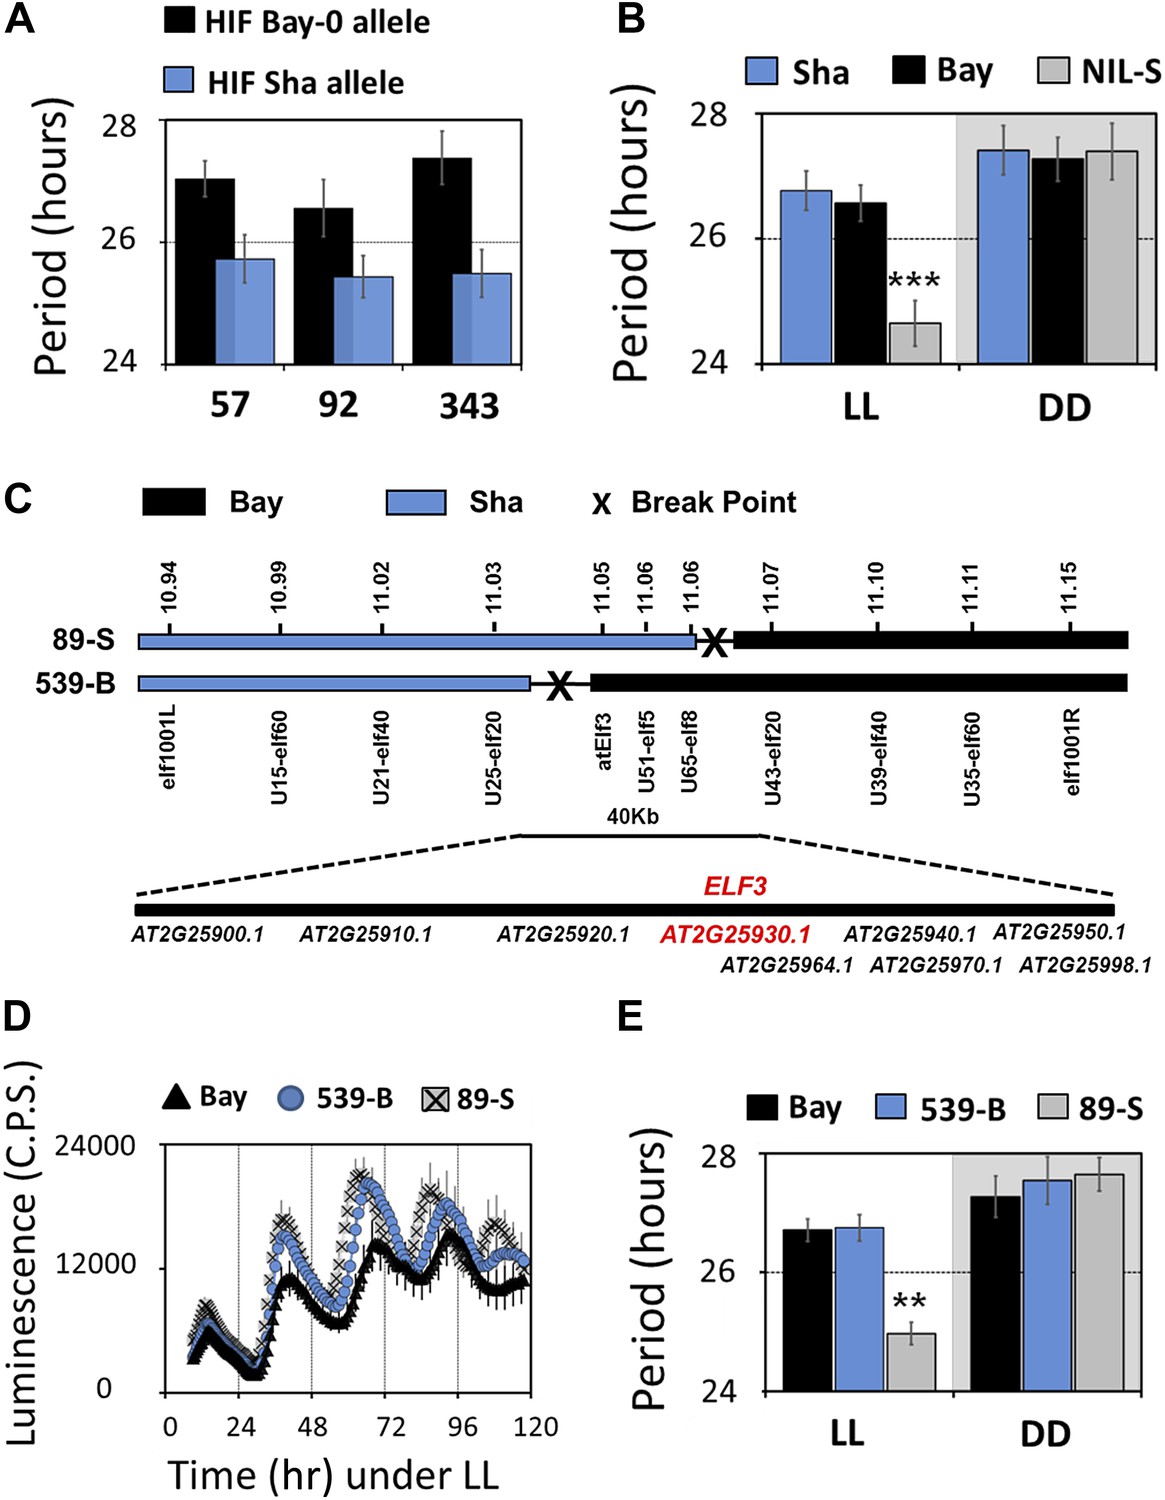
Map-based cloning identifies ELF3 as a candidate for chr2 QTL.
Period estimates of CCR2::LUC expression in (A) three independent HIFs (57, 92, and 343) harboring either the Bay-0 or the Sha allele at QTL confidence interval (B) parental accessions and NIL-S with introgression of Sha at QTL confidence interval in otherwise homogeneous Bay-0 background, under LL and in DD. (C) Schematic diagram showing the fine mapping strategy of chr2 locus. Black and gray bars represent Bay-0 and Sha genotypes, respectively. The names below the bars represent the molecular markers used for genotyping, and the numbers above correspond to their physical position on the genome. The crosses represent the position of the recombination event. Two recombinants, 89-S and 539-B, were found to have a recombination event surrounding a 40-Kb region, where nine annotated genes are located, as indicated below the solid bar. (D) Free-running profile of CCR2::LUC expression in recombinants 89-S, 539-B and Bay-0 under continuous red and blue light (LL). (E) Period estimates of rhythm shown in (D). All error bars indicate SEM, where n ≥ 24. Mean values that are significantly different from Bay-0 wild type are indicated by *, **, or *** for p-values (ANOVA) <0.05, 0.01, or 0.001, respectively.
Figure 3
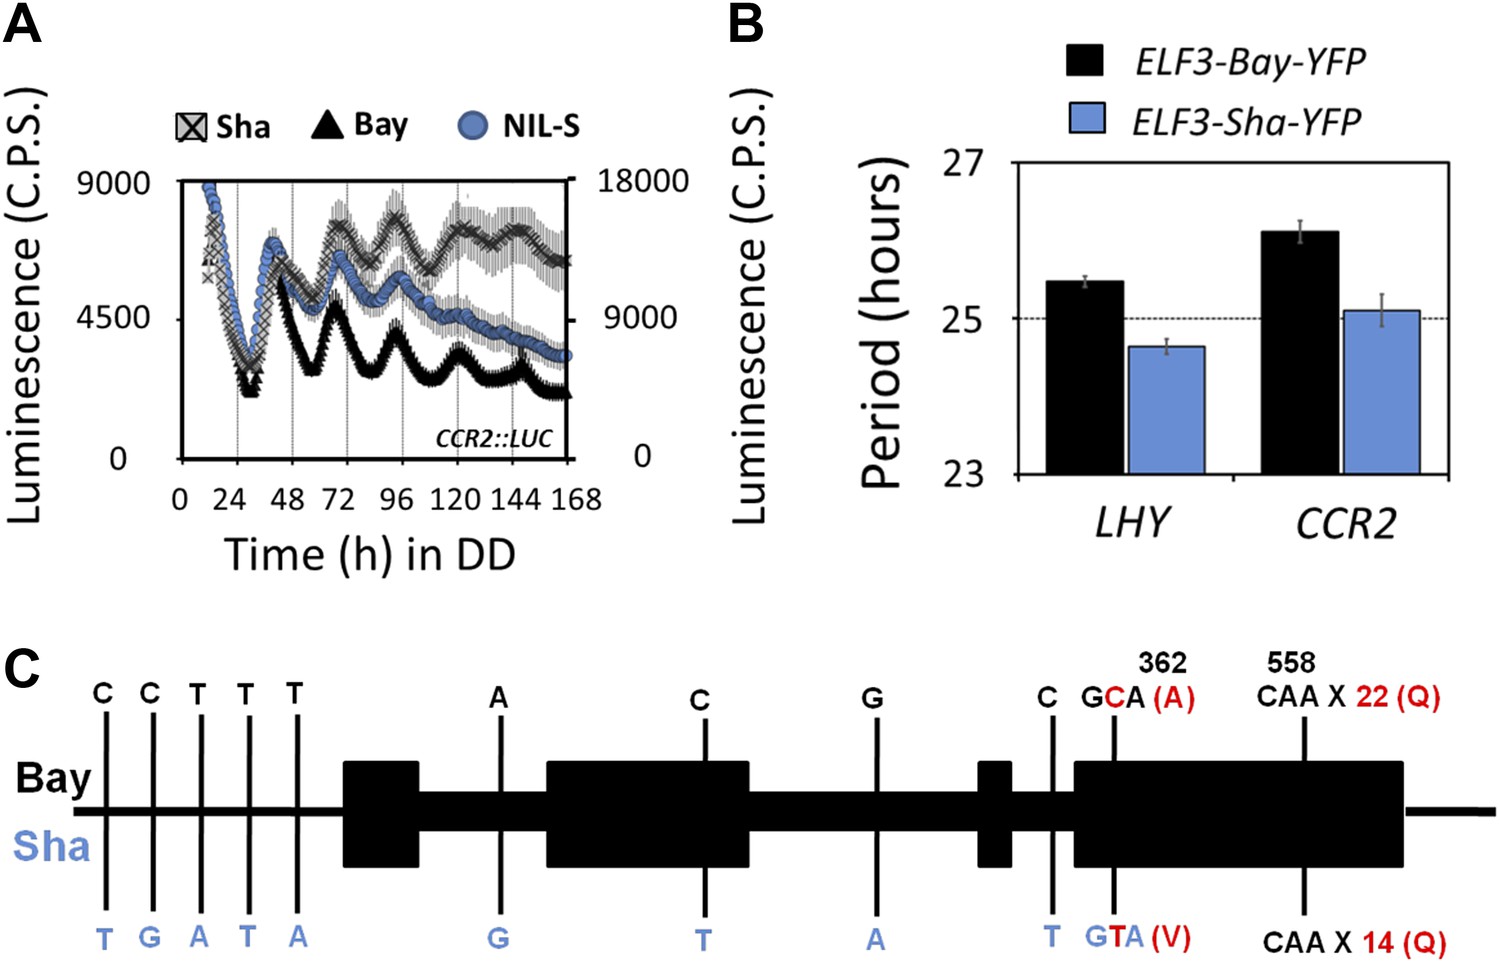
Transgenic complementation confirms ELF3 as QTG underlying Chr2 QTL.
Free-running profile of CCR2::LUC expression in Bay-0, Sha, and NIL in darkness (A), Left y-axis shows the luminescence measures of Bay and NIL, and the right y-axis shows the luminescence measures of Sha. NIL with introgression of Sha at ELF3 could not sustain the robust rhythms of CCR2::LUC after 4 days in darkness. Error bars represent SEM, n ≥ 24. (B) Free-running period estimates of CCR2::LUC and LHY::LUC expression in T2 transgenic lines harboring either ELF3-Bay-YFP or ELF3-Sha-YFP in Ws-2 background. The data are the average of three independent, single-insert lines displaying similar rhythm profile. Error bars represent SEM, n = 96. (C) Sequence comparison of ELF3-Bay and ELF3-Sha. Schematic representation of ELF3 (AT2G25930). Vertical bars show the position of the nucleic acid transition. The letters above the bars represent the nucleic acid in Bay, and letters below represent the nucleic acid in Sha. The numbers above the letters represent the position of the nonsynonymous change. The letters in parenthesis show the amino-acid change.
Figure 4
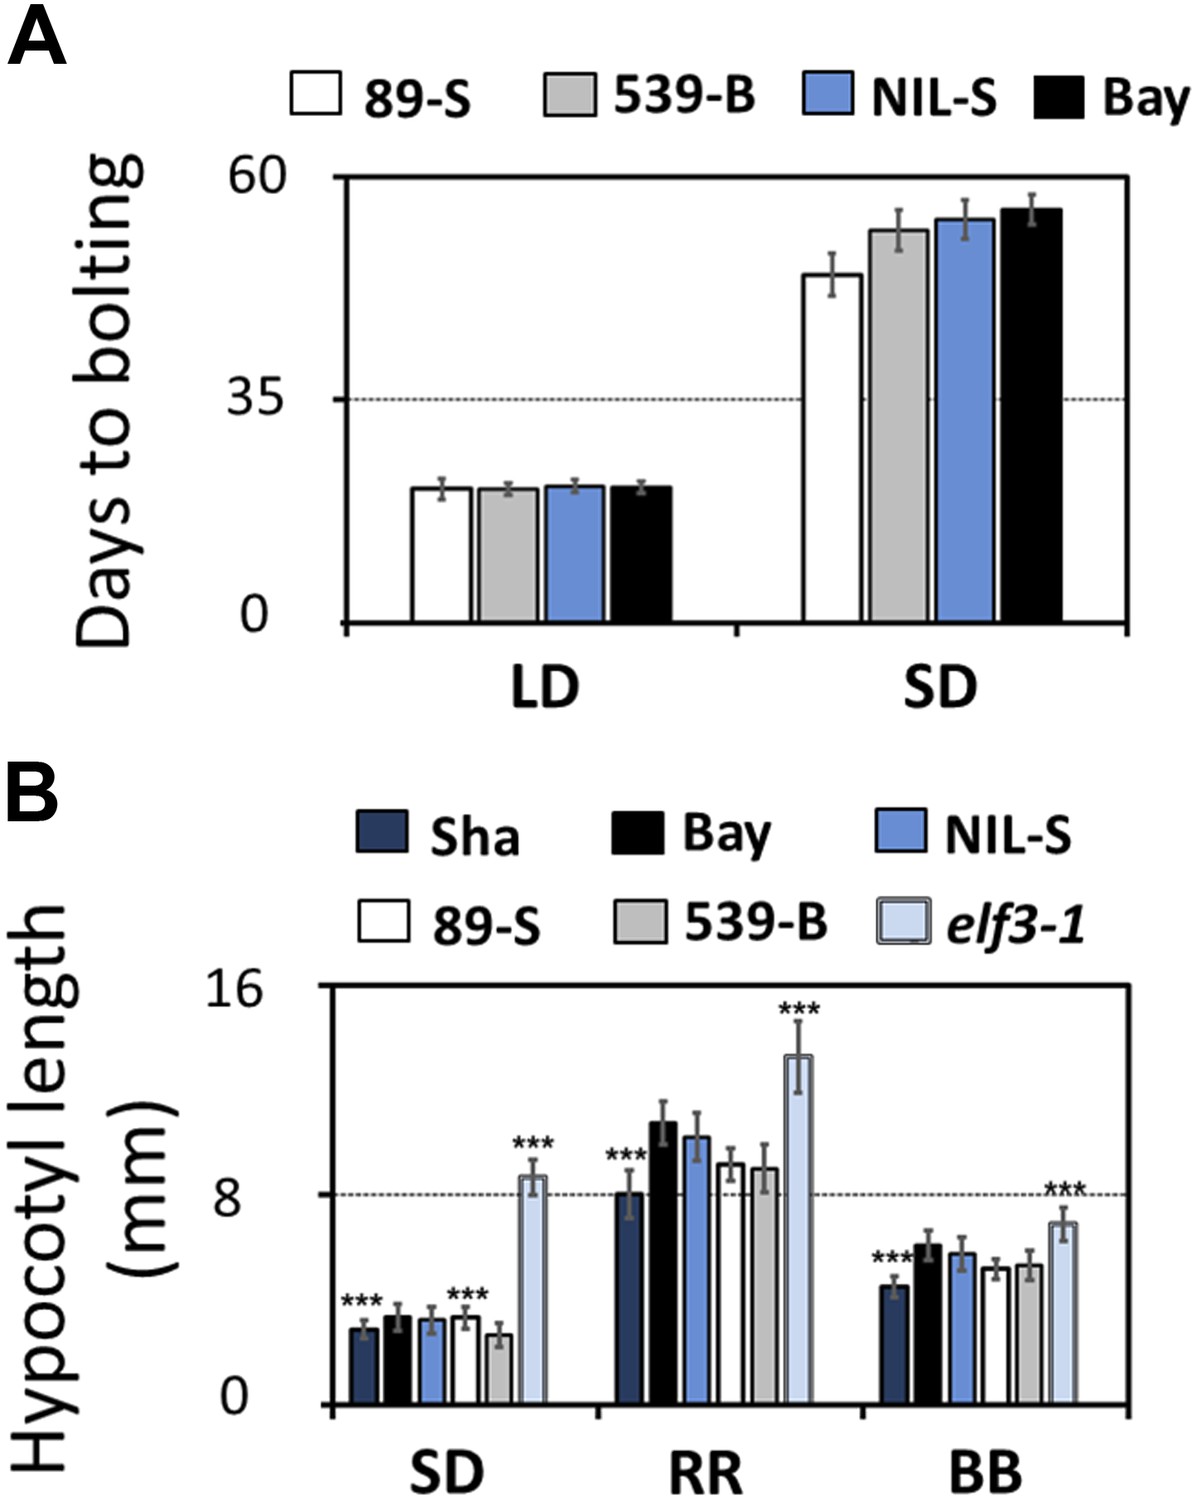
Flowering time and hypocotyl length measurements for ELF3-Sha.
(A) Flowering time of HIF 89-S, HIF 539-B, NIL, and Bay-0 under long day (16L:8D) and short day (8L:16D). The flowering time was counted as the number of days at the appearance of 1 cm bolt. (B) Hypocotyl length of HIF 89-S, HIF 539-B, NIL, elf3-1, Sha, and Bay-0 under short day (8L:16D), under RR (15 μmol m−2s−1), and under BB (15 μmol m−2s−1). Error bars represent the standard deviation. Significance as described in Figure 2 compared to Bay-0, except HIF 89-S, which was compared to HIF 539-B.
Figure 5
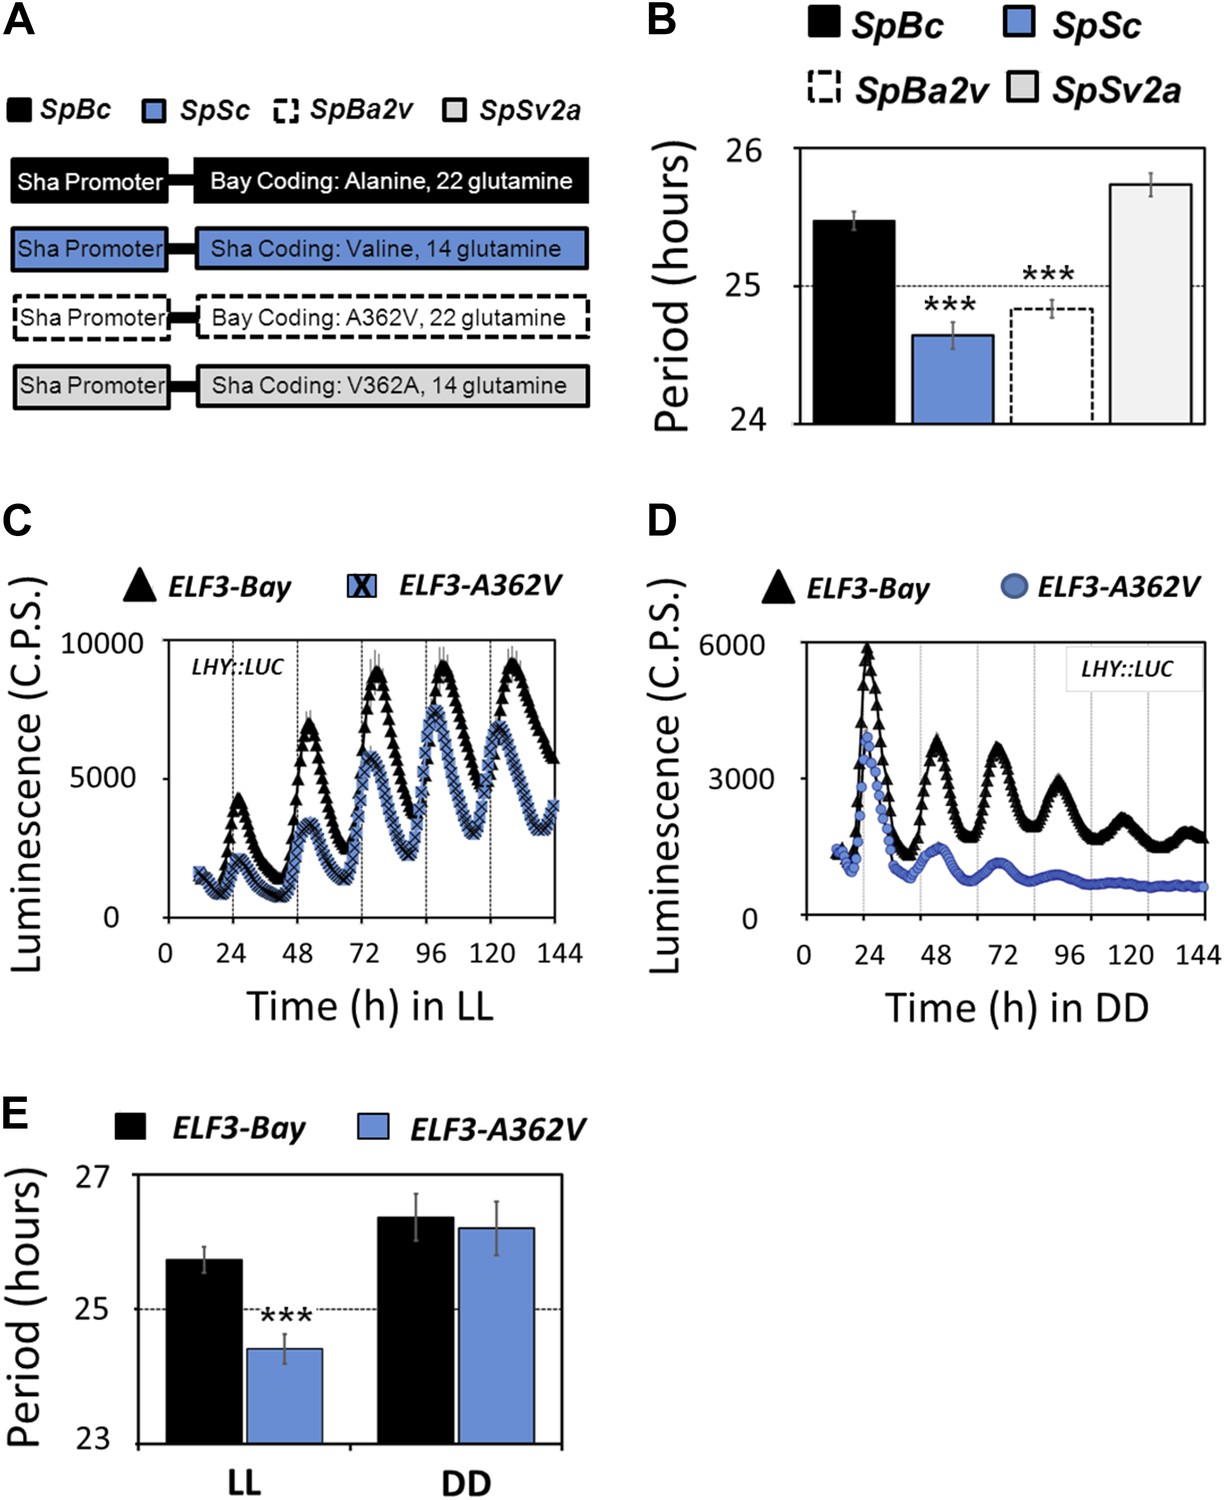
Molecular basis of ELF3-Sha phenotypes.
(A) Schematic diagram explaining the different promoter-coding combinations used in (B). The Sha promoter of ELF3 fused with different coding regions is shown (for details see 'Materials and methods'). The encoded amino-acid residue at position 362, along with the number of encoded glutamines, is shown. (B) Period estimates of the LHY::LUC expression in the lines explained in (A). Note that the lines SpSc and SpBa2v with Valine in the coding part displayed period acceleration, irrespective of the number of glutamines. Error bars represent SEM, n = 48. Significance as explained in Figure 2, compared to SpBc. Free-running profile of LHY::LUC expression in T2 transgenic lines harboring either ELF3-Bay or ELF3-A362V in Ws-2 genetic background under LL (C) and in DD (D). A single nucleotide exchange was induced in ELF3-Bay to change the encoded alanine residue at position 362 to valine (ELF3-A362V). The data are the average of three independent single-insert lines with similar rhythm profile. (E) Period estimates of the lines shown in (C) and (D). Error bars represent SEM, n = 96. Mean values that are significantly different from Bay-0 wild type are indicated by *, **, or *** for p-values (ANOVA) <0.05, 0.01, or 0.001, respectively.
Figure 6

Alterations in the ELF3-Sha oscillator and clock resetting.
(A) Free-running profile of LHY::LUC expression in ELF3-Bay and ELF3-A362V in a 15-day continuous experiment under consecutive light and in dark conditions. The plants were entrained for 7 days under 12 hr:12 hr light dark cycles, followed by transfer to LL and measurement of LHY::LUC expression for 6 days. On day 7, plants were transferred to darkness, and the measurement of LHY::LUC was continued in DD for four more days. On day 11, the plants were transferred to light conditions again, and the expression profile of LHY::LUC was measured for an additional 4 days. Open bars in the graph represent time in LL, and closed bar represents time in DD. Error bars represent SEM and are shown on every third reading. (B) Period and R.A.E. analysis of profiles shown in (A) n = 48. (C) Phase shifts in dark-adapted seedlings after resumption to LL. ELF3-Bay and ELF3-A362V plants entrained for 7 days under light/dark cycles (LD) were transferred in DD for 1 day and then replicate samples were released into LL at 4-hr intervals, monitoring the phase of LHY expression in LL to determine the state of the oscillator in the preceding DD interval. Phase difference plot (Phase ELF3-Bay–ELF3-A362V) for 3 days in DD is shown. Third peak under LL was used for phase analysis. n = 36. Experiment was repeated three times with similar results. (D) Frequency demultiplication assay. After 7 days of entrainment under 12L:12D (T = 24) cycles, the LHY:LUC profile was monitored under 12L:12D (T = 24) for 1 day and then 6L:6D (T = 12) for 4 days. The shaded boxes indicate the duration of the LD cycles. For clarification, the LHY::LUC profiles from day-3 to day-5 is magnified and shown below.
Figure 7
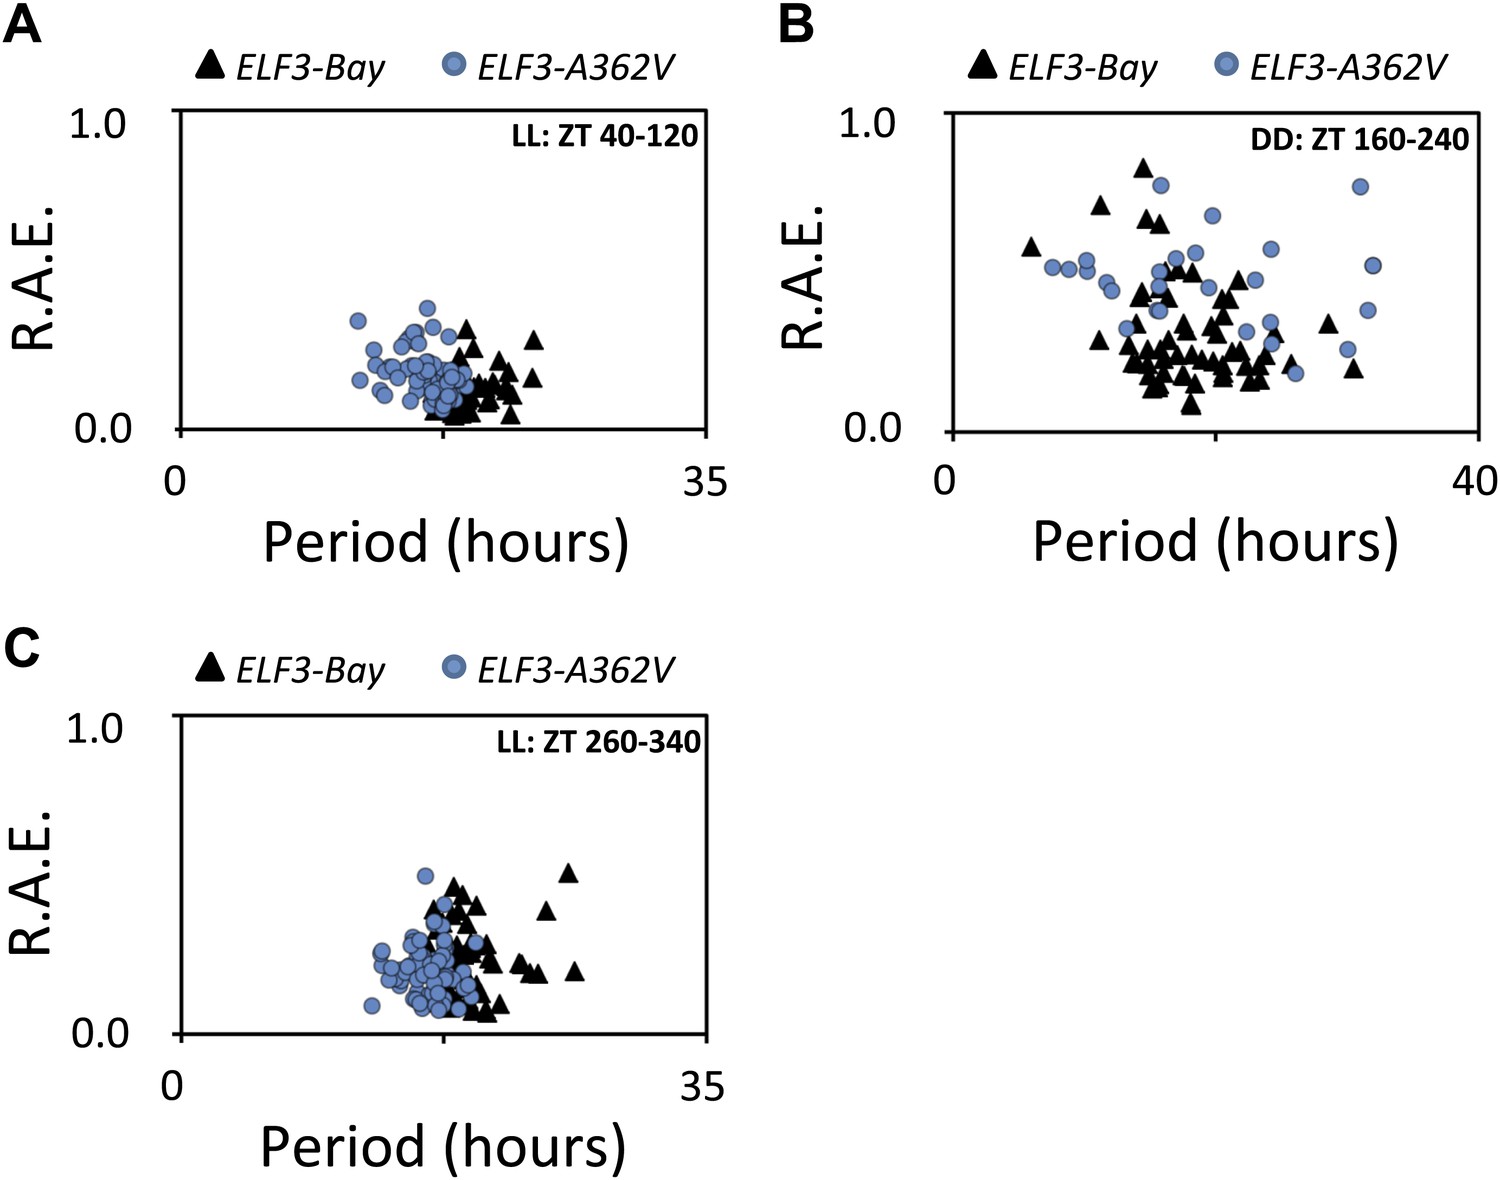
Alanine sustains robust oscillator in darkness.
(A–C) Scatter plot for R.A.E. against period showing estimates of individual ELF3-Bay and ELF3-A362V lines shown in (Figure 5A). Only lines with R.A.E. < 1.0 were plotted.
Figure 8

Circadian oscillator does not abolish in ELF3-Sha in darkness.
(A) Phase shifts in dark-adapted seedlings after resumption to LL. ELF3-Bay and ELF3-A362V plants entrained for 7 days under light/dark cycles (LD) were transferred in DD for 1 day and then replicate samples were released into LL at 4-hr intervals, monitoring the phase of LHY expression in LL to determine the state of the oscillator in the preceding DD interval. Phase was calculated relative to dawn (ZT00), n = 36. (B) The LHY::LUC profile in ELF3-Bay and ELF3-A362V after 128 hr in darkness. Note the robust rhythms of LHY::LUC in both lines.
Figure 9
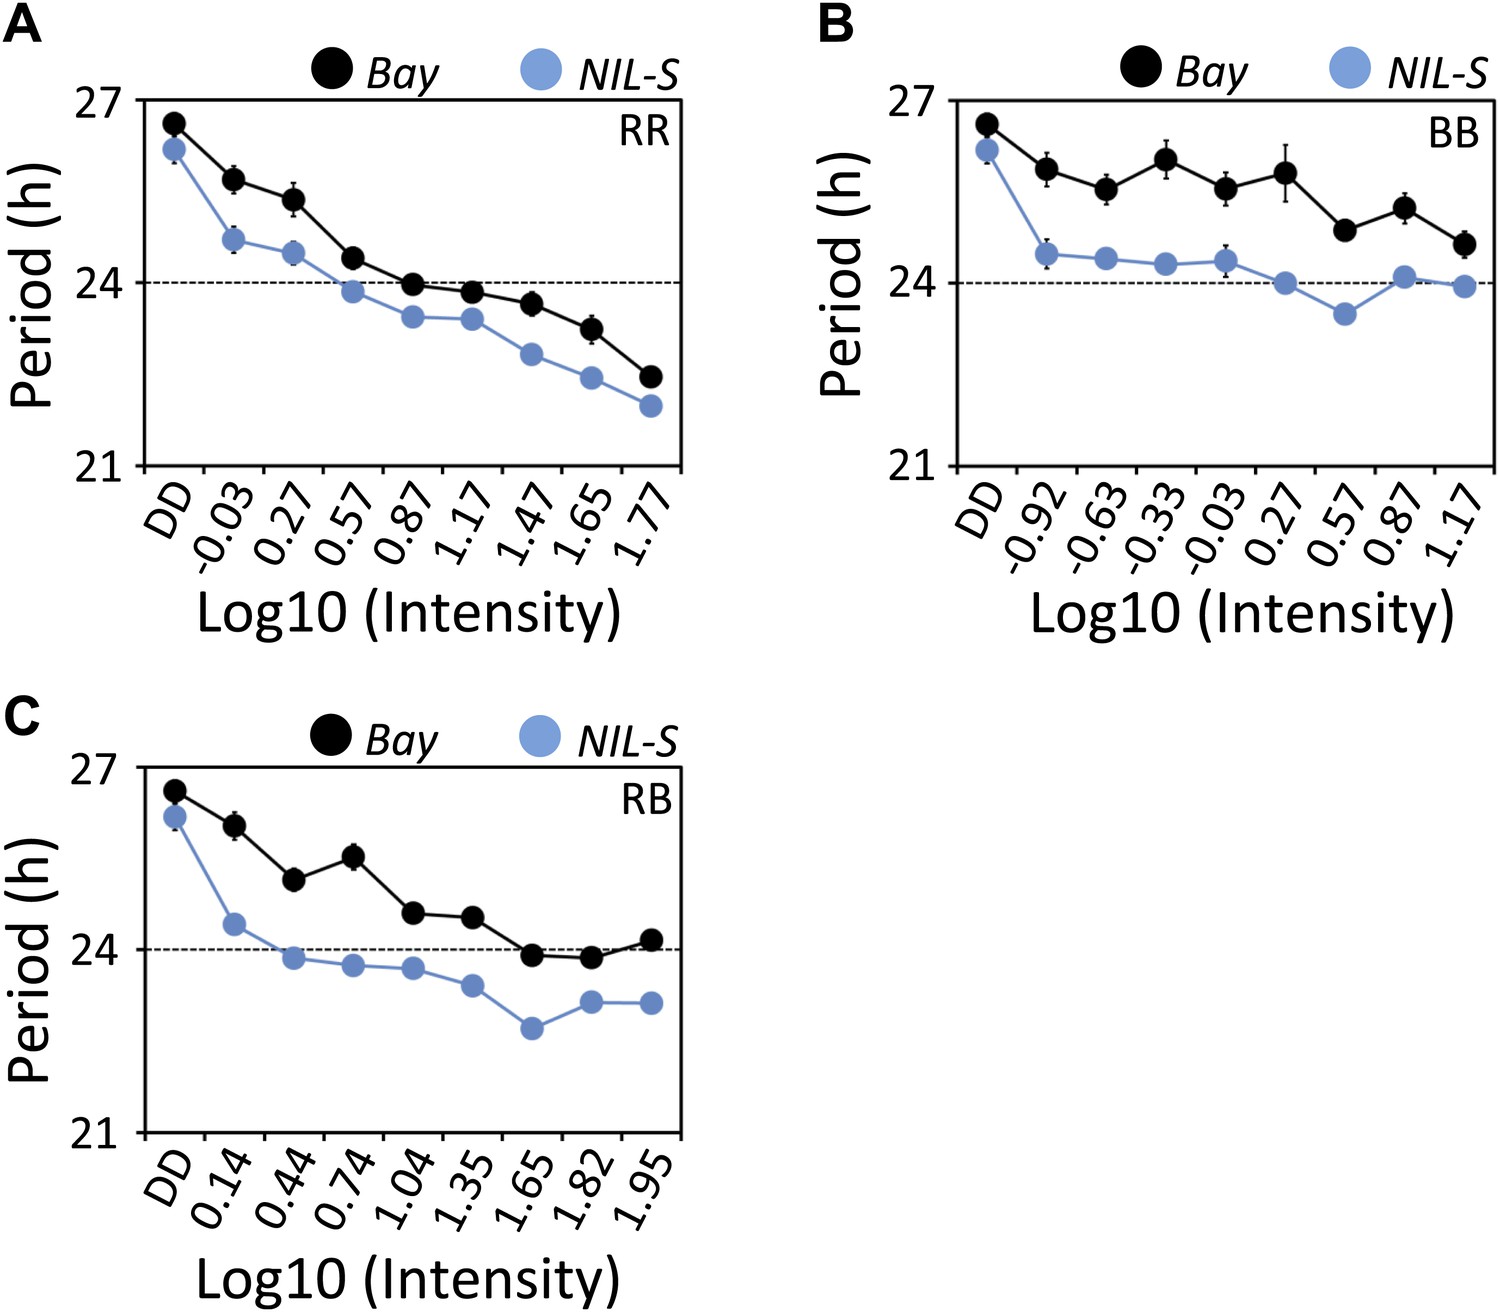
ELF3-Sha is short-period under a range of light intensities.
Free-running period of Bay and NIL-S under different intensities of (A) red (B) blue and (C) red+blue lights (∼3:1). Plants were entrained for 7 days under 12 hr LD cycles (white light) before transferring to the respective light conditions. Neutral density filters were used to control the light intensities. Light intensities were measured in µmol m−2s−1 and were transformed to log10 scale shown in the graphs. DD represents darkness. Error bars represent SEM, n = 36.
Figure 10

Compromised clock network in ELF3-Sha. Luciferase expression profile of different clock genes in NIL, elf3-1, elf3-4 and Bay-0 under LL (left panel, A–F) and in DD (right panel, G–L).
(A and G) CCA1::LUC, (B and H) LHY::LUC, (C and I) TOC1::LUC, (D and J) GI::LUC, (E and K) PRR7::LUC, and (F and L) PRR9::LUC. Error bars represent SEM and are shown on every third reading. Note that the NIL-S displayed an intermediate expression of all clock genes relative to the null mutants elf3-1 and elf3-4 compared to Bay-0.
Figure 11
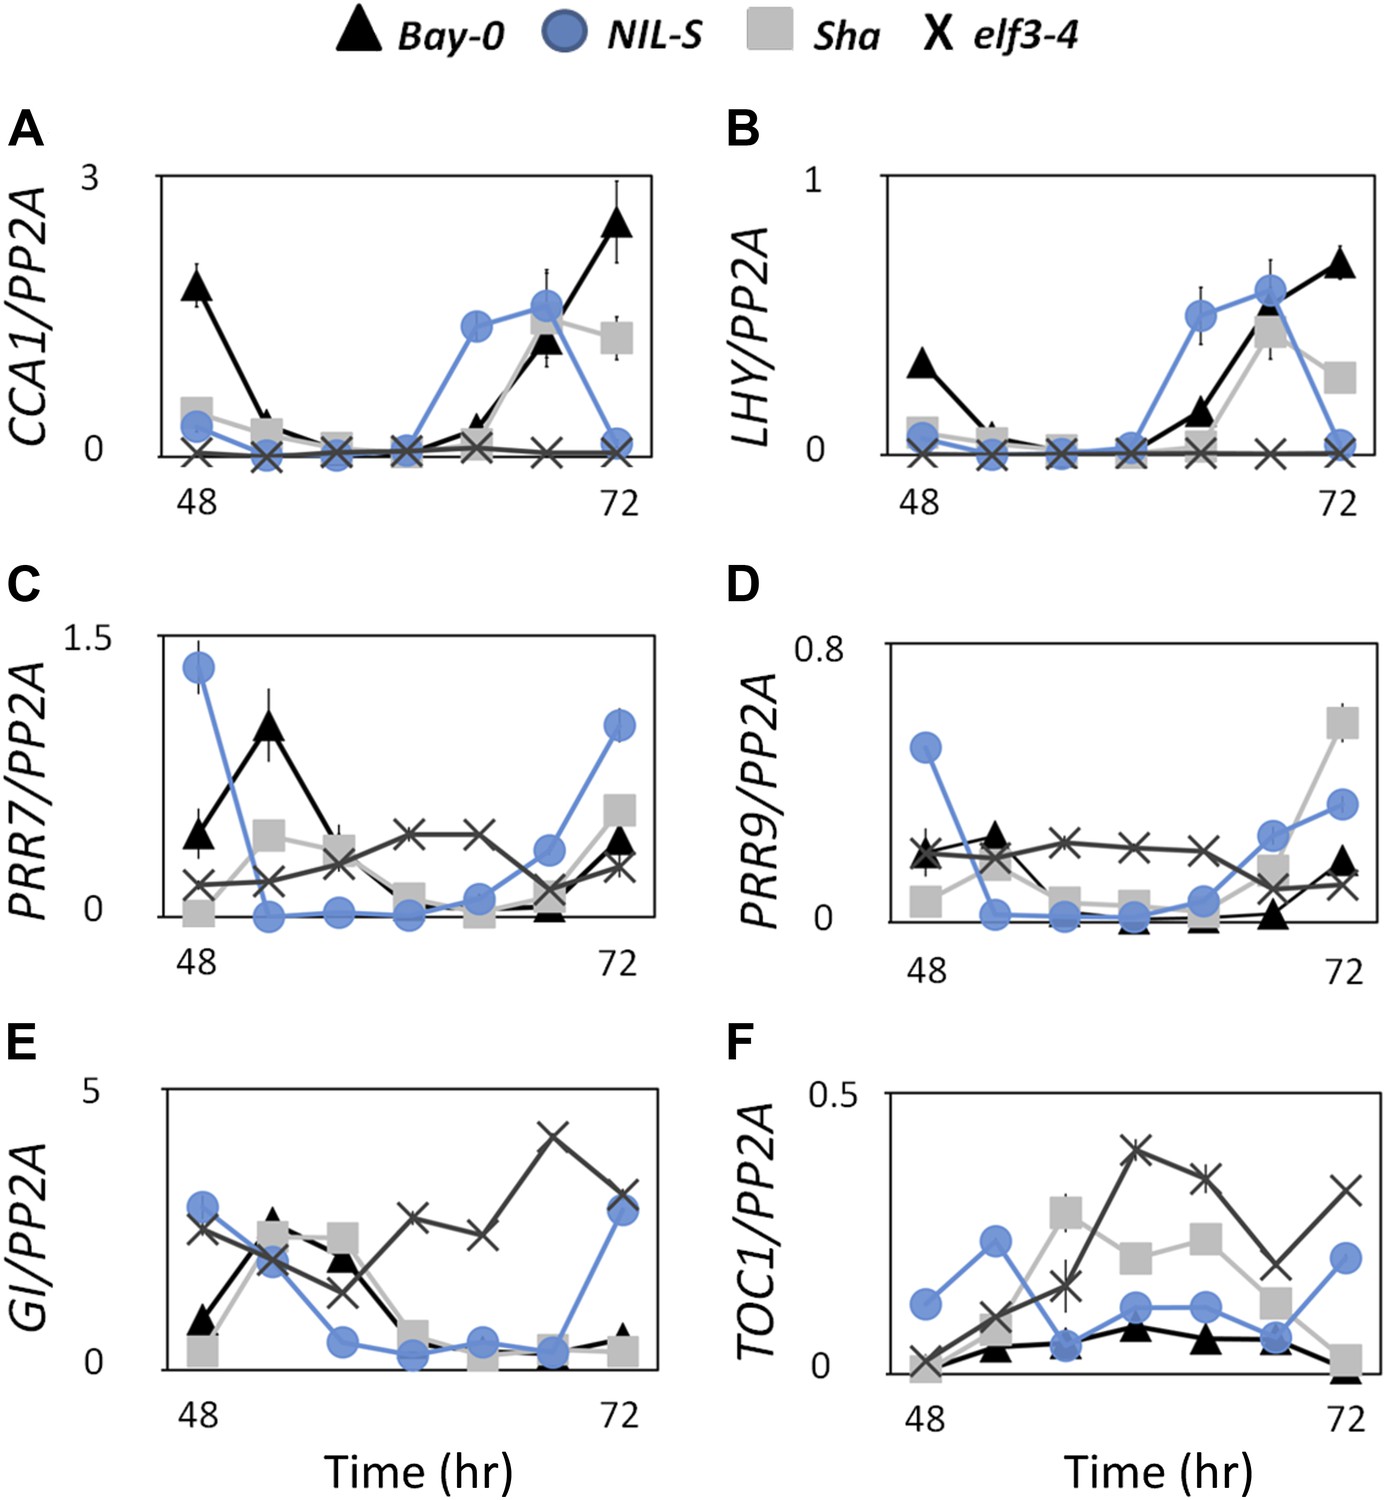
Transcript accumulation pattern of different clock genes under LL.
Transcript accumulation of different clock genes in Bay-0, Sha, NIL-S and elf3-4 under LL. (A) CCA1::LUC, (B) LHY::LUC, (C) PRR7::LUC, and (D) PRR9::LUC, (E) GI::LUC, and (F) TOC1::LUC. Error bars represent the standard deviation of three technical repeats. Expression levels are normalized for PROTEIN 19 PHOSPHATASE 2a subunit A3 (PP2A). Growth conditions, quantitative RT-PCR, and primer sequences were previously described (Kolmos et al., 2009; Kolmos et al., 2011).
Figure 12
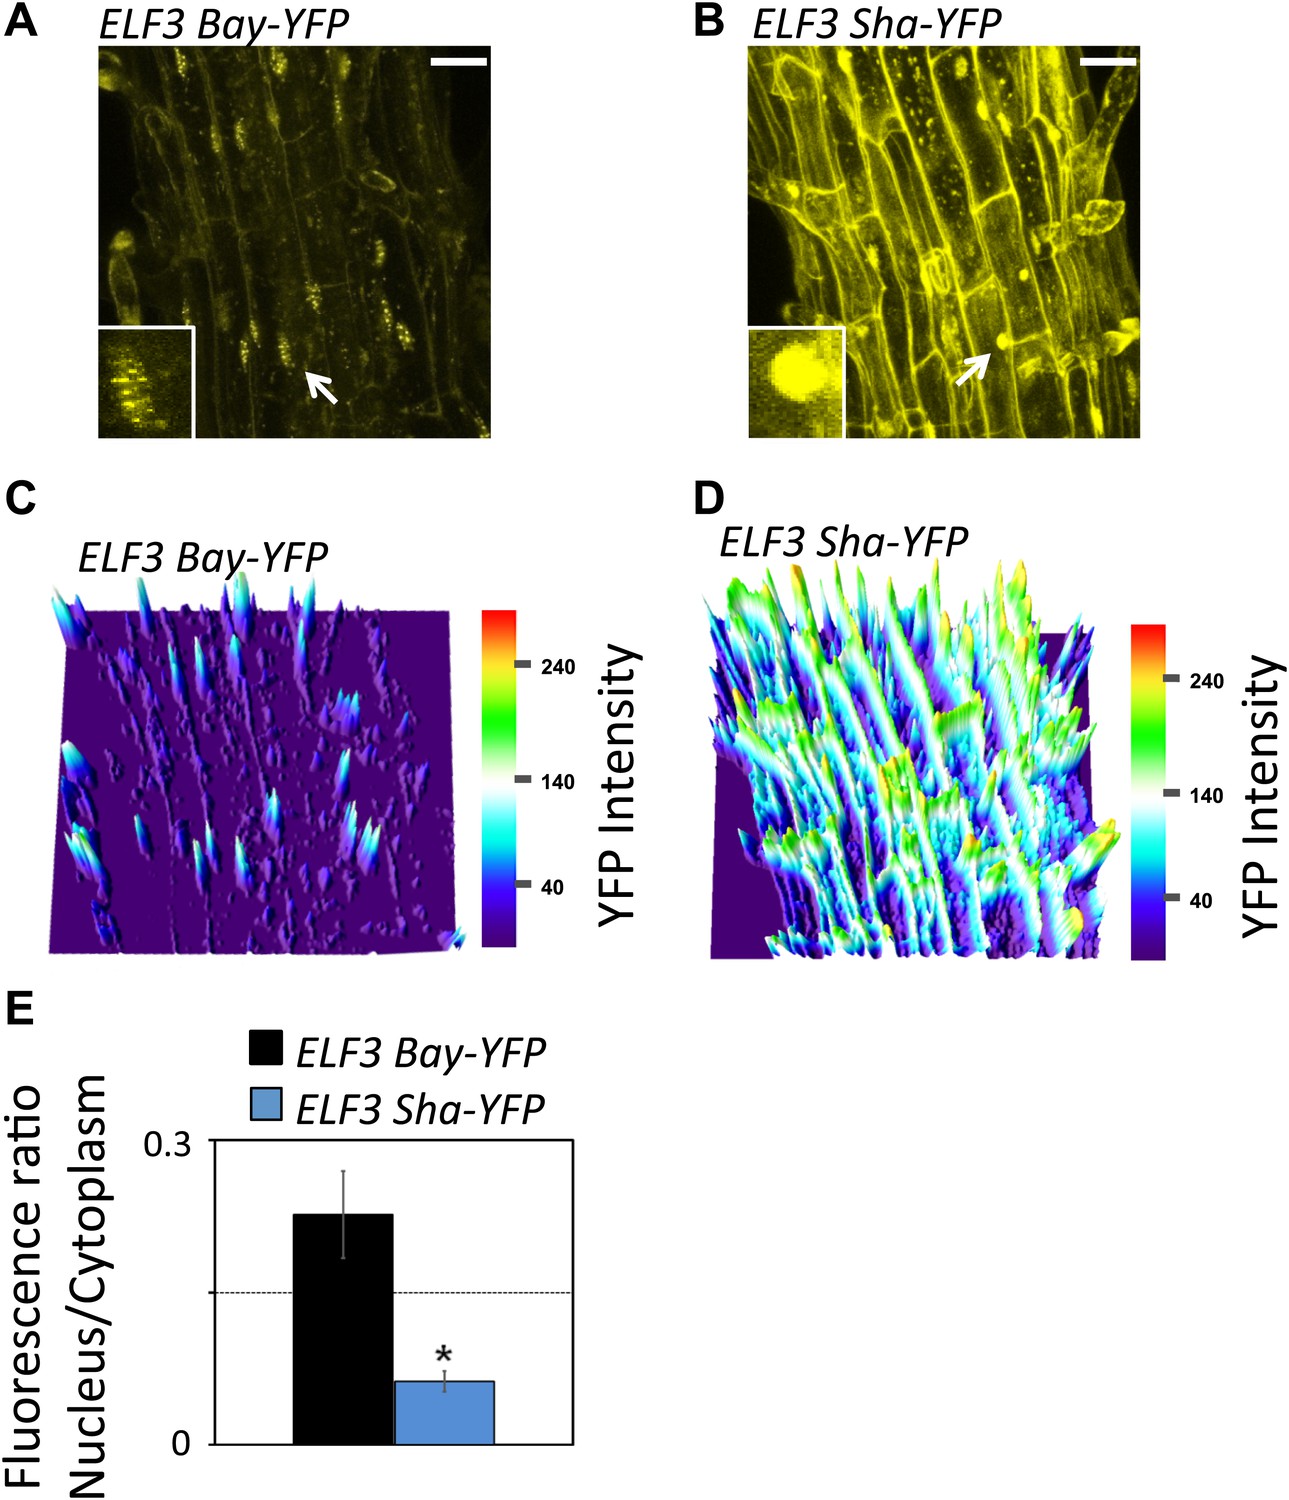
Sub-cellular localization defects of ELF3-Sha.
(A) and (B) show maximum intensity projection of ELF3-YFP localization in root cells of ELF3-Bay-YFP (A) and ELF3-Sha-YFP (B). Arrows indicate the nuclei that are magnified four times and shown in small boxes at the bottom of (A) and (B). Note that ELF3 forms distinct nuclear foci in ELF3-Bay, whereas in ELF3-Sha, YFP signal for ELF3 is diffused in the nucleus. Scale bar is 20 µm. (C) and (D) display the YFP intensity distribution of (A) and (B) in visual-thermal units, respectively. Note that the ELF3 cytoplasmic contents were higher in ELF3-Sha as compared to ELF3-Bay. (E) shows the nucleus-to-cytoplasmic fluorescence ratio of ELF3-Bay-YFP and ELF3-Sha-YFP, as calculated by ImageJ. Error bars represent SEM, n = 3. Significance as described in Figure 2. The representative data of three independent experiments and three independent lines are shown.
Figure 13
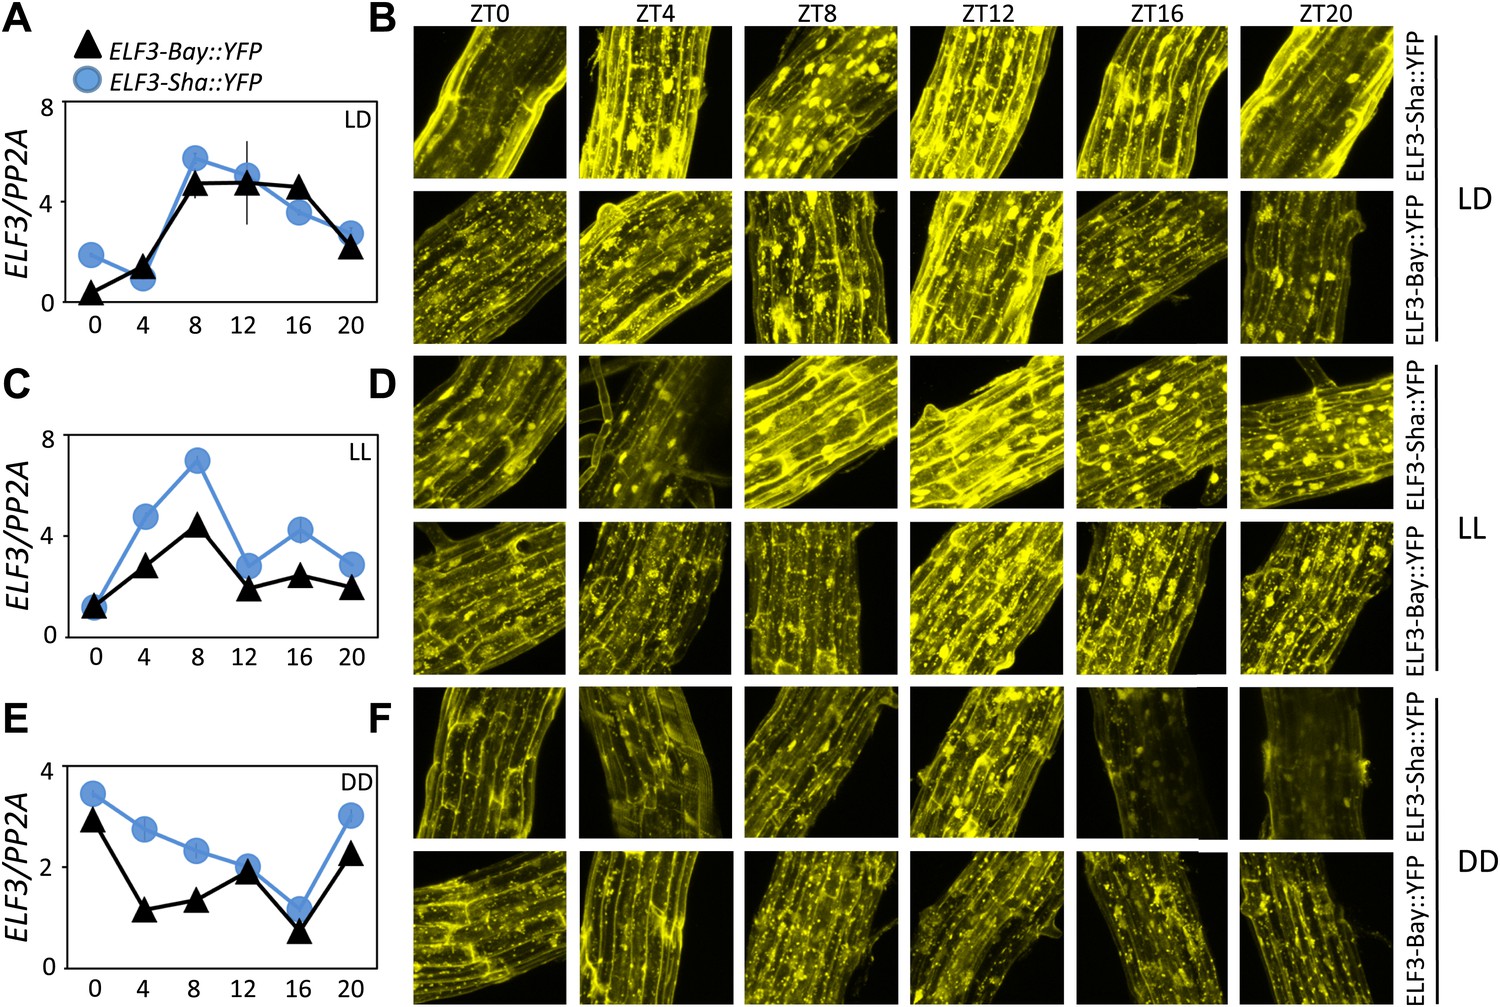
ELF3 cyclic accumulation is altered in ELF3-Sha.
Accumulation pattern of ELF3 transcript and encoded protein in ELF3-Bay-YFP and ELF3-Sha-YFP lines under LD (A and B), LL (C and D) and in DD (E and F). For LD, plants were grown under 12L:12D cycles for 6 days, and starting the next day at ZT0, plants were harvested every 4 hr for RNA extraction and then, separately, scanned under the microscope for cellular studies. For LL and DD, after initial entrainment, plants were transferred under white light or in darkness for 1 day, followed by harvesting the samples for RNA extraction or taking pictures for their respective zeitgeber time. This microscopic experiment was performed three times with similar results.
Figure 14
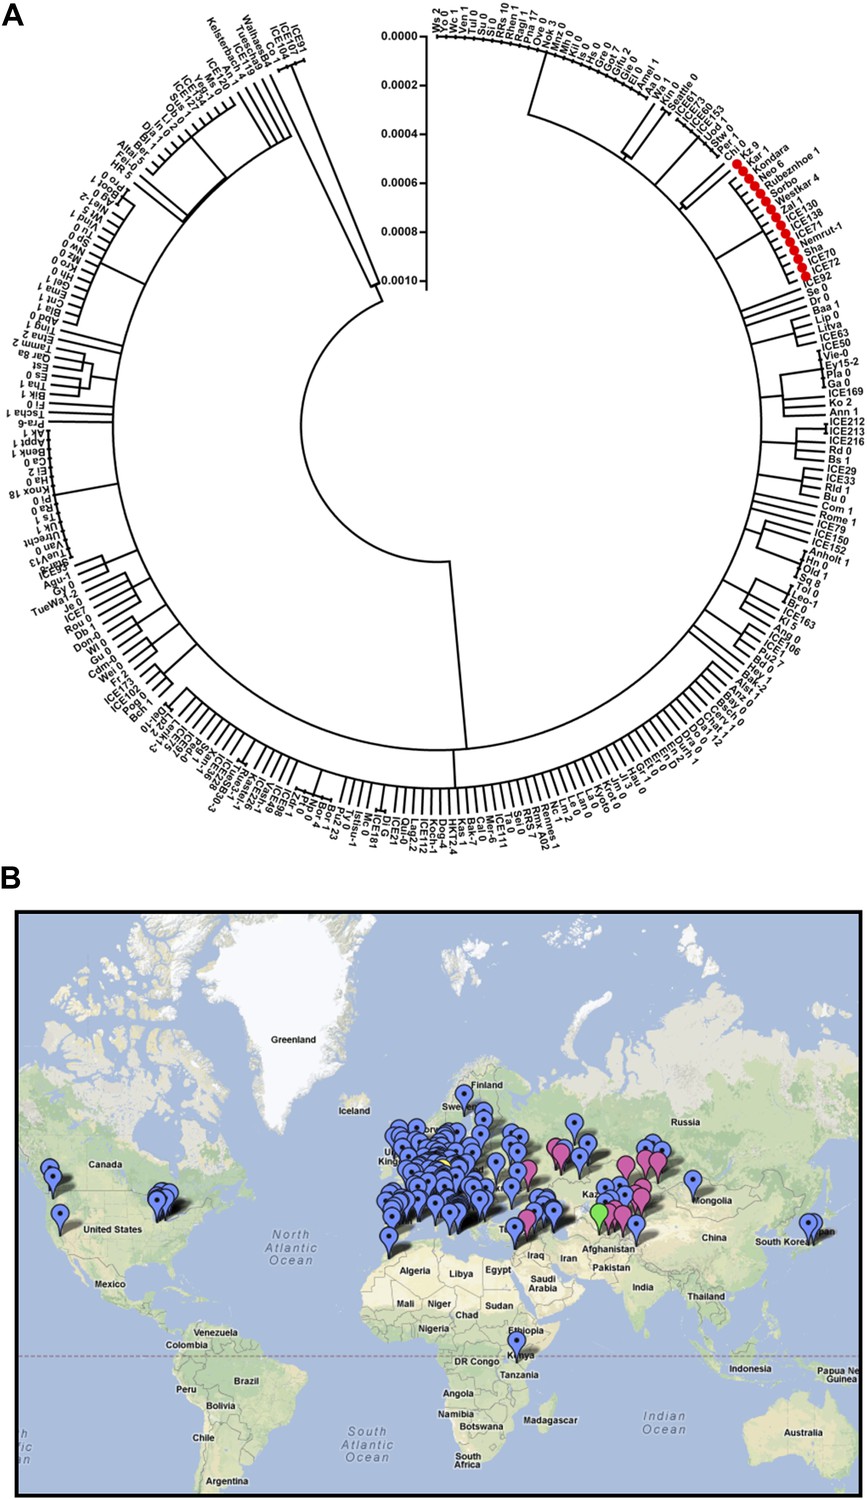
Distribution of the ELF3 locus.
(A) Neighbor-joining tree showing the phylogenetic relationship of ELF3 coding sequence of 251 accessions. All accessions harboring ELF3-Sha allele were grouped in a single clade indicated by red-filled circles. Scale represents the distance calculated by interior–branch test. Sites with gaps/missing data were not included in the analysis. (B) Geographical distribution of ELF3-Sha allele. Accessions harboring ELF3-Sha are shown with pink marks, whereas blue marks represent ELF3-Bay allele. Locations of Bay and Sha are shown with yellow and green marks, respectively.
Tables
Table 1
Circadian periodicity analysis of the BxS RILs after photic or thermal entrainment
| Zeitgeber | Mean* | S. E | 95% confidence interval | ||
|---|---|---|---|---|---|
| Lower bound | Upper bound | ||||
| BxS | LD | 26.702 | 0.035 | 26.633 | 26.771 |
| TMP | 26.269 | 0.034 | 26.202 | 26.335 | |
| LD-TMP | BxS | |
|---|---|---|
| Pairwise comparisons | Mean difference (hr) | 0.433 |
| S. E | 0.047 | |
| Significance | <0.001 | |
| Correlations | Correlation coefficient | 0.86 |
| Significance | 0.001 | |
-
LD stands for photic-zeitgeber and TMP for thermal-zeitgeber.
-
*
denotes the modified population marginal mean for the 95% Confidence Interval.
-
S.E. denotes standard error.
-
LD-TMP denotes the pairwise comparisons such that TMP period is subtracted from LD period.
Table 2
Statistical analysis of CCR2 circadian periodicity after the two zeitgeber protocols for BxS population
| Overall model | Univariate BxS | |
|---|---|---|
| Factor | F | P |
| Genotype | 7.753 | <0.001 |
| Environment | 36.413 | <0.001 |
| Environment*Genotype | 2.183 | <0.001 |
| Univariate LD | CV LD | Univariate TMP | CV TMP | ||||
|---|---|---|---|---|---|---|---|
| F | P | F | P | ||||
| BxS | RIL | 10.387 | <0.001 | 18.043 | 7.382 | <0.001 | 16.498 |
| TRANS (RIL) | 1.513 | <0.001 | 1.915 | <0.001 | |||
-
F = mean sum of squares\error sum of squares. P = significance value of the F-ratio.
-
Genotype denotes RIL, ENVIRONMENT denotes the different entrainments, TRANS denotes independent transformants of each genotype.
-
*
denotes the testing of an interaction between two factors, whereas B(A) denotes the testing main factor A in which a factor B is nested.
-
CV is the coefficient of genetic variation, LD stands for photic and TMP stands for thermal entrainment.
-
NS denotes nonsignificance.
Table 3
Localization of the main QTLs for the BxS population after photic vs thermal zeitgeber protocols
| Zeitgeber | H2 | Chromosome | Position | LOD score (*) | % expl variance | F | p value | 2a |
|---|---|---|---|---|---|---|---|---|
| (cM) | (h) | |||||||
| LD | 0.76 | I | 63.7 | 3.21 | 14.9 | 7.704 | 0.007 | −0.614 |
| II | 34.5 | 5.72 | 27.3 | 20.784 | <0.001 | 1.003 | ||
| IV | 69.9 | 3.89 | 17.1 | 14.003 | <0.001 | 0.833 | ||
| TMP | 0.73 | II | 34.5 | 4.56 | 25.5 | 25.033 | <0.001 | 0.988 |
| IV | 69.9 | 3.26 | 16.2 | 6.501 | 0.014 | 0.508 |
-
H2 denotes broad sense heritability.
-
(cM) denotes centiMorgan.
-
(*) LOD- score threshold was determined at 2.4.
-
% expl variance is the percent of explained variance.
-
F = mean sum of squares\error sum of squares.
-
P denotes the significance value of the F-ratio.
-
2a denotes the additive effect of Bay allele when the effect of the Sha allele on period is subtracted.
-
(h) denotes the effect in hours.
-
− denotes that the Sha allele displayed longer period than that of Bay allele.
Table 4
Geographical location of the 15 accessions with ELF3-Sha allele
| Abbreviation | Name | Stock ID | Country | Location | Latitude | Longitude | Altitude |
|---|---|---|---|---|---|---|---|
| ICE130 | Kolyvan/Kly-4 | CS76384 | Russia | Kolyvan | 51.32 | 82.55 | 505 |
| ICE138 | Lebjashje/Leb-3 | CS76426 | Russia | Altaijskij Kraj | 51.65 | 80.82 | 301 |
| ICE70 | Borskoje/Borsk-2 | CS76421 | Russia | Samarskaja Oblast | 53.04 | 51.75 | 75 |
| ICE71 | Shiguljovsk/Shigu-1 | CS76375 | Russia | Samarskaja Oblast | 53.33 | 49.48 | 181 |
| ICE72 | Shiguljovsk/Shigu-2 | CS76374 | Russia | Samarskaja Oblast | 53.33 | 49.48 | 181 |
| Kar1 | Karakol | CS76522 | Kyrgyzstan | Susamyr village/West Karakol river | 42.3 | 74.36 | 2503 |
| Kondara | Kondara | CS76532 | Tadjikistan | Khurmatov | 38.5 | 68.5 | 815 |
| Kz9 | Kazakhstan | CS76537 | Kazakhstan | Karagandy | 49.67 | 73.33 | 535 |
| Nemrut | Nemrut-1 | CS76398 | Turkey | Nemrut Dag | 38.64 | 42.23 | 2249 |
| Neo6 | Neo6 | CS76560 | Tajikistan | Jawshangoz village | 37.35 | 72.46 | 3467 |
| Rubenzhoe | Rubenzhoe-1 | CS76594 | Ukraine | Rubezhnoe | 49.01 | 38.36 | 56 |
| Sha | Shakdara | CS76382 | Tadjikistan | Pamiro-Alay | 38.90 | 69.05 | 3439 |
| Sorbo | Sorbo | CS22653 | Tadjikistan | 38.82 | 69.48 | 1751 | |
| Westkar4 | West Karakol | CS76629 | Kyrgyzstan | Karakol valley | 42.3 | 74 | 2187 |
| Zal1 | Zal1 | CS76634 | Kyrgyzstan | Tchong-Kemin valley/Djachyl-Kul lake | 42.8 | 76.35 | 2230 |
Additional files
-
Supplementary file 1
RIL periodicity of CCR2::LUC in BxS after photic entrainment.
- https://doi.org/10.7554/eLife.02206.021
-
Supplementary file 2
RIL periodicity of CCR2::LUC in BxS after thermal entrainment.
- https://doi.org/10.7554/eLife.02206.022
-
Supplementary file 3
Detail of primers used.
- https://doi.org/10.7554/eLife.02206.023
Download links
A two-part list of links to download the article, or parts of the article, in various formats.
Downloads (link to download the article as PDF)
Open citations (links to open the citations from this article in various online reference manager services)
Cite this article (links to download the citations from this article in formats compatible with various reference manager tools)
Natural variation reveals that intracellular distribution of ELF3 protein is associated with function in the circadian clock
eLife 3:e02206.
https://doi.org/10.7554/eLife.02206


