Structural basis for the assembly of the mitotic motor Kinesin-5 into bipolar tetramers
- University of California, Davis, United States
Figures
Figure 1 with 1 supplement
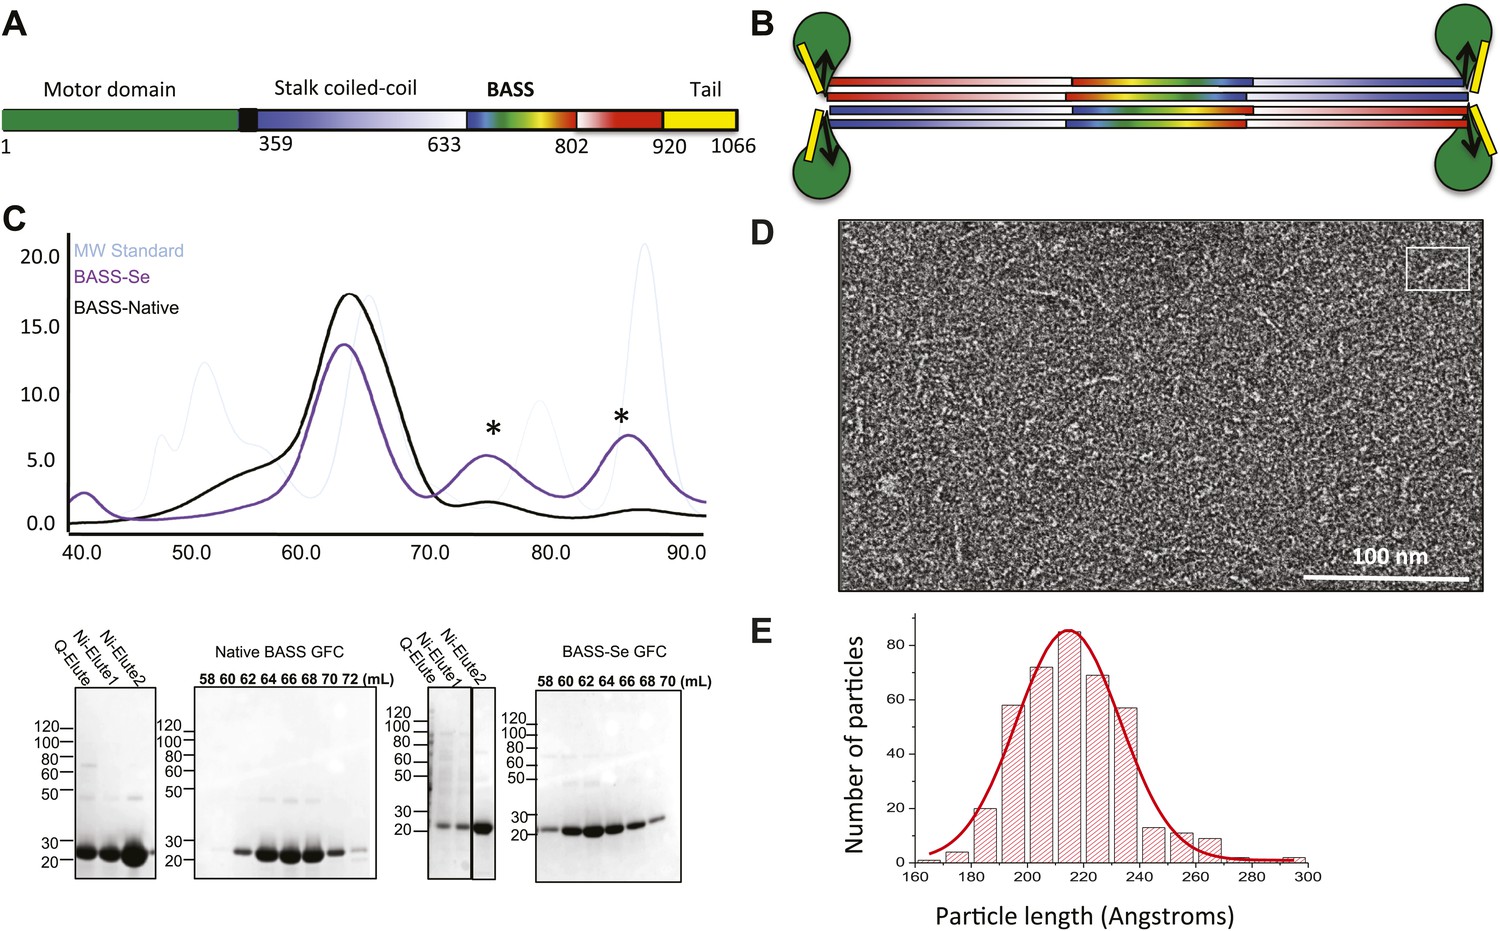
The Kinesin-5 BASS domain is an anti-parallel coiled-coil four-helix bundle that switches polypeptide partners at both ends.
(A) Schematic domain structure of a Drosophila Kinesin-5 subunit (KLP61F). The bipolar assembly (BASS domain) is denoted by rainbow colors. The motor domain, N-terminal coiled-coil domain, the C-terminal helical domain, and tail domain are shown in green, blue, red, and yellow respectively. (B) Schematic of the Kinesin-5 tetramer. (C) Upper panel: Gel filtration (also known as, size exclusion or molecular sieve) chromatography (GFC) of BASS and Selenium-substituted BASS (BASS-Se); lower panel, purification steps of BASS and SDS-PAGE of GFC fractions. Table 2 describes measured hydrodynamic properties of wt-BASS protein. (D) Negative stain electron microscopy (EM) of BASS tetramers. (E) Statistical analysis of BASS lengths measured using negative stain EM images describes an average length of 220 Å.
Figure 1—figure supplement 1
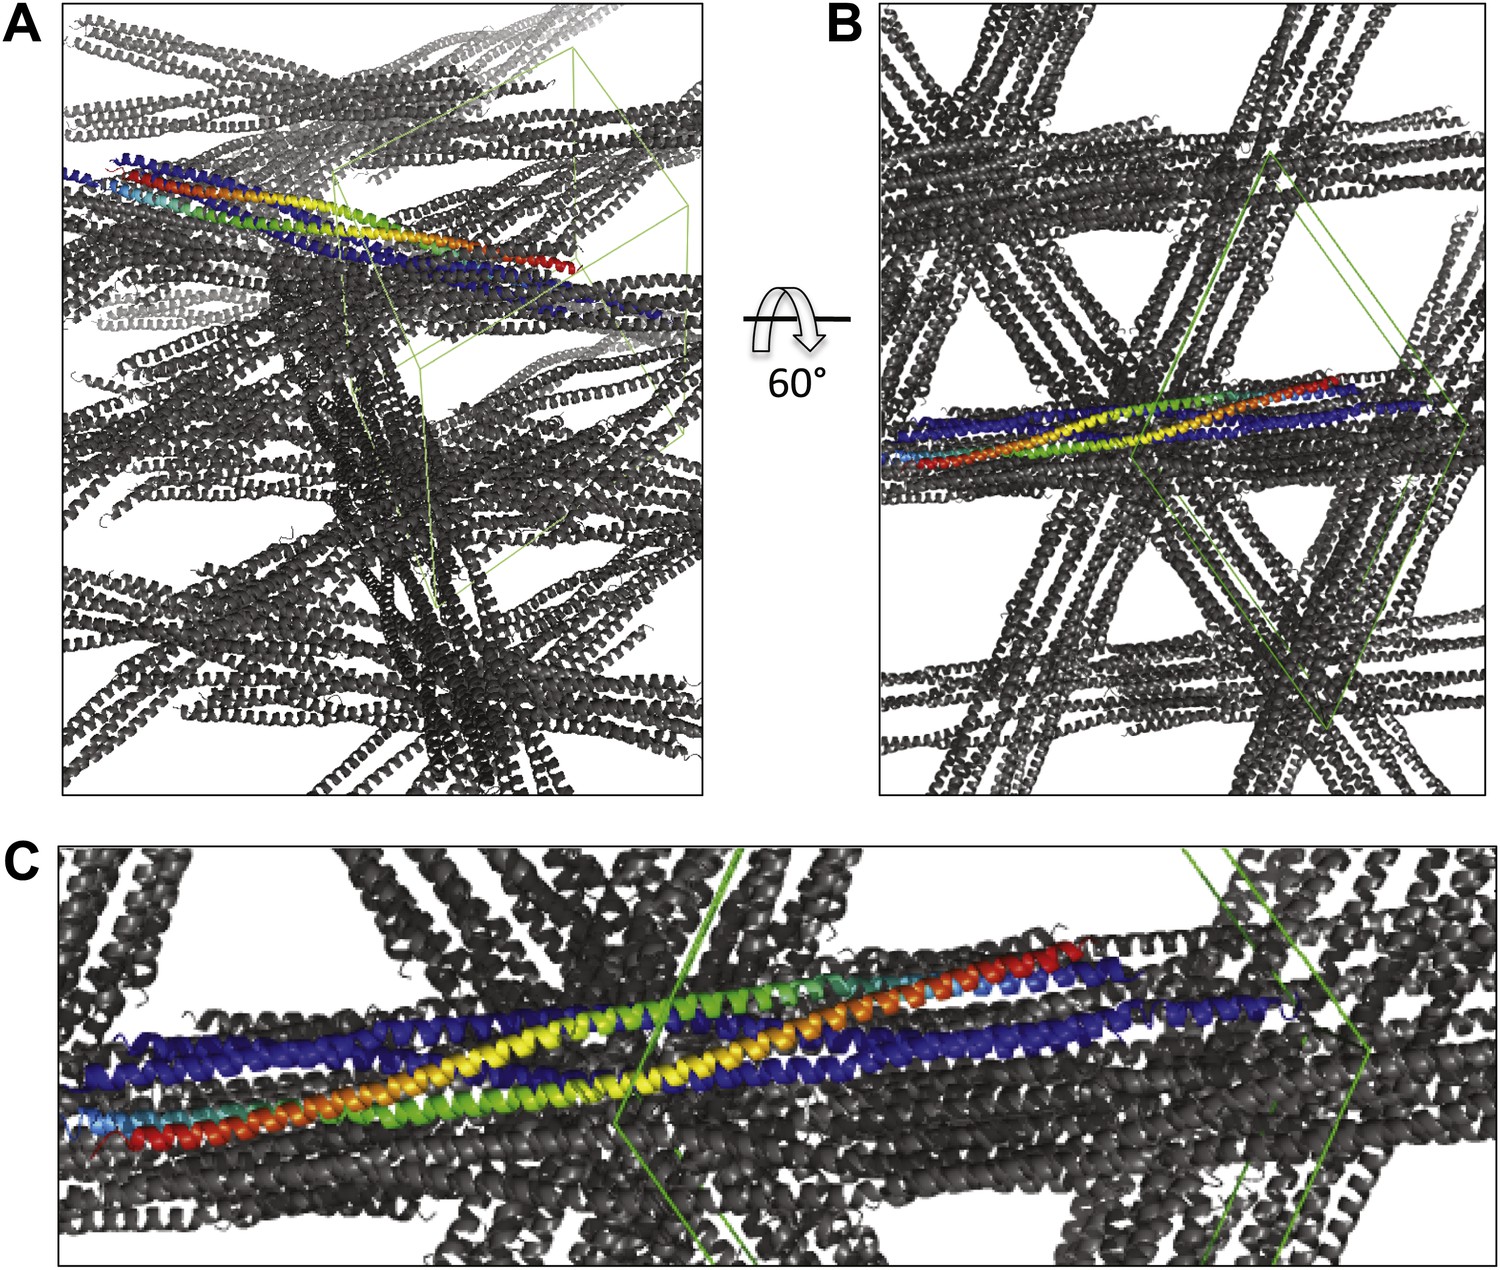
Views of the BASS crystal unit cell displaying the packing of two BASS-dimer asymmetric units within the P6422 unit cell.
https://doi.org/10.7554/eLife.02217.004
Figure 2
The crystal structure of the Kinesin-5 BASS domain tetramer:
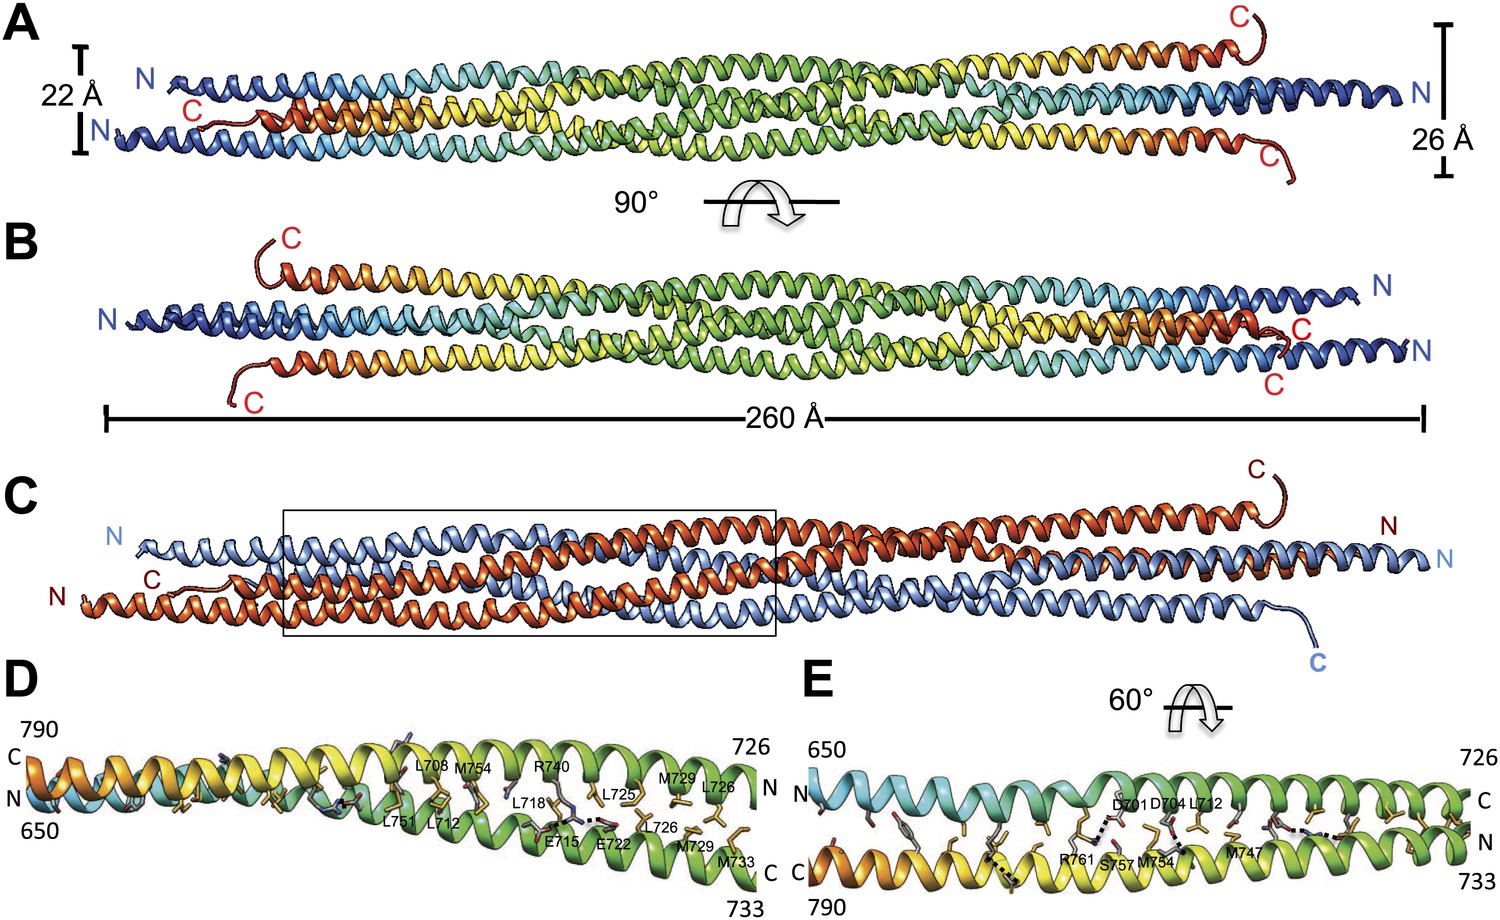
(A) Side view of the crystal structure of the KLP61F BASS tetramer (residues 640–796 shown) colored in rainbow, starting with N-termini in blue traversing to C-termini in red, respectively. Four monomers pack as anti-parallel pairs of anti-parallel coiled-coil dimers. (B) shows the BASS structure rotated 90° around the filament axis relative to panel A. The dimensions of the BASS tetramer bundle structure are shown. (C) Side view of the BASS tetramer, with two BASS anti-parallel dimers colored in blue and red, respectively. (D) Detailed interaction between two monomers in the BASS anti-parallel dimer. (E) A 60° rotated view of D.
Figure 3
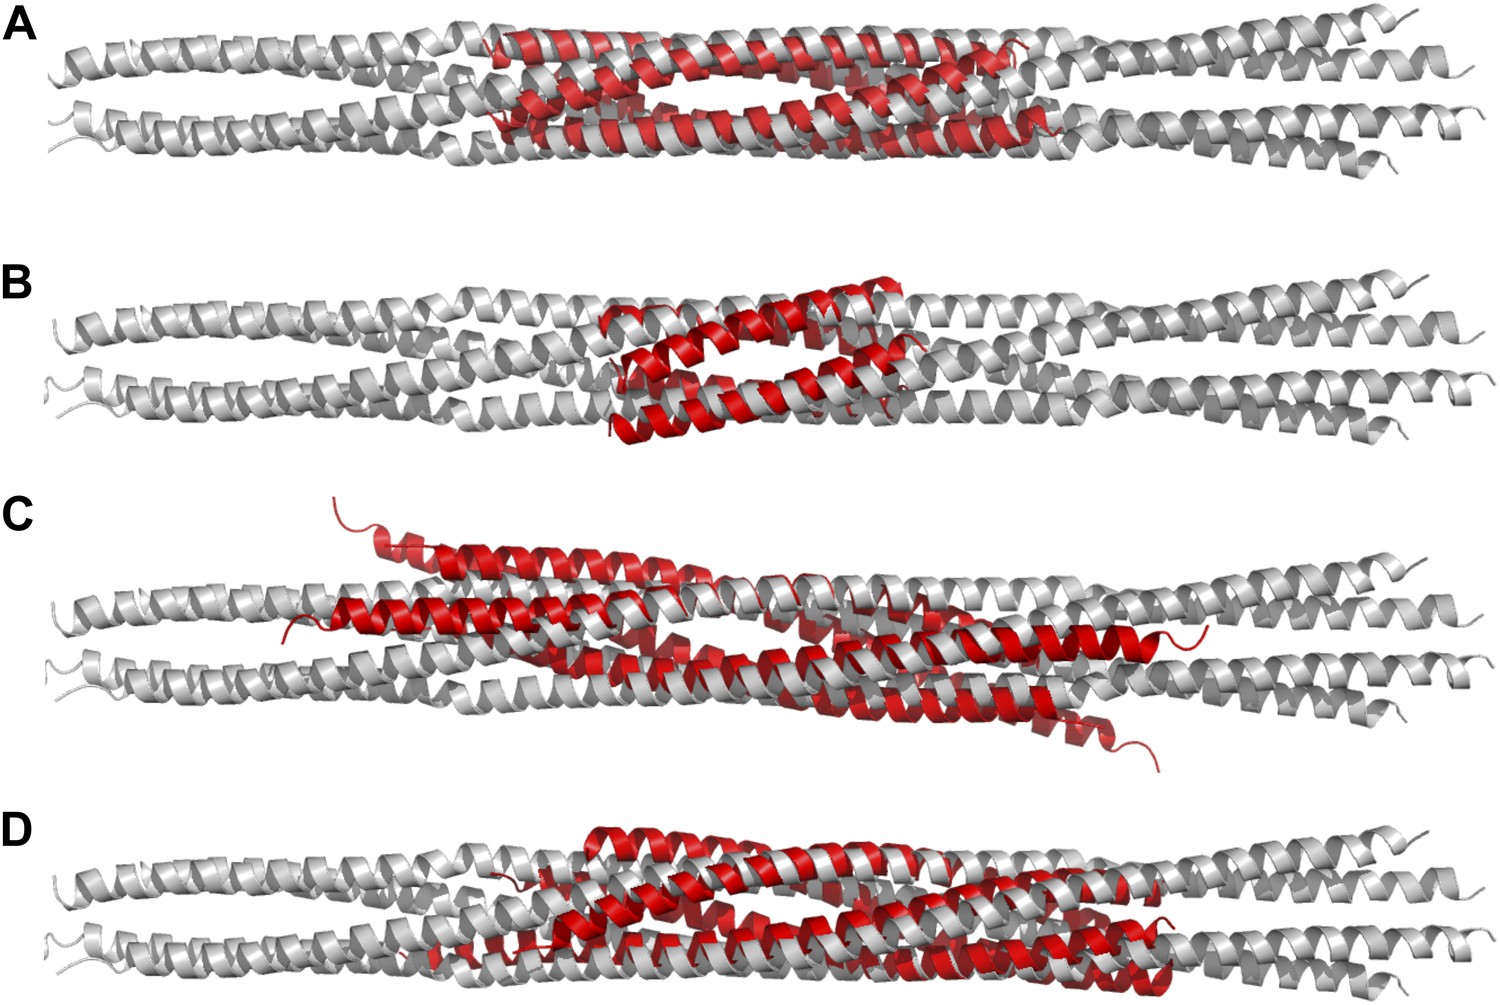
Structural comparisons of BASS structure with other four-helix bundles:
BASS was compared to other four-helix bundles by superimposing α-carbon chains of these structures to the BASS structure using the lowest RMSD alignment in the program Pymol. Each of the following structures, shown in red, is superimposed onto the Kinesin-5 BASS, shown in gray: (A) Anti-parallel coiled-coil tetramerization domain of TrpM7 (PDB ID: 3E7K). (B) A GCN4-like designed anti-parallel coiled-coil (PDB ID: 1UNX). (C) A truncated neuronal SNARE complex (PDB ID:1N7S) (D) coiled-coil domain of tumor suspectibility gene 1 (TSG1) (PDB ID: 3IV1).
Figure 4
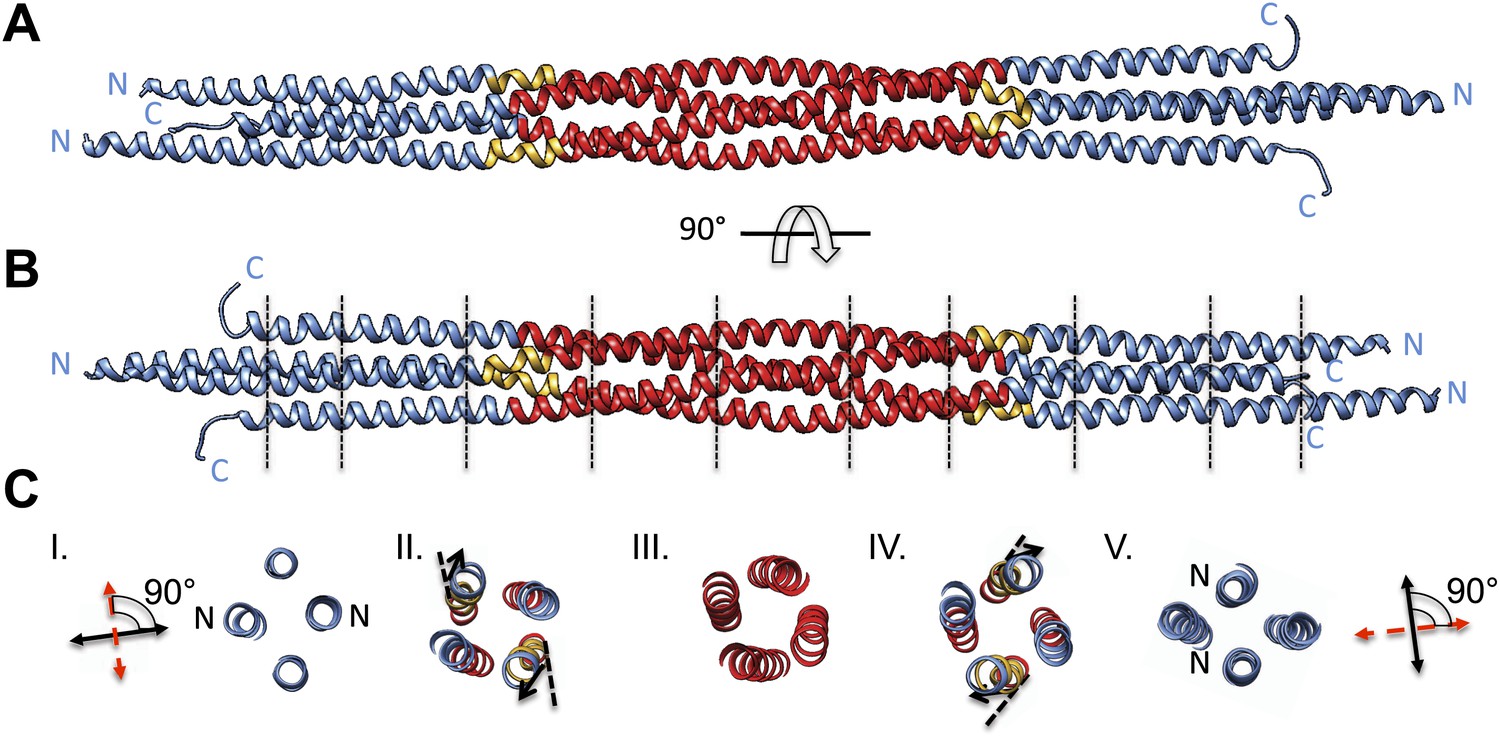
BASS tetramer consists of two regions with unique helical organizations.
(A and B) Side view of the BASS structure, colored to mark two structural regions related by a dyad axis. The central bundle is shown in red. Two elbow regions (shown in gold) cause bends in N-terminal BASS helices to form the end regions. The end bundles, shown in blue, are asymmetric diamond-shaped four-helix bundles. The N-terminal helices are brought in close proximity to form parallel coiled-coils at the poles of the BASS tetramer, whereas the C-terminal helices are repositioned to be further away from the bundle center axis. Panel B is a 90-degree rotation of panel A. The lines in panel B represent regions where cross-section views of the structure are presented in part C. (C) Cross-section views of BASS using boundaries described in B. Panel I and V describe polar regions of the end bundles (note that N-terminal helices are closer together) and reveal their rotational offset by 90-degrees around the filament axis. Panels II and IV show the transition region between the central and end bundle regions with the elbows inducing a change in helical trajectory. Panel III shows a cross section of the central bundle region. Note that the helices in this region are fourfold symmetric around the central filament axis.
Figure 5 with 1 supplement
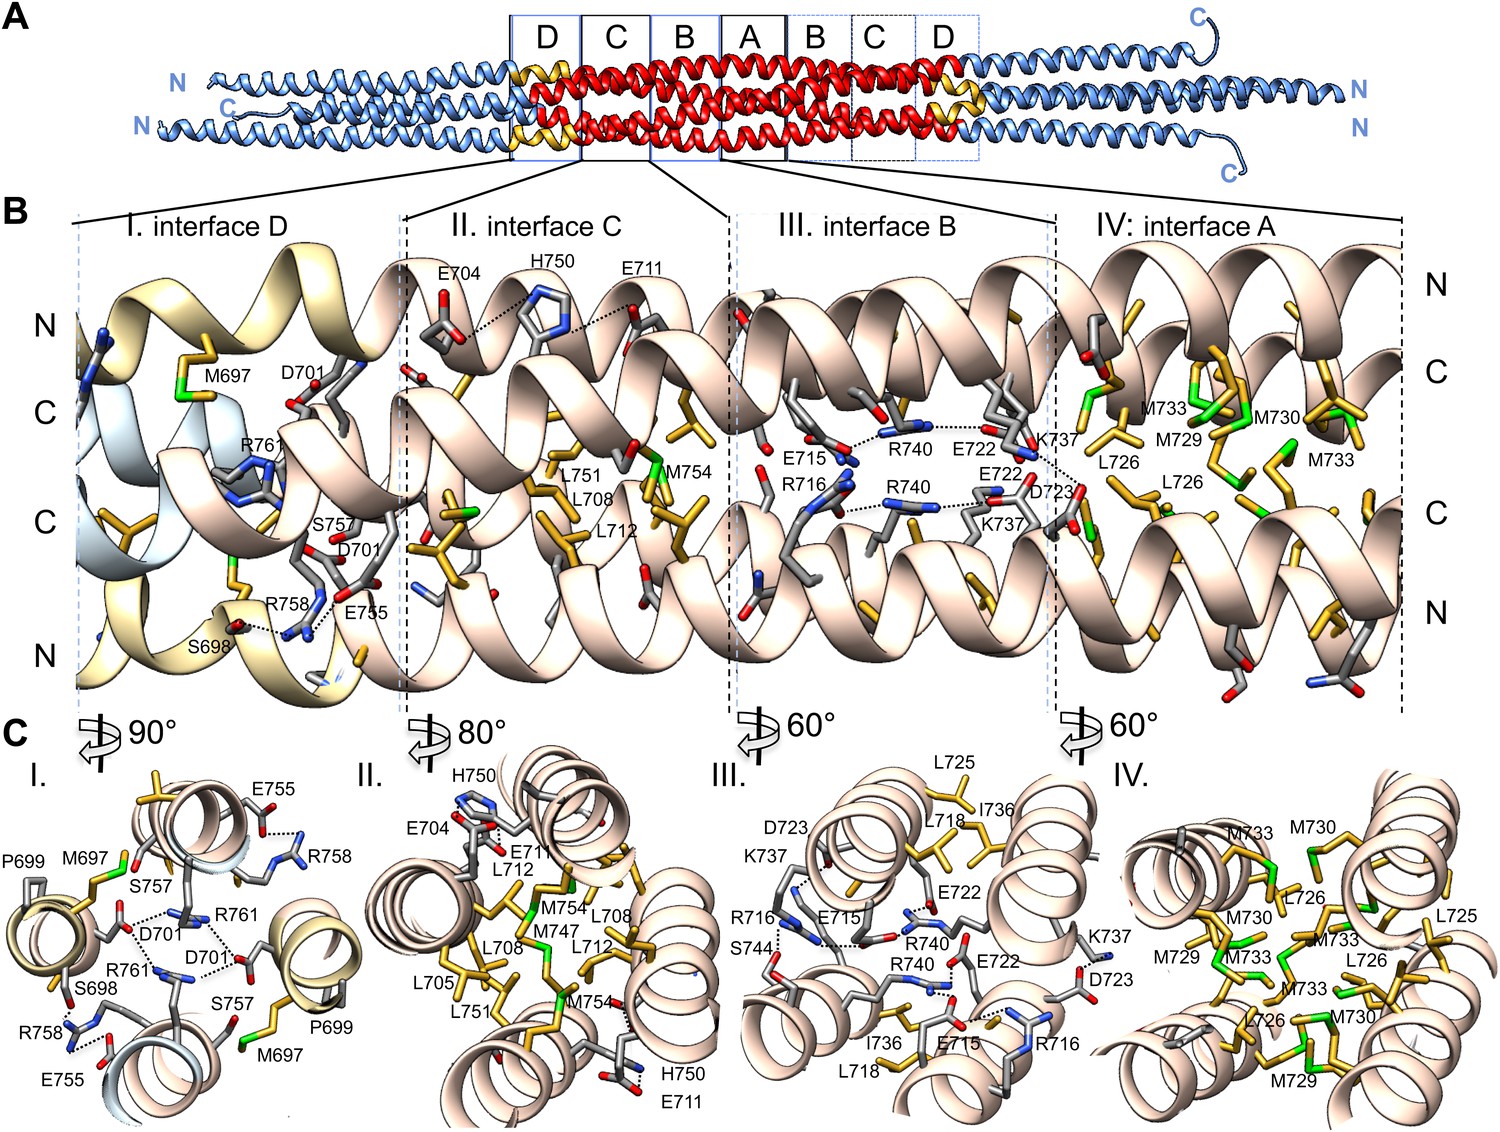
The BASS central bundle is assembled through an alternating pattern of antiparallel hydrophobic and ionic interfaces.
(A) Full side-view of the BASS structure as shown in Figure 4, describing the regions of the BASS bundle, termed interfaces A–D. Interfaces B, C and D are twofold symmetric and extend outward from a single interface A. (B) Detailed side view of the left side of the central bundle region depicting interfaces D, C, B, and A, respectively. Panel (I), a side view of interface D: Residues Arg761 bind Asp701 from anti-parallel helices and Arg758 binds Glu755 and Ser698 of the non-partner helices. Panel (II), a side view of interface C: Leu705, Leu708, and Leu712 from two helices pack against Met747, Leu751, and Met754 of the anti-parallel helices, in a four-helical interface. Glu704, Glu711 form salt bridges with His750 of the anti-parallel helices away from the bundle axis. Panel (III), side view of interface B where Arg740 forms salt bridges with Glu715 and Glu722 of the anti-parallel helices. Lys716 forms salt bridges with Glu715, while Lys737 forms a salt bridge to Glu723 of the non-partner anti-parallel helices. Panel (IV), side view of interface A: Leu725 and Leu726 pack against Met729, Met730, and Met733 in four-way helical packing. (C) Detailed cross-section view of interfaces A, B, C, and D showing the same residues described above. Panels I–IV are cross sections of corresponding views shown in B, but rotated by either 60, 80 or 90° across the filament axis.
Figure 5—figure supplement 1

Surface electrostatic potential view of BASS tetramer interfaces.
(A) Single dimer in the BASS tetramer is shown in electrostatic potential bound to a second dimer in ribbon format. Residues shown are described in Figure 5. (B) 90° rotated views compared A. The surface electrostatic potential for the BASS dimer is calculated using Adaptive Poisson-Boltzmann Algorithm and displayed using a −10 to 10 threshold Kcal/mol e−1. The electrostatic surfaces show the extremely complementary charge distribution across the surface of the two dimers at the two ionic interfaces B and D.
Figure 6
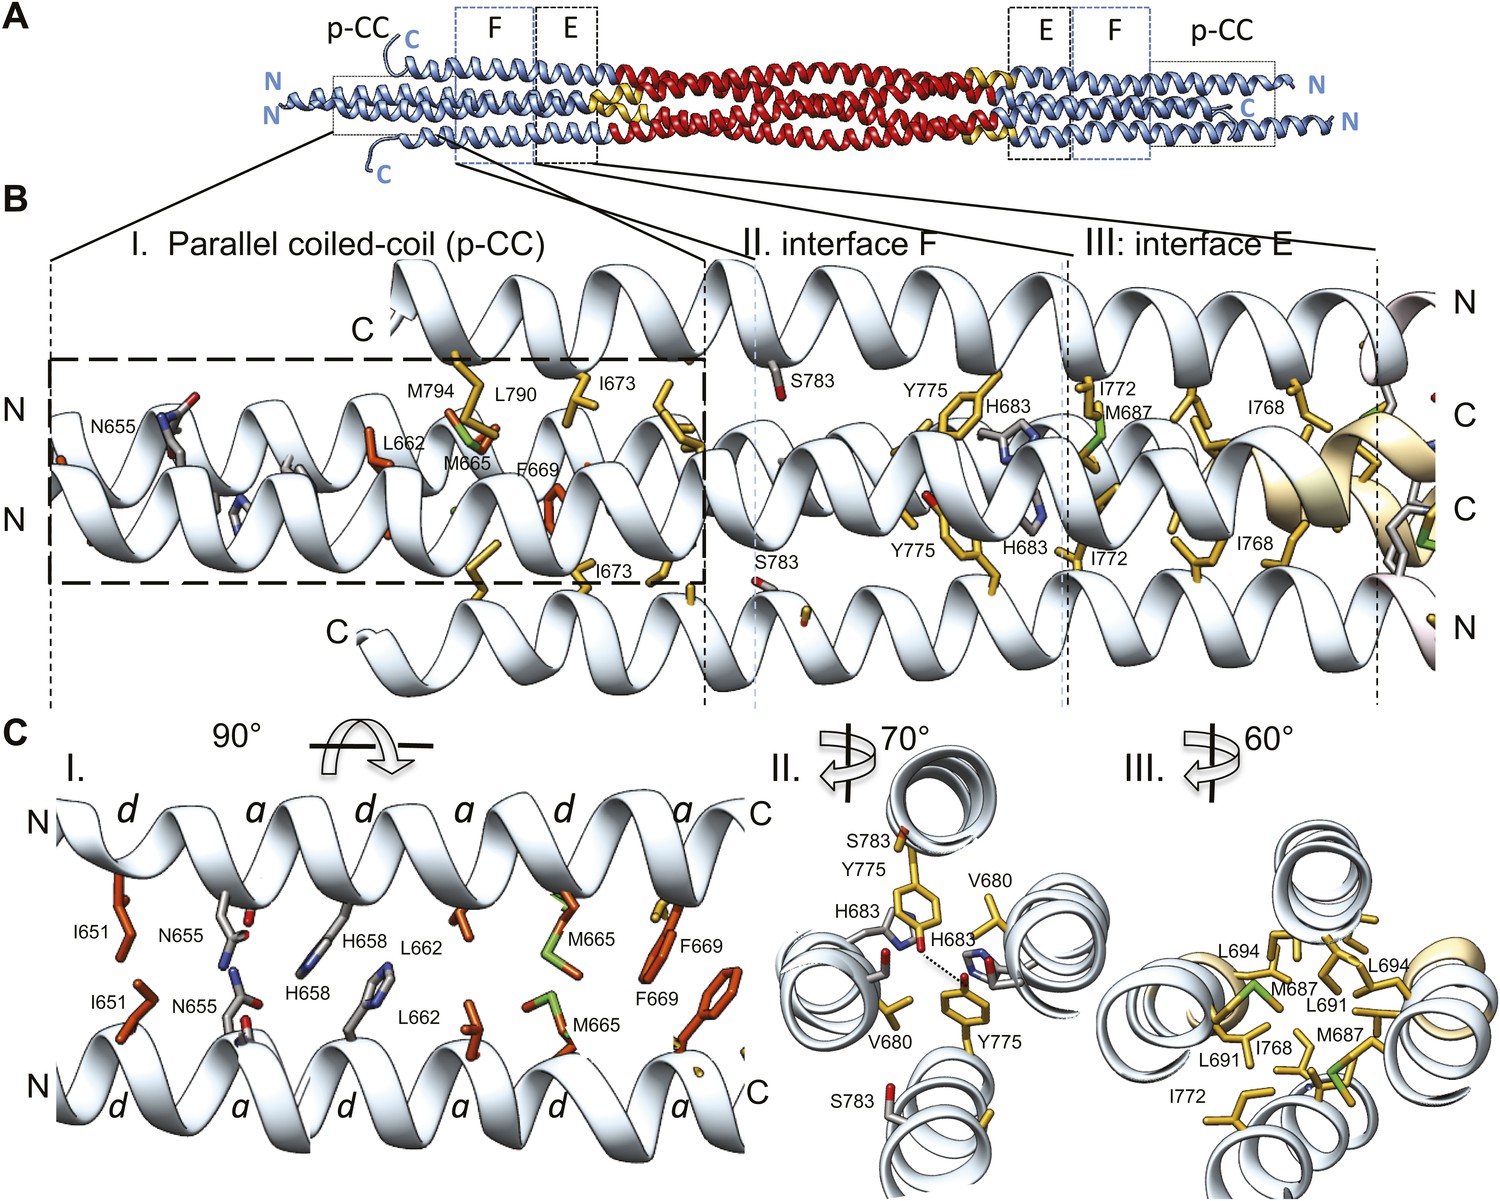
The tetrameric BASS domain N-terminal ends swap partners to form parallel coiled-coils at the bipolar filament ends.
(A) Full side-view of the BASS structure as shown in Figure 4, describing the regions of the BASS bundle. Interfaces E, F and the parallel coiled-coil interface (p-CC) are marked. (B) Detailed view of the end bundle interfaces showing the left side bundle of the BASS tetramer including the p-CC and interfaces F and E, respectively. Panel (I), side view of the parallel coiled-coil interfaces formed by residues in the N-terminus of BASS (residues 650–6700). Residues mediating a heptad repeat hydrophobic interaction are shown in orange and include Ile651, Leu662, Met665, and Phe669. C-terminal helices also bind this region using hydrophobic interfaces. Panel (II), side view of the interface F: Tyr775 binds Tyr775 through an end-to-end ring packing, supported by His683 π–π packing against the Tyr775 ring residue. This interface positions the C-terminal helices further away from the bundle axis. The remainder of the helical bundle contains small or non-interacting residues such as Ser783. Panel (III), side view of interface E: residues Met687, Leu691, and Leu694 of two helices packed against Ile768 and Ile772 of the anti-parallel helices in a four-helical bundle interface. (C) Top-to-bottom and cross-section views of the end bundle interfaces. These views are rotated by the angle described from views shown in part B, panels I, II, III, respectively. Panel I shows a top-to-bottom view of the parallel coiled-coil of two N-terminal helices. The heptad interactions are marked a and d. In total, the ‘a’ and ‘d’ positions of three heptads are observed. Phe669 packs against Phe669 to stabilize the helical ‘swap’ in this region. Panel II is a cross-sectional view of interface F rotated 70°. Panel III shows a cross-sectional view of interface E rotated 60°.
Figure 7
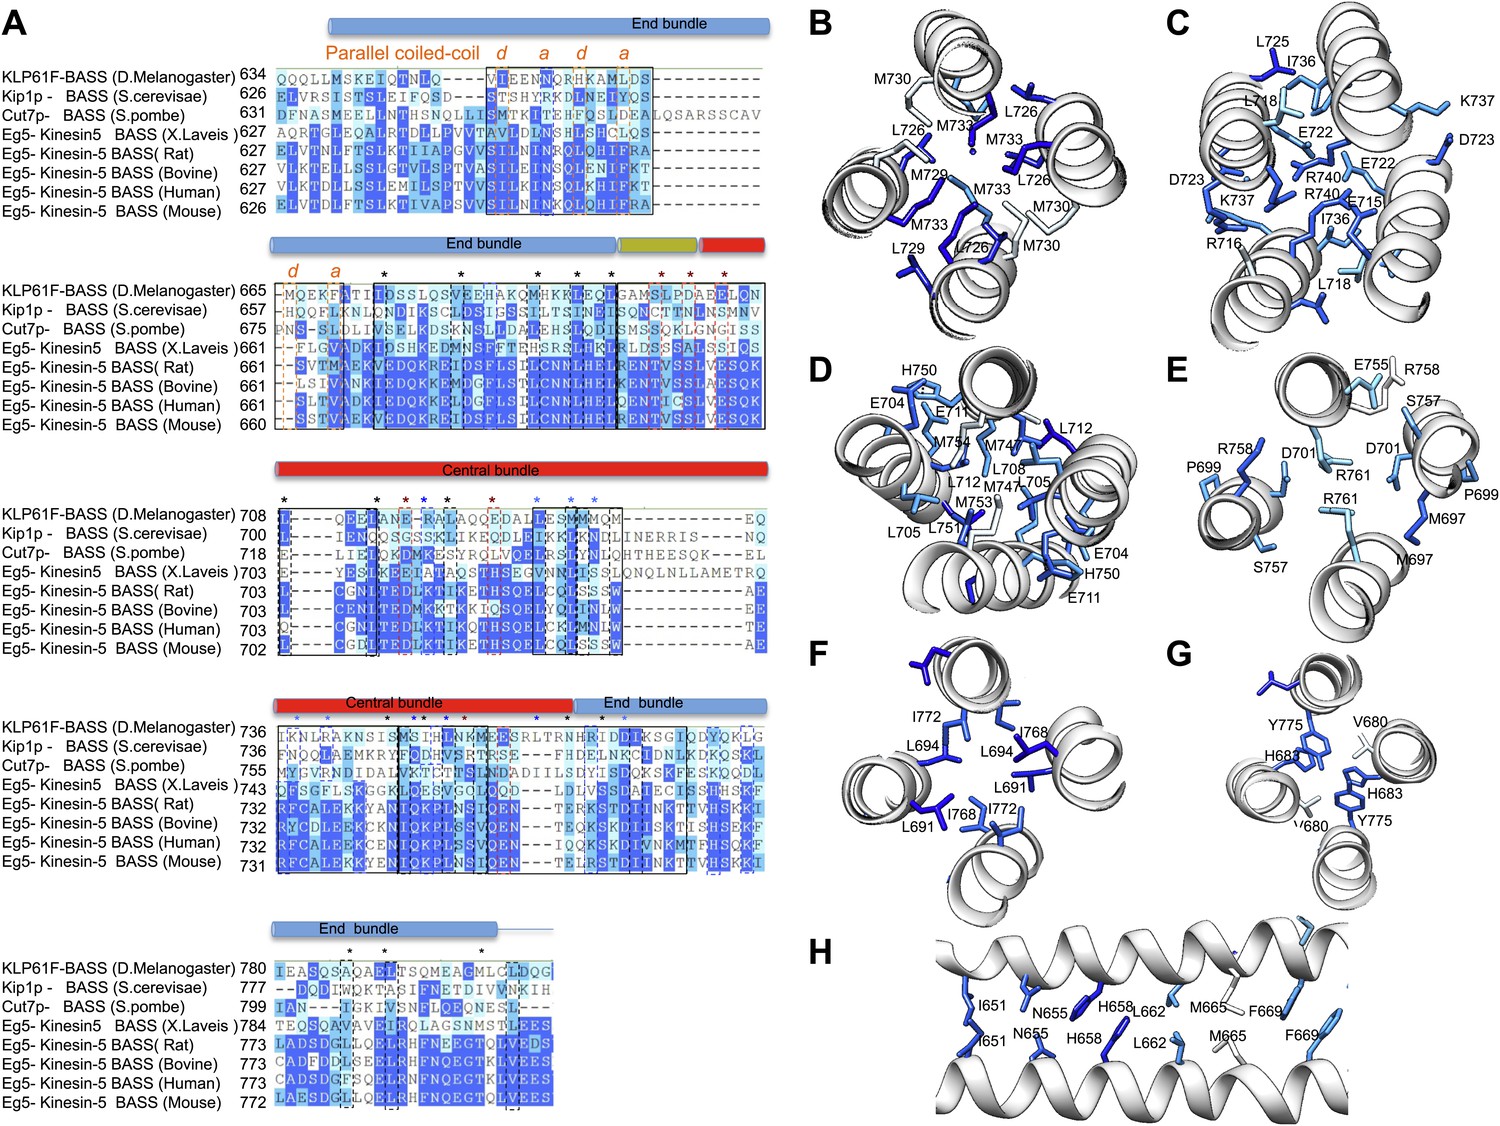
BASS structure features are conserved across Kinesin-5 family:
(A) Sequence conservation between the KLP61F BASS sequence and other Kinesin-5 orthologs. The alignment shows that many hydrophobic and ionic interfaces (depicted in Figures 5 and 6 as A–F) are conserved and include minor positional variations that are preserved at similar positions of the helices. (B–H) Structural views of interfaces A–F (described in Figures 5 and 6) with sequence conservation mapped on the structure in colors corresponding to those displayed in panel A.
Figure 8
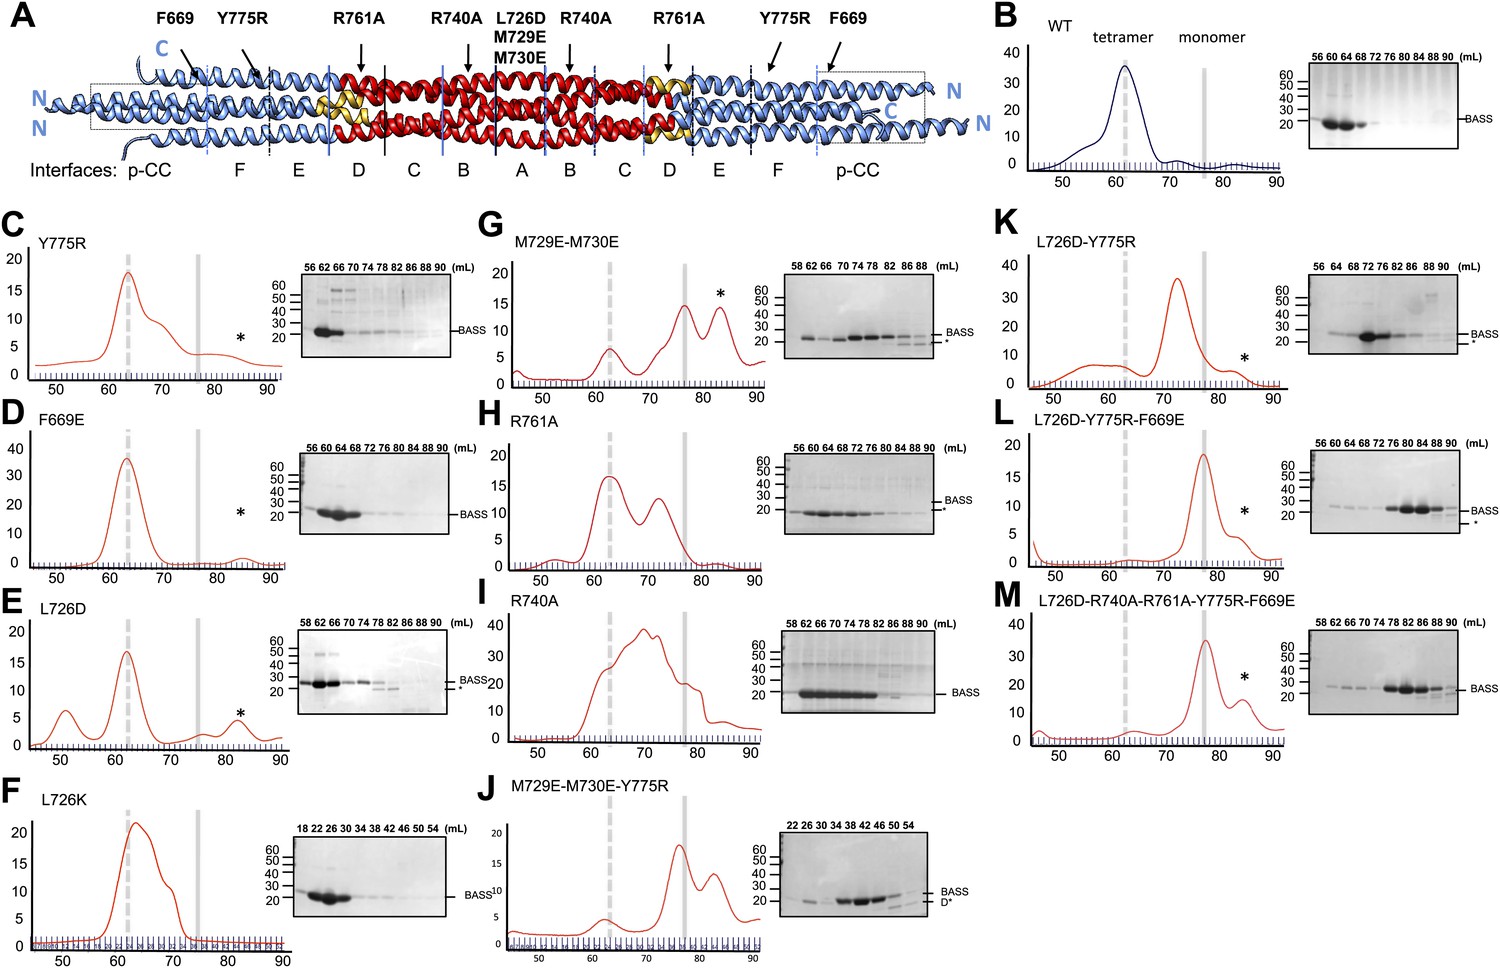
Structure-based biochemical analysis of the BASS interfaces in stabilizing Kinesin-5 bipolar minifilaments.
(A) Schematic view of BASS tetramer, shown in Figure 4. The model is divided into zones marking each of the interfaces described in Figures 5 and 6. Mutated residues are described above the model, and the interfaces described in each region are described below the model. Each of the panels below (B–M) includes a gel filtration chromatography elution profile on the left in which the tetramer and monomer peaks are indicated by broken and solid lines, respectively. An SDS-PAGE of the column fractions marked by volume (mLs) is shown on the right. A BASS degradation peak is observed under some conditions: (B) Wt: remains mostly tetrameric (broken line). (C) Tyr775Arg: mainly a tetrameric (broken line), with moderate amount of intermediate peak ahead of monomer peak (solid line). (D) Phe669Glu is a tetramer. (E) Leu726Asp: mainly a tetrameric peak (broken line), with a small intermediate peak, ahead of monomer peak (solid line). (F) Leu726Lys: mainly a tetrameric peak (broken line), with a small intermediate peak, ahead of monomer peak (solid line). (G) Met729Glu/Met730Glu: very low tetramer peak (broken lines) and mostly monomer peak. (H) Arg761Ala: mixture of tetramer peak (broken line) and intermediate peak ahead of monomer peak (solid line). (I) Arg740Ala: mixture of tetramer peak (broken line) and intermediate peak ahead of monomer peak (Solid line). (J) Met729Glu/Met730Glu/Tyr775Arg: very low tetramer peak (broken lines) and mostly monomer peak. (K) Leu726Asp/Tyr775Arg: little tetramer peak (broken lines) and mainly intermediate peak between tetramer and monomer peak (solid line). (L) Leu726Asp/Tyr775Arg/Phe669Glu: almost no tetramer peak (broken lines), co-eluting with monomer peak (solid line). (M) Leu726Asp-Arg740Ala-Arg761Ala-Tyr775Arg-Phe669Glu: no tetramer peak (broken lines) and almost completely monomer (solid line). Table 3 summaries the hydrodynamic properties of BASS mutants described here. Table 2 describes hydrodynamic analysis for mutants shown in panels D and M.
Figure 9
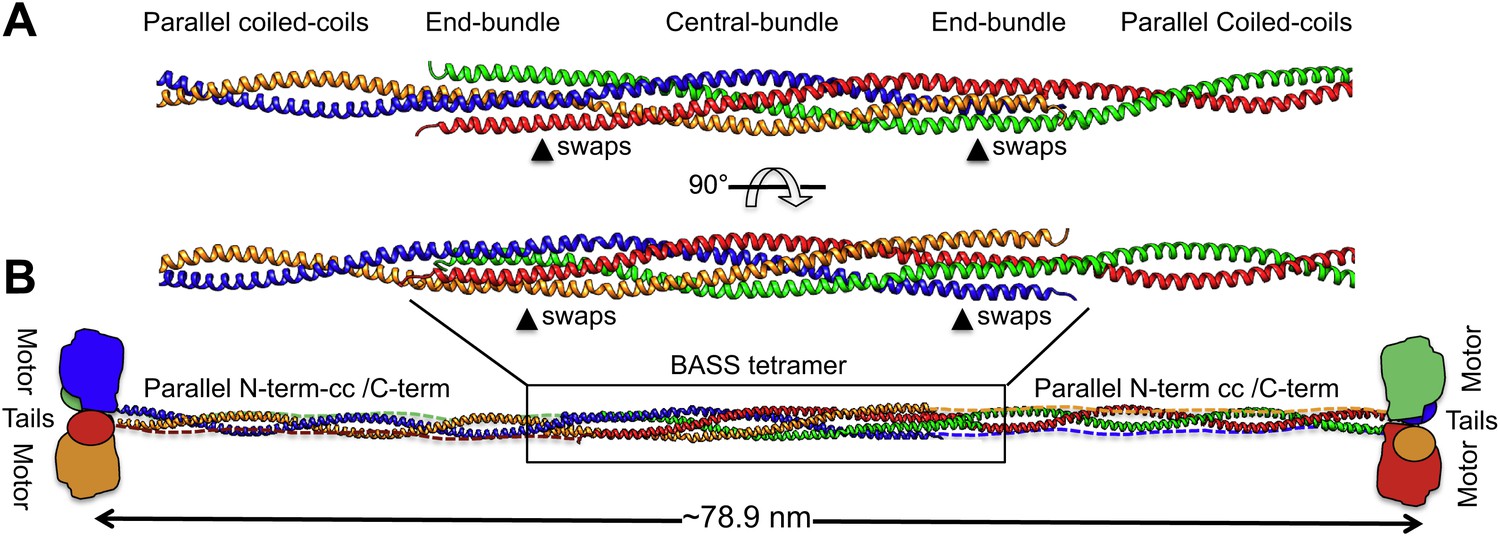
Modeling the Kinesin-5 tetramer minifilament.
(A) Model of Kinesin-5 central rod coiled-coil junction. Parallel coiled-coil structures were fit to the poles of the BASS tetramer by superimposing alpha carbons. The regions where the structures swap organization from an anti-parallel coiled-coil bundle to a parallel coiled-coil dimer are marked by arrowheads (swaps). (B) Cartoon of a full-length Kinesin-5 minifilament based on a model for the rod structure showing the central role of the BASS tetramer in organizing the N-terminal coiled-coil registers and positioning the C-terminal region to fold onto the N-terminal coiled-coil filament. The Kinesin-5 N-terminal motor and C-terminal tail domains, both bind MTs, are organized through long range folding of the BASS tetramer at the center of the Kinesin-5 rod.
Figure 10
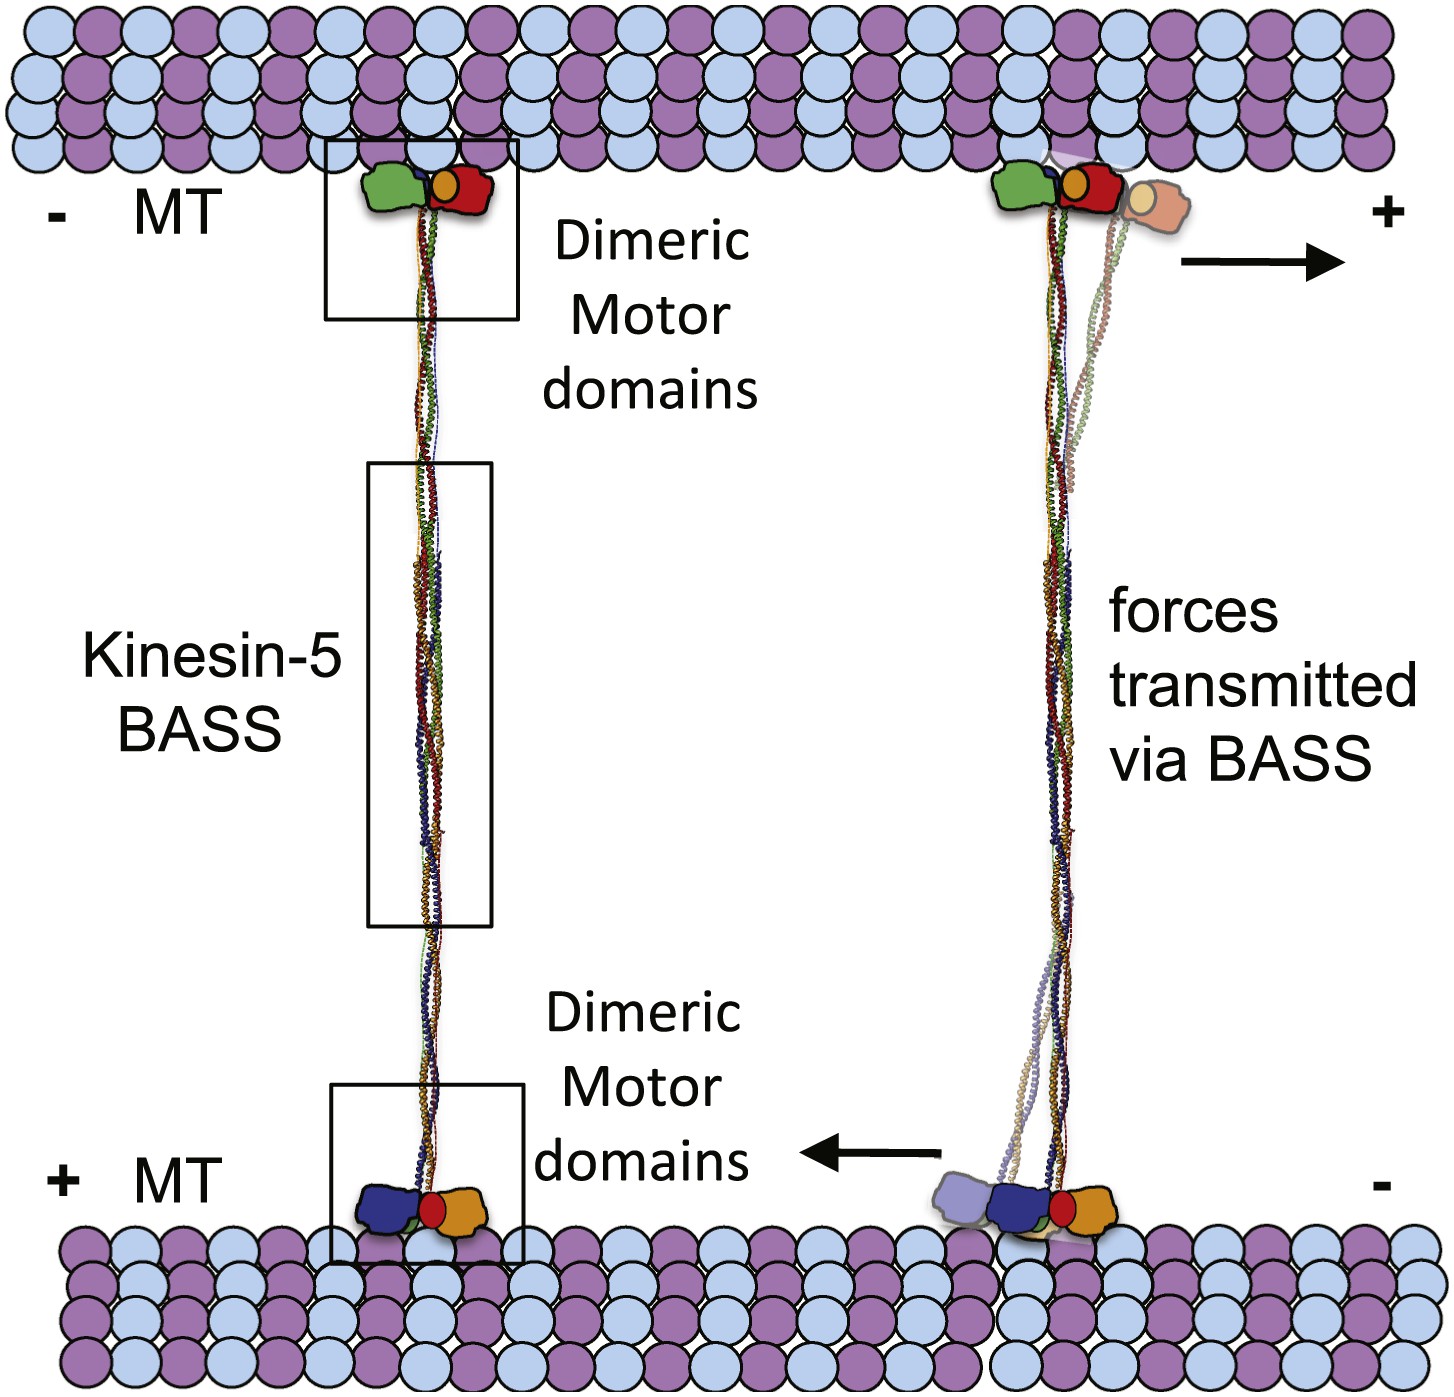
The implications of BASS structure on the Kinesin-5 motility and force transfer mechanism.
Schematic model of Kinesin-5 minifilament showing the potential role of BASS in force transfer between two motile ends of Kinesin-5 tetramers: the orientation of Kinesin-5 tetramers and role of BASS bipolar tetramer in transmitting the forces between two motile Kinesin-5 ends.
Videos
Video 1
Structural organization and novel fold of BASS tetramers.
This video accompanies Figure 4.
Video 2
The Kinesin-5 four-helical bundle is organized by alternating and symmetric hydrophobic and ionic interfaces.
This video accompanies Figure 5.
Video 3
At the Kinesin-5 BASS bundle ends, the N-terminal helices form parallel coiled-coils.
This video accompanies Figure 6.
Tables
Table 1
Crystallographic statistics table for Kinesin-5 KLP61F BASS domain structure Determination.
| BASS Native | BASS SeMet (Peak) | BASS-Hg (Peak) | |
|---|---|---|---|
| Data collection | |||
| Resolution range (Å) | 40.024–2.6 (2.74–2.6)* | 60.219–2.9 (3.06–2.90)* | 83.2–3.8 (3.87–3.80)* |
| Space group | P 64 2 2 | P 64 2 2 | P 64 2 2 |
| Wavelength (Å) | 0.9795 | 0.9792 | 1.007 |
| Unit cell (Å): a, b, c | 138.65, 138.65, 105.79 | 139.07, 139.07, 104.35 | 139.57, 139.57, 100.94 |
| Total reflections | 155332 | 152078 | 65646 |
| Unique reflections | 18960 {15885}† | 13704 {12639}† | 5973 |
| Average mosaicity | 0.52 | 1.09 | 1.10 |
| Anomalous Multiplicity | – | 6.0 (5.6)* | 6.2 (5.3)* |
| Multiplicity | 8.2 (8.5)* | 11.1 (10.6)* | 11.0 (10.2)* |
| Anomalous Completeness (%) | – | 100.0 (100.0)* | 97.6 (99.3)* |
| Completeness (%) | 99.9 (100.0) {83.8}† | 100.0 (100.0) {92.4}† | 98.8 (99.4)* |
| <I/σ (I)> | 10.8 (2.3)* | 11.9 (3.5)* | 18.3 (1.9)* |
| Rmerge‡ | 0.099 (0.99)* | 0.11(0.68)* | 0.091 (0.73)* |
| Structure refinement | |||
| Rwork | 0.22 (0.28)* | 0.24 (0.30)* | – |
| Rfree | 0.25 (0.37)* | 0.27 (0.33)* | – |
| Molecules per asymmetric unit | 2 | 2 | – |
| Number of atoms | 2355 | 2518 | – |
| Protein residues | 288 | 318 | – |
| Number of water molecules | 60 | – | |
| RMS bond lengths (Å) | 0.006 | 0.006 | – |
| RMS bond angles (°) | 0.86 | 0.89 | – |
| Ramachandran favored (%) | 99.3 | 98.4 | – |
| Ramachandran outliers (%) | 0.0 | 0.0 | – |
| Clashscore | 5.5 | 5.6 | – |
| Mean B values (Å2) | |||
| Overall | 80.6 | 86.7 | – |
| Main-chain atoms | 77.6 | 83.6 | – |
| Side-chain atoms | 84.3 | 89.8 | – |
| Solvent | 55.5 | - | – |
-
*
Numbers represent the highest-resolution shell.
-
†
Numbers represent the truncated data after treated with ellipsoidal truncation and anisotropic scaling.
-
‡
Rmerge = ΣhklΣi|Ii(hkl) − Iav(hkl)|/ΣhklΣiIi(hkl).
Table 2
Hydrodynamic properties of BASS and its mutants*
| Protein | R-stokes | S-Value | MASS/Oligomer |
|---|---|---|---|
| wt | 5.52 | 4.00 | 92 kDa (tetramer) |
| F669E | 5.62 | 4.25 | 102 kDa (tetramer) |
| L725D-R740 A-R761A-Y775R-F669E | 3.77 | 2.07 | 32 kDa (monomer) |
-
*
Masses were calculated from a combination of gel filtration chromatography and sucrose density gradient sedimentation. Using these approaches, the Stokes Radii (R-Stokes) and sedimentation value (S-values) were determined for each protein and used to calculate the mass.
Table 3
Hydrodynamic properties of BASS and its mutants shown in Figure 8
| BASS protein | Interface | Elution peaks | Oligomerization state |
|---|---|---|---|
| wt | None | 62.5 ml | Tetramer* |
| L726D | A | 62.5 ml | Tetramer |
| L726K | A | 62.5 ml | Tetramer |
| F669E | p-CC | 62.5 ml | Tetramer* |
| Y775R | F | 62.5, 71 ml | Tetramer/dimer |
| R761A | D | 62.5, 71 ml | Tetramer/dimer |
| R740A | B | 62.5, 71, 77 ml | Tetra/dimer/monomer |
| M729E-M730E | A | 62.5, 77 ml | Monomer |
| L726D-Y775R | A, F | 71 ml | Dimer |
| M729E-M730E-Y775R | A, F | 80 ml | Monomer |
| L726D-Y775R-F669E | A, F, p-CC | 80 ml | Monomer |
| L726D-R740 A-R761A-Y775R-F669E | A, B, D, F, pCC | 80 ml | Monomer* |
-
*
The masses of these proteins were measured as described in Table 2.
Download links
A two-part list of links to download the article, or parts of the article, in various formats.
Downloads (link to download the article as PDF)
Open citations (links to open the citations from this article in various online reference manager services)
Cite this article (links to download the citations from this article in formats compatible with various reference manager tools)
Structural basis for the assembly of the mitotic motor Kinesin-5 into bipolar tetramers
eLife 3:e02217.
https://doi.org/10.7554/eLife.02217


