Ribosomal protein S27-like is a physiological regulator of p53 that suppresses genomic instability and tumorigenesis
- University of Michigan, United States
- Children's National Medical Center, United States
- University of Michigan Medical School, United States
- Zhejiang University School of Medicine, China
Figures
Figure 1 with 1 supplement
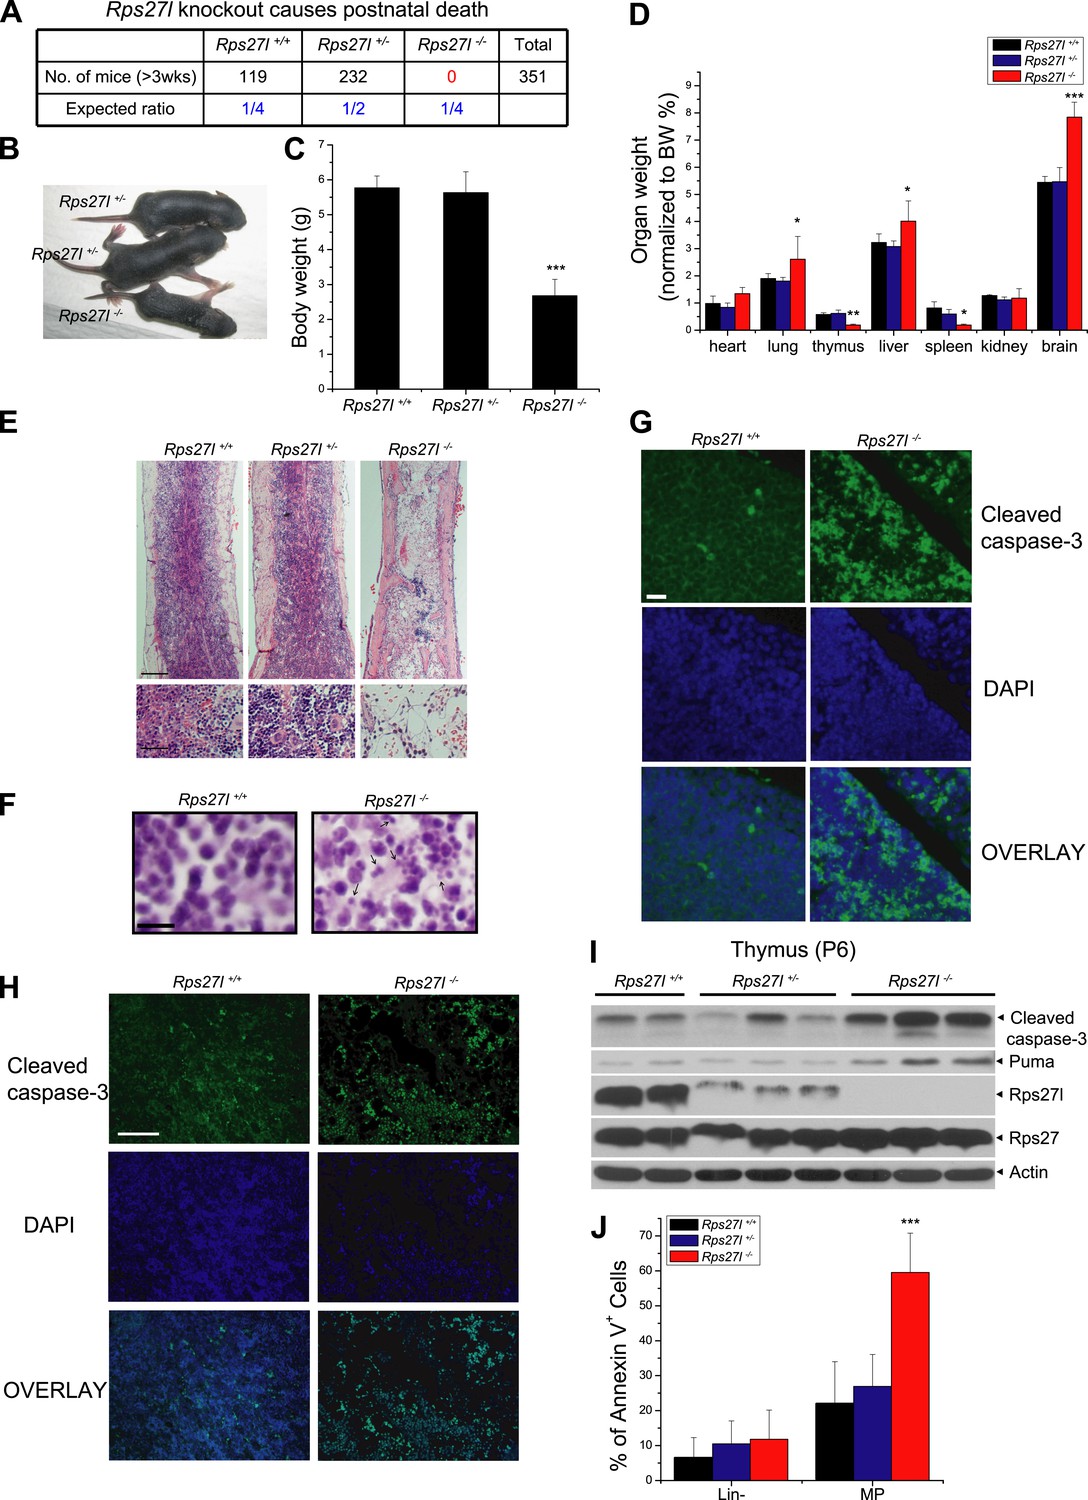
Rps27l disruption causes postnatal death as a result of increased apoptosis.
(A) Disruption of Rps27l causes postnatal death. (B–D) Reduced body size, body weight, and organ weight in Rps27l−/− mice. An Rps27l−/− pup (bottom) and two Rps27l+/− littermates (top) at P8 were photographed (B). The body (C) and the organs (D) of P8–10 pups with genotypes of Rps27l+/+ (n = 3), Rps27l+/− (n = 6), and Rps27l−/− (n = 10) were weighed. Shown are mean ± SD. *p < 0.05, **p < 0.01, and ***p < 0.001, as compared to Rps27l+/+ counterparts. (E) Representative H&E staining of bone marrows in femurs of P6 pups. Scale bars represent 200 µm (top) and 40 µm (bottom). (F) Representative H&E staining of thymuses from P8–10 pups. Arrows point to apoptotic cells. Scale bar represents 10 µm. (G and H) Representative immunofluoresent staining of cleaved caspase-3 in thymuses (G) of P8–10 pups and bone marrows (H) of P6 pups. Scale bars represent 20 µm (G) and 100 µm (H). (I) Accumulation of cleaved caspase-3 and Puma in Rps27l−/− thymuses. The thymuses of P6 pups were lysed for immunoblotting (IB). (J) Increased Annexin V-positive myeloid progenitors (MP) in Rps27l−/− fetal livers. Cells from E14.5 Rps27l+/+ (n = 6), Rps27l+/− (n = 12), and Rps27l−/− (n = 11) fetal livers were stained with antibodies (Abs) against surface markers and Annexin V-FITC, followed by FACS analysis. Data shown are mean ± SD. ***p < 0.001, as compared to Rps27l+/+ counterparts.
Figure 1—figure supplement 1
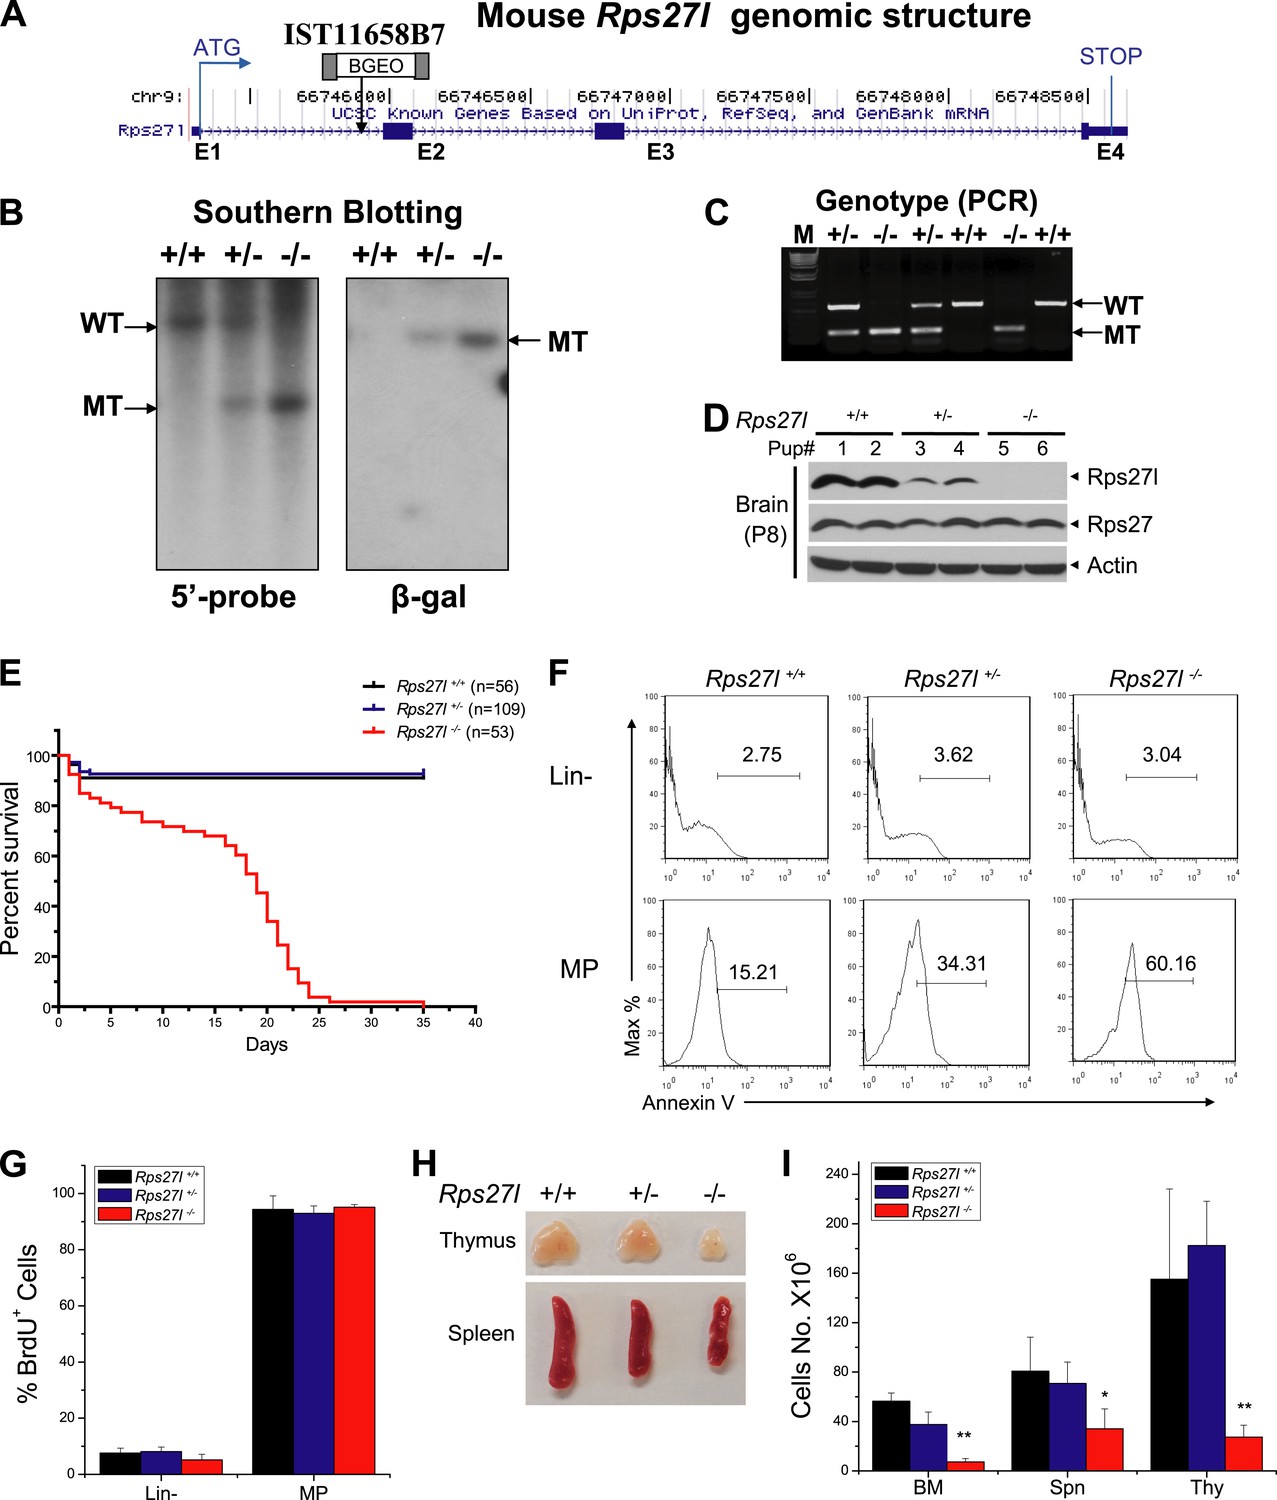
Generation of Rps27l gene trap mice and phenotypes of Rps27l−/− mice.
(A) Genomic structure of mouse Rps27l gene. Four exons (E1-E4) and three introns (between exons) are shown, along with the insertion site in intron 1 of the gene trap vector. (B) Southern blotting confirmed the genotypes. Mouse genomic DNA was digested with EcoRI (5′ probe) or PstI (β-Gal probe), followed by Southern blot analysis. (C) PCR-based genotyping. Mouse tail DNA was isolated and amplified by PCR. Shown are two fragments with sizes of 525 bp (wt) and 325 bp (mutant). (D) Lack of Rps27l protein expression in Rps27l−/− brains. The brains from P8 mice were homogenized and subjected to IB with indicated antibodies (Abs). (E) Kaplan–Meier survival curves of mice with three Rps27l genotypes under a mixed Sv129/B6 background. (F) Increased apoptosis in myeloid progenitors (MP) in fetal livers upon Rps27l disruption. Fetal liver cells of three genotypes were stained with Abs against surface markers and Annexin V-FITC, followed by FACS analysis. Shown is a representative FACS profile of Annexin V staining. (G) No change of proliferation of MP in fetal livers upon Rps27l disruption. Pregnant mice with indicated genotypes were i.p. injected with BrdU labeling reagent 2 hr before being sacrificed. Cells from E14.5 fetal livers of Rps27l+/+ (n = 6), Rps27l+/− (n = 5), and Rps27l−/− (n = 3) were stained with surface markers and BrdU-FITC Abs, followed by FACS analysis. (H) Reduced size of thymus and spleen in Rps27l−/− mice. Representative thymuses and spleens from three genotypes of P18 mice under a mixed Sv129/B6 background were photographed. (I) Hypo-cellularity of organs in Rps27l−/− mice. The total cell numbers of bone marrow (femur and tibia from two hind limbs), spleen, and thymus were counted from P18 Sv129/B6 mice with the genotypes of Rps27l+/+ (n = 3), Rps27l+/− (n = 4), or Rps27l−/− (n = 7). Shown are mean ± SD. *p < 0.05, **p < 0.01, as compared with Rps27l+/+ counterparts.
Figure 2 with 1 supplement
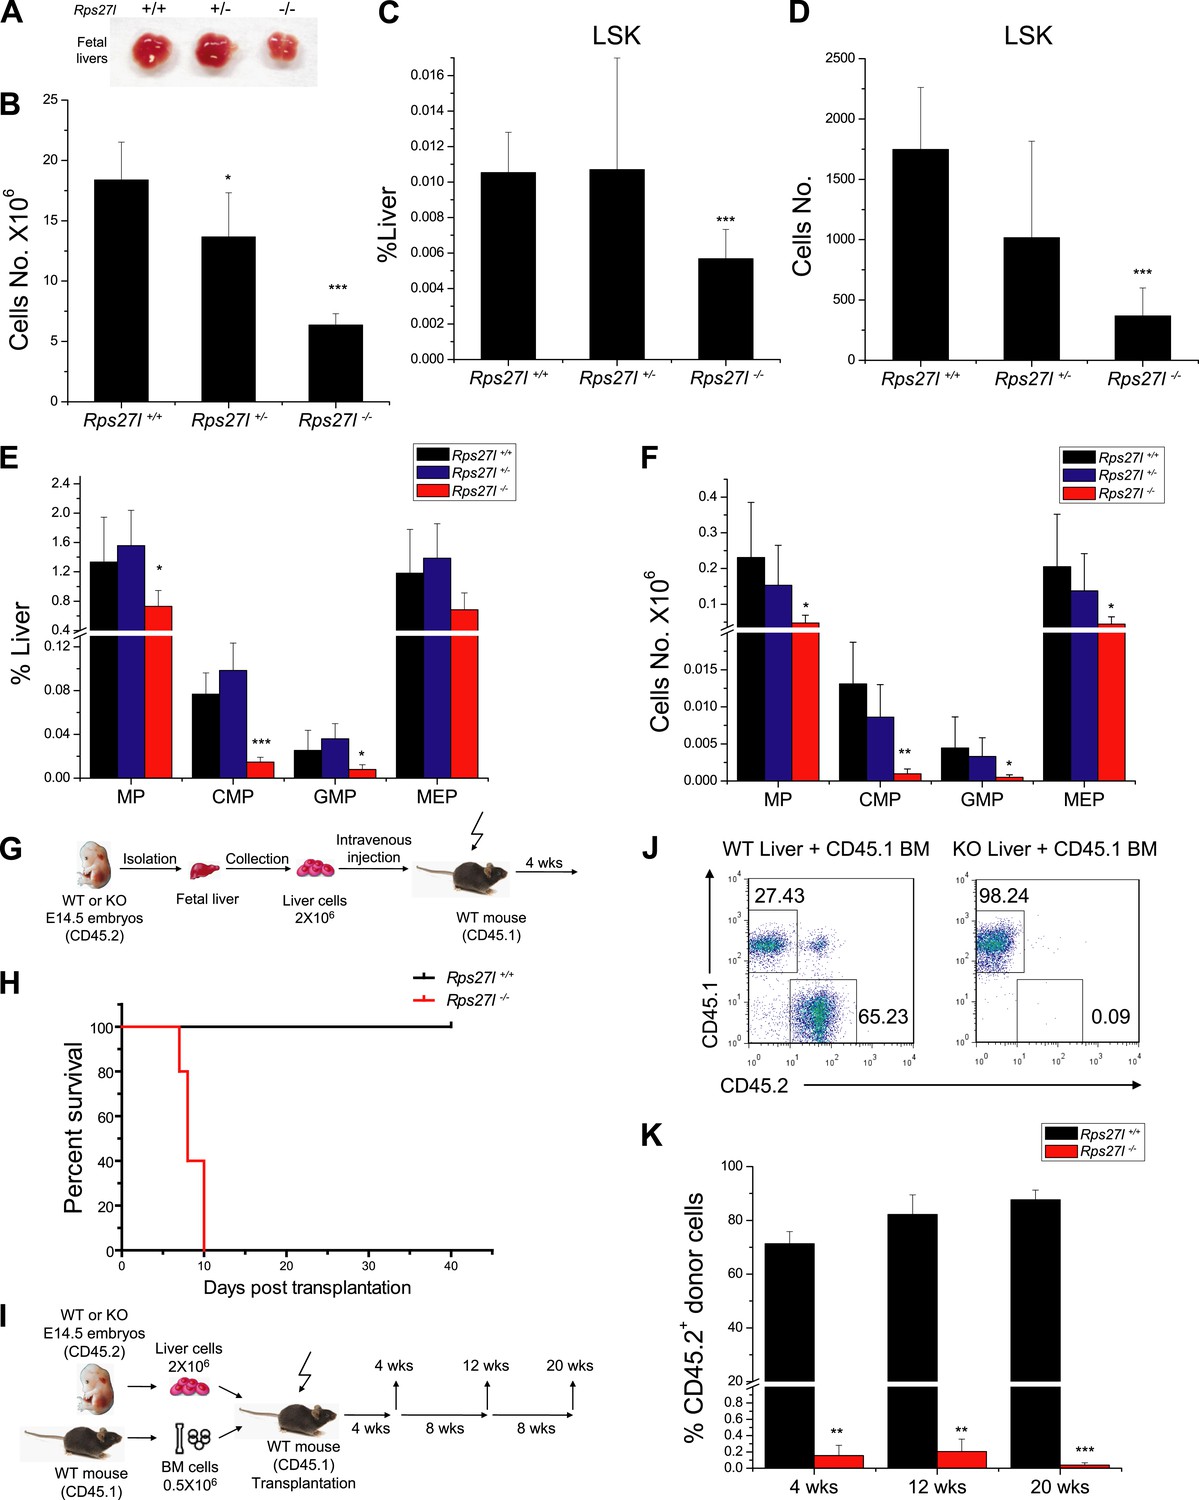
Reduced hematopoietic stem and progenitor cells in Rps27l−/− fetal livers.
(A and B) Reduced size and total cell numbers in Rps27l−/− fetal livers. Representative fetal livers of three genotypes were photographed (A), and the numbers of fetal liver cells from E14.5 embryos were counted. Shown are mean ± SD with embryo numbers as follows: Rps27l+/+ (n = 7), Rps27l+/− (n = 10), and Rps27l−/− (n = 8). *p < 0.05, ***p < 0.001, as compared with Rps27l+/+ counterparts. (C–F) Decreased percentages and absolute numbers of HSPCs in Rps27l−/− fetal livers. Cells from E14.5 fetal livers of Rps27l+/+ (n = 7), Rps27l+/− (n = 10), and Rps27l−/− (n = 8) were stained with antibodies against various surface markers. The populations of LSK (C and D), MP, CMP, GMP, and MEP (E and F) were analyzed by flow cytometry. Shown are mean ± SD. *p < 0.05, **p < 0.01, and ***p < 0.001, as compared with Rps27l+/+ counterparts. (G) Diagram of non-competitive reconstitution assay. Fetal liver cells (2 × 10⁶ cells) from E14.5 embryos (CD45.2) were injected into lethally irradiated recipient mice (CD45.1). Peripheral blood from recipients was analyzed by flow cytometry at 4 weeks after transplantation. (H) Kaplan–Meier survival curves of recipient mice after transplantation. Rps27l+/+ or Rps27l−/− fetal liver cells were injected, respectively, into recipient mice (n = 5, for each genotype). p = 0.0026. (I) Diagram of competitive reconstitution assay. Fetal liver cells (2 × 10⁶ cells) from E14.5 embryos (CD45.2) were injected into lethally irradiated recipient mice (CD45.1) together with bone marrow cells (0.5 × 10⁶ cells) from normal recipient mice. Peripheral blood from recipients was analyzed by flow cytometry at 4, 12, and 20 weeks after transplantation. (J) Representative FACS profiles of donor-type (CD45.2) and recipient-type (CD45.1) blood cells at 4 weeks post transplantation. (K) Dramatic reduction of donor-type (CD45.2) blood cells in recipients transplanted with Rps27l−/− fetal livers. The percentages of CD45.2+ cells in peripheral blood at 4, 12, and 20 weeks post transplantation were summarized. Rps27l+/+ or Rps27l−/− fetal liver cells were injected into recipient mice (n = 3, for each genotype). Shown are mean ± SD. **p < 0.01, ***p < 0.001, as compared to Rps27l+/+ counterparts.
Figure 2—figure supplement 1
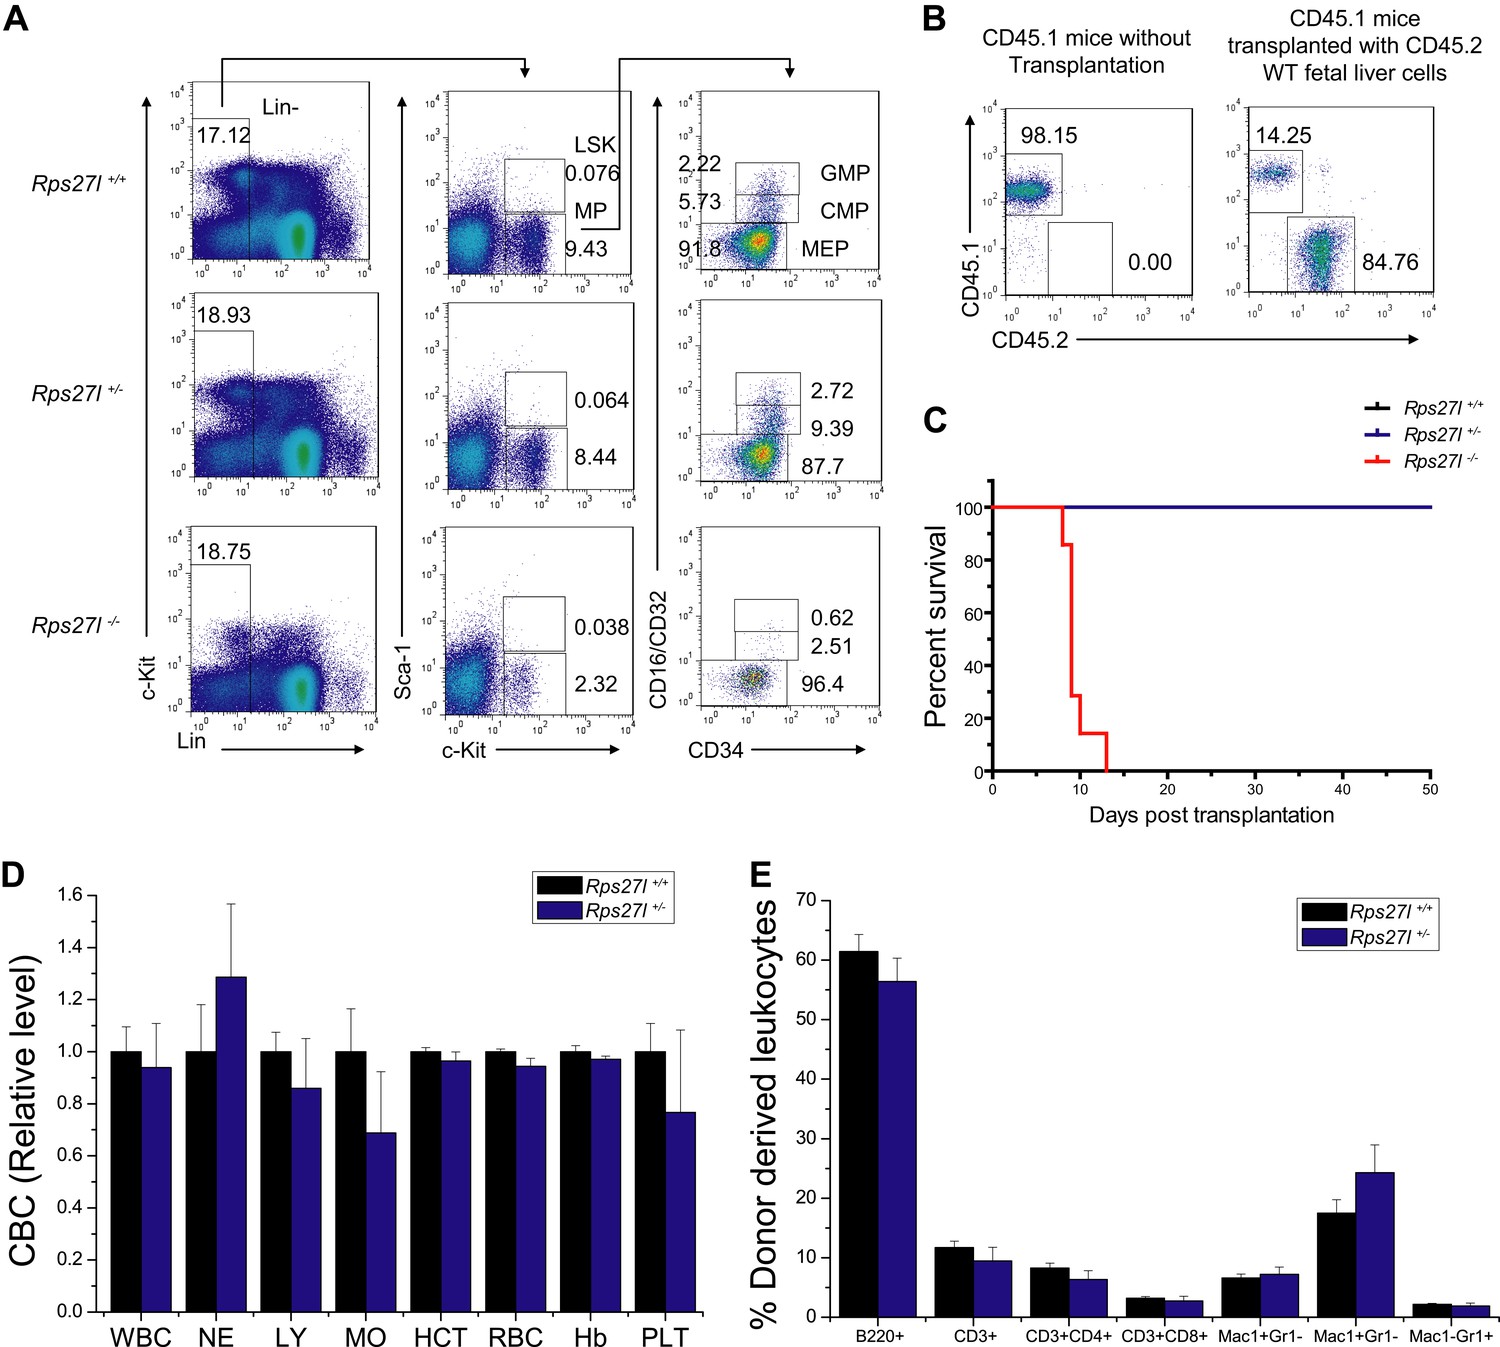
Depletion of hematopoietic stem and progenitor cells (HSPCs) upon Rps27l disruption.
(A) Representative FACS profiles of HSPCs in fetal livers. Fetal liver cells were isolated from E14.5 embryos with indicated genotypes and subjected to FACS analysis using indicated surface marker Abs. (B) Representative FACS profiles of blood cells from donor-type (CD45.2) and recipient-type (CD45.1) mice in recipient mice transplanted with Rps27l+/+ fetal liver cells at 4 weeks post transplantation. (C) Kaplan–Meier survival curves of recipient mice after transplantation. The fetal liver cells from Rps27l+/+ (2 × 10⁶ cells), Rps27l+/− (2 × 10⁶ cells), or Rps27l−/− (6 × 10⁶ cells) embryos were injected, respectively, into recipient mice (n = 8 for Rps27l+/+ livers, n = 9 for Rps27l+/− livers, n = 7 for Rps27l−/− livers). p < 0.0001. (D and E) The fetal livers from Rps27l+/+ and Rps27l+/− embryos have similar reconstitution activity. CBC classification of peripheral blood from recipient mice was performed at 4 weeks post transplantation (D). WBC, white blood cells; NE, neutrophils; LY, lymphocytes; MO, monocytes; HCT, hematocrit; RBC, red blood cells; Hb, hemoglobin; PLT, platelets. The percentages of donor-derived leukocytes at 4 weeks post transplantation were summarized (E). (n = 5 for each genotype).
Figure 3 with 1 supplement
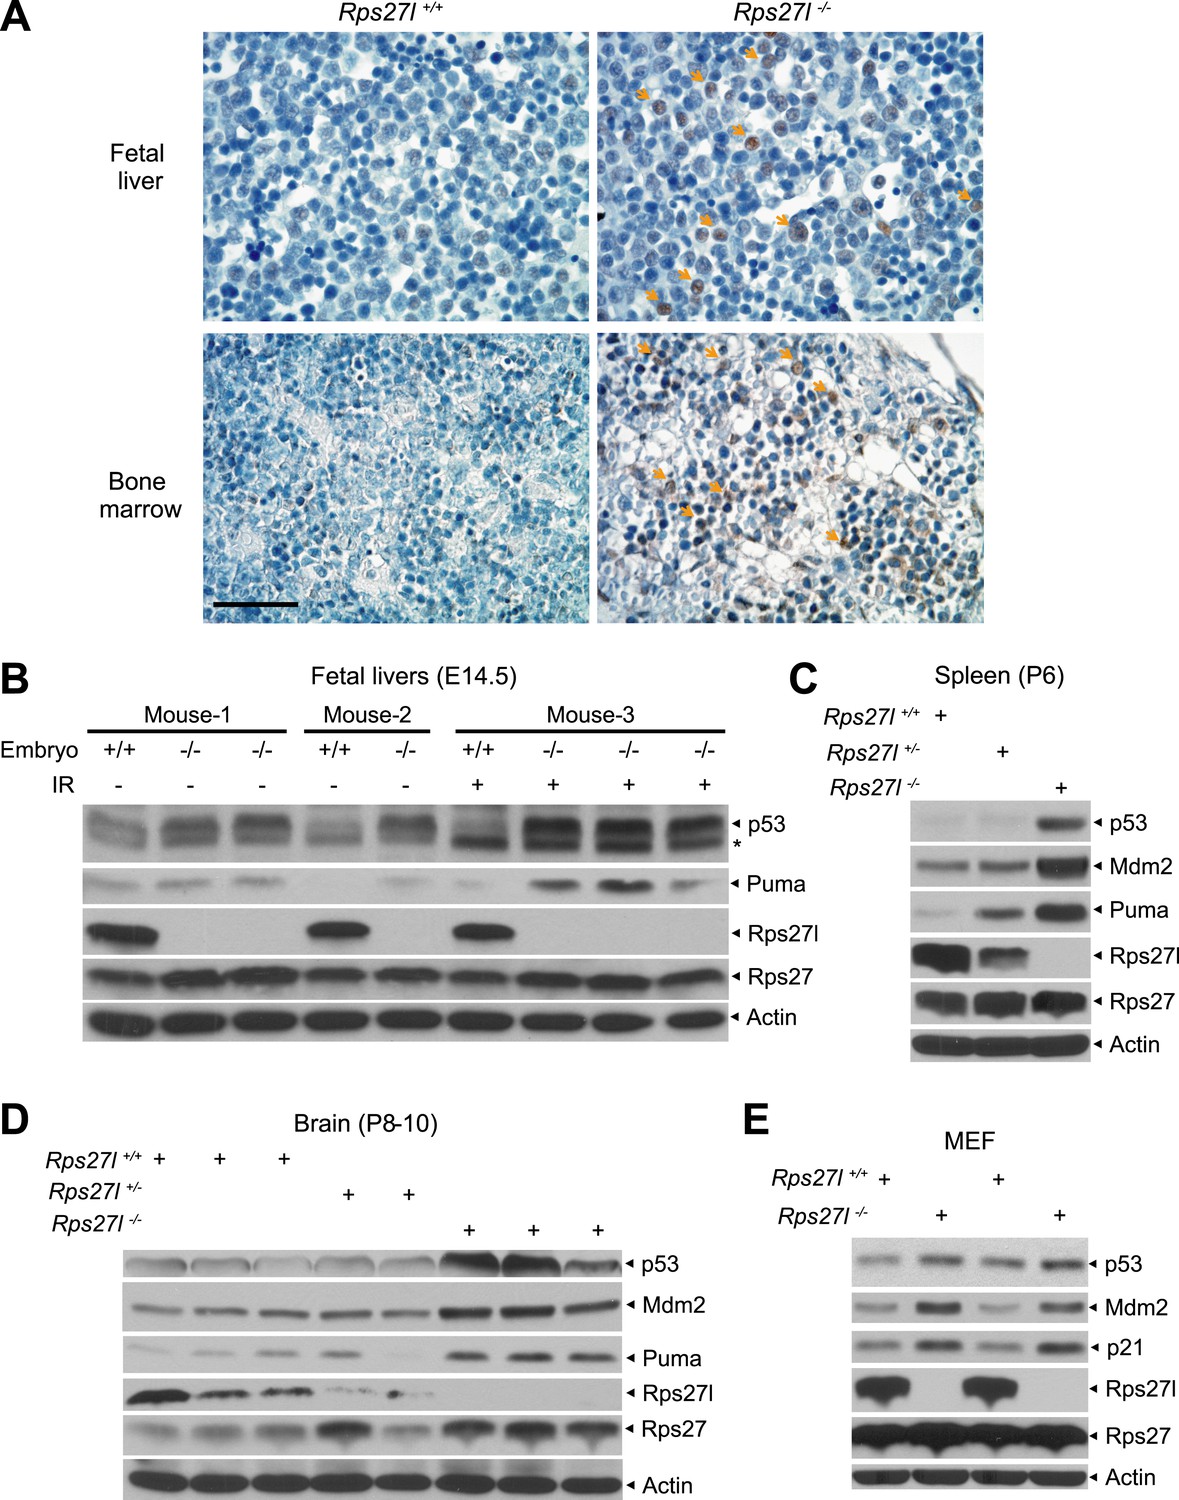
Rps27l disruption causes a moderate increase of p53 and p53 targets.
(A) Representative p53 staining in fetal livers and bone marrows. Fetal livers at E14.5 and bone marrows at P6 were immuno-stained with p53 Ab. Arrows point to p53 positive staining. Scale bar represents 40 µm. (B) Accumulation of p53 and Puma in Rps27l−/− fetal livers. Fetal livers isolated from embryos of non-irradiated or irradiated pregnant Rps27l+/− females (E14.5) were lysed for IB at 5 hr after ionizing radiation at 5 Gy. * denotes a nonspecific band. (C) Accumulation of p53 and p53 targets in Rps27l−/− spleens. Several spleens with the same genotype from P6 pups were harvested, pooled, homogenized, and subjected to IB. (D) Accumulation of p53 and p53 targets in Rps27l−/− brains. Brains from P8–10 pups were harvested and lysed for IB. (E) Accumulation of p53 and p53 target proteins in Rps27l−/− MEFs. Two independent pairs of MEFs from embryos at E13.5 were lysed for IB with indicated antibodies.
Figure 3—figure supplement 1
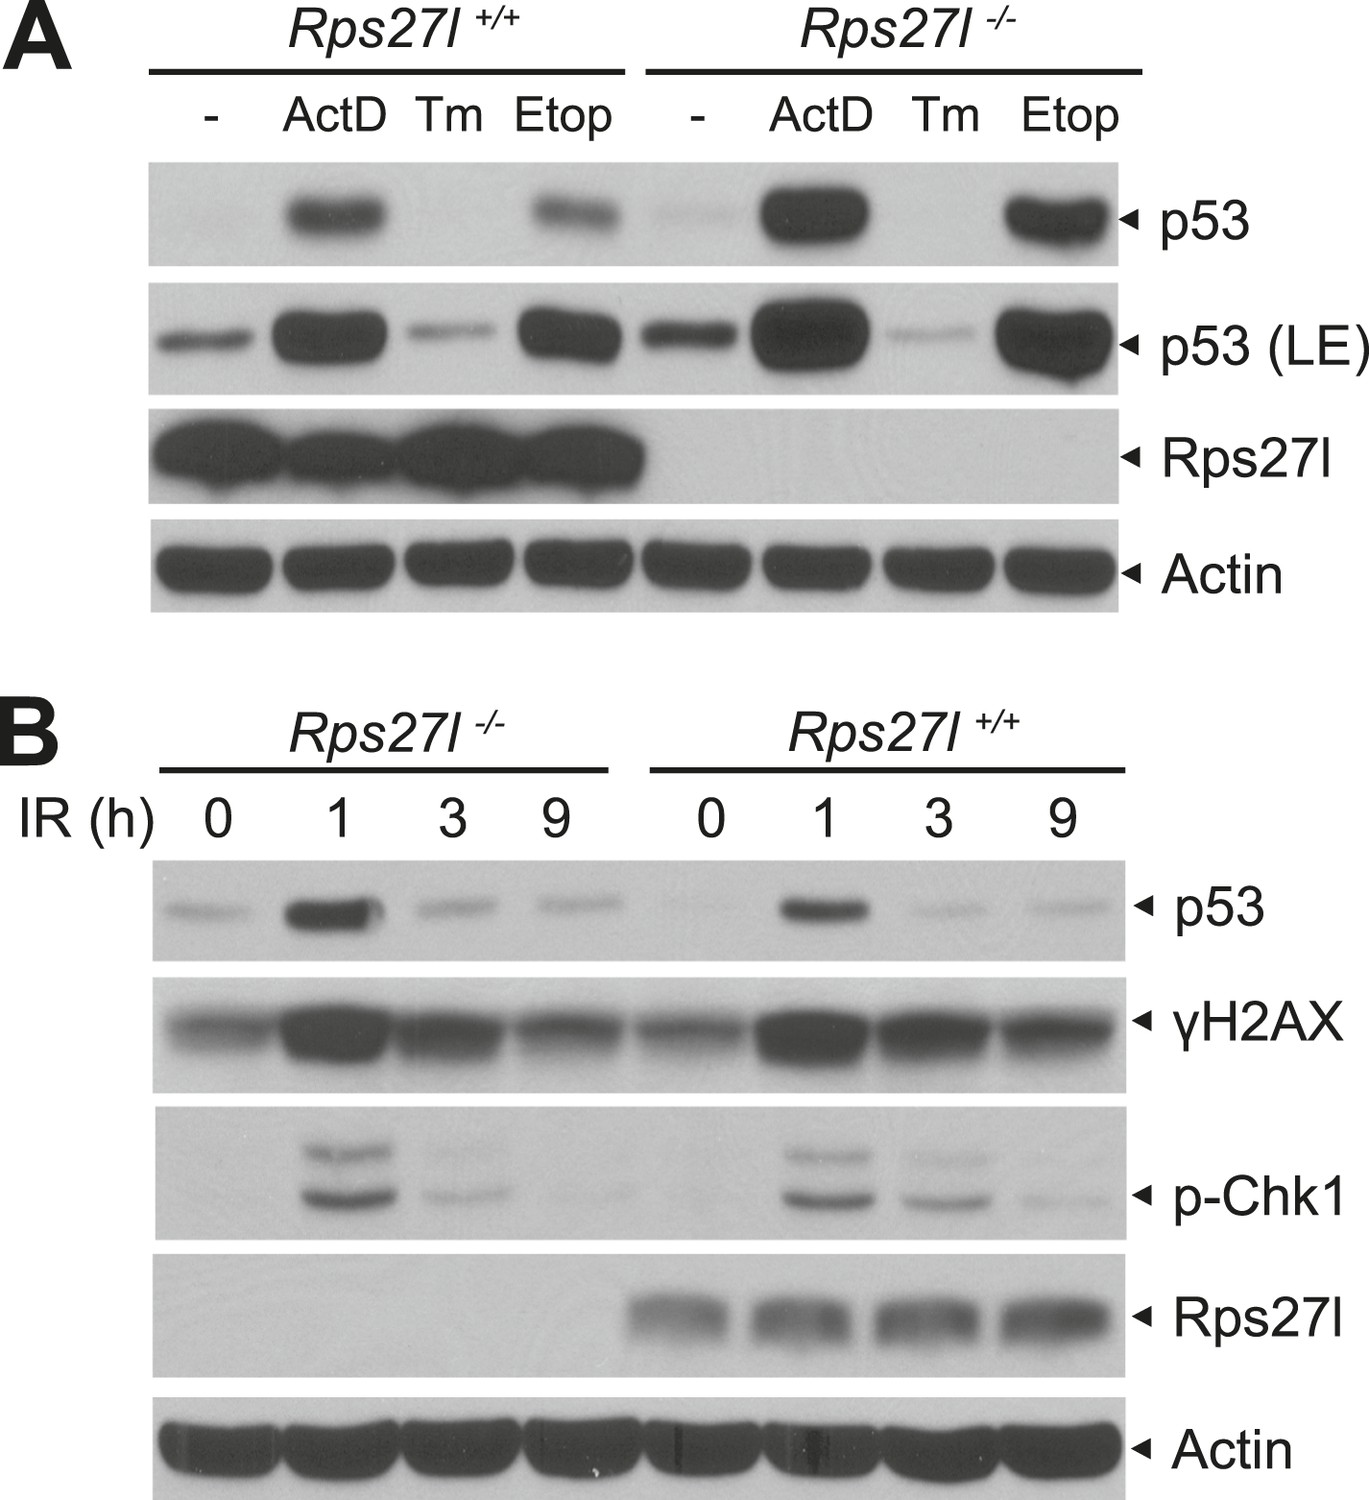
Increased p53 levels in responsive to various stresses in Rps27l−/− MEFs.
(A) Higher p53 levels induced by ribosomal stress and DNA damaging agent, not by endoplasmic reticulum (ER) stress in Rps27l−/− MEFs. MEFs were treated with 5 nM Actinomycin D (ActD) for 24 hr, 5 μg/ml tunicamycin (Tm) for 8 hr, or 50 μM etoposide (Etop) for 24 hr, followed by IB. LE: long exposure. (B) Higher p53 levels induced by ionizing radiation in Rps27l−/− MEFs. MEFs were harvested for IB at various time points post 6 Gy of ionizing radiation.
Figure 4 with 1 supplement
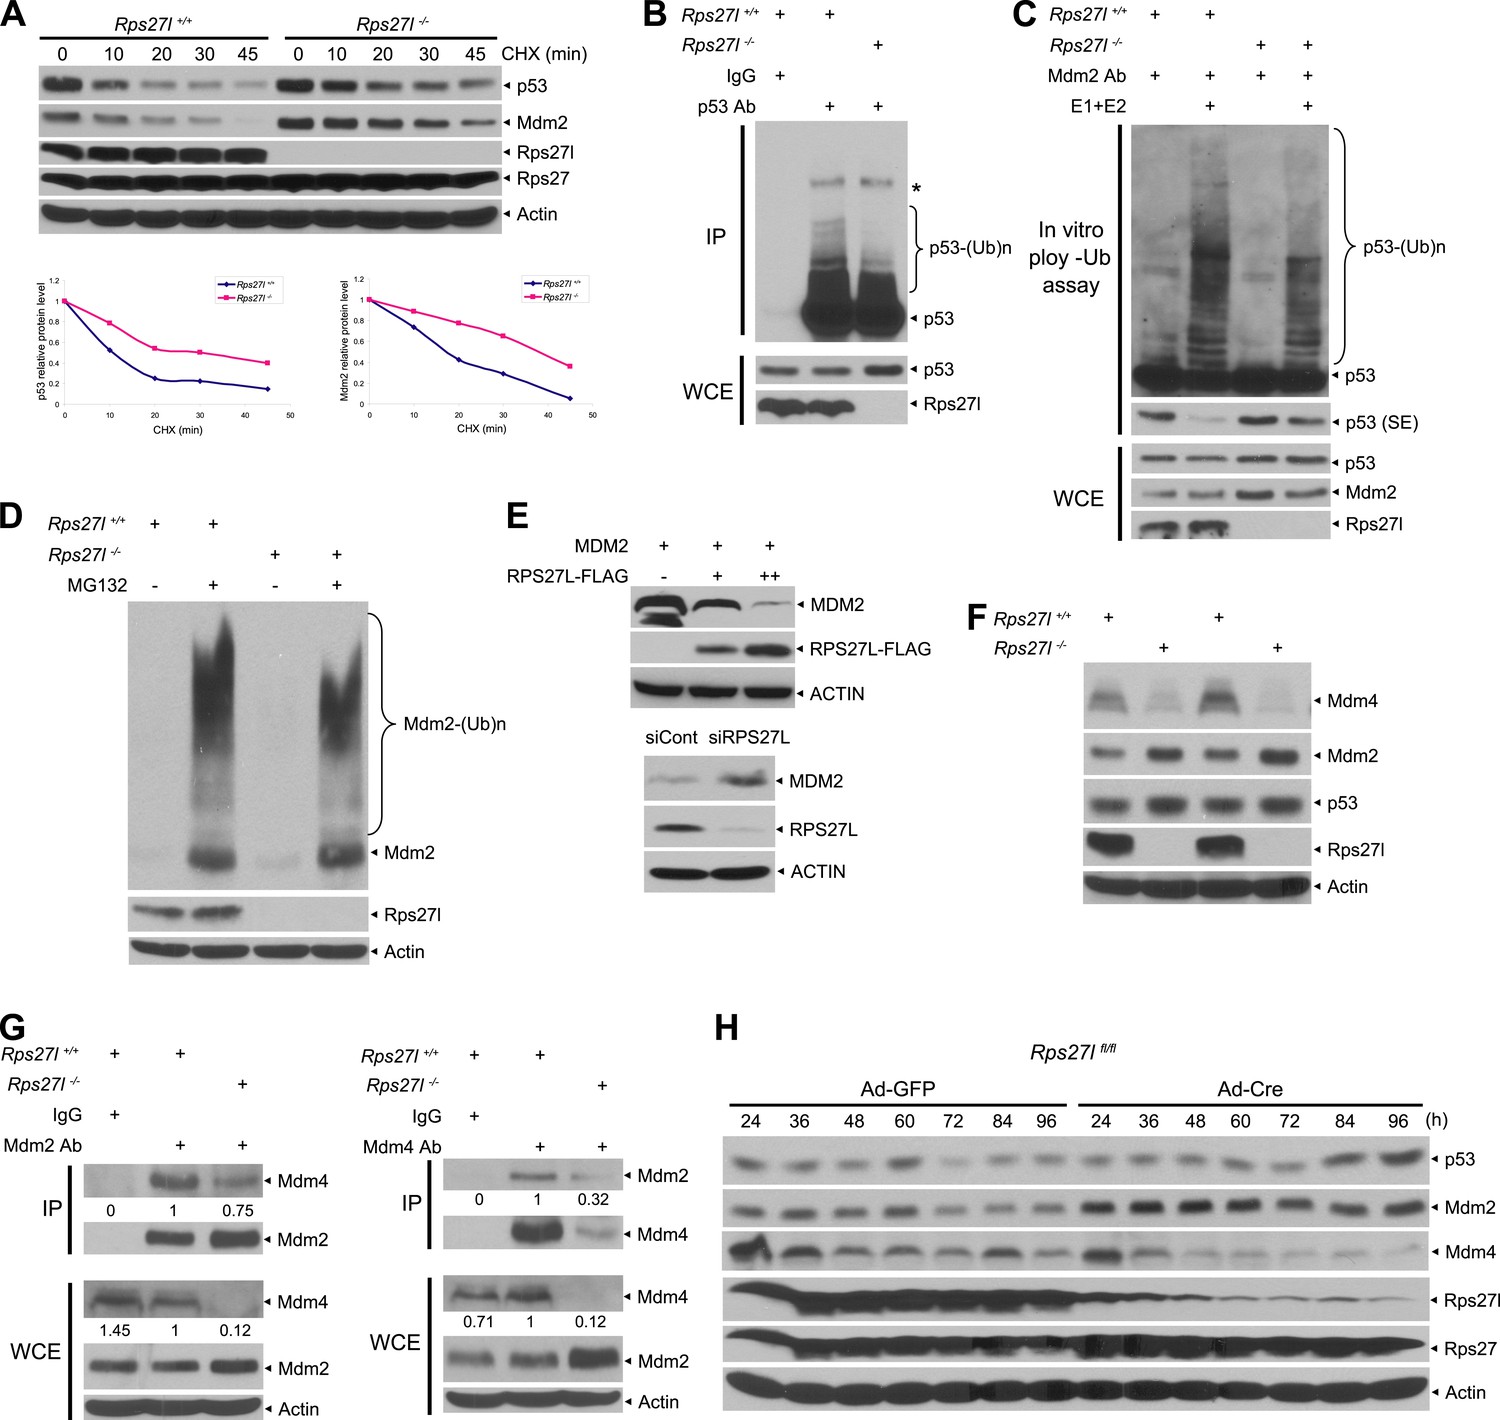
Rps27l disruption alters the levels of the p53-Mdm2-Mdm4 axis.
(A) Extension of protein half-lives of p53 and Mdm2 upon Rps27l disruption. Rps27l+/+ or Rps27l−/− MEFs were harvested at various time points post CHX treatment for IB (top). Densitometry quantification was performed with ImageJ, and the decay curves are shown (bottom). (B) Rps27l disruption impairs the ubiquitylation of endogenous p53 in vivo. Rps27l+/+ or Rps27l−/− MEFs were harvested after 4 hr of MG132 treatment for IP with p53 Ab or normal IgG control, followed by IB with p53 Ab (top), or for direct IB with p53 or Rps27l Ab (bottom). * denotes a nonspecific band. WCE: whole cell extract. (C) Rps27l disruption impairs p53 ubiquitylation in vitro. The Mdm2-Mdm4 E3 and p53 (substrate) complex was immunoprecipitated with Mdm2 Ab from MG132 treated Rps27l+/+ or Rps27l−/− MEFs, and added into an in vitro ubiquitylation reaction mixture containing ATP, ubiquitin, E1, and E2 (UbcH5b). After 60 min incubation with continuous vortexing, the reaction mixture was subjected to IB using p53 Ab. SE: short exposure. (D) Reduced Mdm2 self-ubiquitylation upon Rps27l depletion. Rps27l+/+ or Rps27l−/− MEFs were treated with MG132 for 4 hr before being harvested for IB using indicated Abs. (E) Negative regulation of MDM2 protein levels by RPS27L. p53-null H1299 lung cancer cells were transfected with MDM2 alone, or in combination with two concentrations of FLAG-tagged RPS27L for 48 hr (top), or infected with lenti-virus targeting RPS27L or scrambled control siRNA for 3 days (bottom), followed by IB with indicated Abs. (F) Reduced Mdm4 protein level in Rps27l−/− MEFs. Two independent pairs of MEFs were harvested and subjected to IB with indicated Abs. (G) Reduced Mdm2-Mdm4 complex in Rps27l−/− MEFs. Whole cell extracts of Rps27l+/+ or Rps27l−/− MEFs were subjected to IP with Mdm2 Ab or normal IgG control, followed by IB with Mdm4 Ab (left), or subjected to IP with Mdm4 Ab or normal IgG control, followed by IB with Mdm2 Ab (right). WCE were also subjected to direct IB with indicated Abs. Densitometry quantification was performed with ImageJ. (H) Sequential change in the protein levels of Mdm2, Mdm4, and p53 upon acute depletion of Rps27l. Rps27lfl/fl MEFs were harvested at various time points following adenoviral infection and subjected to IB.
Figure 4—figure supplement 1
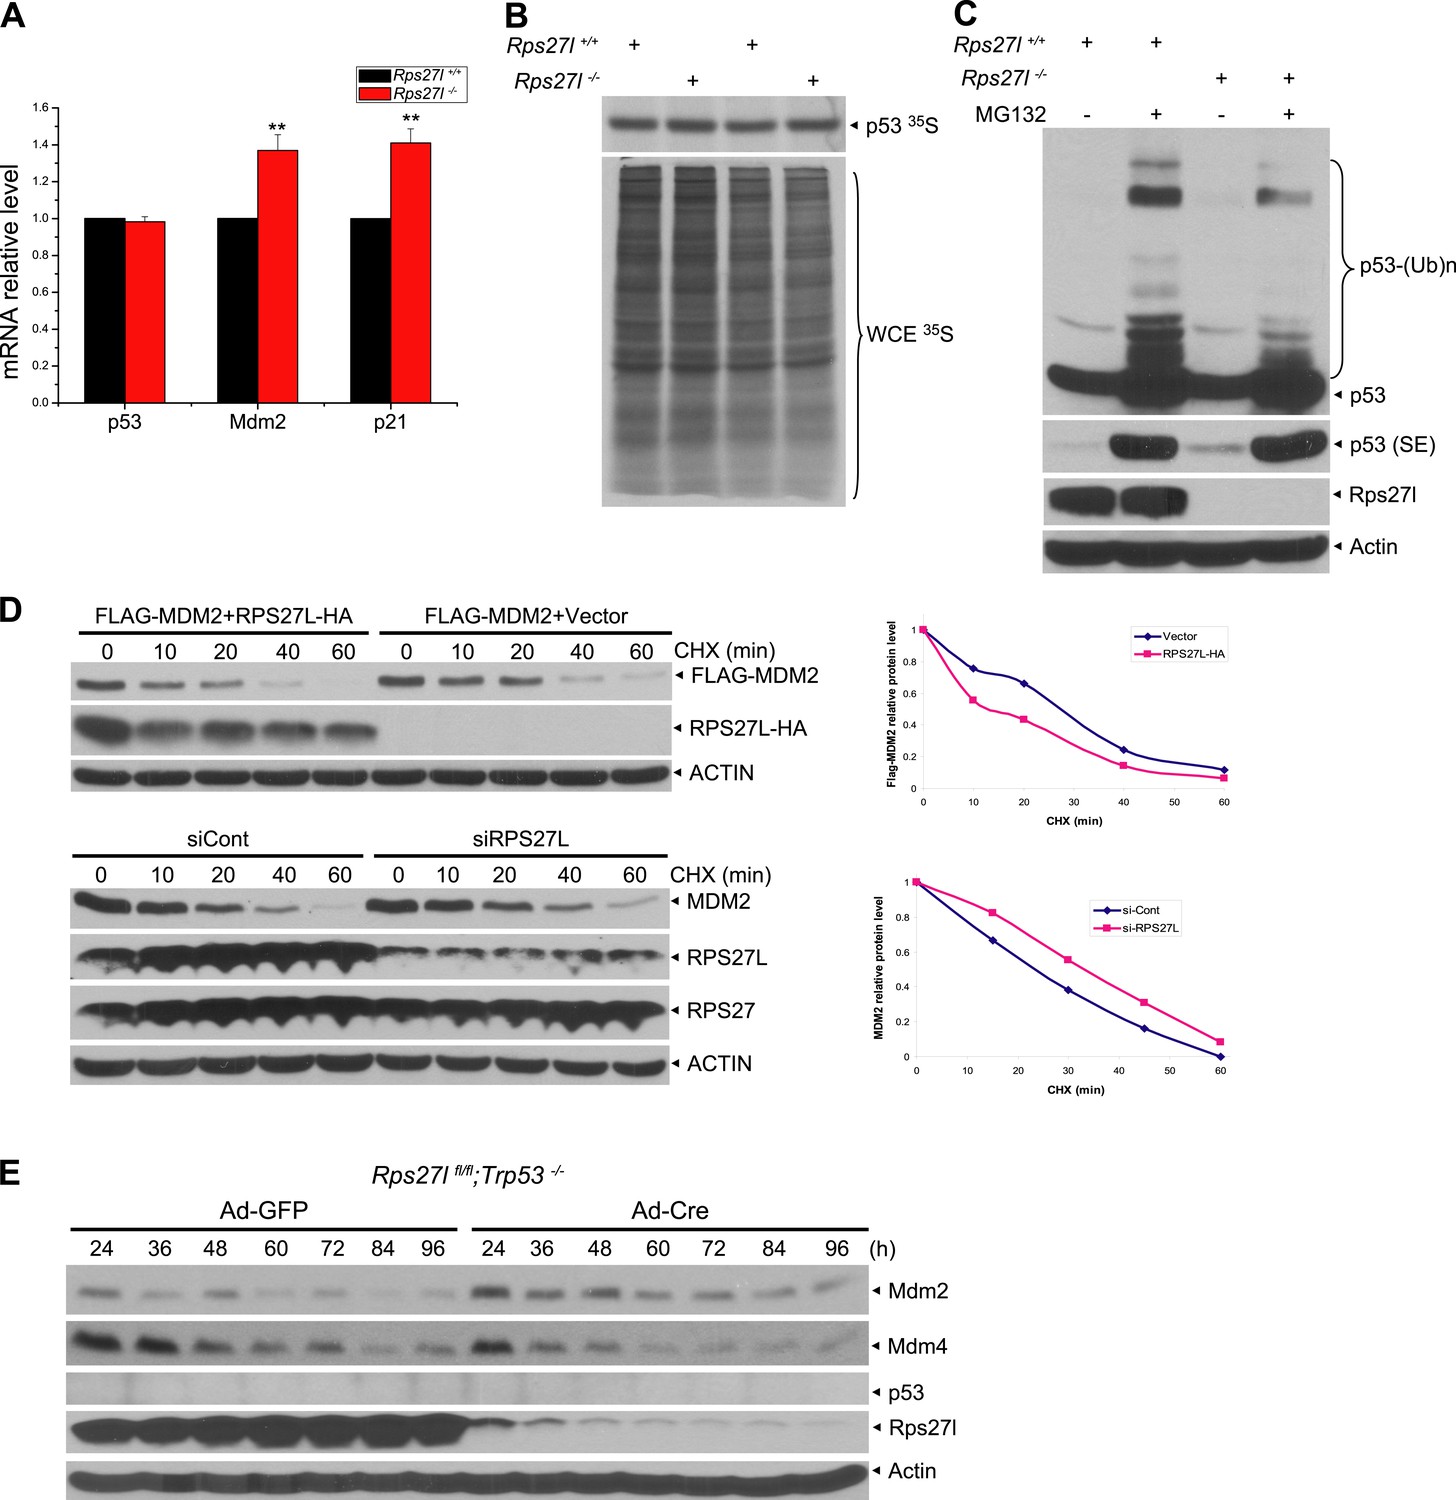
Rps27l regulates p53 ubiquitylation and Mdm2 protein half-life.
(A) No change in p53 transcription, but an increase in transcription of p53 targets. Four independent pairs of MEFs were harvested for quantitative real-time PCR using indicated primers. Shown are mean ± SEM (n = 4). **p < 0.01, as compared with Rps27l+/+ MEFs. (B) No change in p53 protein synthesis. Two independent pairs of MEFs were treated with 50 μM MG132 for 1 hr, and then labeled with [35S]-methionine, followed by IP with p53 Ab. Immunoprecipitates (top), along with whole cell extract (bottom), were then subjected to SDS-PAGE and autoradiography. (C) Reduced p53 poly-ubiquitylation upon Rps27l depletion. Rps27l+/+ or Rps27l−/− MEFs were treated with MG132 for 4 hr before harvesting for IB using indicated Abs. SE: short exposure. (D) Negative regulation of MDM2 protein half-life by RPS27L. H1299 cells were transfected with MDM2 alone, or in combination with RPS27L for 48 hr (top, left), or infected with lenti-virus targeting RPS27L or scrambled control siRNA for 3 days (bottom, left). Cells were then treated with CHX for various time periods before being harvested for IB. Densitometry quantification was performed with ImageJ, and the decay curves are shown (right panels). (E) Sequential change in the protein levels of Mdm2, Mdm4, and p53 upon acute depletion of Rps27l. Rps27lfl/fl;Trp53−/− MEFs were harvested at various time points following infection with indicated adenovirus and subjected to IB.
Figure 5 with 1 supplement
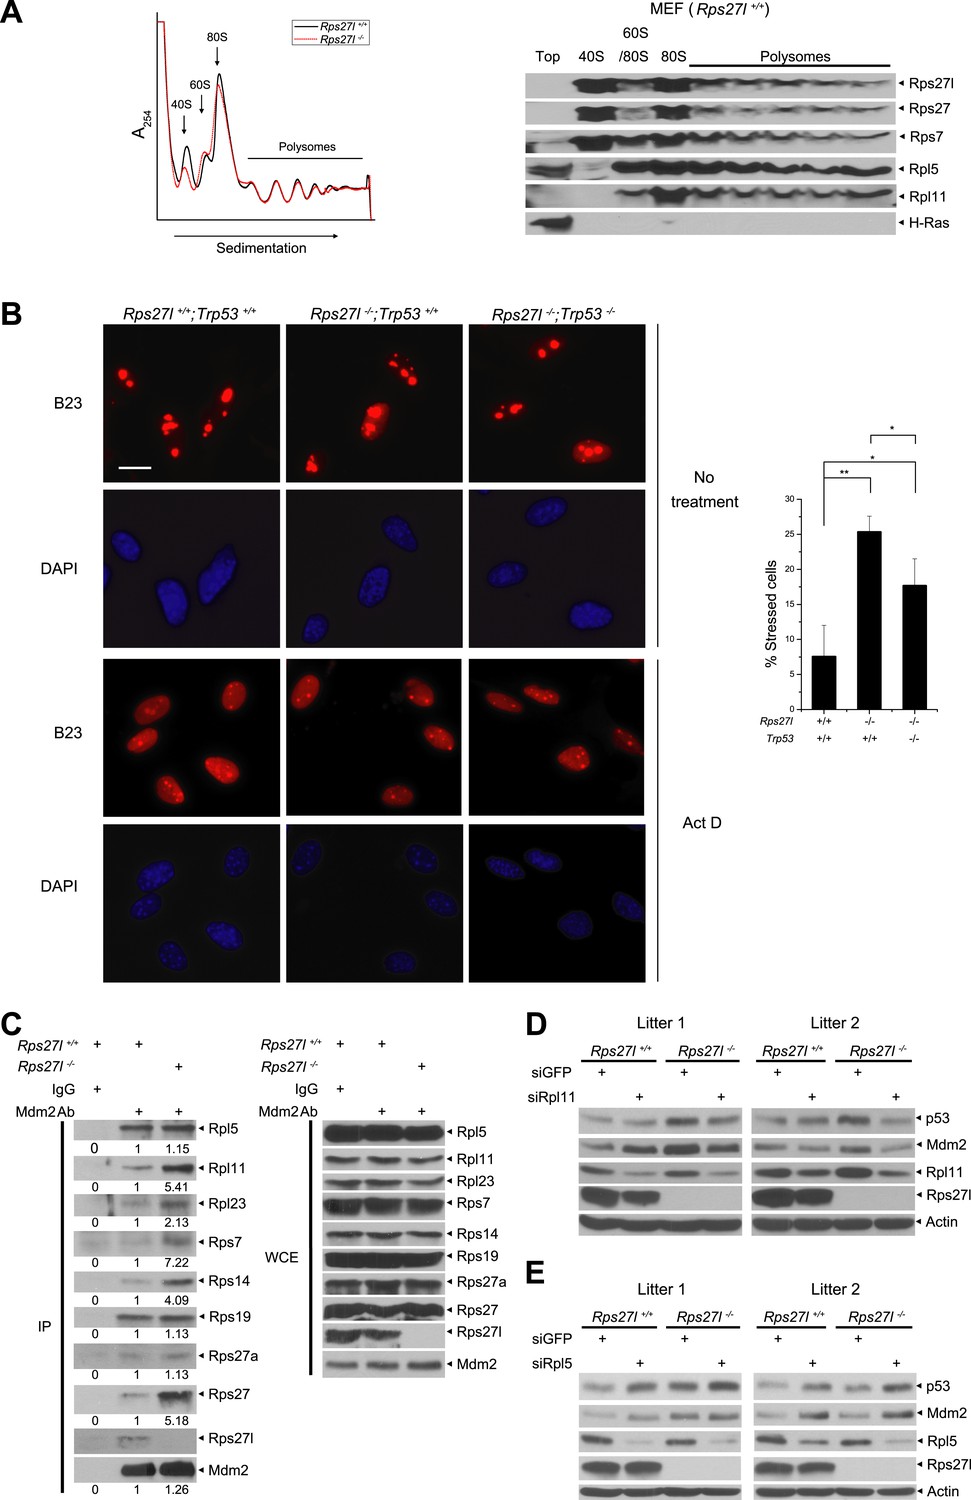
Rps27l is a ribosomal protein whose depletion triggers ribosomal stress.
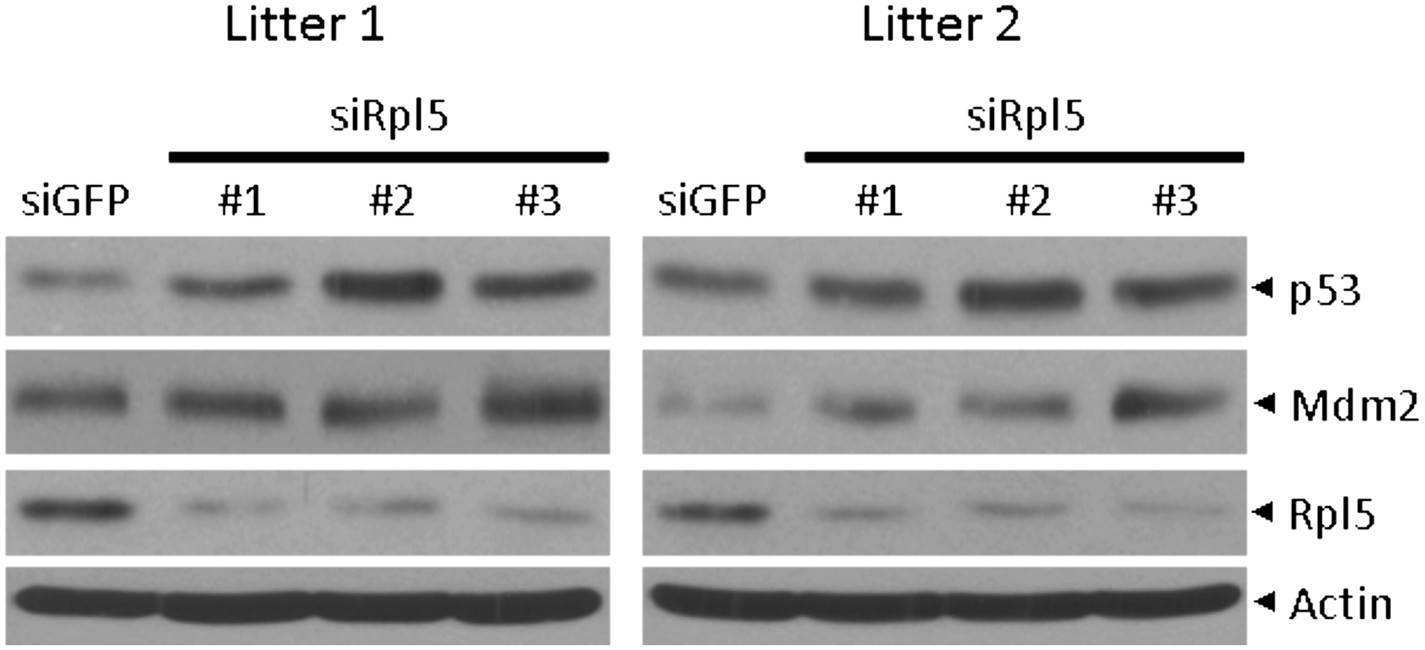
(A) Rps27l is a ribosomal protein. Rps27l+/+ or Rps27l−/− MEFs were treated with CHX for 30 min before harvesting for ribosomal profiling. The cytoplasmic extracts were loaded on sucrose gradients (10%–50%) and subjected to ultra-centrifugation. Gradients were then fractionated and measured by optical density at 254 nm (top). The fractions from Rps27l+/+ MEFs were subjected to IB using indicated Abs (bottom). (B) B23 is released from nucleoli upon Rps27l depletion. MEFs with indicated genotypes were left untreated or treated with 5 nM Act D for 24 hr, followed by immunofluoresent staining of B23 (left). Scale bar represents 20 µm. Cells with nucleolus and/or nucleoplasmic B23 staining were counted and expressed as percentage of total cells (at least 200) counted (right). Shown are mean ± SD. **p < 0.01; *p < 0.05. (C) The change in Mdm2 binding of various ribosomal proteins in Rps27l−/− MEFs. Rps27l+/+ or Rps27l−/− MEFs were treated with 5 nM Act D for 4 hr before being harvested for IP with Mdm2 Ab or normal IgG control, followed by IB with indicated Abs (left), or for direct IB with indicated Abs (right). Densitometry quantification was performed with ImageJ. (D and E) Activation of p53 by Rps27l-deficiency is dependent on Rpl11, but not Rpl5. Two independent pairs of MEFs were infected with lentivirus expressing short hairpin RNA (shRNA) against GFP as a negative control or against Rpl11 (D) or Rpl5 (E) before being harvested for IB with indicated Abs.
Figure 5—figure supplement 1
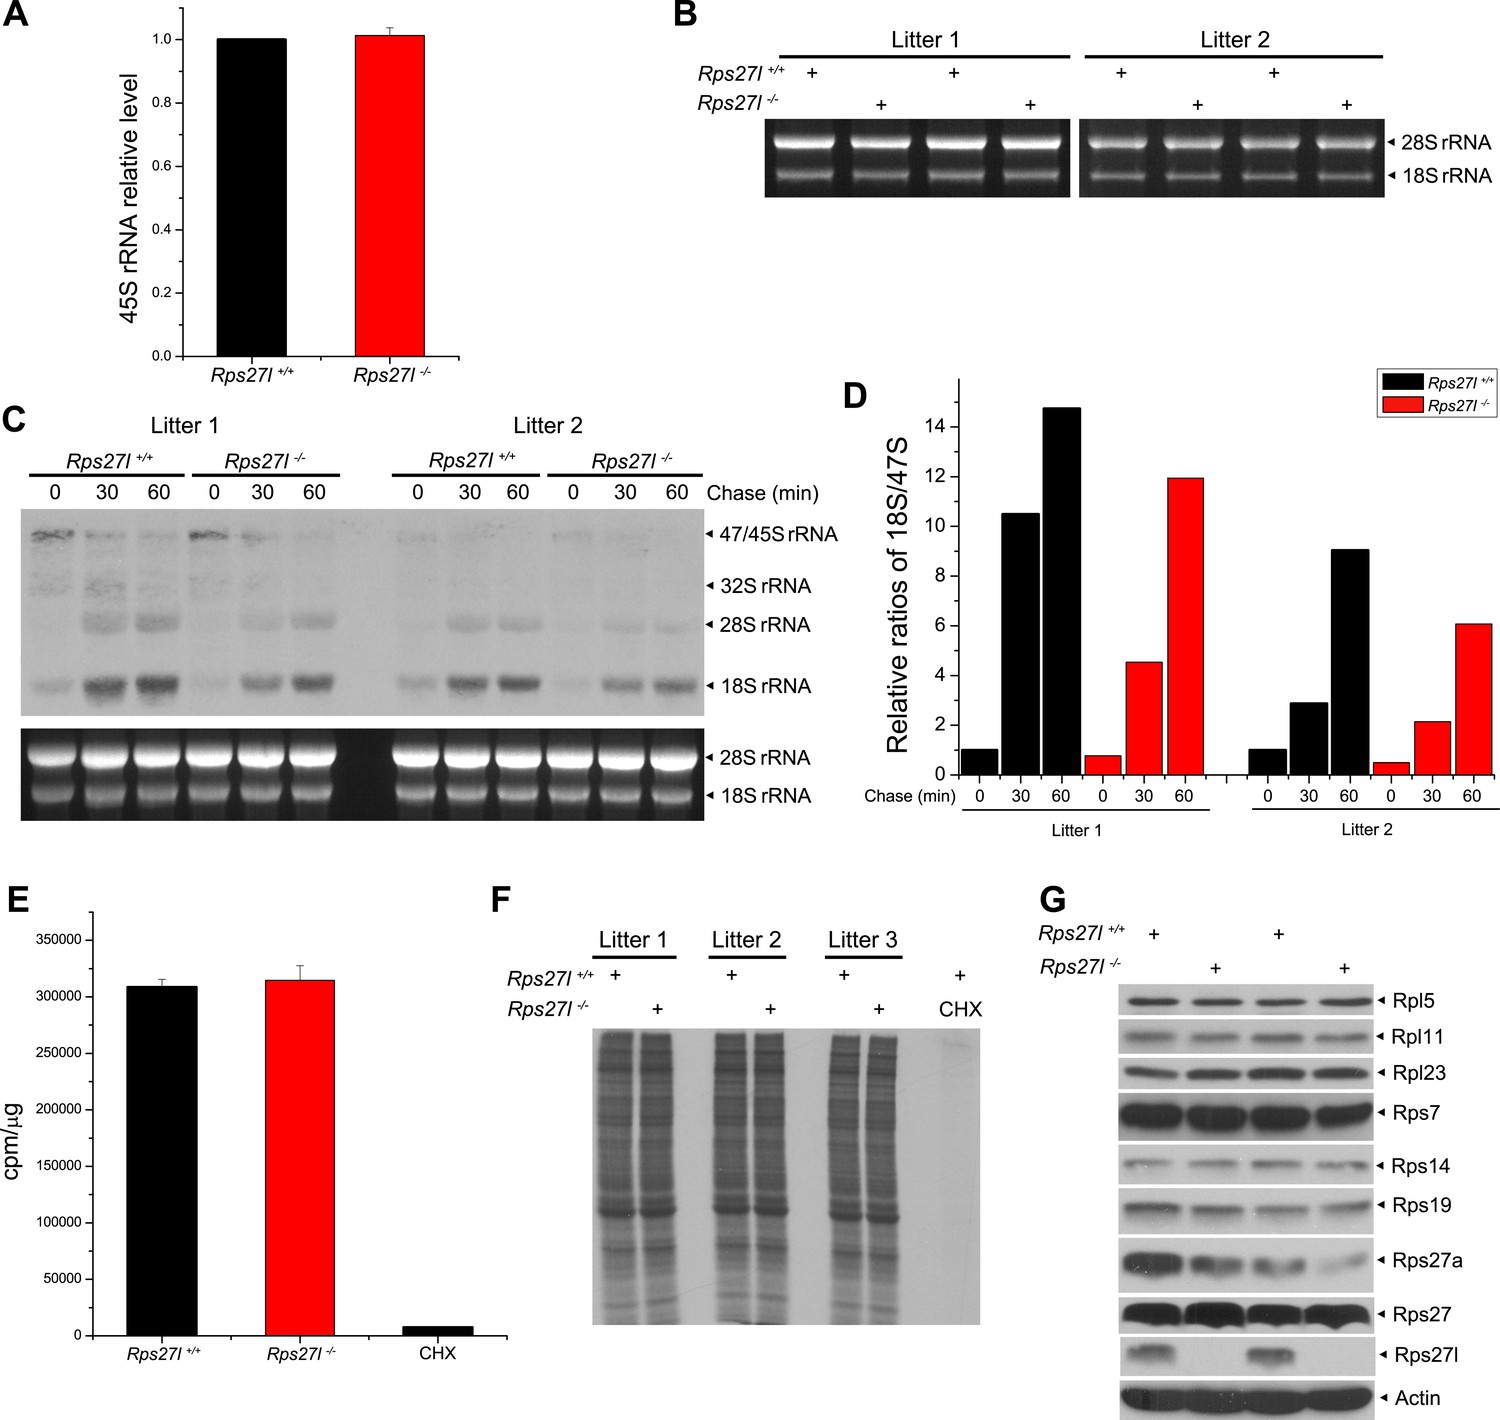
Rps27l disruption has minimal effects on rDNA transcription, rRNA processing and/or protein synthesis.
(A) Rps27l loss does not impair the transcription of rDNA. Four independent pairs of MEFs were harvested for quantitative real-time PCR using primers for 45S rRNA. Shown are mean ± SEM (n = 4). (B) No change in 28S and 18S rRNA levels upon Rps27l disruption. Four pairs of MEFs from two independent litters were harvested for RNA extraction. Equal amounts of RNA were analyzed by formaldehyde gel electrophoresis with ethidium bromide staining. (C and D) Rps27l loss moderately affects the kinetics of rRNA processing. Two independent pairs of MEFs were pulse labeled with L-[methyl-3H]-methionine, and chased for the indicated times. Total RNA was isolated and subjected to Northern blotting. Membrane was autographed. Ethidium bromide staining of 28S and 18S rRNA is shown in the bottom panel as a loading control (C). The band density of 18S rRNA and 47S pre-RNA were quantified with ImageJ. The relative ratios of 18S rRNA to 47S pre-RNA, with the value of the 18S/47S ratio in Rps27l+/+ cells at 0 min arbitrarily set at 1, are shown (D). (E and F) Rps27l loss had no effect on general protein synthesis. Three independent pairs of MEFs were labeled with [35S]-methionine for 1 hr. Total [35S]-Met incorporation was measured using liquid scintillation counting (E). Equal amounts of protein were subjected to SDS-PAGE (F). Cycloheximide (CHX) (100 µg/ml) was used to inhibit new protein synthesis, serving as a labeling control. (G) No change in the levels of various ribosomal proteins known to bind to Mdm2. Two independent pairs of MEFs were harvested and subjected to IB with indicated antibodies.
Figure 6 with 1 supplement
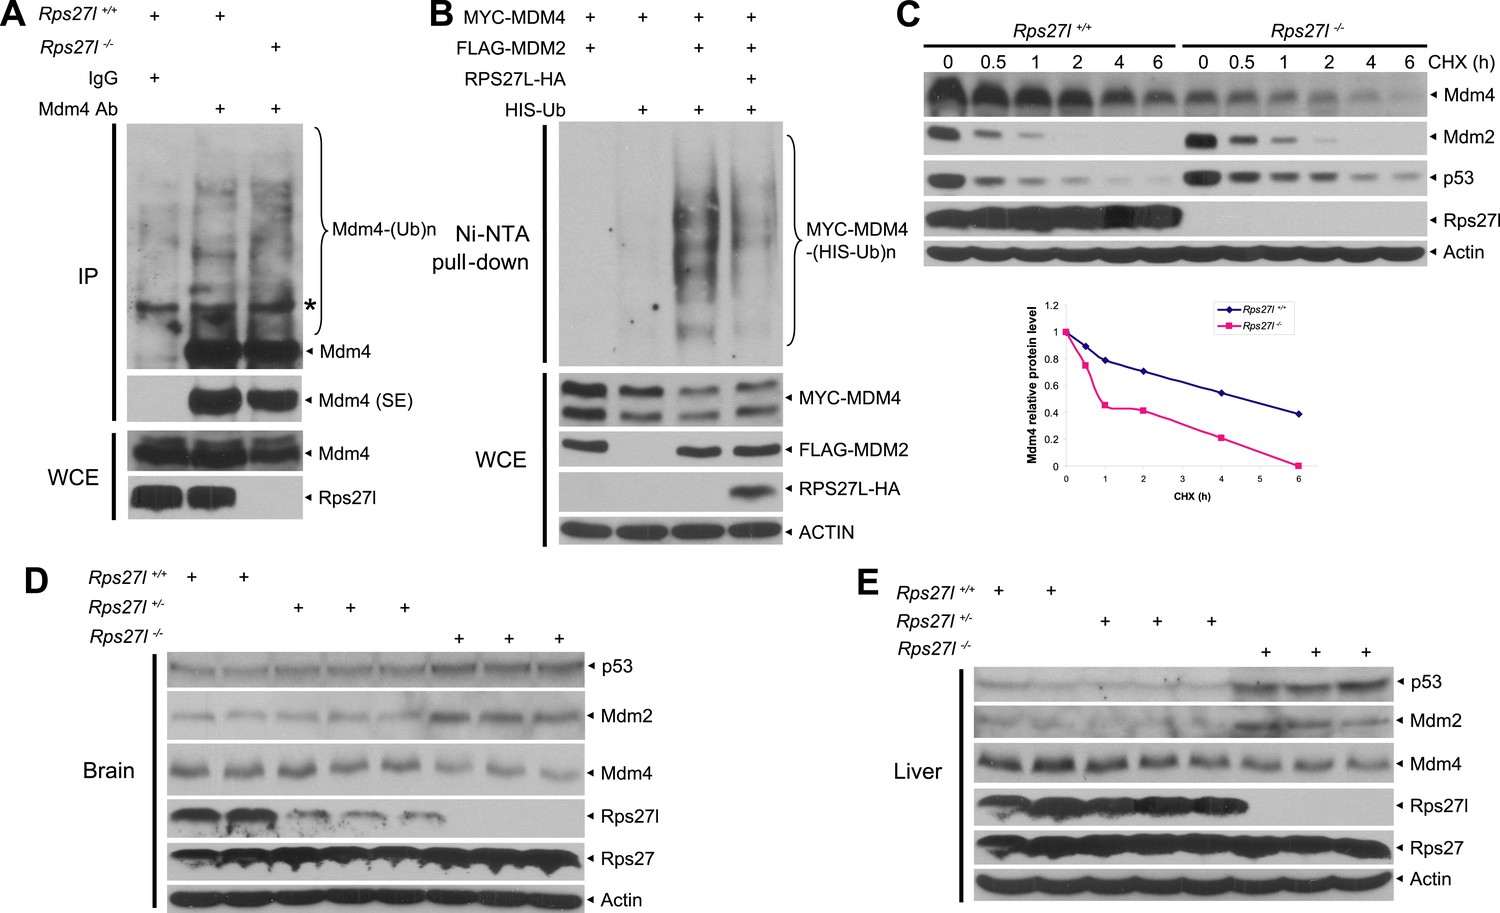
Rps27l depletion leads to Mdm2-mediated Mdm4 degradation.
(A) Increased Mdm4 ubiquitylation upon Rps27l disruption. Rps27l+/+ or Rps27l−/− MEFs were treated with MG132 before being harvested for IP with Mdm4 Ab or normal IgG control, followed by IB with Mdm4 Ab (top), or for direct IB with indicated Abs (bottom). SE: short exposure. (B) MDM2-mediated MDM4 ubiquitylation is inhibited by ectopic RPS27L. H1299 cells were transfected with indicated plasmids. At 24 hr post-transfection, cells were treated with MG132 for 4 hr, and then harvested for purification of His-tagged ubiquitylated proteins by Ni-NTA beads, followed by IB with Myc-tag Ab to detect MDM4 ubiquitylation (top), or for direct IB with indicated Abs (bottom). (C) Shortened Mdm4 protein half-life upon Rps27l disruption. Rps27l+/+ or Rps27l−/− MEFs were harvested at various time points post CHX treatment for IB (top). Densitometry quantification was performed with ImageJ, and the decay curves are shown (bottom). (D and E) Increased protein levels of p53 and Mdm2 and decreased protein level of Mdm4 in Rps27l−/− brains (D) and livers (E). Brain and liver tissues from P6 pups with indicated genotypes were harvested and lysed for IB.
Figure 6—figure supplement 1
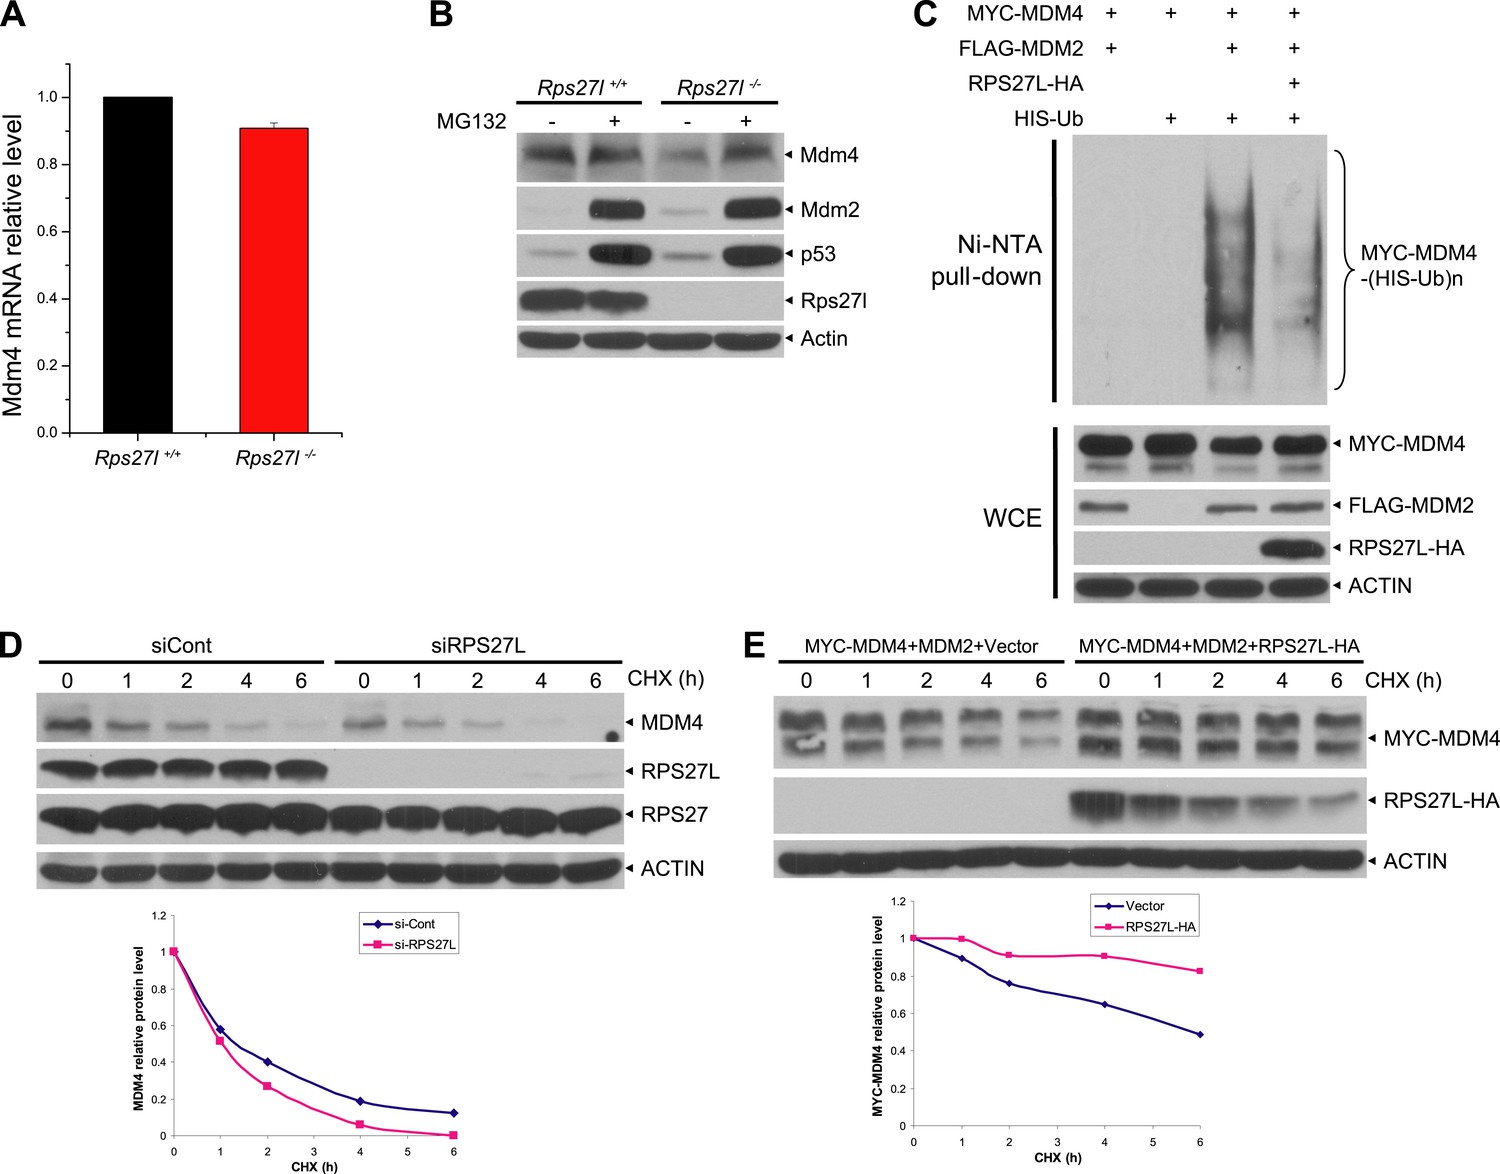
Rps27l regulates Mdm2-mediated Mdm4 degradation.
(A) No change in Mdm4 mRNA transcription. Four independent pairs of MEFs were harvested for qRT-PCR using indicated primers. Shown are mean ± SEM (n = 2). (B) Reduced Mdm4 protein level in Rps27l−/− MEFs is due to enhanced degradation. The paired MEFs were left untreated or treated with MG132 for 4 hr, followed by IB. (C) MDM2-mediated MDM4 ubiquitylation is inhibited by ectopically expressed RPS27L. The 293 cells were transfected with indicated plasmids. At 48 hr post-transfection, cells were treated with MG132 for 4 hr, lysed, followed by purification of His-tagged ubiquitylated proteins by Ni-NTA beads, followed by IB with Myc-tag Ab (top), or for direct IB with indicated Abs (bottom). (D and E) Regulation of MDM4 protein half-life by RPS27L. H1299 cells were infected with lenti-virus targeting RPS27L or scrambled control siRNA for 3 days (D), or transfected with MYC-MDM4 and MDM2 alone, or in combination with RPS27L for 48 hr (E). Cells were then treated with CHX for various time periods before being harvested for IB. Densitometry quantification was performed with ImageJ, and the decay curves are shown (bottom panels).
Figure 7 with 1 supplement
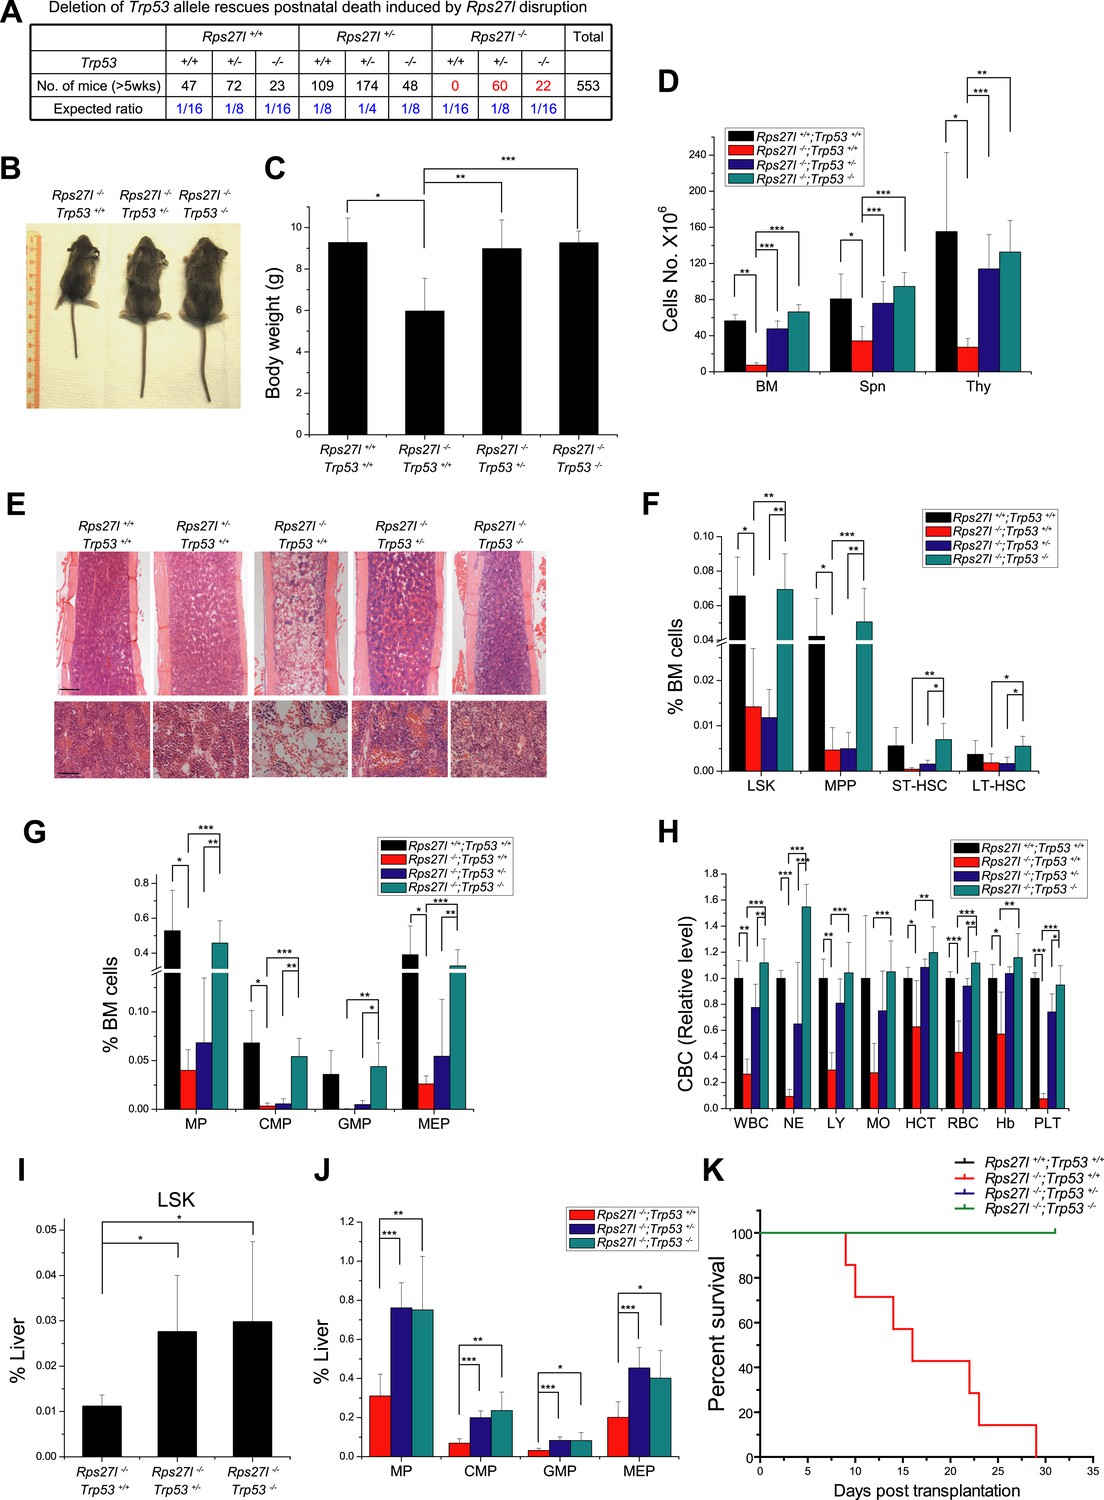
Simultaneous deletion of Trp53 rescues growth retardation and HSPCs depletion.
(A) Deletion of Trp53 rescues postnatal death by Rps27l disruption. Lower than expected number of mice with Trp53−/− genotype (regardless of Rps27l genotype) is due to high frequency of developmental abnormalities during embryonic and neonatal stages which cause the premature death (Armstrong et al., 1995; Sah et al., 1995). (B–D) Deletion of Trp53 rescues growth retardation and organ hypocellularity. Representative mice at P18 of three genotypes were photographed (B). The bodies (C) were weighed; and the total cell numbers (D) of bone marrow (femur and tibia from two hind limbs), spleen, and thymus were counted from P18 mice with genotypes of Rps27l+/+;Trp53+/+ (n = 3), Rps27l−/−;Trp53+/+ (n = 7), Rps27l−/−-;Trp53+/− (n = 10), Rps27l−/−;Trp53−/− (n = 5). Shown are mean ± SD. *p < 0.05, **p < 0.01, and ***p < 0.001. (E) Representative H&E staining of bone marrows in femurs from P18 mice. Scale bars represent 200 µm (top) or 40 µm (bottom). (F and G) Deletion of Trp53 rescues HSPCs depletion in Rps27l−/− bone marrow. The percentage of LSK, MPP, ST-HSC, and LT-HSC (F); and the percentage of MP, CMP, GMP, and MEP (G) in bone marrow from P18 mice with genotypes of Rps27l+/+;Trp53+/+ (n = 4), Rps27l−/−;Trp53+/+ (n = 5), Rps27l−/−;Trp53+/− (n = 7), and Rps27l−/−;Trp53−/− (n = 5). LSK: Lin−/Sca-1−/c-Kit+; MPP: Lin−/Sca-1−/c-Kit+/CD48+/CD150−; ST-HSC: Lin−/Sca-1−/c-Kit+/CD48+/CD150+; LT-HSC: Lin−/Sca-1−/c-Kit+/CD48−/CD150+. Shown are mean ± SD. *p < 0.05, **p < 0.01, and ***p < 0.001. (H) Deletion of Trp53 rescues defects in Rps27l−/− peripheral blood. CBC classification of peripheral blood from Rps27l+/+;Trp53+/+ (n = 3), Rps27l−/−;Trp53+/+ (n = 7), Rps27l−/−;Trp53+/− (n = 10), Rps27l−/−;Trp53−/− (n = 5) mice at P18 was performed. WBC, white blood cells; NE, neutrophils; LY, lymphocytes; MO, monocytes; HCT, hematocrit; RBC, red blood cells; Hb, hemoglobin; PLT, platelets. Shown are mean ± SD. *p < 0.05, **p < 0.01, and ***p < 0.001. (I and J) Deletion of Trp53 rescues HSPCs depletion in Rps27l−/− fetal livers. Flow cytometry analysis was performed to measure the percentage of HSPCs including LSK (I), MP, CMP, GMP, and MEP (J) in E14.5 fetal livers with genotypes of Rps27l−/−;Trp53+/+ (n = 5), Rps27l−/−;Trp53+/− (n = 7), and Rps27l−/−;Trp53−/− (n = 6). Shown are mean ± SD. *p < 0.05, **p < 0.01, and ***p < 0.001, as compared to Rps27l−/−;Trp53+/+. (K) Kaplan–Meier survival curves of recipient mice after transplantation. Fetal liver cells (2 × 10⁶ cells) from E14.5 embryos with indicated genotypes were respectively injected into lethally irradiated recipient mice (n = 7 for each genotype). p < 0.0001.
Figure 7—figure supplement 1
Simultaneous deletion of Trp53 rescues defective phenotypes caused by Rps27l disruption.
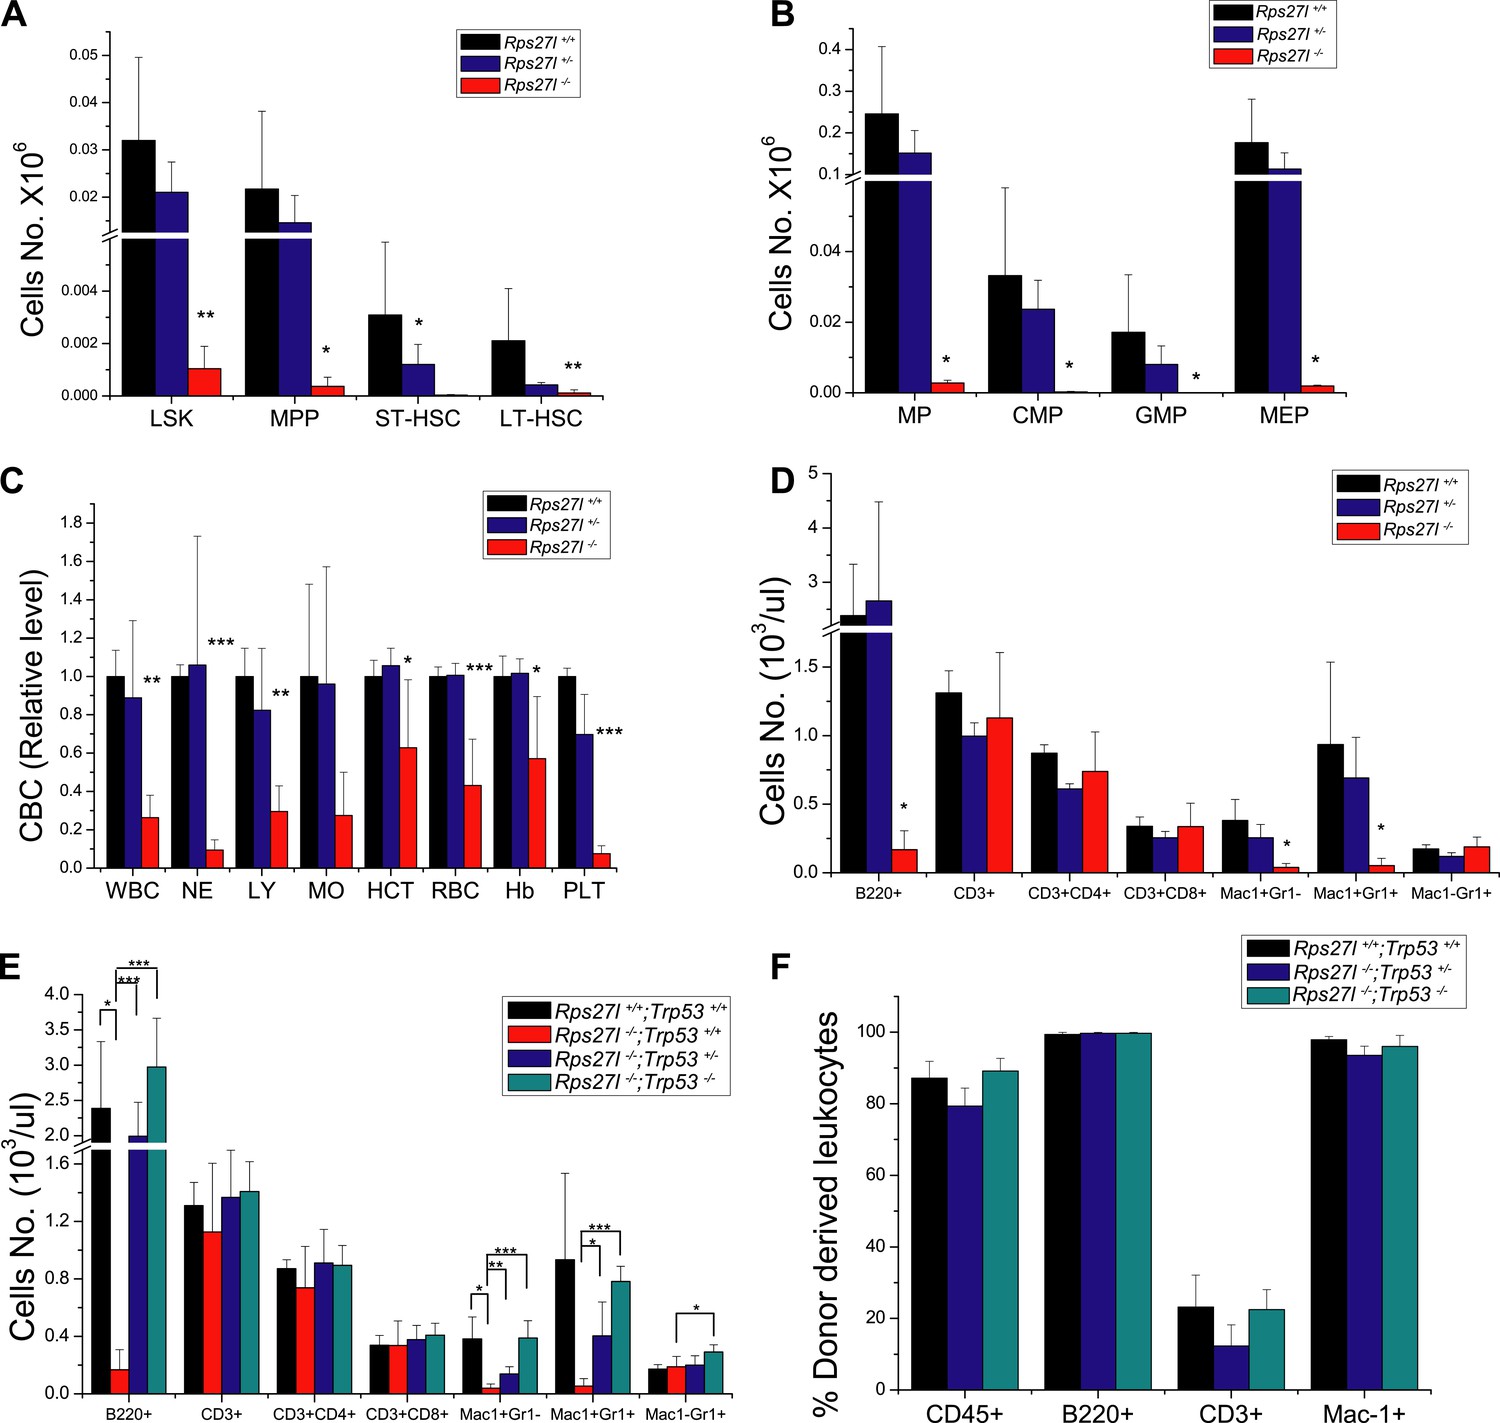
(A and B) Significant HSPCs decrease in bone marrow of Rps27l−/− mice. Bone marrow cells from Rps27l+/+ (n = 4), Rps27l+/− (n = 4), and Rps27l−/− (n = 5) mice at P18 under a mixed Sv129/B6 background were stained with Abs against surface markers, followed by FACS analysis. The total cell numbers of LSK, MPP, ST-HSC, and LT-HSC (A) and the total numbers of MP, CMP, GMP, and MEP (B) were summarized. Shown are mean ± SD. *p < 0.05, **p < 0.01, as compared to Rps27l+/+ counterparts. (C and D) Depletion of peripheral blood cells in Rps27l−/− mice. Shown are CBC classification of peripheral blood cells (C) and the cell density of leukocytes with different surface markers in peripheral blood (D) from Rps27l+/+ (n = 3), Rps27l+/− (n = 4), and Rps27l−/− (n = 7) mice at P18 under a mixed Sv129/B6 background. Shown are mean ± SD. *p < 0.05, **p < 0.01, ***p < 0.001, as compared with Rps27l+/+ counterparts. (E) Deletion of Trp53 rescues defects in peripheral blood cells. The cell density of leukocytes with different surface markers in peripheral blood from Rps27l+/+;Trp53+/+ (n = 3), Rps27l−/−;Trp53+/+ (n = 7), Rps27l−/−;Trp53+/− (n = 10), Rps27l−/−;Trp53−/− (n = 5) mice at P18 were summarized. Shown are mean ± SD. *p < 0.05, **p < 0.01, ***p < 0.001. (F) Deletion of Trp53 rescues the reconstitution defects. The percentage of CD45.2+, B220+, CD3+, and Mac-1+ cells derived from the indicated donor mice at 4 weeks post transplantation were measured and plotted. Shown are mean ± SD. **p < 0.01, ***p < 0.001, as compared with Rps27l+/+;Trp53+/+ (n = 7 for each genotype).
Figure 8 with 1 supplement

Rps27l disruption induces genomic instability and spontaneous lymphoma.
(A and B) Kaplan–Meier survival curves of Trp53−/− (A) and Trp53+/− (B) mice with three Rps27l genotypes and indicated numbers of mice. p = 0.713 (A); p = 0.0036 (B). (C) Representative pictures of lymphomas developed from Rps27l−/−; Trp53+/− mice. (D) Representative FACS profiles of T cells from lymphomas. Lymphoma cells were isolated and subjected to FACS analysis using Abs against indicated surface markers. (E) Representative pictures of metaphases from four tumors developed from Rps27l−/−;Trp53+/− mice (top). Chromosome numbers (n) were counted. Scale bar represent 10 μm. Frequency of diploid and aneuploidy from four tumors developed in Rps27l−/−;Trp53+/− mice with 100 metaphases counted (bottom). (F) Frequency of diploid and aneuploidy from four pairs of primary MEFs at P2 and P3 derived from Rps27l−/−;Trp53+/− vs Rps27l+/+;Trp53+/− embryos with at least 100 metaphases counted in each sample. Shown are mean ± SD. *p < 0.05, **p < 0.01, and ***p < 0.001. (G) Trp53 dosage in four pairs of primary MEFs at P3 derived from Rps27l−/−;Trp53+/− (R−/−;T+/−) vs Rps27l+/+;Trp53+/− (R+/+;T+/−) embryos. Amounts of p53 DNA in individual MEFs were quantified by qPCR using three sets of primers for exons 5, 6, and 7. The combined results (n = 3 for each primer set, mean ± SD) were presented with the values from Rps27l+/+;Trp53+/− MEFs averaged and set as 1. (H) Frequency of diploid and aneuploidy from primary MEFs at P2 and P3 derived from Rps27l−/−;Trp53+/+ (n = 7) vs Rps27l+/+;Trp53+/+ (n = 3) individual embryos with at least 100 metaphases counted in each sample. Shown are mean ± SD. p = 0.15. (I and J) Increased levels of p53 and p53 targets and decreased levels of Arf upon Rps27l disruption in Trp53+/− MEFs. Primary MEFs at P2 and P3 derived from Rps27l+/+;Trp53+/− and Rps27l−/−;Trp53+/− embryos were left untreated (I) or treated with 5 nM ActD for indicated time periods (J) before being harvested for IB with indicated Abs.
Figure 8—figure supplement 1
Rps27l disruption induces genomic instability and spontaneous lymphoma.
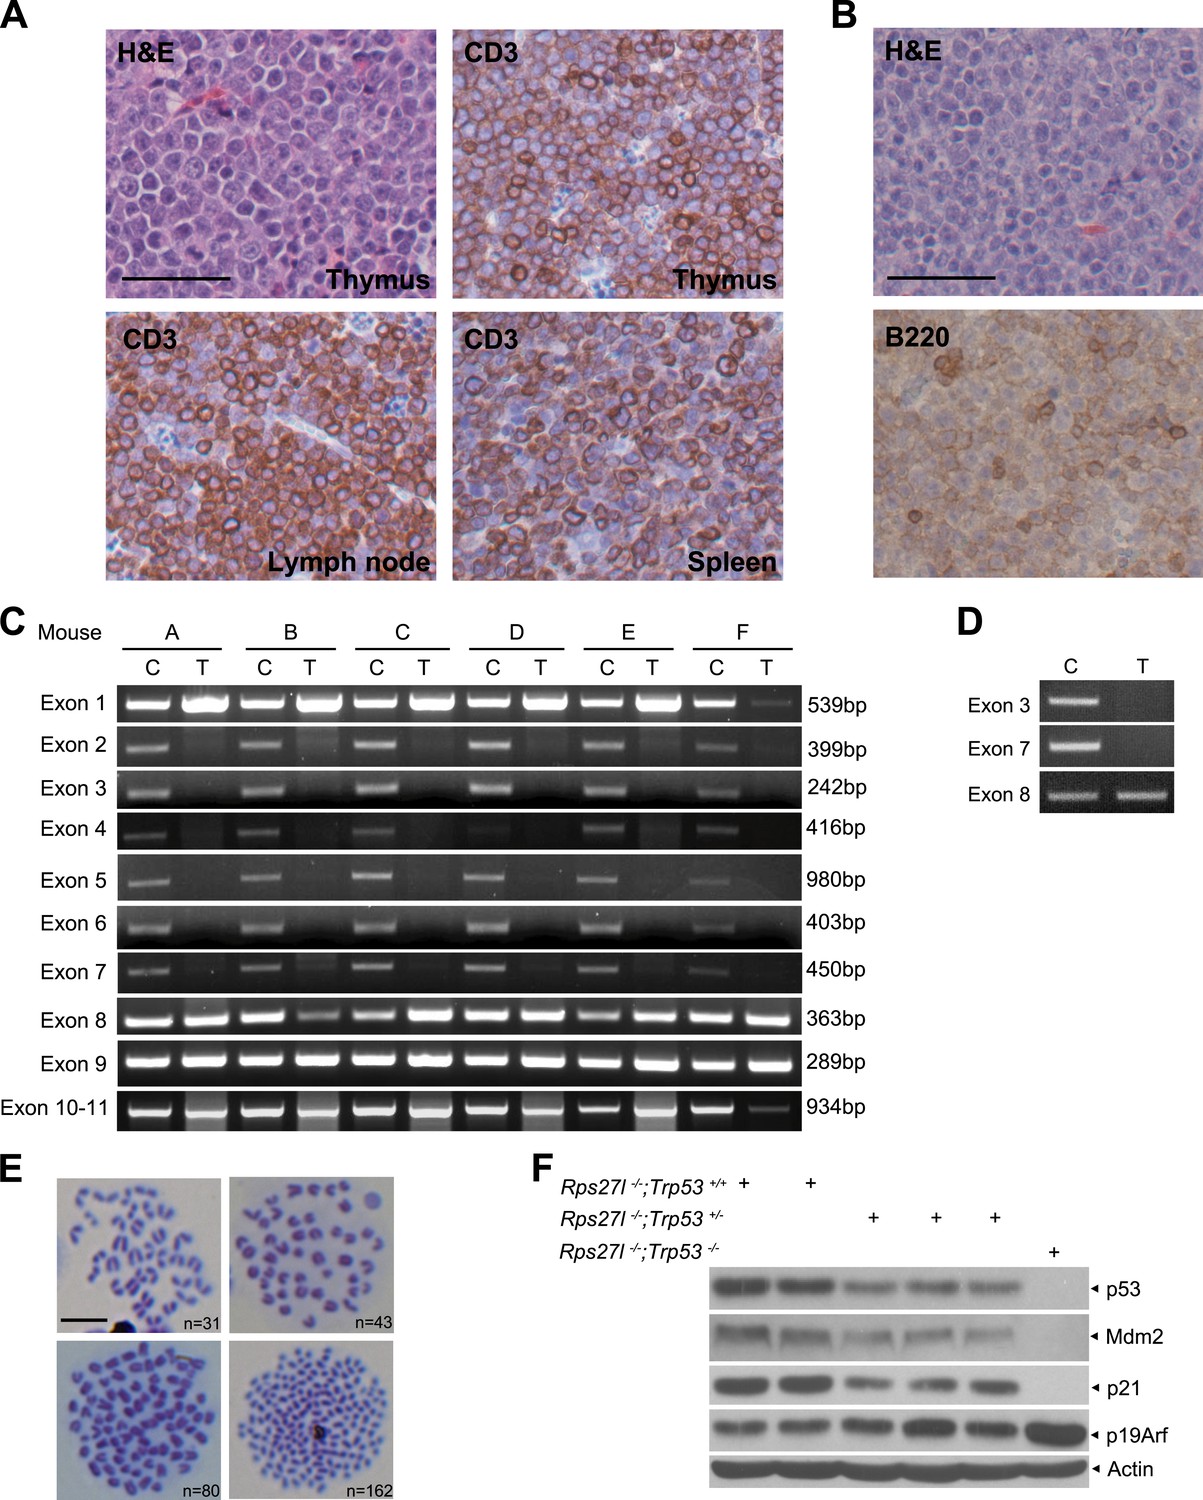
(A) Representative staining with H&E and CD3, a T cell marker of indicated tissues from a Rps27l−/−;Trp53+/− mouse. Scale bar = 50 µm. (B) Representative staining with H&E and B220, a B cell marker of the spleen tissue from a Rps27l−/−;Trp53+/− mouse. Scale bar = 50 µm. (C and D) Deletion of wild type Trp53 allele in T-cell (C) and B-cell lymphoma (D). Genomic DNA from tails (C) and lymphomas (T) were extracted and amplified with primers to detect indicated Trp53 exons. (E) Representative pictures of metaphases from four tumors developed in Rps27l−/−;Trp53+/− mice. Chromosome numbers (n) were counted. Scale bar = 10 μm. (F) p53 level and activity are higher in Rps27l−/−; Trp53+/+ than in Rps27l−/−; Trp53+/− MEFs. Primary MEFs derived from embryonic littermates with indicated genotypes were harvested for IB with indicated Abs.
Figure 9

Rps27l is a p53 regulator and also a p53 ‘goalkeeper’—a working model.
In normal cell with wild-type p53 (Trp53+/+), Rps27l, upon induction by p53 in response to various stresses, stabilizes the Mdm2-Mdm4 heterodimer to form an optimal E3 ligase complex for effective p53 ubiquitylation and degradation, thus keeping p53 level in check, leading to normal growth and development (dotted area). Rps27l disruption causes an imbalance in ribosomal protein levels and triggers ribosomal stress to stabilize Mdm2. Increased Mdm2 adapts a conformation that favors the Mdm4 ubiquitylation, leading to a reduced Mdm2-Mdm4 complex and compromised p53 ubiquitylation with an ultimate increase in p53. Moderately increased p53 is sufficient to induce growth retardation and apoptosis by transactivating p21 and Puma, respectively, leading to the depletion of HSPCs and bone marrow, and eventually postnatal death. In cancer-prone cells with a Trp53+/− status, Rps27l plays an essential role in keeping genome integrity. Rps27l disruption triggers genomic instability, followed by selection for Trp53 deletion. The cells with Trp53 deleted are selected for and outgrow to form spontaneous lymphoma.
Author response image 1
Download links
A two-part list of links to download the article, or parts of the article, in various formats.
Downloads (link to download the article as PDF)
Open citations (links to open the citations from this article in various online reference manager services)
Cite this article (links to download the citations from this article in formats compatible with various reference manager tools)
Ribosomal protein S27-like is a physiological regulator of p53 that suppresses genomic instability and tumorigenesis
eLife 3:e02236.
https://doi.org/10.7554/eLife.02236


