Coupled ion binding and structural transitions along the transport cycle of glutamate transporters
- Weill Cornell Medical College, United States
Figures
Figure 1 with 2 supplements

Substrate binding to GltPh-R397A.
(A) Raw binding heat rates measured by isothermal titration calorimetry (top) and binding isotherms (bottom) obtained for GltPh-R397A (left) and wild type GltPh (right) at 25°C in the presence of 100 mM NaCl. The solid lines through the data are fits to the independent binding sites model with the following parameters for GltPh-R397A and wild type GltPh, respectively: enthalpy change (ΔH) of −3.2 and −14.3 kcal/mol; the apparent number of binding sites (n) of 0.8 and 0.7 per monomer; dissociation constant (Kd) of 6.6 µM and 27 nM. Note that L-asp binding to the wild type transporter is too tight at 100 mM NaCl to be accurately measured in this experiment. The binding Kd has been estimated to be ∼1 nM (Boudker et al., 2007). (B) L-asp binding site in GltPh-R397A (left) and wild type GltPh (right). L-asp and residues coordinating the side chain carboxylate are shown as sticks with carbon atoms colored light brown and blue, respectively. Potential hydrogen bonds (distances less than 3.5 Å) between the L-asp side chain carboxylate and transporter residues are shown as dashed lines. Note that Y317, which forms cation-π interactions with guanidium group of R397 in wild type GltPh, interacts directly with L-asp in GltPh-R397A.
Figure 1—figure supplement 1
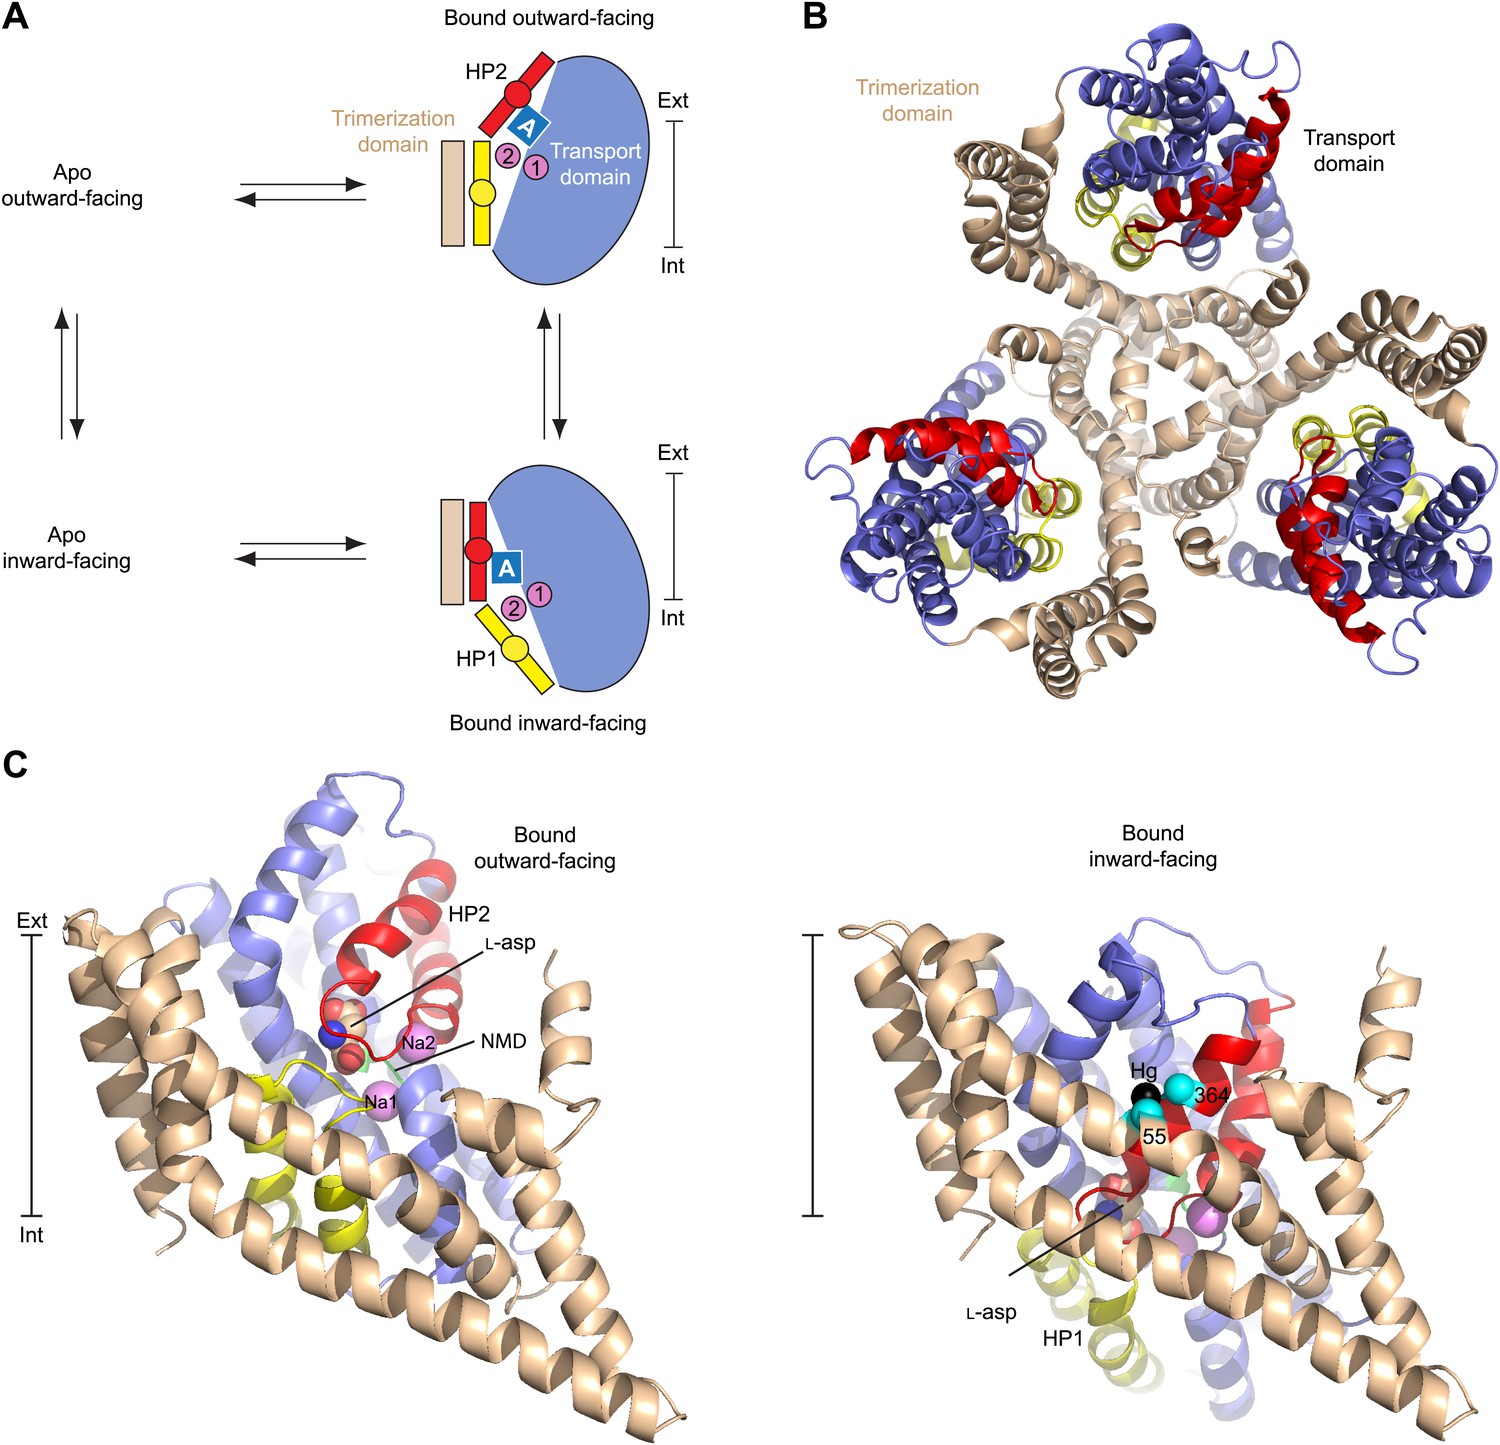
Alternating access mechanism in GltPh.
(A) The transporter consists of a rigid trimerization domain (light brown) and a dynamic transport domain (blue, with HP1 yellow and HP2 red). The apo outward-facing transporter binds the substrate (blue square) and Na+ ions (pink circles) within the transport domain under the tip of HP2. The transport domain moves into the inward-facing state, in which the ligands are occluded from the cytoplasm by the tips of HP1 and HP2, and then released. (B) GltPh trimer viewed from the extracellular medium. (C) Single protomers of the outward-facing GltPh (PDB code 2NWX) (left), and GltPhin (PDB code 3KBC) (right). Cα atoms of the cross-linked cysteine residues and Hg2+ ion are shown as spheres. The bar next to the structures indicates approximately the thickness of the membrane, separating the extracellular (Ext) and intracellular (Int) solutions.
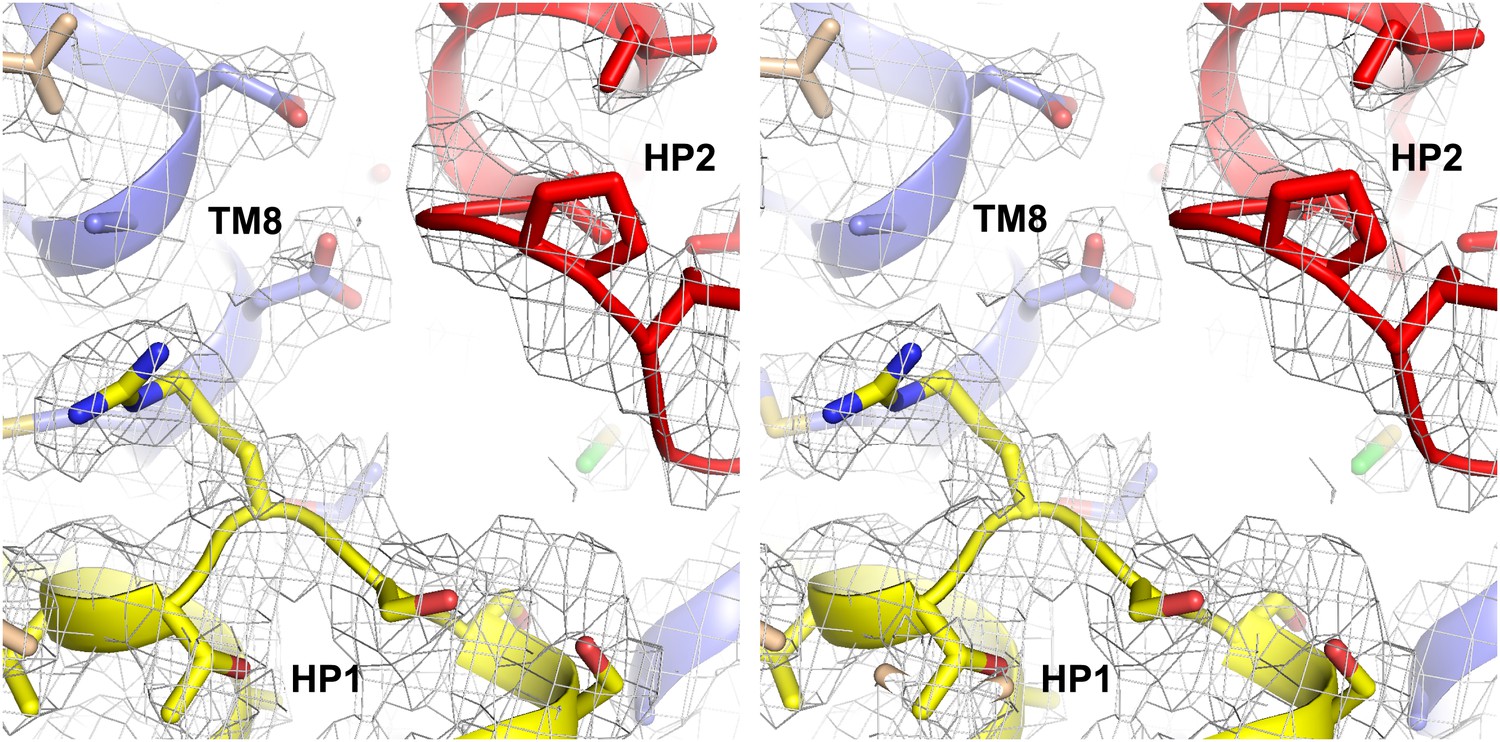
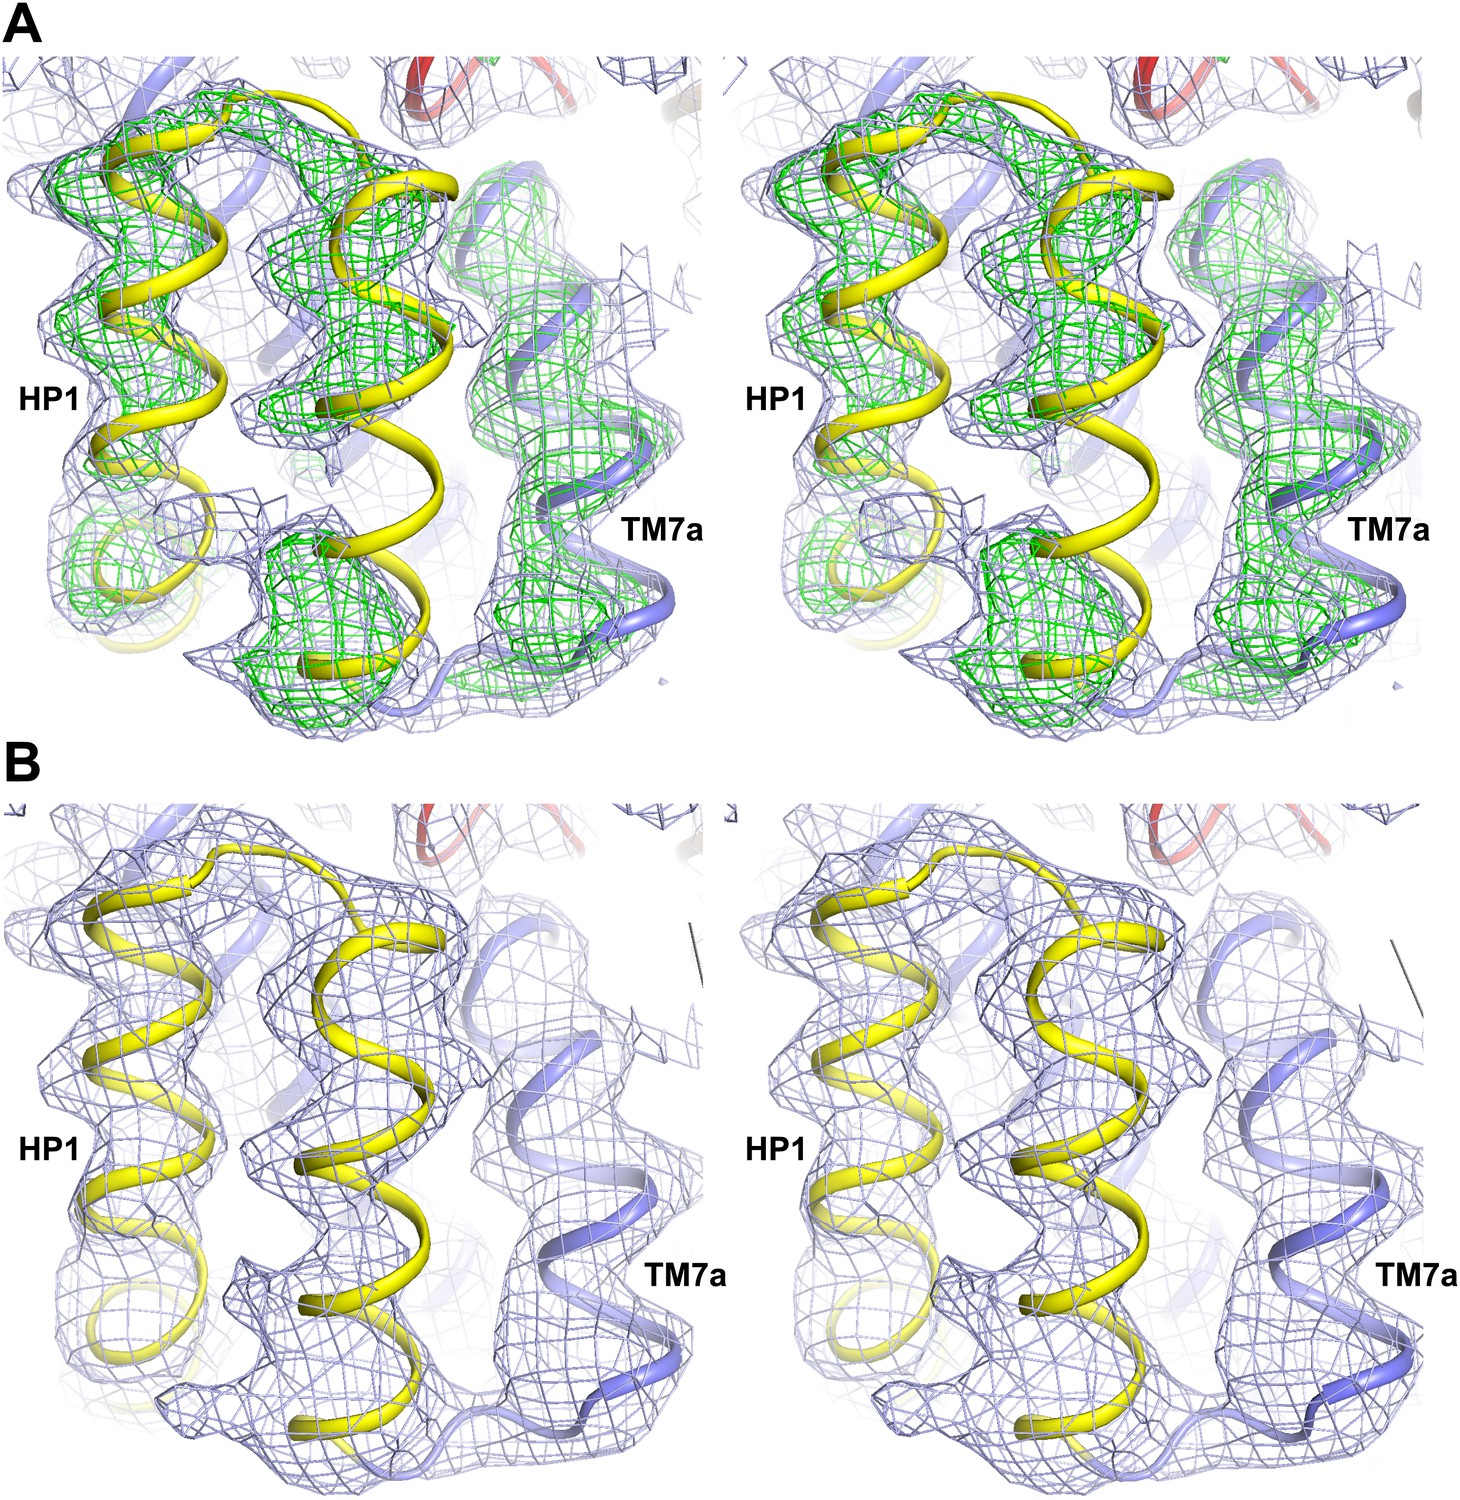
Figure 1—figure supplement 2
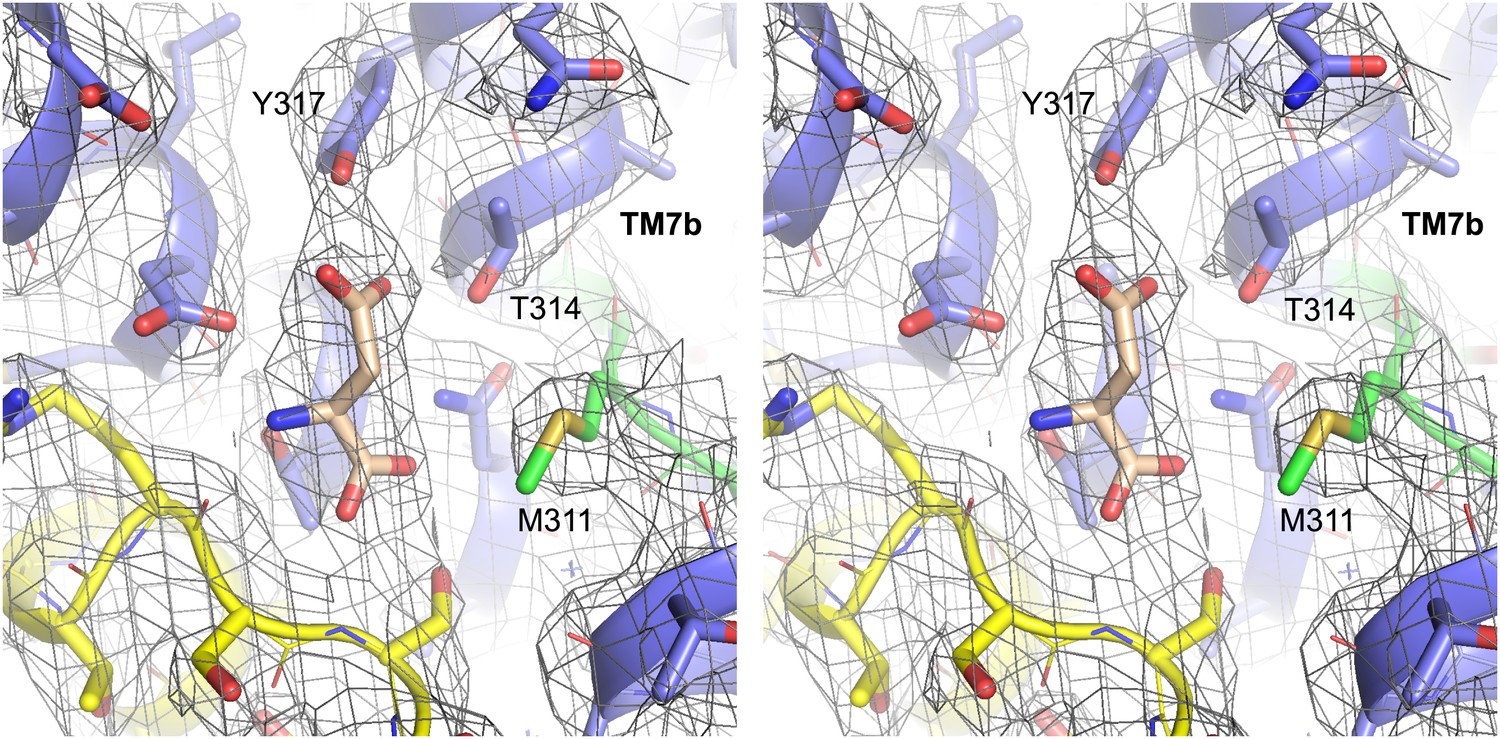
Structure of GltPh-R397A bound to Na+ and L-asp.
Stereo view of the averaged 2Fo-Fc electron density map contoured at 1σ (grey mesh) around residues in L-asp binding site of GltPh-R397A.
Figure 2
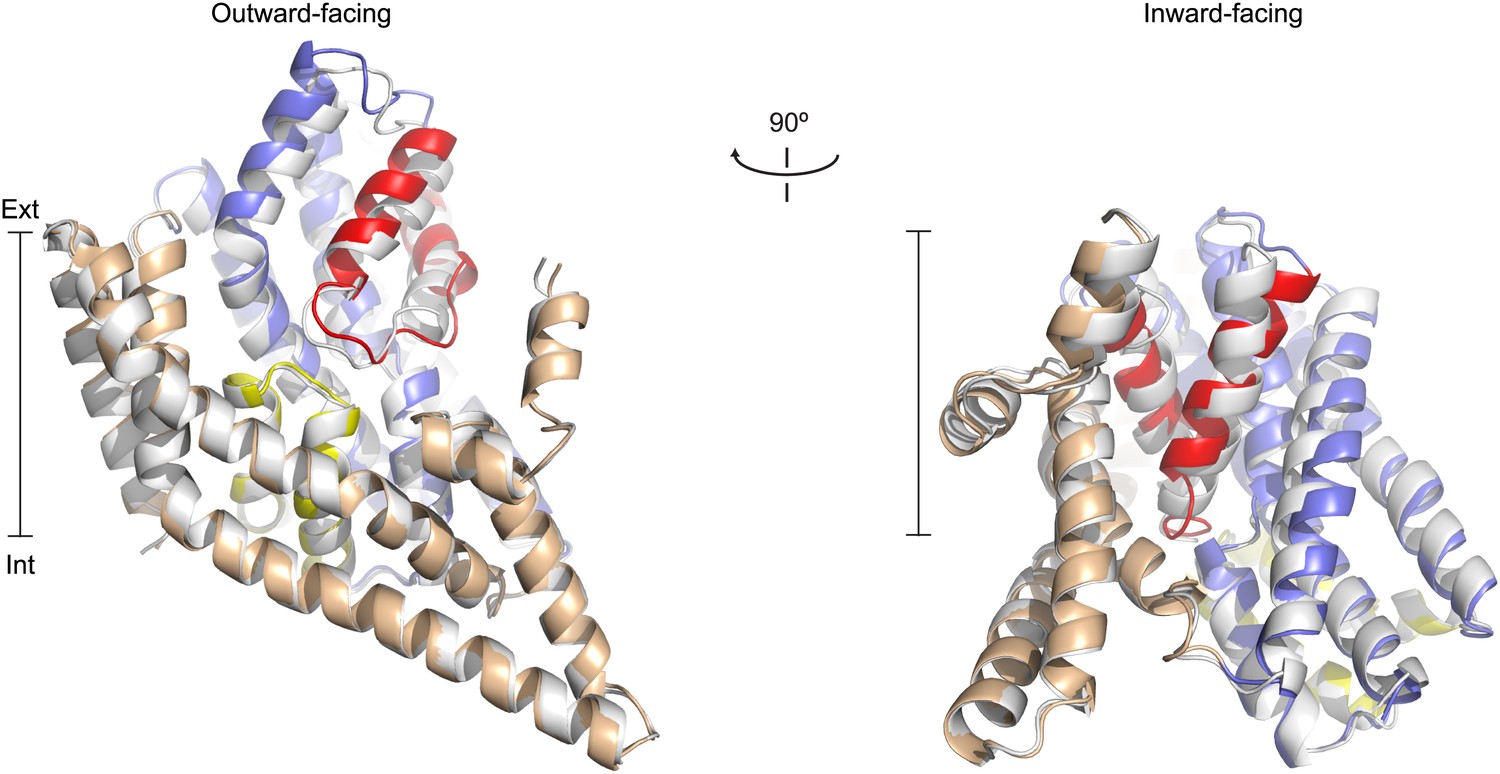
Apo protomer structures.
(A) GltPh protomers in the outward-facing state (left) and a GltPhin protomer (right) viewed from within the plane of the membrane. Shown are superimpositions between apo (colors) and fully bound protomers (grey).
Figure 3 with 2 supplements

Structures of the apo transport domain.
(A) Superimposition of the nearly identical apo transport domains in the outward- and inward-facing states. HP1, HP2, and NMD motif are colored yellow, red, and green, respectively. The remainder of the domain is blue. (B) Superimposition of the fully bound (light colors, PDB accession number 2NWX) and apo GltPhin (dark colors) transport domains. (C) The NMD motif and adjacent TM3. Met311 is shown as sticks, and the light blue spheres indicate the Cα positions for T92 and S93. (D) The HP2-TM8a structural modules in the fully bound (pink) and apo (red) transport domains superimposed on TM8a and HP2b to emphasize the re-orientation of the HP2a. (E) The Na+ and L-asp binding sites in the fully bound (left) and apo forms (right).
Figure 3—figure supplement 1
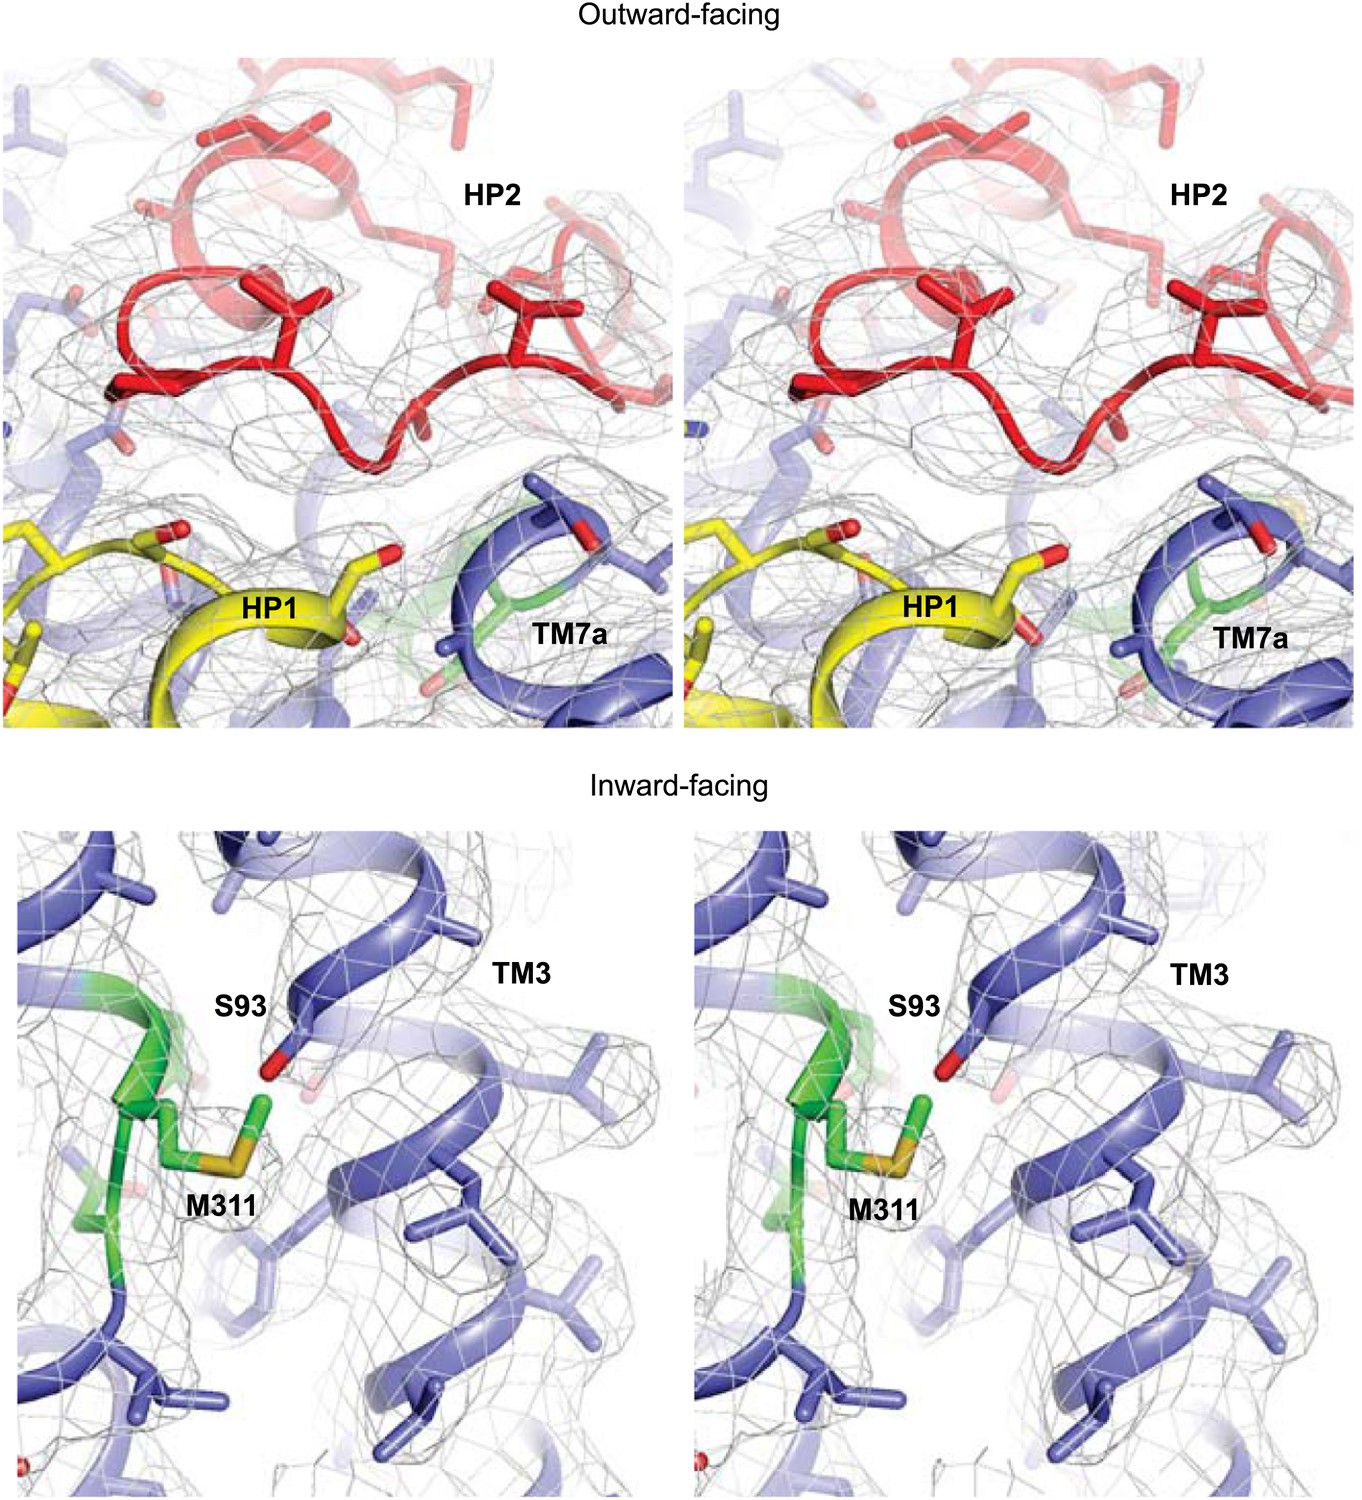
Apo protomer structures.
Stereo views of the averaged 2Fo-Fc electron density maps contoured at 1σ around HP2 tip of the apo GltPh-R397A (top) and the NMD motif and TM3 of the apo GltPhin (bottom).
Figure 3—figure supplement 2
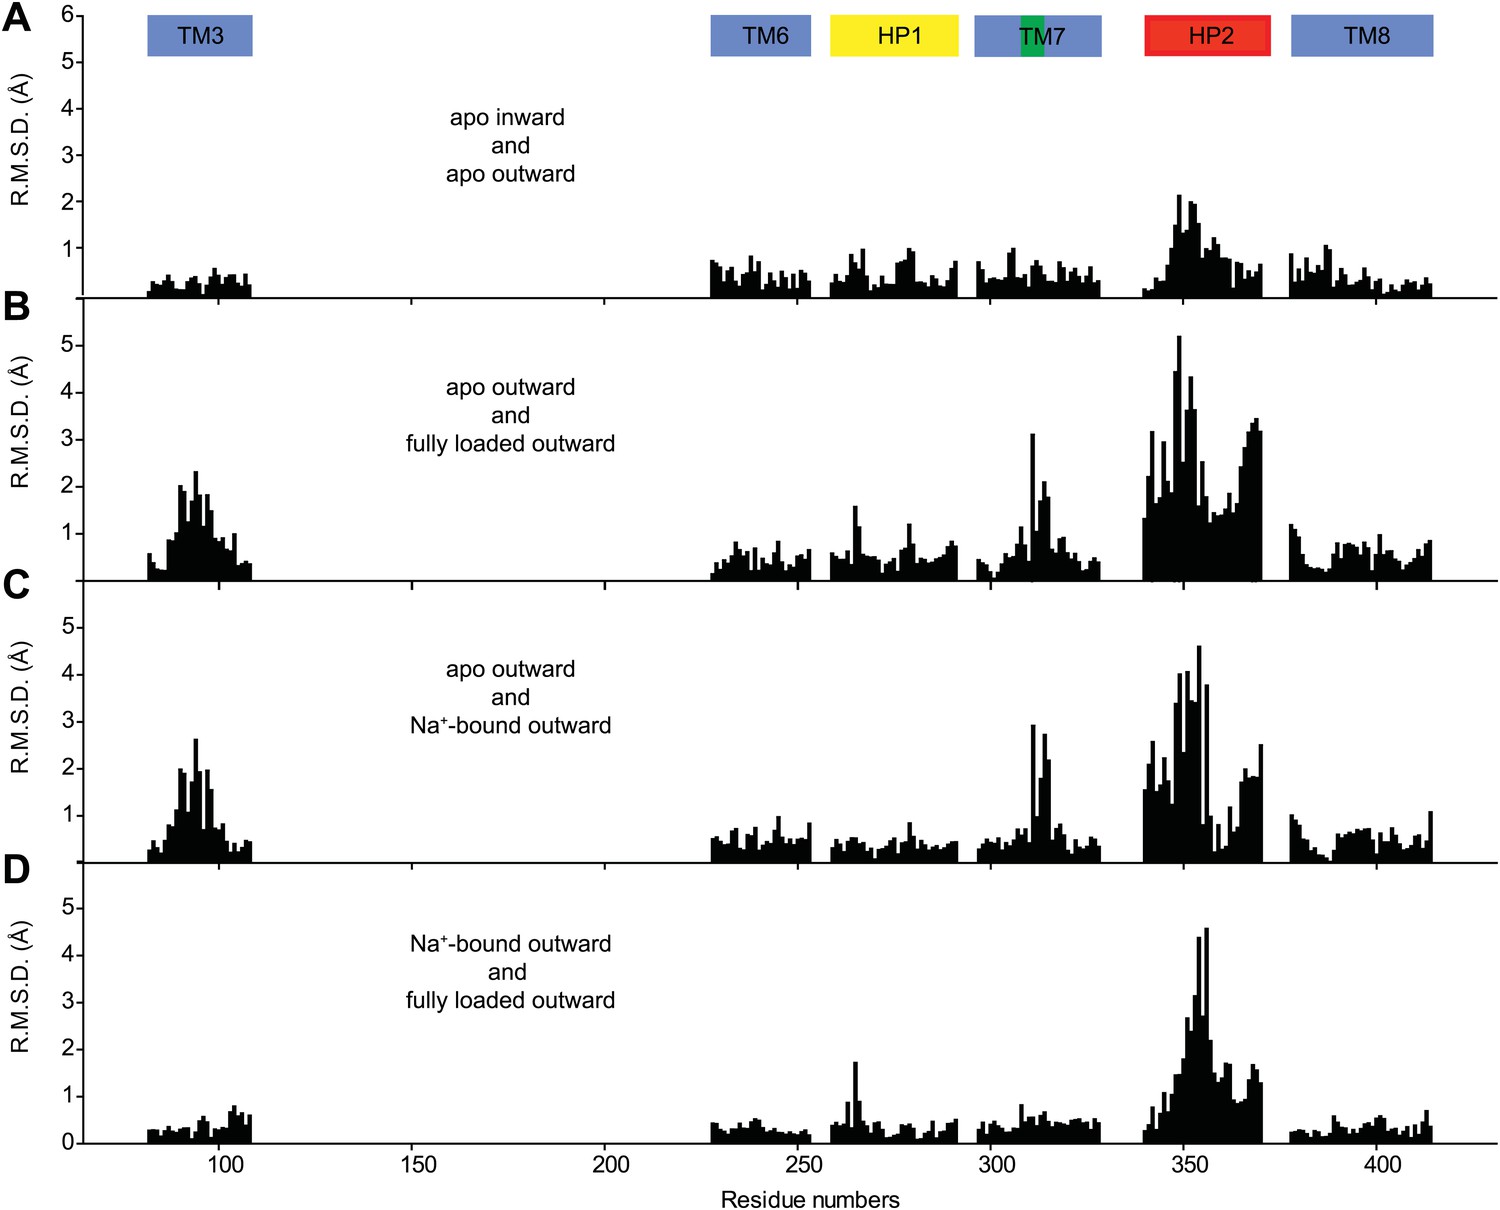
Structural comparison of the transport domain in various states.
Plotted are root mean square deviations (R.M.S.D.s) of the main chain atoms calculated per residue using VMD for the transport domains in (A) apo outward- and inward-facing states, (B) outward-facing apo and fully bound forms, (C) outward-facing apo and Na+-bound forms and (D) outward-facing Na+-bound and fully loaded forms. The loop regions were excluded from the calculations. Notably, there are no significant structural differences between the apo transport domains in the outward- and inward-facing states. Comparison of the apo and fully bound forms of the domain shows differences in TM3, near NMD motif in TM7 and in HP2. Most of these differences are also observed when apo transport domain is compared to Na+-bound form. In contrast, differences between the Na+-bound and fully loaded forms are confined mostly to the tip of HP2.
Figure 4 with 1 supplement
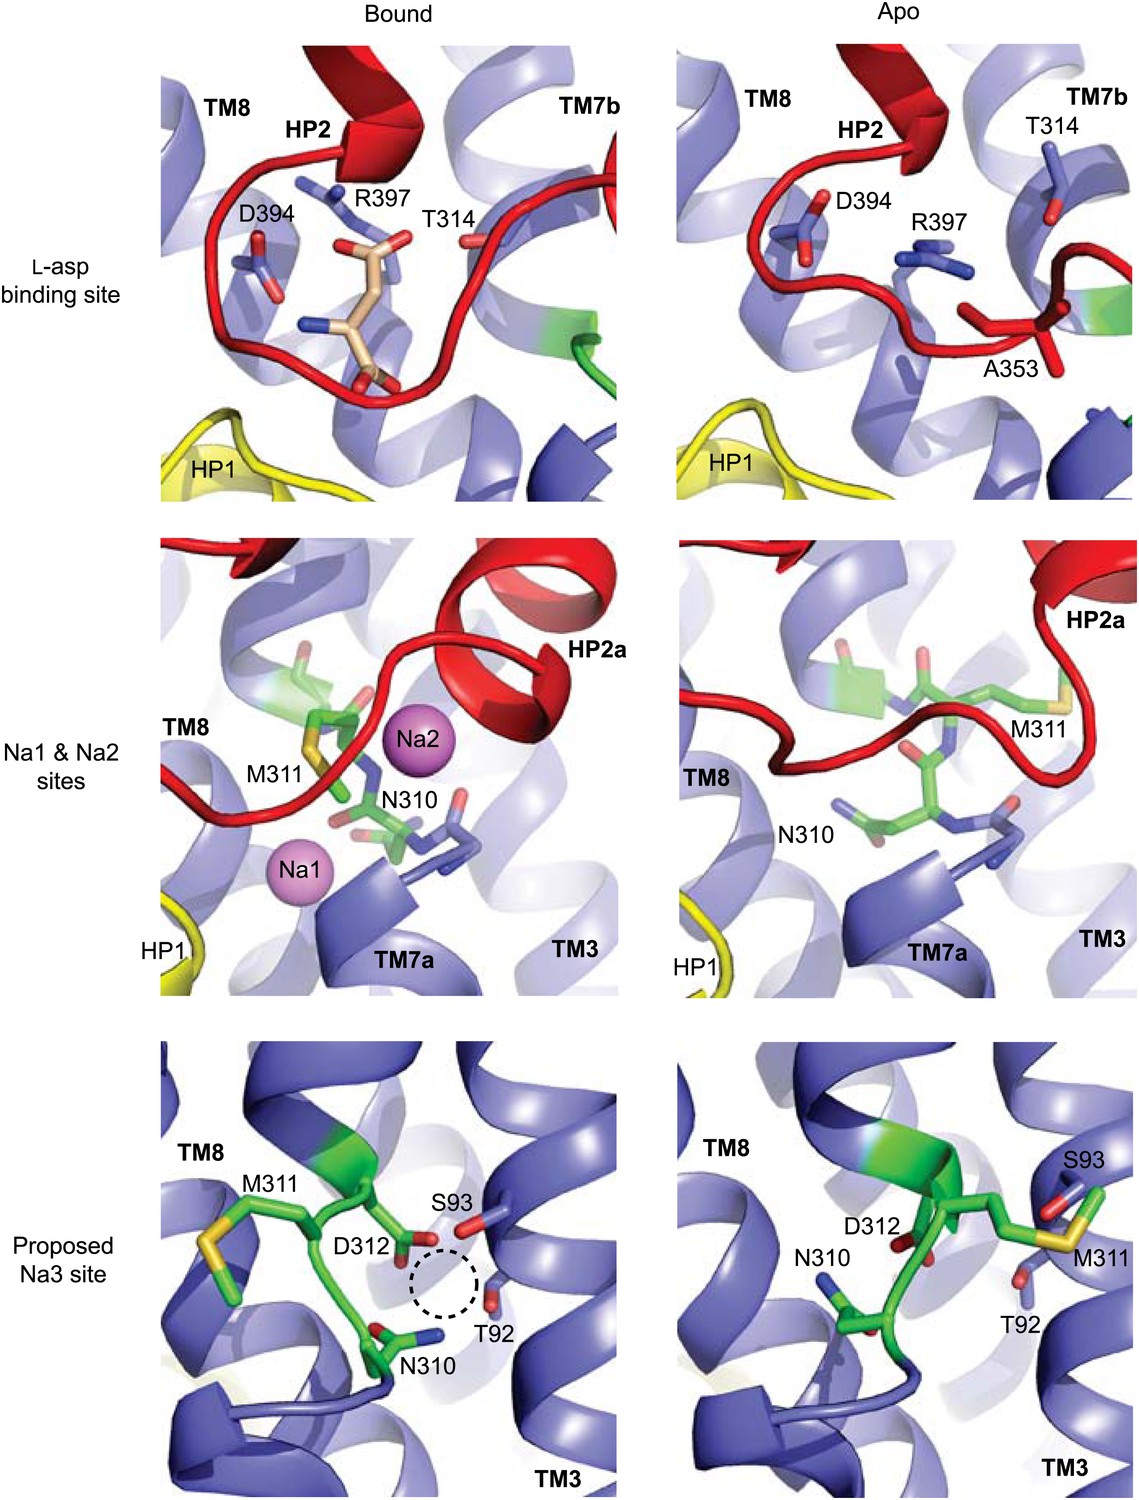
Remodeling of L-asp and Na+ binding sites in the apo conformations.
Close-up views of the fully bound (left) and apo (right) transport domains at L-asp binding site (top), Na1 and Na2 sites (middle), and one of the proposed locations for the third Na+ binding site (Huang and Tajkhorshid, 2010; Bastug et al., 2012) (dashed circle).
Figure 4—figure supplement 1
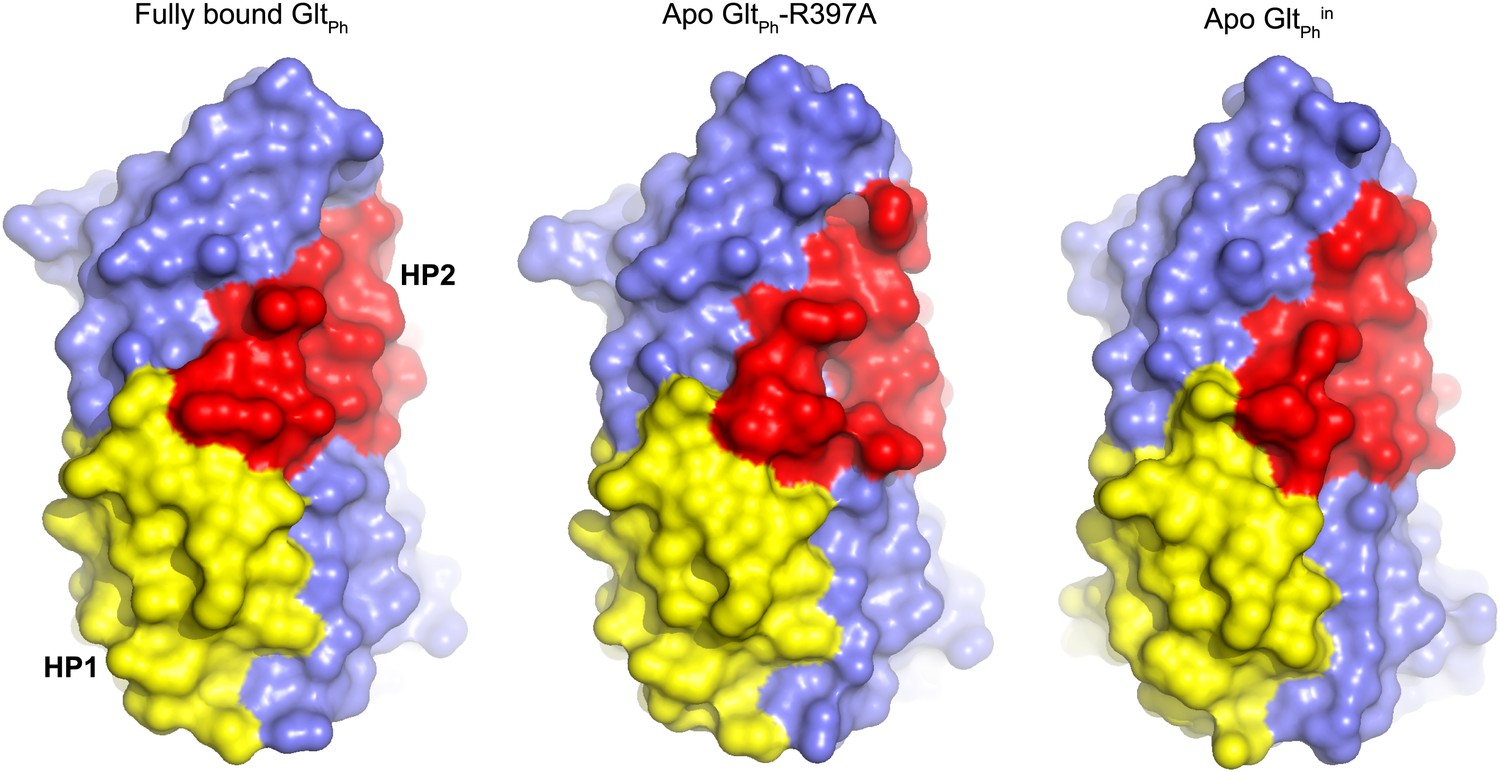
Transport domain remains compact.
Surface representation of the transport domain in fully bound and apo forms.
Figure 5
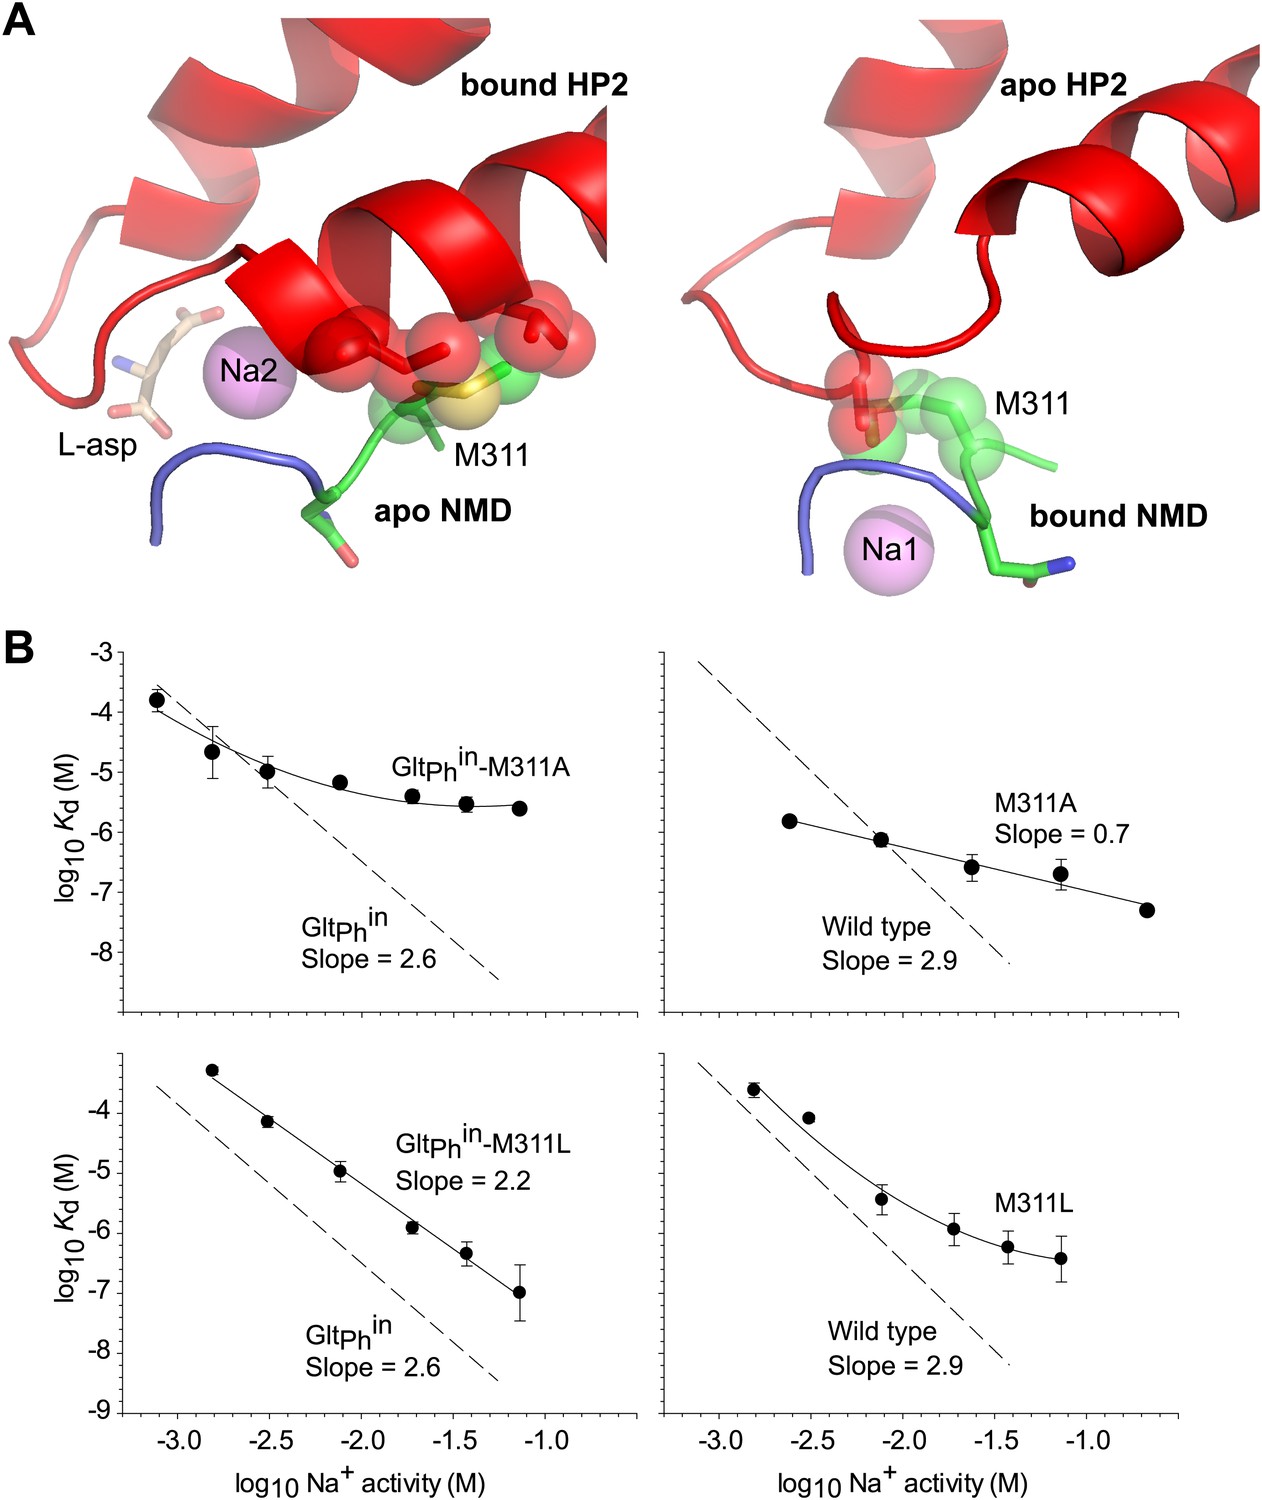
Met311 is key to the allosteric coupling.
(A) Structural models combining HP2 bound to L-asp and Na+ at Na2 site with apo conformation of the NMD motif (left), and apo conformation of HP2 with the NMD motif bound to Na+ at Na1 site (right). Met311 and clashing residues in HP2 are shown as sticks and transparent spheres. (B) The dependence of L-asp dissociation constant, Kd, on Na+ activity plotted on a log–log scale for mutants within the context of GltPhin (left) and unconstrained GltPh (right). The data were fitted to straight lines with slopes shown on the graph or to arbitrary lines for clarity. Dashed lines and corresponding slopes correspond to published dependences for GltPhin and GltPh (Reyes et al., 2013).
Figure 6 with 3 supplements

Structures of ions-only bound transport domain.
(A) Superimposition of the fully bound transport domains (grey) and Tl+-bound GltPhin transport domain in the bound-like conformation (colors), with the averaged anomalous difference Fourier map contoured at 8σ (cyan mesh). (B) Superimposition of the fully bound (grey) and Na+-only bound GltPh-R397A (colors) transport domains. (C) Na+ and L-asp binding sites with fully-bound structure shown in white and Na+-bound structure in colors. Hinge glycine residues are shown as spheres. The modeled Na+ ion in Na1 site is pink. (D) Superimposition of the HP2-TM8 in the fully bound transport domain (grey) and in GltPh-R397A bound to Na+ only (colors), showing similar conformations of HP2a. (E) WebLogo representation of the consensus sequence and relative abundance of residues in HP2 tip. (F) Surface representation of the transport domain of GltPh-R397A bound to Na+ only showing access to the substrate-binding site. L-asp was placed into the binding site for reference.
Figure 6—figure supplement 1
Na+ only bound GltPh-R397A.
Stereo view of the averaged 2Fo-Fc electron density map contoured at 1σ around HP1 and HP2.
Figure 6—figure supplement 2
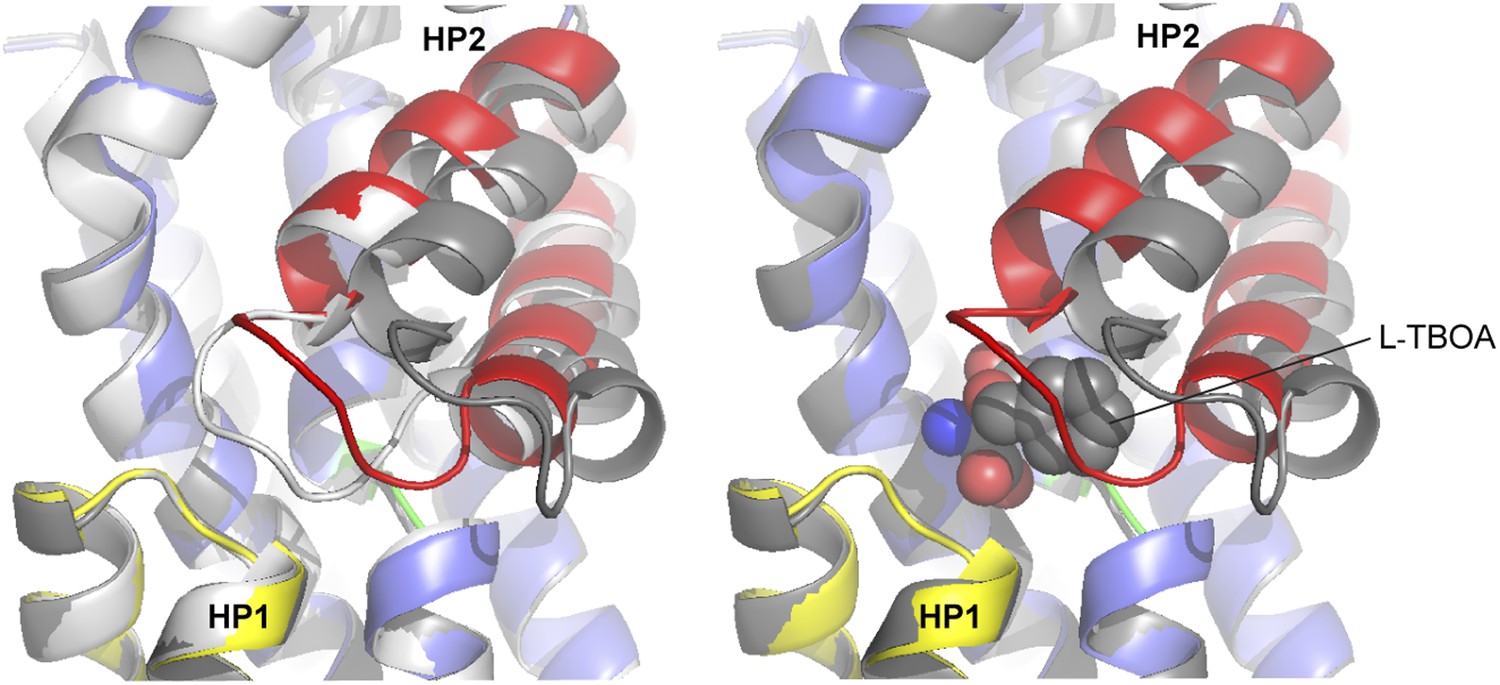
Superimposition of the transport domains bound to Na+ and L-asp (light grey), Na+ and L-TBOA (dark grey) and Na+ only (colors).
Ligands are omitted for clarity, except that L-TBOA is shown as spheres in the right panel. Nostably, the observed additional opening of HP2 is necessary to accommodate L-TBOA.
Figure 6—figure supplement 3
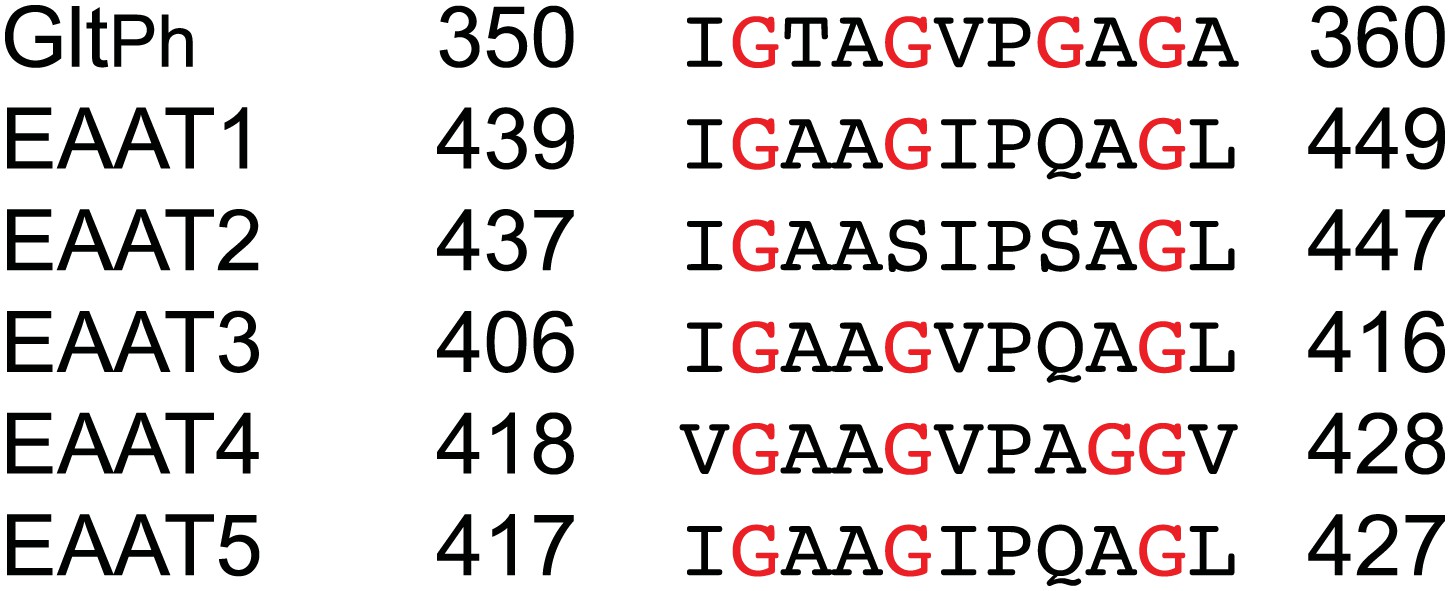
Sequence alignment for the HP2 tip region of GltPh and human EAAT sub-types 1–5.
https://doi.org/10.7554/eLife.02283.019
Figure 7
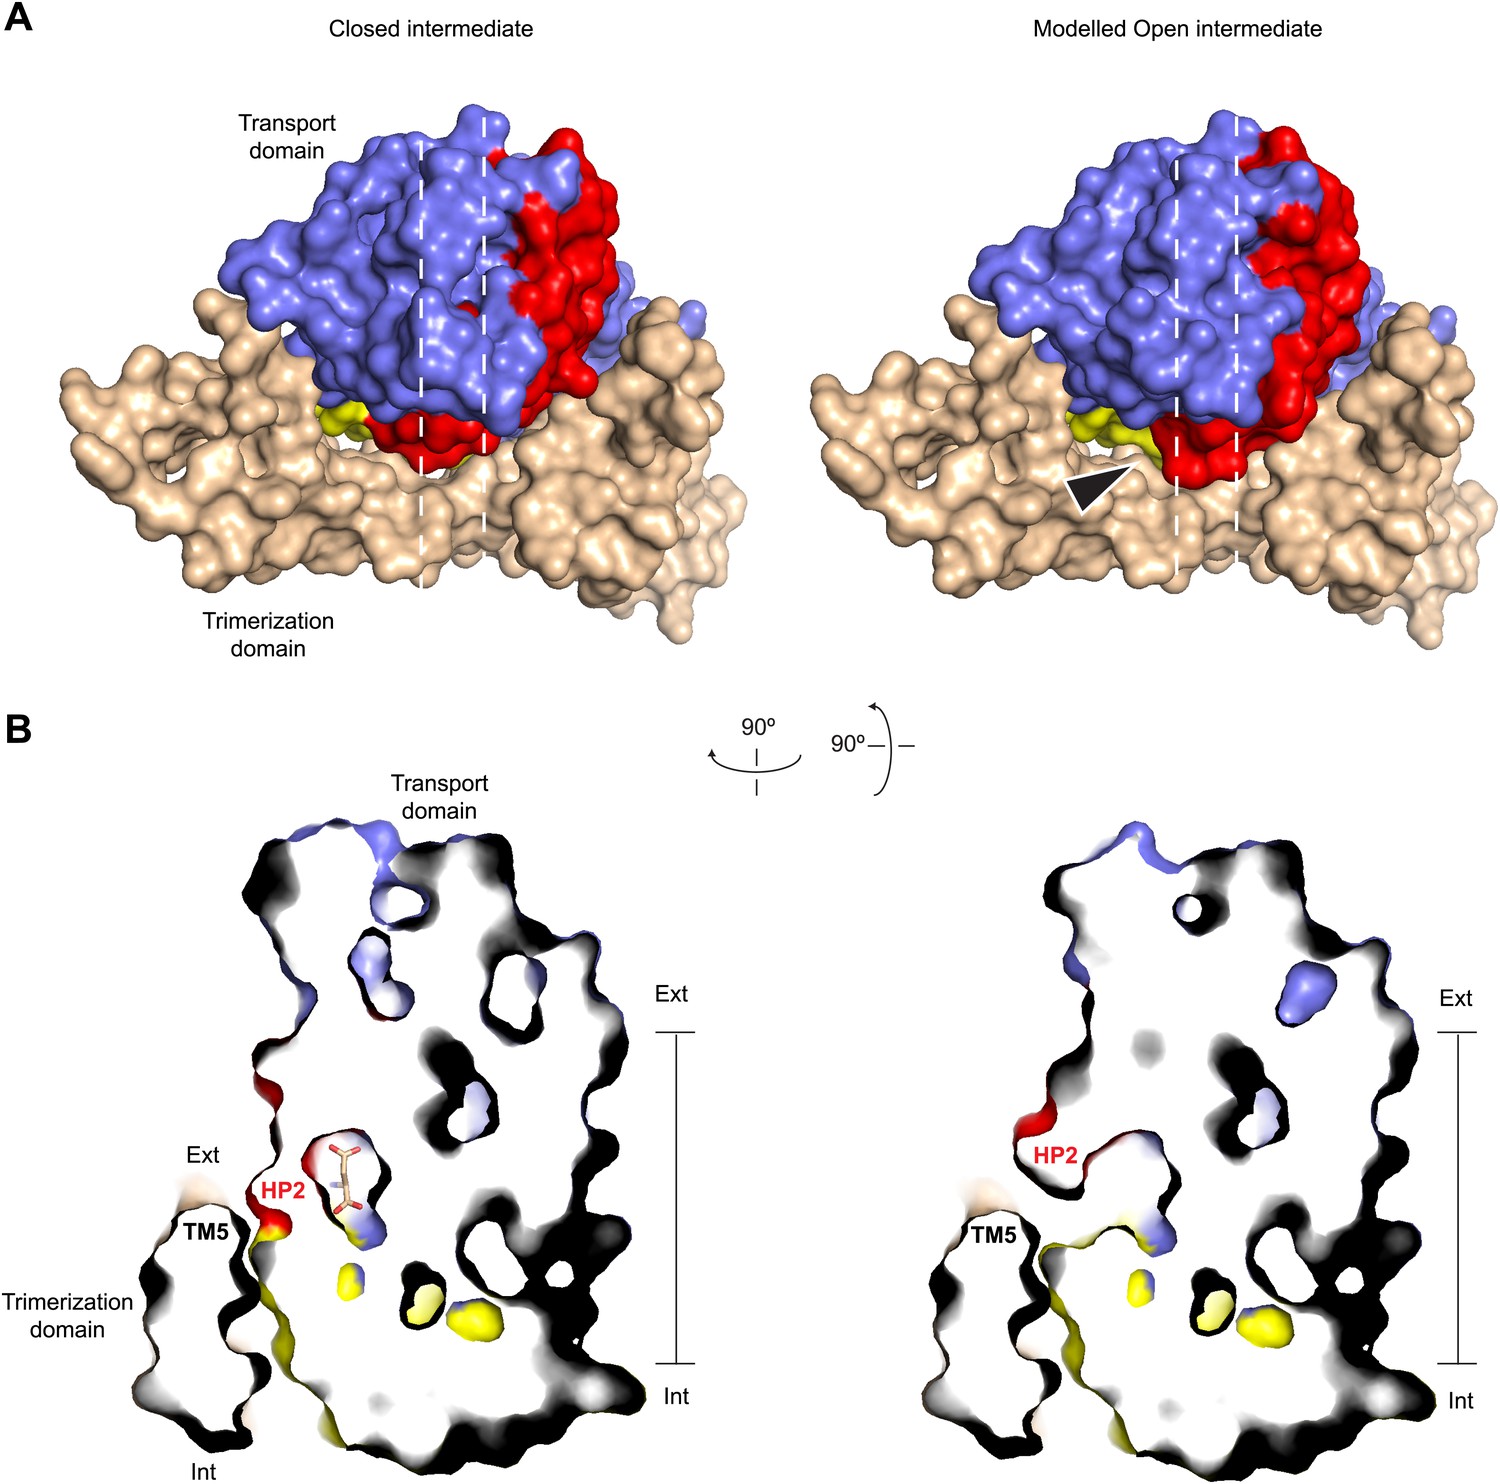
Modeled Na+-bound early transition intermediate between the outward- and inward-facing states.
(A) Surface representations of the protomer in the fully bound intermediate state (PDB code 3V8G) (left), and the modeled Na+-bound intermediate with an open HP2 tip (right) viewed from the extracellular space (top). The model reveals no clashes, suggesting that the observed opening of HP2 is structurally compatible with the intermediate orientation of the transport domain. The arrows indicate the point of access to the domain interface with potentially increased solvent accessibility. (B) Side views of thin cross-sections of the closed fully bound (left) and open Na+-only bound (right) intermediate state. The protomers are sliced normal to the membrane plane, as indicated by the dashed lines in A.
Figure 8 with 2 supplements
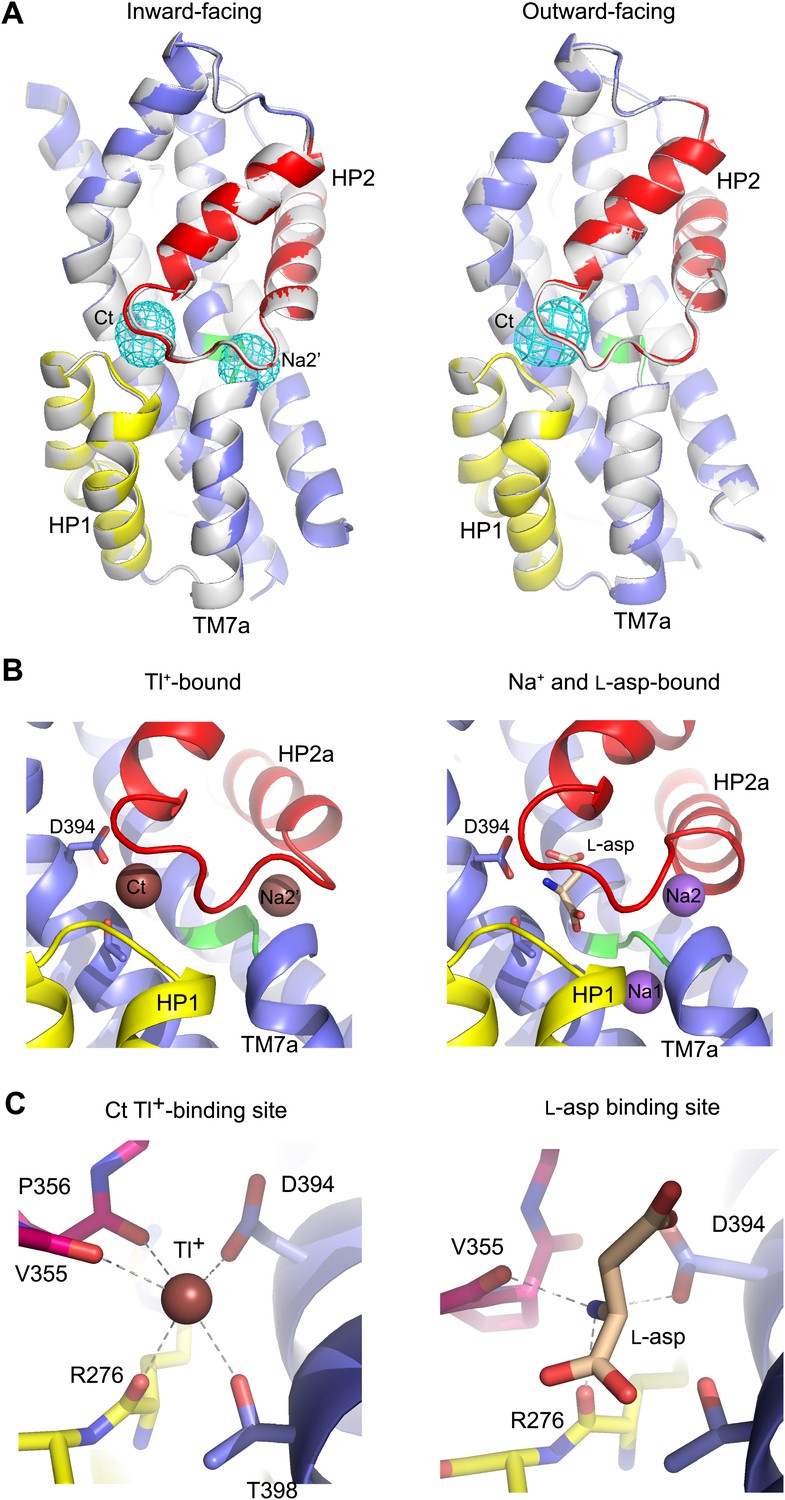
New cation binding sites.
(A) Superimpositions of GltPhin (left) and outward-facing GltPh-R397A (right) transport domains in the apo form (grey) with Tl+-bound apo-like conformations (colors). Averaged anomalous difference Fourier maps are contoured at 8σ (cyan mesh). (B) Modeled Tl+ ions bound to the Ct and Na2’ sites (left), and L-asp aspartate and Na+ ions bound to the Na1 and Na2 sites in the fully bound transport domain (right). (C) Close-up view of Tl+ in the Ct site of apo-like GltPhin and L-asp in the fully bound transporter.
Figure 8—figure supplement 1
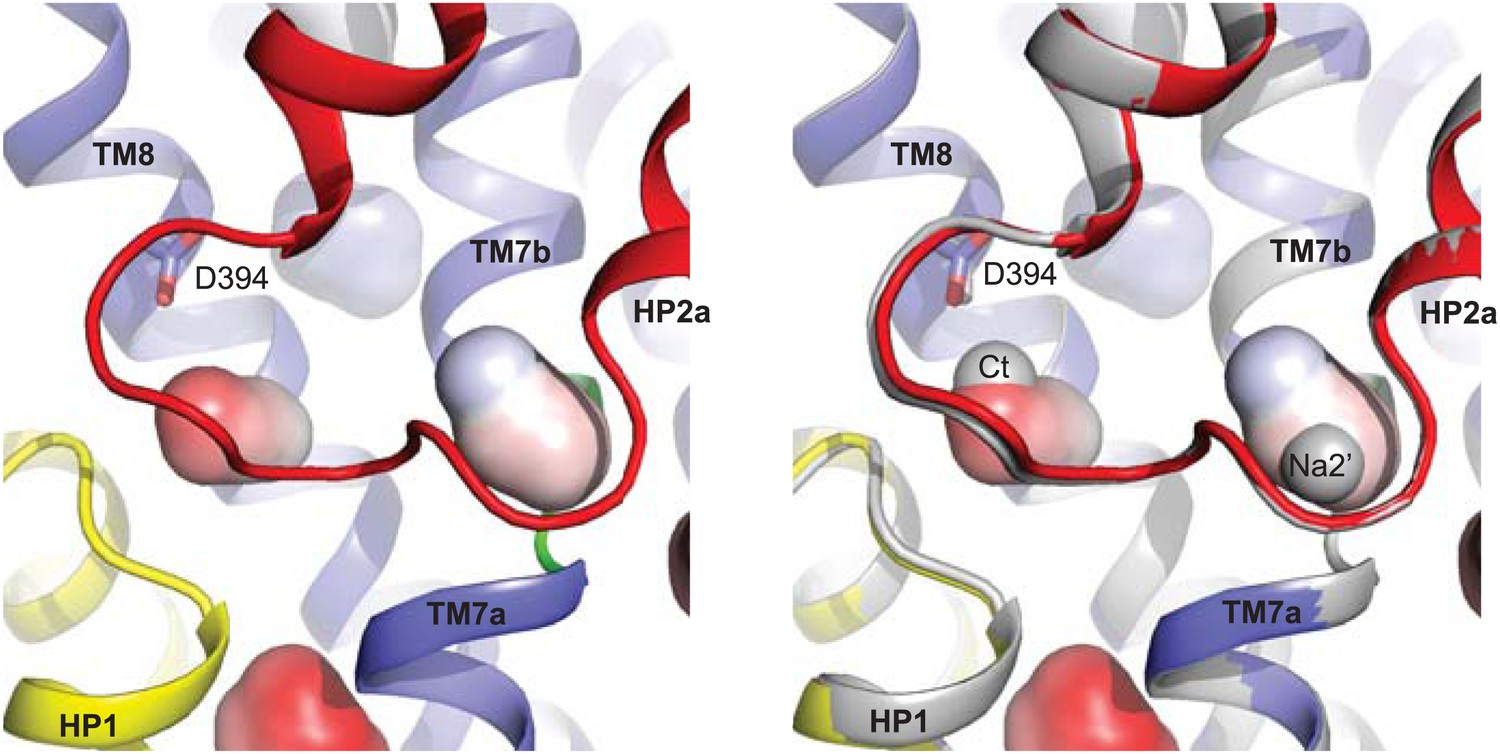
Transport domain internal cavities.
Internal cavities in the apo GltPhin structure (left). Cavities were calculated using solvent radius of 1.4 Å and colored by local electrostatic potential with red and blue being negative and positive, respectively. The same structure superimposed with the Tl+-bound apo-like GltPhin (right). The Tl+-bound structure is shown in grey and Tl+ ions at the Ct and Na2' sites are shown as spheres.
Figure 8—figure supplement 2
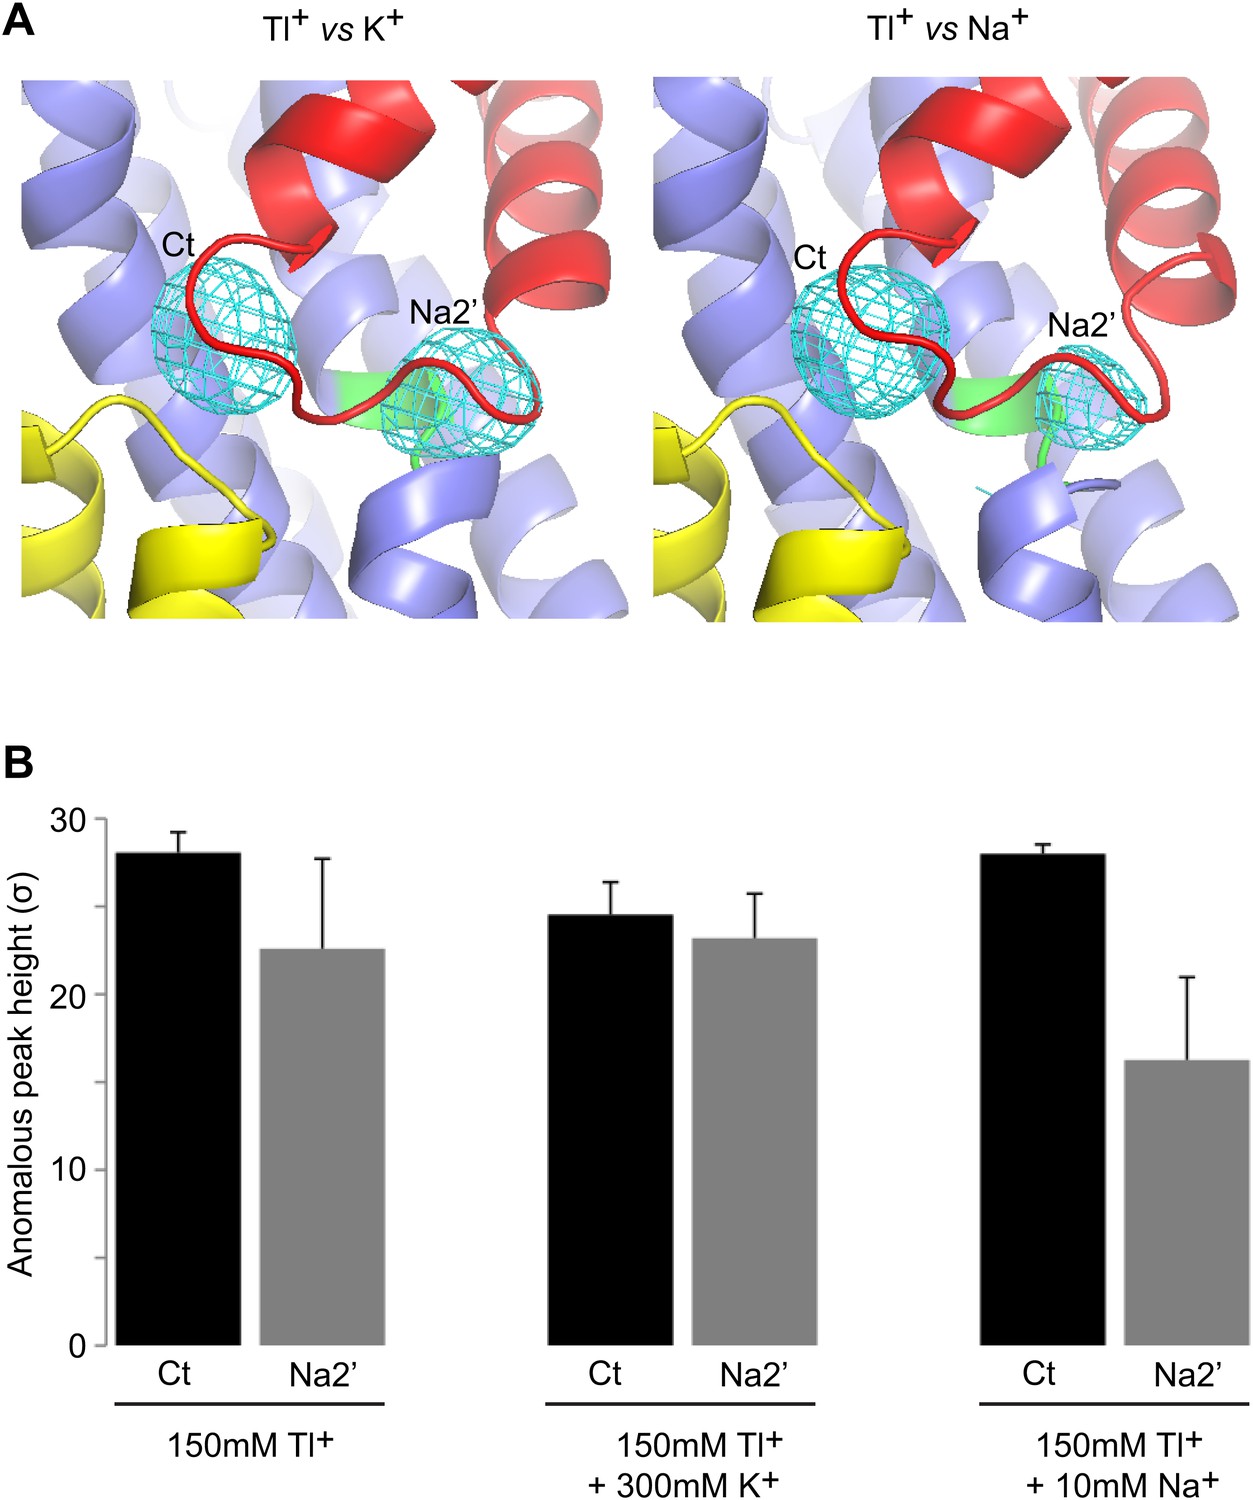
Specificity of the new cation binding sites in apo-like GltPhin.
(A) Averaged anomalous difference Fourier maps contoured at 8σ (cyan mesh) for Tl+-soaked (150 mM) GltPhin in the presence of 300 mM K+ (left) and 10 mM Na+ (right) showing a decrease of the Tl+ signal at Na2' site in the presence of Na+. (B) Means of the anomalous difference Fourier peak heights in the three protomers and their associated standard deviations at the Ct and Na2' sites in GltPhin crystals. Soaking conditions are listed below the graphs.
Figure 9 with 2 supplements
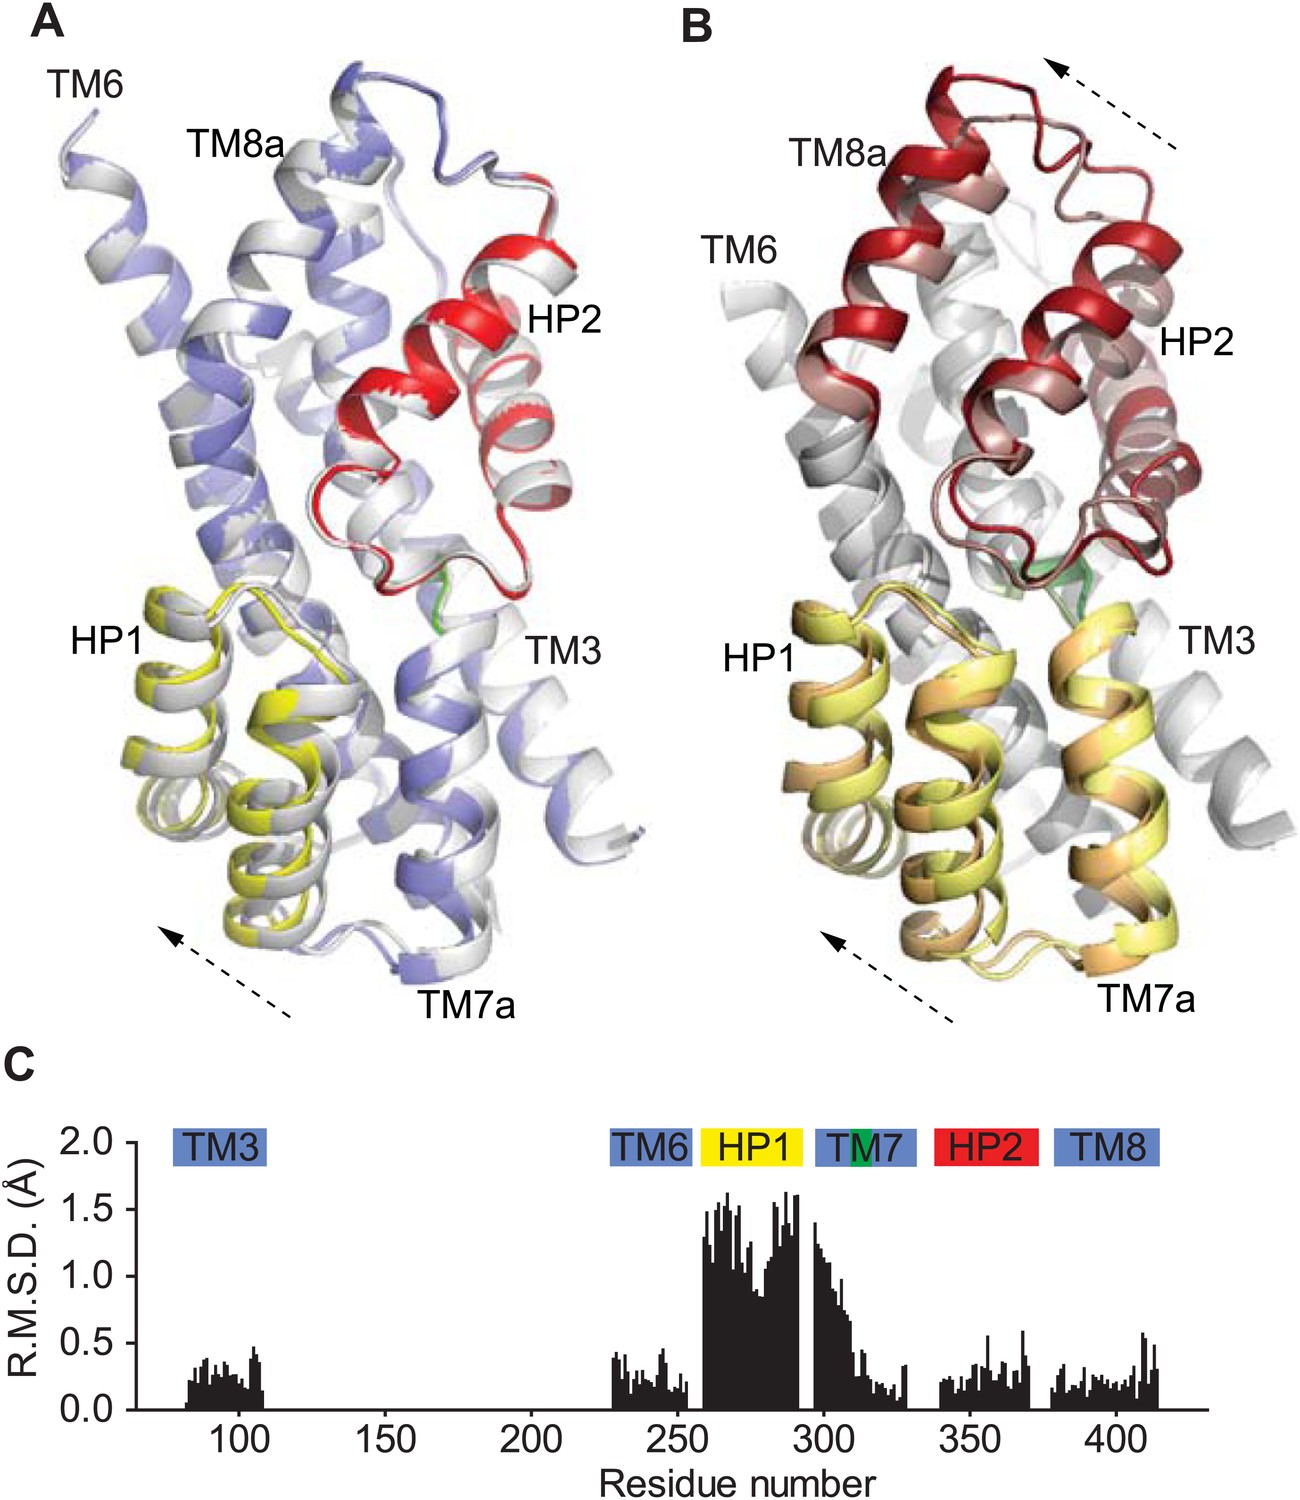
Movements of the HP1-TM7a structural module.
(A) Superimposition of GltPhin transport domains when bound to Tl+ in the apo-like conformation (grey) and when prepared in an alkali-free solution (colors). (B) The transport domains of the fully bound GltPh (light colors) and alkali-free GltPhin (dark colors) superimposed on TM6. Arrows indicate movements of the structurally symmetric HP1-TM7a and HP2-TM8a modules. (C) Per residue main chain R. M. S. D. values calculated for the structures of the inward-facing transport domains bound to Tl+ in apo-like conformation and alkali-free shown in A and superimposed on HP2. The bars above the plot represent secondary structure elements colored as in A.
Figure 9—figure supplement 1
Alkali-free inward-facing GltPhin.
(A) Stereo view of the 2Fo-Fc (1σ) and Fo-Fc (3σ) omit maps obtained after molecular replacement using Tl+-bound GltPhin and refinement of a model with HP1 and TM7a omitted, in the protomer showing the detachment of HP1. The model shown is that of Tl+-bound GltPhin. It is clear that HP1 and TM7a do not fit well into the electron density. (B) Stereo view of the 2Fo-Fc (1σ) map around HP1 and TM7a obtained after refinement of a complete model. The model was generated by moving HP1 and TM7a as a rigid-body to fit into the electron density, with no further manual rebuilding.
Figure 9—figure supplement 2
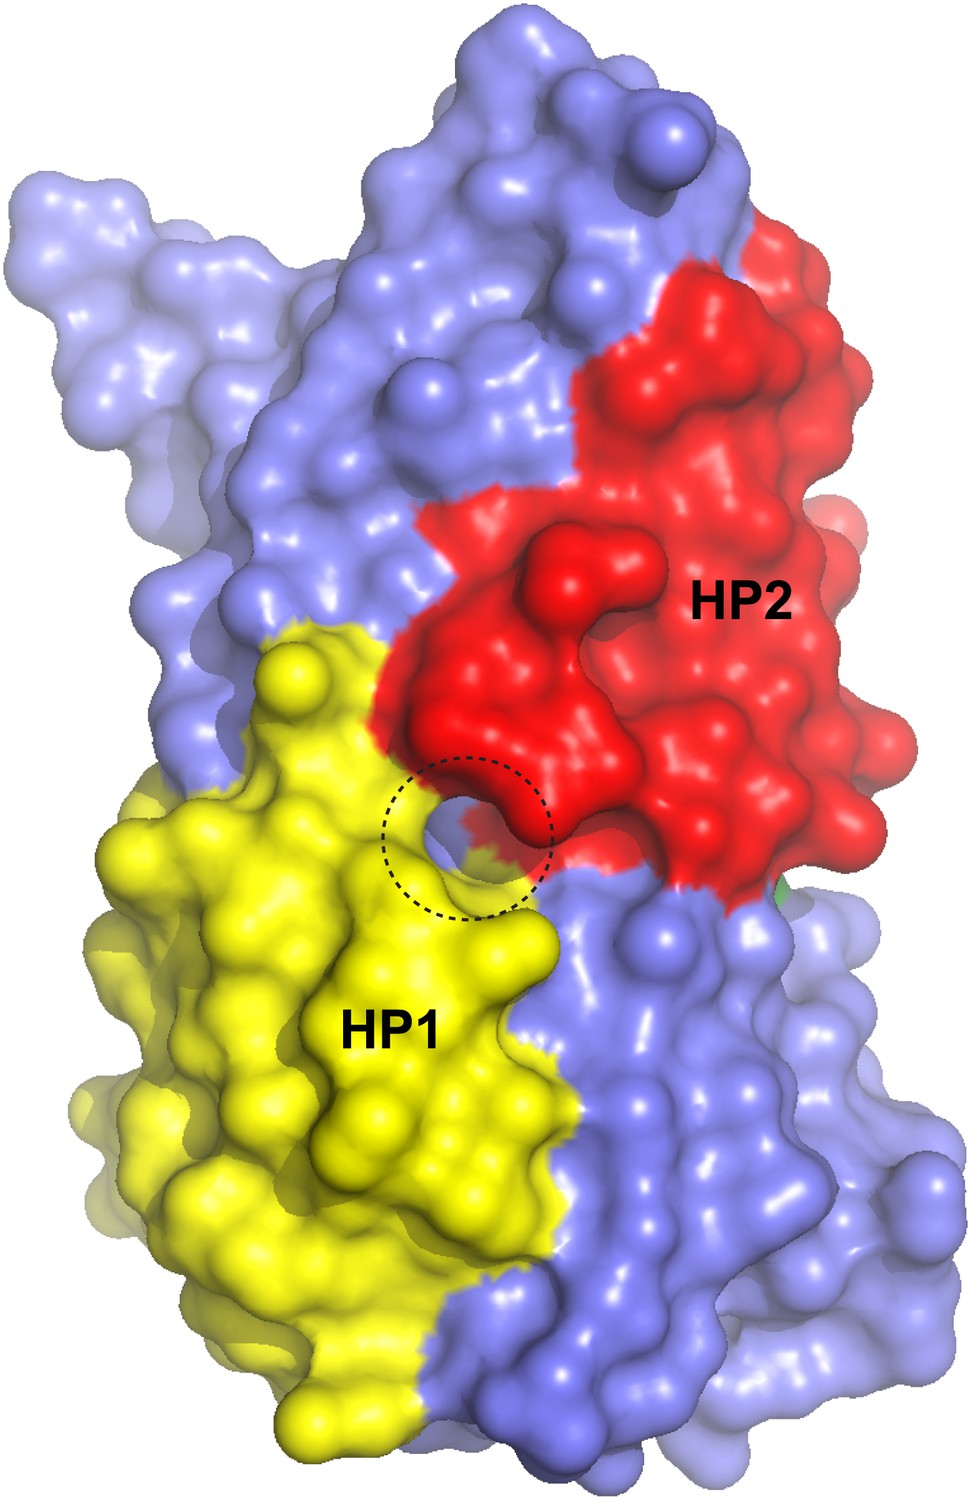
Surface representation of the alkali-free inward-facing GltPhin transport domain in this protomer after refinement.
A dashed circle indicates a small opening between HP1 and HP2.
Figure 10
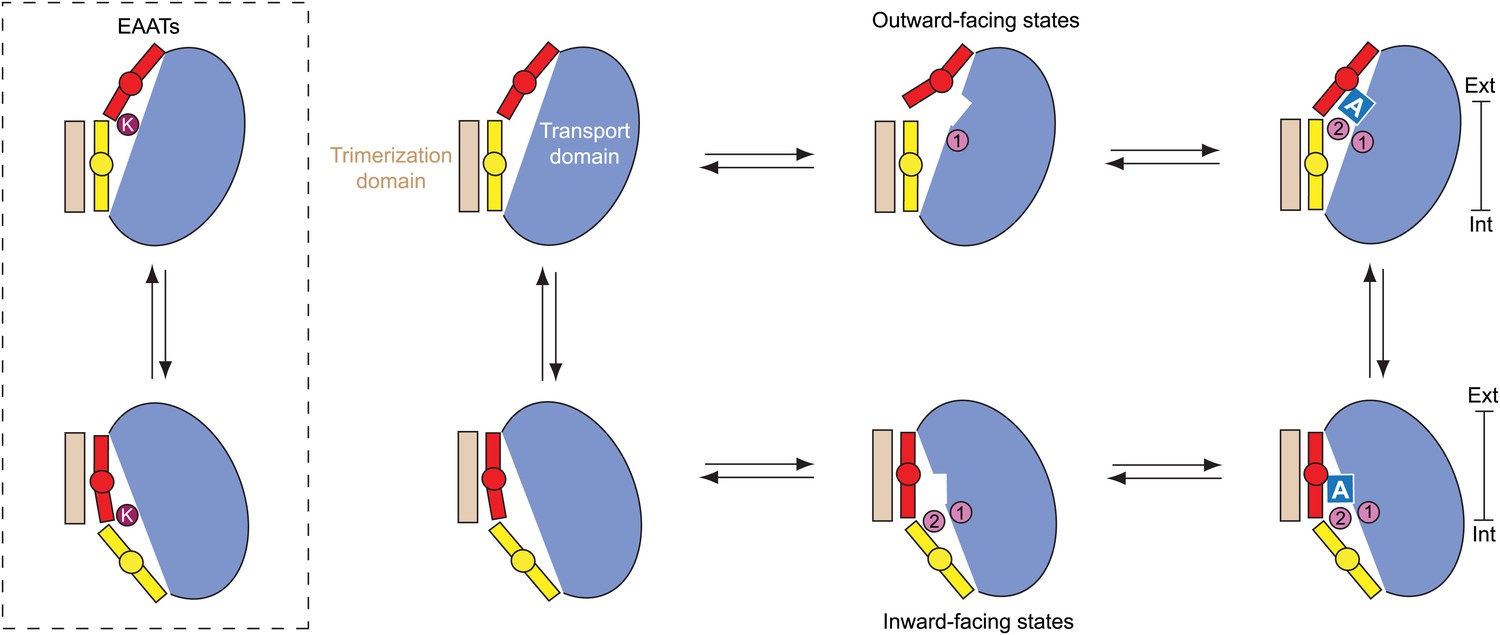
Proposed transport cycle for GltPh and EAATs.
Ion binding to the Na1 site of the outward-facing apo transport domain triggers isomerization into bound-like conformation, formation of the L-asp and Na2 binding sites and HP2 opening, impeding translocation of the domain. Closure of HP2, coupled to L-asp and Na2 binding, allows translocation. After the release of the ligands into the cytoplasm by as yet an unknown gating mechanism, the domain is in a compact apo state, and returns to the extracellular side. Notably, binding of cations to the inward-facing state does not lead to a crystallographically observed gate opening that would impede translocation. However, Na+ affinity in this state is only ∼250 mM (Reyes et al., 2013), and it will remain largely unbound when facing the cytoplasm. Hence, uncoupled Na+ transport should be limited. In EAATs, an open conformation of the gates might be more favored in the apo state, and K+ binding at the Ct site might be required to stabilize translocation-competent conformation of the apo transport domain.
Tables
Table 1
X-ray crystallographic data and refinement statistics for GltPh-R397A and GltPh-K55C-A364CHg (GltPhin) structures deposited at the PDB
| GltPhin | ||||
|---|---|---|---|---|
| apo | Tl+-bound (apo conf.) | alkali-free | Tl+-bound (bound conf.) | |
| Data collection | ||||
| Space group | C2221 | C2221 | C2221 | C2221 |
| Cell dimensions | ||||
| a, b, c (Å) | 109.93, 201.81, 207.14 | 106.98, 196.56, 206.50 | 106.95, 196.84, 207.48 | 110.83, 200.43, 206.40 |
| α, β, γ (°) | 90.00, 90.00, 90.00 | 90.00, 90.00, 90.00 | 90.00, 90.00, 90.0 | 90.00, 90.00, 90.00 |
| Resolution (Å) | 100.0–3.25 (3.31–3.25) | 100.0–3.75 (3.81–3.75) | 100.0–3.50 (3.56–3.50) | 100.0–4.0 (4.14–4.0) |
| Rsym or Rmerge | 10.9 (88.6) | 14.0 (94.4) | 8.0 (88.1) | 16.3 (75.2) |
| I/σI | 12.3 (1.2) | 8.95 (1.1) | 13.5 (1.2) | 7.9 (1.3) |
| Completeness (%) | 98.7 (88.1) | 99.7 (99.8) | 94.4 (92.7) | 65.2 (6.5) |
| Redundancy | 5.6 (2.8) | 3.8 (3.7) | 3.3 (3.2) | 3.4 (3.5) |
| Refinement | ||||
| Resolution (Å) | 15.0–3.25 | 15.0–3.75 | 15.0–3.5 | 15.0–4.0 |
| No. reflections | 34534 | 21565 | 25446 | 11105 |
| Rwork/Rfree | 22.2/25.8 | 23.0/25.7 | 26.3/27.8 | 25.8/29.6 |
| No. atoms | ||||
| Protein | 9121 | 9114 | 9088 | 8985 |
| Ligand/ion | 3 | 9 | 3 | 9 |
| B-factors | ||||
| Protein | 108.5 | 141.8 | 144.2 | 137.2 |
| Ligand/ion | 135.3 | 170.8 | 214.1 | 102.3 |
| R.m.s. deviations | ||||
| Bond lengths (Å) | 0.010 | 0.013 | 0.005 | 0.012 |
| Bond angles (°) | 1.680 | 1.861 | 1.116 | 1.407 |
| PDB code | 4P19 | 4P1A | 4P3J | 4P6H |
| GltPh-R397A | |||
|---|---|---|---|
| Apo | Na+-bound | Na+/aspartate-bound | |
| Data collection | |||
| Space group | P21 | P31 | P31 |
| Cell dimensions | |||
| a, b, c (Å) | 112.37, 424.42, 113.99 | 110.58, 110.58, 306.92 | 116.96, 116.96, 313.52 |
| α, β, γ (°) | 90.00, 119.40, 90.00 | 90.00, 90.00, 120.00 | 90.00, 90.00, 120.00 |
| Resolution (Å) | 100.0–4.00 (4.14–4.00) | 50.0–3.39 (3.51–3.39) | 100.0–3.50 (3.63–3.50) |
| Rsym or Rmerge | 7.8 (62.2) | 14.0 (>100) | 8.4 (>100) |
| I/σI | 9.3 (1.3) | 13.8 (1.4) | 10.6 (0.4) |
| Completeness (%) | 67.9 (13.0) | 87.3 (12.0) | 98.1 (96.6) |
| Redundancy | 1.8 (2.0) | 11.8 (8.6) | 4.5 (4.2) |
| Refinement | |||
| Resolution (Å) | 20.0–4.0 | 12.0–3.41 | 15.0–3.50 |
| No. reflections | 52068 | 48366 | 55613 |
| Rwork/Rfree | 24.9/26.6 | 28.4/29.3 | 24.3/26.8 |
| No. atoms | |||
| Protein | 35277 | 17580 | 18192 |
| Ligand/ion | N/A | 6 | 54/12 |
| Water | N/A | 6 | 6 |
| B-factors | |||
| Protein | 139.5 | 152.0 | 97.1 |
| Ligand/ion | N/A | 145.1 | 84.7/86.9 |
| Water | N/A | 102.6 | 144.6 |
| R.m.s. deviations | |||
| Bond lengths (Å) | 0.010 | 0.010 | 0.015 |
| Bond angles (°) | 1.393 | 1.468 | 1.735 |
| PDB code | 4OYE | 4OYF | 4OYG |
Table 2
Completeness of datasets corrected for anisotropy
| Tl+-bound GltPhin (bound conformation) | Na+-bound GltPh-R397A | ||
|---|---|---|---|
| Resolution range (Å) | Completeness (%) | Resolution range (Å) | Completeness (%) |
| 100.0–8.62 | 99.3 | 50.00–7.30 | 99.6 |
| 8.62–6.84 | 99.9 | 7.30–5.79 | 100.0 |
| 6.84–5.97 | 100.0 | 5.79–5.06 | 100.0 |
| 5.97–5.43 | 99.9 | 5.06–4.60 | 100.0 |
| 5.43–5.04 | 99.9 | 4.60–4.27 | 100.0 |
| 5.04–4.74 | 69.6 | 4.27–4.02 | 100.0 |
| 4.74–4.50 | 39.2 | 4.02–3.82 | 100.0 |
| 4.50–4.31 | 23.6 | 3.82–3.65 | 98.6 |
| 4.31–4.14 | 14.4 | 3.65–3.51 | 63.0 |
| 4.14–4.00 | 6.5 | 3.51–3.39 | 12.0 |
| Apo GltPh-R397A | |
|---|---|
| Resolution range (Å) | Completeness (%) |
| 100.0–8.62 | 85.0 |
| 8.62–6.84 | 75.6 |
| 6.84–5.97 | 75.5 |
| 5.97–5.43 | 75.3 |
| 5.43–5.04 | 75.2 |
| 5.04–4.74 | 75.8 |
| 4.74–4.50 | 75.3 |
| 4.50–4.31 | 75.4 |
| 4.31–4.14 | 51.7 |
| 4.14–4.00 | 13.0 |
Table 3
X-ray crystallographic data and refinement statistics for GltPh-R397A and GltPh-K55C-A364CHg structures not deposited at the PDB
| GltPh-R397A | GltPhin | ||
|---|---|---|---|
| Tl+-bound (apo conf.) | Tl+/Na+ (apo conf.) | Tl+/k+ (apo conf.) | |
| Data collection | |||
| Space group | P21 | C2221 | C2221 |
| Cell dimensions | |||
| a, b, c (Å) | 115.18, 428.53, 116.61 | 108.11, 198.86, 206.34 | 106.59, 198.48, 205.82 |
| α, β, γ (°) | 90.00, 119.49, 90.00 | 90.00, 90.00, 90.00 | 90.00, 90.00, 90.00 |
| Resolution (Å) | 30.0–5.0 (5.18–5.00) | 100.0–4.0 (4.07–4.00) | 100.0–4.15 (4.22–4.15) |
| Rsym or Rmerge | 10.9 (>100) | 15.0 (92.2) | 13.9 (94.1) |
| I/σI | 13.8 (1.9) | 8.9 (1.5) | 9.2 (1.5) |
| Completeness (%) | 86.4 (75.1) | 99.9 (100) | 94.5 (90.2) |
| Redundancy | 5.5 (5.8) | 3.9 (3.9) | 4.0 (3.9) |
| Refinement | |||
| Resolution (Å) | 20.0–5.0 | 15.0–4.0 | 15.0–4.15 |
| No. reflections | 34747 | 18184 | 15419 |
| Rwork/Rfree | 22.0/26.5 | 28.2/31.7 | 28.3/31.2 |
| No. atoms | |||
| Protein | 35107 | 9135 | 9135 |
| Ligand/ion | N/A | N/A | N/A |
| Water | N/A | N/A | N/A |
| B-factors | |||
| Protein | 223.00 | 183.6 | 194.4 |
| Ligand/ion | N/A | N/A | N/A |
| Water | N/A | N/A | N/A |
| R.m.s. deviations | |||
| Bond lengths (Å) | 0.008 | 0.006 | 0.008 |
| Bond angles (°) | 1.186 | 1.266 | 1.440 |
Download links
A two-part list of links to download the article, or parts of the article, in various formats.
Downloads (link to download the article as PDF)
Open citations (links to open the citations from this article in various online reference manager services)
Cite this article (links to download the citations from this article in formats compatible with various reference manager tools)
Coupled ion binding and structural transitions along the transport cycle of glutamate transporters
eLife 3:e02283.
https://doi.org/10.7554/eLife.02283


