Oxidation of cellular amino acid pools leads to cytotoxic mistranslation of the genetic code
- Ohio State University, United States
- Center for RNA Biology, Ohio State University, United States
- Semel Institute for Neuroscience and Human Behavior, University of California, United States
- University of California, Los Angeles, United States
Figures
Figure 1
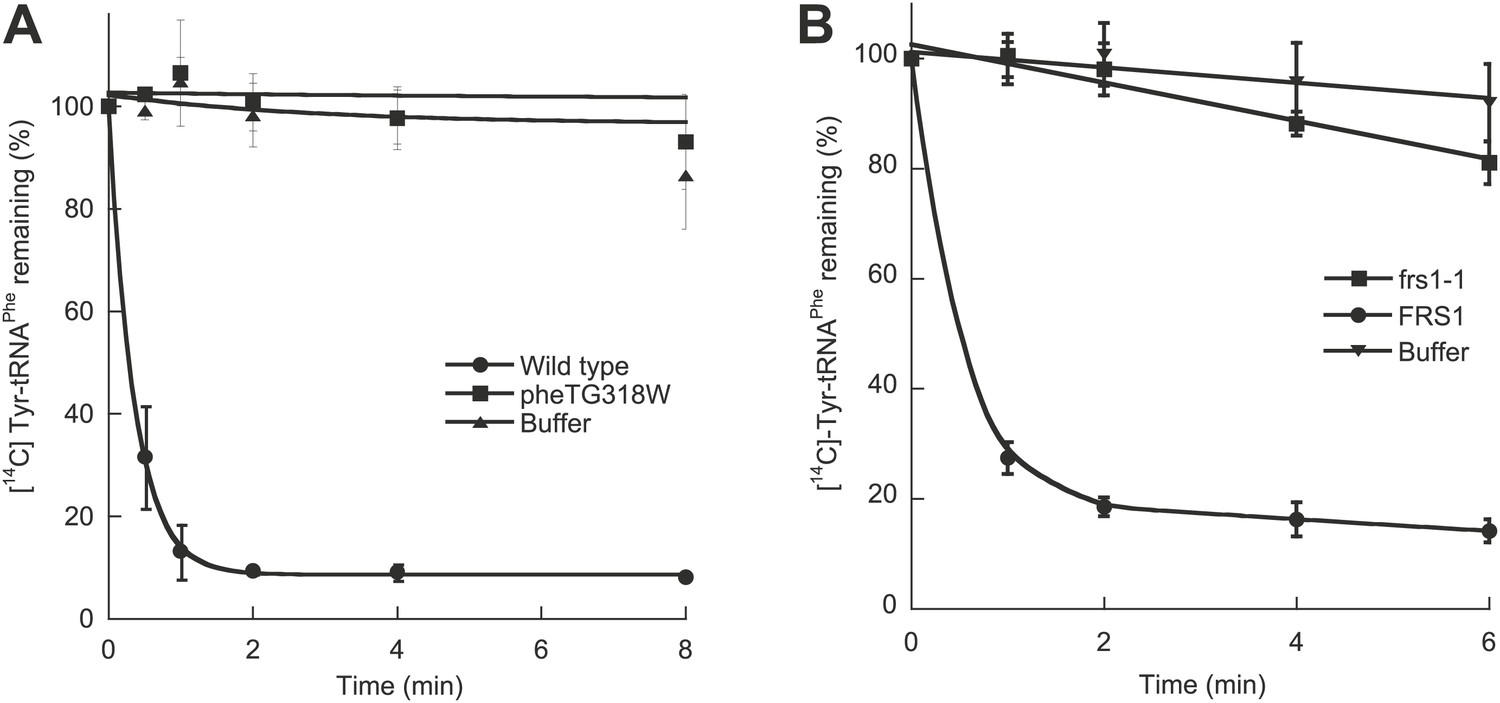
Chromosomal editing mutants of E. coli and S. cerevisiae.
(A) Post–transfer hydrolysis of [14C]- Tyr-tRNAPhe (1 µM) by cell-free extracts isolated from wild type (●) and pheT(G318W) (■) E. coli strains (140 mg/ml total protein concentration) or buffer (▲) at 37°C. (B) Posttransfer editing activity of βD243A ctPheRS in S. cerevisiae. Reactions were performed at 37°C with 2 μM Tyr-tRNAPhe and S. cerevisiae wild type FRS1 or frs1-1 (D243A) cell-free extracts normalized to aminoacylation activity (Reynolds et al., 2010). Data points are the mean of at least three independent experiments, with errors bars representing ±1 SD.
Figure 2 with 2 supplements
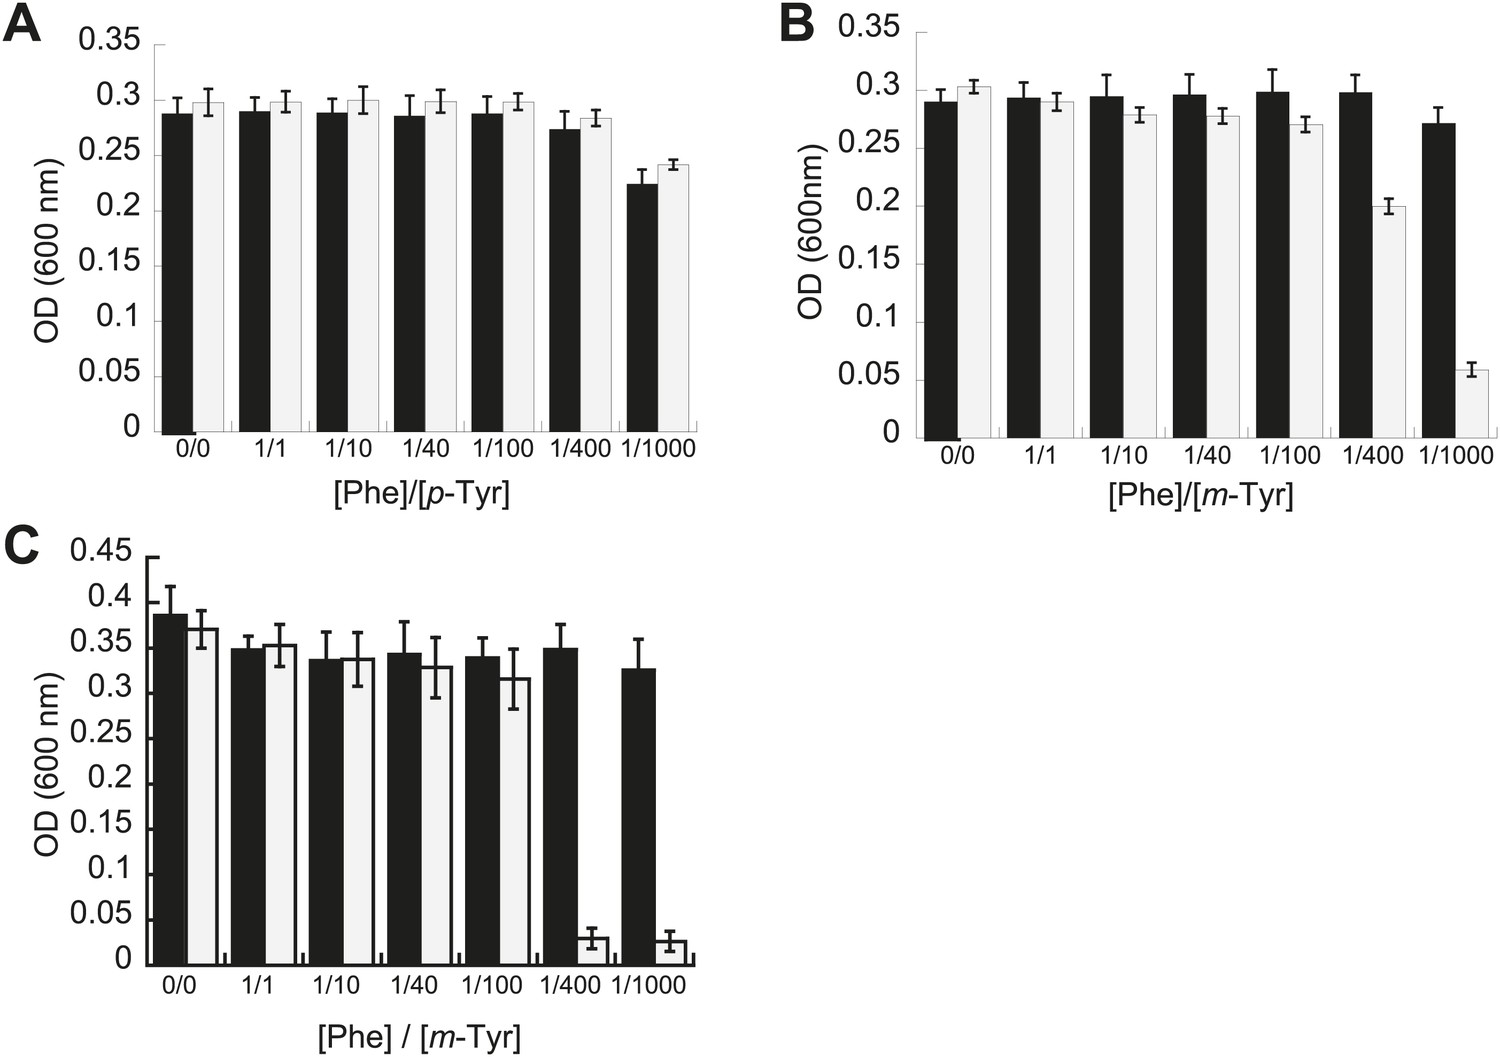
Effect of non-cognate amino acids on the growth of editing deficient E. coli strains.
Growth of E. coli pheT(G318W) strain (grey bars) relative to wild type (black bars) under increasing concentrations of L-p-Tyr (A) or D,L-m-Tyr (B) relative to Phe. Cultures were grown in M9 minimal media supplemented with amino acids expressed as a ratio of Phe:Tyr. A ratio of 1:1 corresponds to 3 µM of each amino acid. (C) Growth of PheRS editing deficient strain of E. coli in an MG1655 background in the presence of different tyrosine isomers at 37°C. Bars are the mean of three independent cultures, with errors bars representing ± SD.
Figure 2—figure supplement 1

EcPheRS post–transfer editing of mischarged tRNAPhe substrates.
Hydrolysis of 0.1 µM E. coli p-Tyr-[32P]-tRNAPhe (dashed lines) or m-Tyr-[32P]-tRNAPhe (solid lines) in the presence of 10 nM wild type EcPheRS (■) G318W EcPheRS (=) or buffer (▲) at 37°C. Data points are the mean of three independent experiments, with errors bars representing ± SD.
Figure 2—figure supplement 2

E. coli PheRS editing requirement for tyrosine isomers.
Growth of PheRS editing deficient E. coli at 37°C after 16 hr in M9 minimal media supplemented with increasing concentrations of (A) o-Tyr or (B) L-dopa. (C) Aminoacylation of [32P]-tRNAPhe with o-Tyr (=) or L-dopa (■) by E. coli G318W PheRS (1 µM). Bars are the mean of three independent cultures, with errors bars representing ± SD.
Figure 3

Effect of non-cognate amino acids on the growth of an editing deficient S. cerevisiae strain.
Growth of yeast frs1-1 (D243A) strain (grey bars) relative to a wild type strain (black bars) under increasing concentrations of L-p-Tyr (A) or D,L-m-Tyr (B) relative to Phe. Cultures were grown in minimal media supplemented with amino acids expressed as a ratio of Phe:Tyr. A ratio of 1:1 corresponds to 3 µM of each amino acid. Data points are the mean of three independent cultures, with errors bars representing ±1 SD.
Figure 4
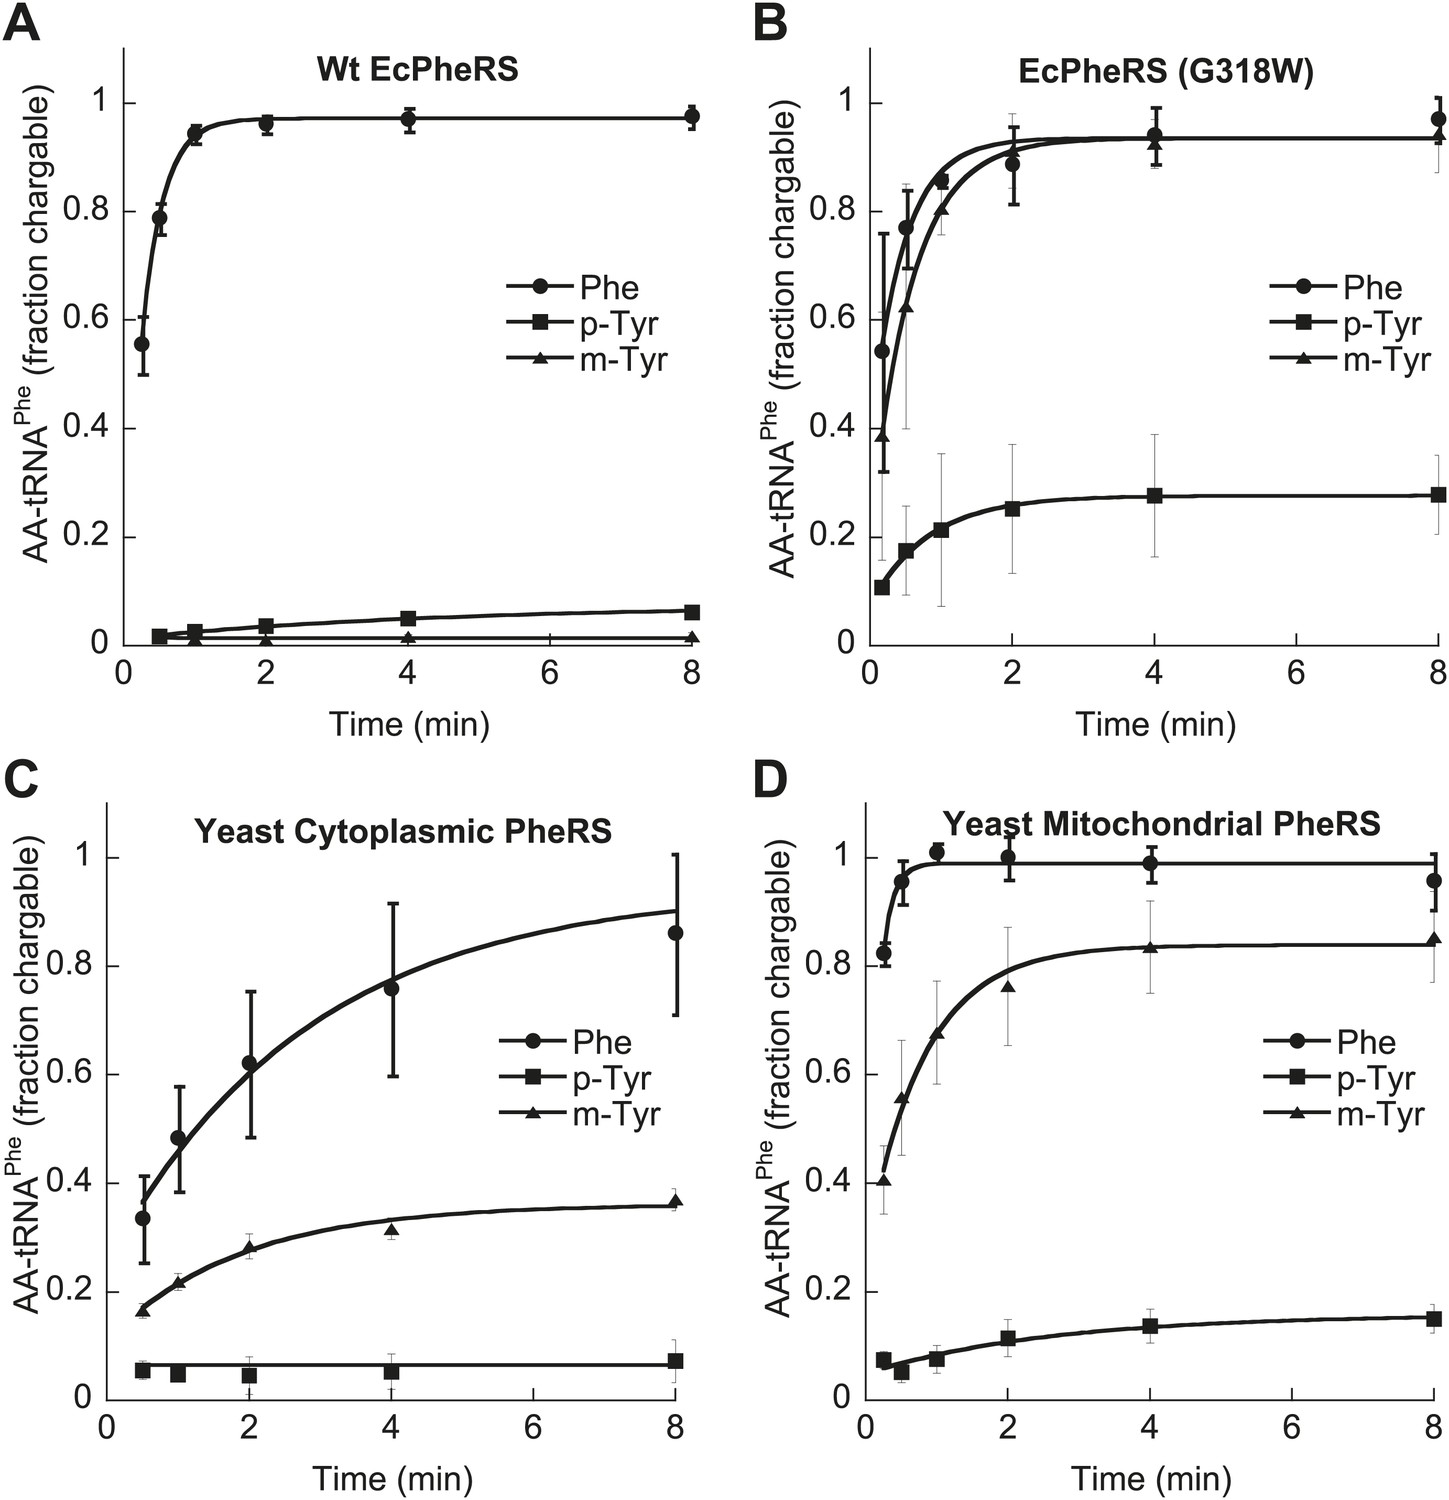
Tyrosine isomers as substrates for tRNAPhe aminoacylation by PheRS variants.
tRNAPhe aminoacylation activities of (A) wild type and (B) G318W E. coli PheRS for 60 μM cognate Phe and non-cognate p- and m-Tyr substrates. Aminoacylation activities of (C) wild type cytoplasmic and (D) wild type mitochondrial S. cerevisiae PheRS for 100 μM cognate Phe and non-cognate p- and m-Tyr substrates. Data points are the mean of three independent experiments, with errors bars representing ± SD.
Figure 5
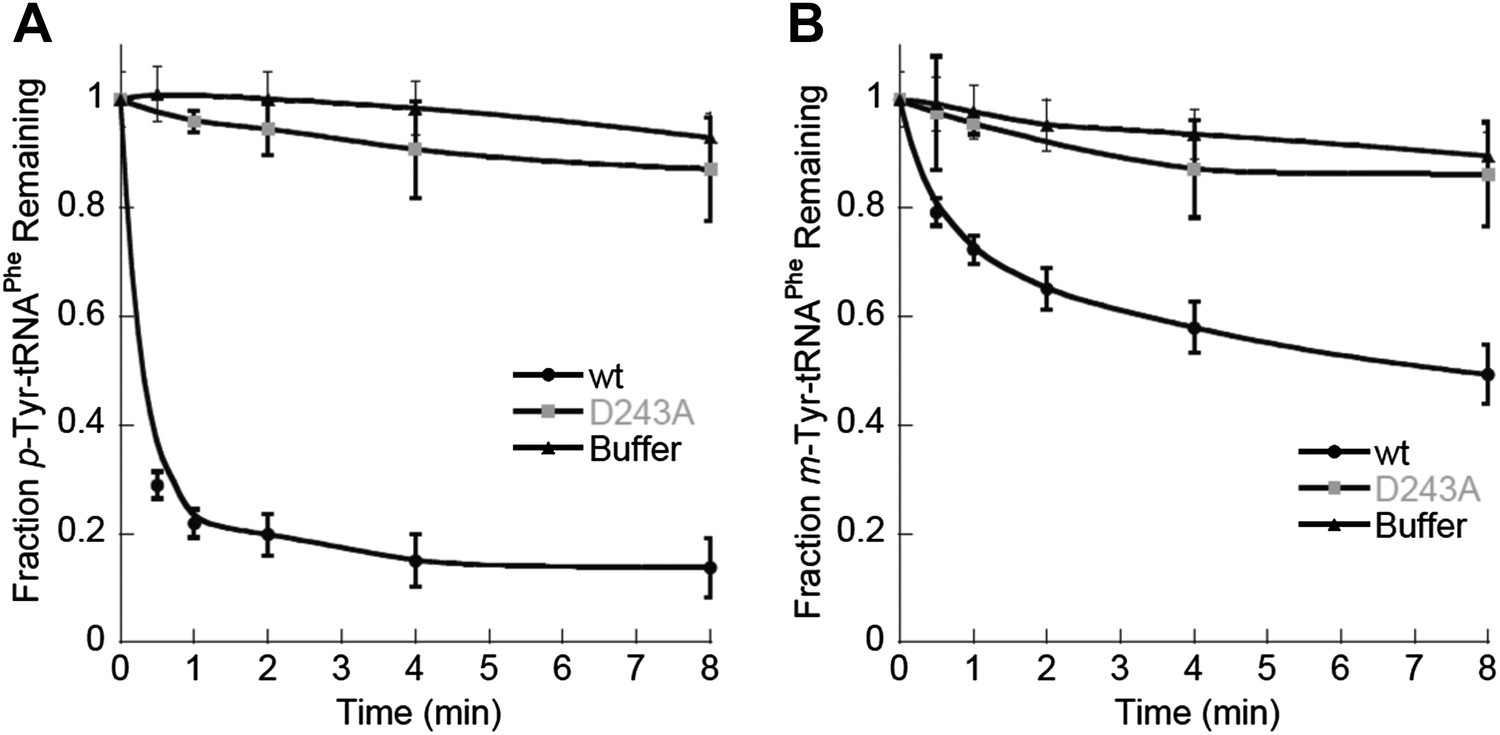
ScctPheRS post–transfer editing of mischarged tRNAPhe substrates.
Hydrolysis of 0.1 µM yeast (A) p-Tyr-[32P]-tRNAPhe or (B) m-Tyr-[32P]-tRNAPhe in the presence of 10 nM wild type ScctPheRS (●) D243A ScctPheRS (■) or buffer (▲) at 37°C. Data points are the mean of three independent experiments, with errors bars representing ± SD.
Figure 6 with 2 supplements

Incorporation of m-Tyr into the proteome of E. coli.
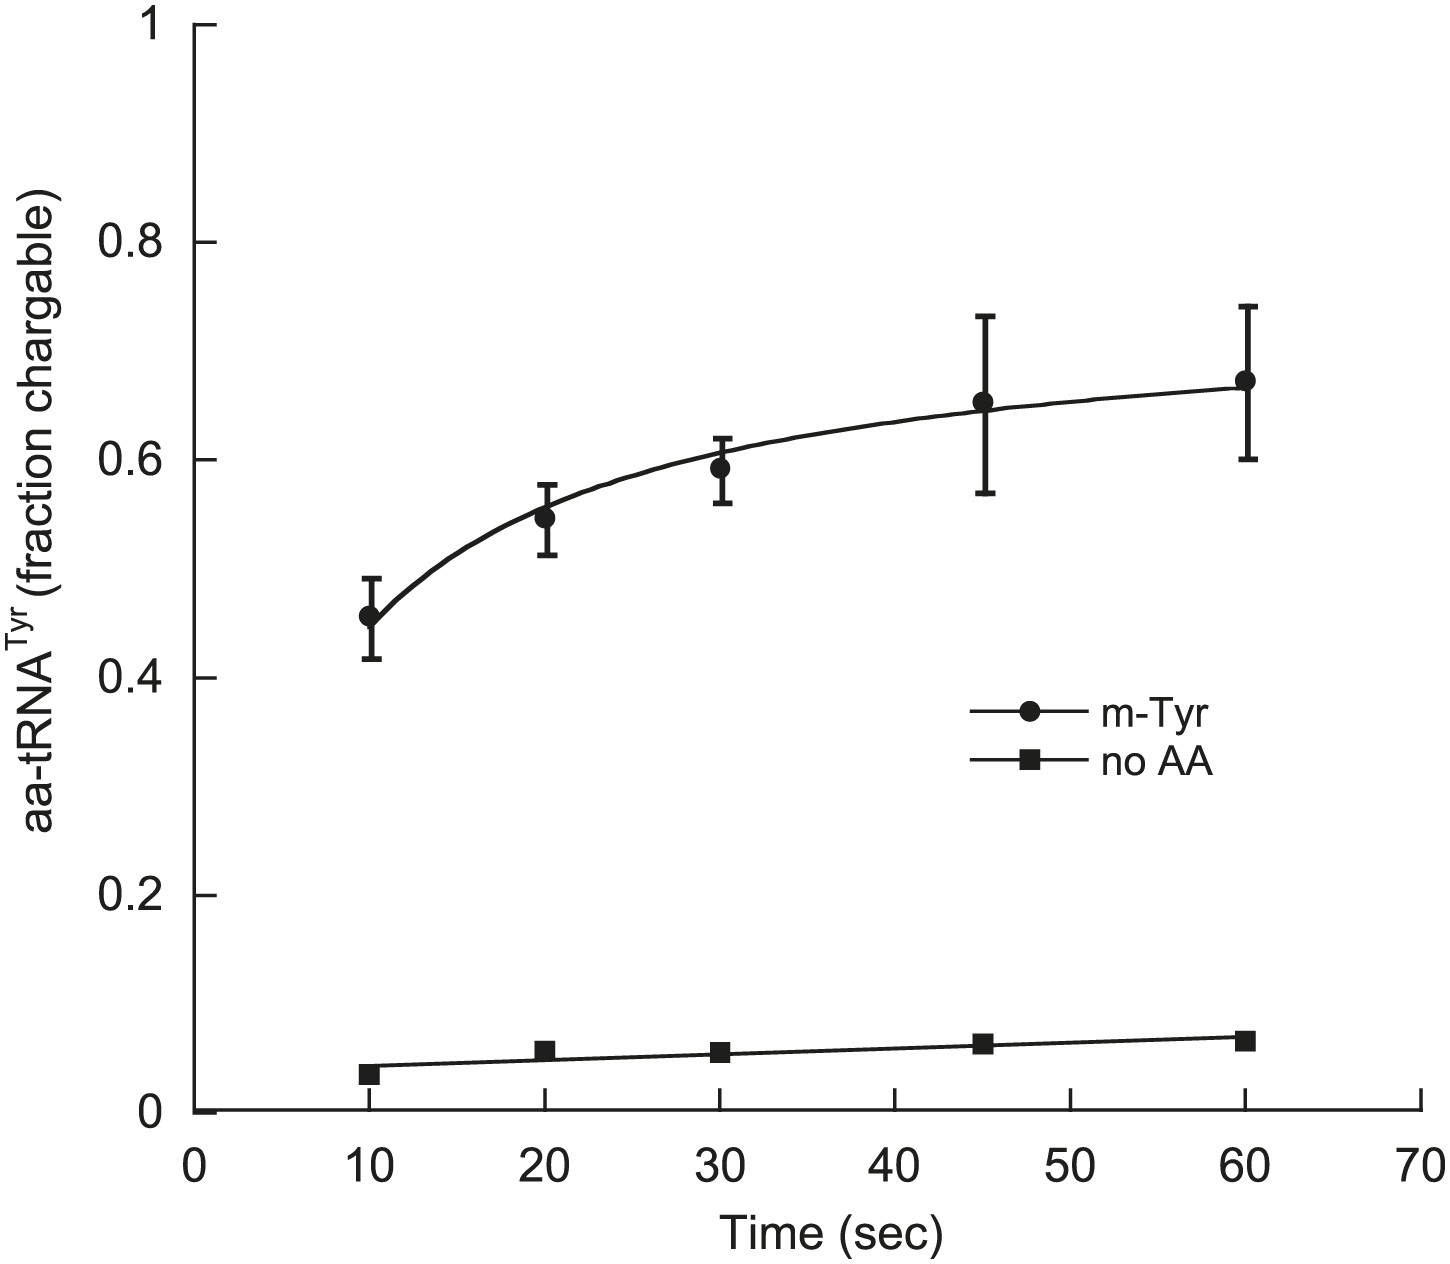
(A) In vitro 70S ribosomal di-peptide synthesis with either Phe-tRNAPhe or m-Tyr-tRNAPhe (B) LC-MS/MS-MRM quantification of m-Tyr and Phe in protein hydrolysis isolated from E. coli expressed as molar ratio of m-Tyr to Phe. Wild type (Wt) and pheT(G318W) strains grown in M9 minimal media alone and supplemented with m-Tyr are shown. Error bars represent ± standard error of means.
Figure 6—figure supplement 1

p-Tyr is not misincorported in the proteome of E. coli at Phe codons.
Mass spectroscopy quantification of p-Tyr and Phe in protein hydrolysis isolated from E. coli expressed as molar ratio of p-tyr to Phe. Wild type and pheT(G318W) strains grown in in M9 minimal media alone and supplemented with p-Tyr are shown. Error bars represent ± standard error of means.
Figure 6—figure supplement 2
E. coli TyrRS uses m-Tyr.
Aminoacylation of E. coli [32P]-tRNAPhe transcript (0.5 μM) with m-Tyr (1 mM) by E. coli TyrRS (50 nM) at 25°C.
Figure 7
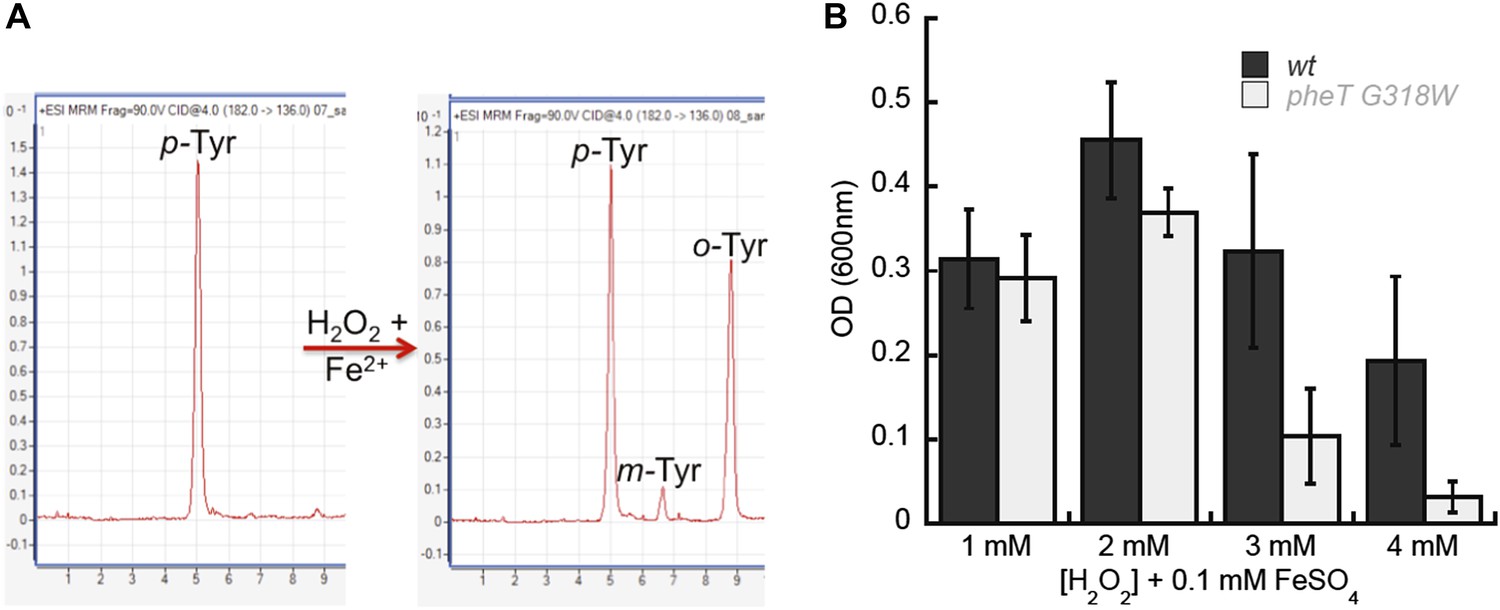
Requirement for PheRS posttransfer editing in ROS conditions in vivo.
(A) LC-MS/MS-MRM chromatograms for p-, m- and o-Tyr (m/z 182→136 transition) extracted from cells grown in the absence (left) and presence (right) of H2O2 and FeSO4. (B) Growth of E. coli pheT(G318W) strain relative to wild type in M9 minimal media supplemented with 0.1 mM FeSO4 and increasing concentrations of H2O2. Bars are the mean of three independent cultures, with errors bars representing ± SD.
Tables
Table 1
Amino acid pools in wild type and editing defective E. coli strains
| Strain | Supplement | m-Tyr (µM)* | p-Tyr (µM) | Phe (µM) | p-Tyr/Phe | m-Tyr/Phe |
|---|---|---|---|---|---|---|
| Wild type | + m-Tyr | 2.9 ± 0.06 | 0.56 ± 0.1 | 0.63 ± 0.2 | 0.9 ± 0.0 | 5 ± 1 |
| pheT(G318W) | + m-Tyr | 2.7 ± 0.5 | 0.46 ± 0.02 | 0.90 ± 0.2 | 0.9 ± 0.2 | 6 ± 1 |
| Wild type | + p-Tyr | ND | 11 ± 4 | 0.91 ± 0.1 | 12 ± 4 | ND† |
| pheT(G318W) | + p-Tyr | ND | 8.9 ± 0.4 | 0.93 ± 0.1 | 9.7 ± 1 | ND |
-
*
Concentrations of intracellular Phe and Tyr isomers isolated from wild type and pheT(G318W) E. coli strains grown in M9 minimal media supplemented with either m-Tyr or p-Tyr.
-
†
ND indicates concentrations were below the detectable limit (0.01 µM).
Table 2
Steady-state kinetic constants for amino acid activation by PheRS from E. coli and S. cerevisiae cytoplasmic PheRS
| Phe | m-Tyr | p-Tyr | Specificity (kcat/KM/kcat/KM) | ||||||
|---|---|---|---|---|---|---|---|---|---|
| PheRS | KM (µM) | kcat (s−1) | kcat/KM (s−1/µM) | KM (µM) | kcat (s−1) | kcat/KM (s−1/µM) | kcat/KM (s−1/µM) | Phe/m-Tyr | Phe/p-Tyr |
| E. coli | 18 ± 4 | 5.2 ± 2 | 0.29 | 247 ± 60 | 2.1 ± 0.8 | 0.008 | 1.1 × 10⁻⁴ | 35 | 2650 |
| Yeast ct | 16 ± 2 | 26 ± 4 | 1.6 | 1150 ± 230 | 26 ± 4 | 0.023 | 0.014 | 71 | 120 |
Download links
A two-part list of links to download the article, or parts of the article, in various formats.
Downloads (link to download the article as PDF)
Open citations (links to open the citations from this article in various online reference manager services)
Cite this article (links to download the citations from this article in formats compatible with various reference manager tools)
Oxidation of cellular amino acid pools leads to cytotoxic mistranslation of the genetic code
eLife 3:e02501.
https://doi.org/10.7554/eLife.02501


