Core promoter factor TAF9B regulates neuronal gene expression
- University of California, Berkeley, United States
- Howard Hughes Medical Institute, University of California, Berkeley, United States
- CIRM Center of Excellence, Li Ka Shing Center For Biomedical and Health Sciences, University of California, Berkeley, United States
Figures
Figure 1 with 1 supplement

TAF9B is up-regulated upon neuronal differentiation.
(A) Mouse embryonic stem (ES) cells were differentiated into motor neurons (MN) using embryoid body cultures (EB-MN) for 6 days and immunostained with MN markers ISL1/2 and LHX3, and neuronal marker TUJ1. (B) Mouse ES cells containing a MN-specific GFP marker were used to isolate GFP expressing (GFP+) MN cells and to monitor induction of MN under different sonic hedgehog (SHH) concentrations. (C) TAF expression levels were measured by qRT-PCR in GFP+ and GFP negative (GFP−) cells sorted from EB-MN differentiated for 6 days and compared to the levels observed in undifferentiated ES cells. Bars show mean ± SD of three biological replicates. (D) Western blot analysis of ES cells and EB-MN differentiated for 6 and 8 days detecting TAFs, the neuronal marker TUBB3, the ES cell marker OCT4, and ACTB. (E) RNA-seq analysis of TAF expression comparing mouse ES cells and mouse newborn spinal cord tissue. Bars show FPKM values of spinal cord tissue relative to FPKM values of ES cells.
Figure 1—figure supplement 1
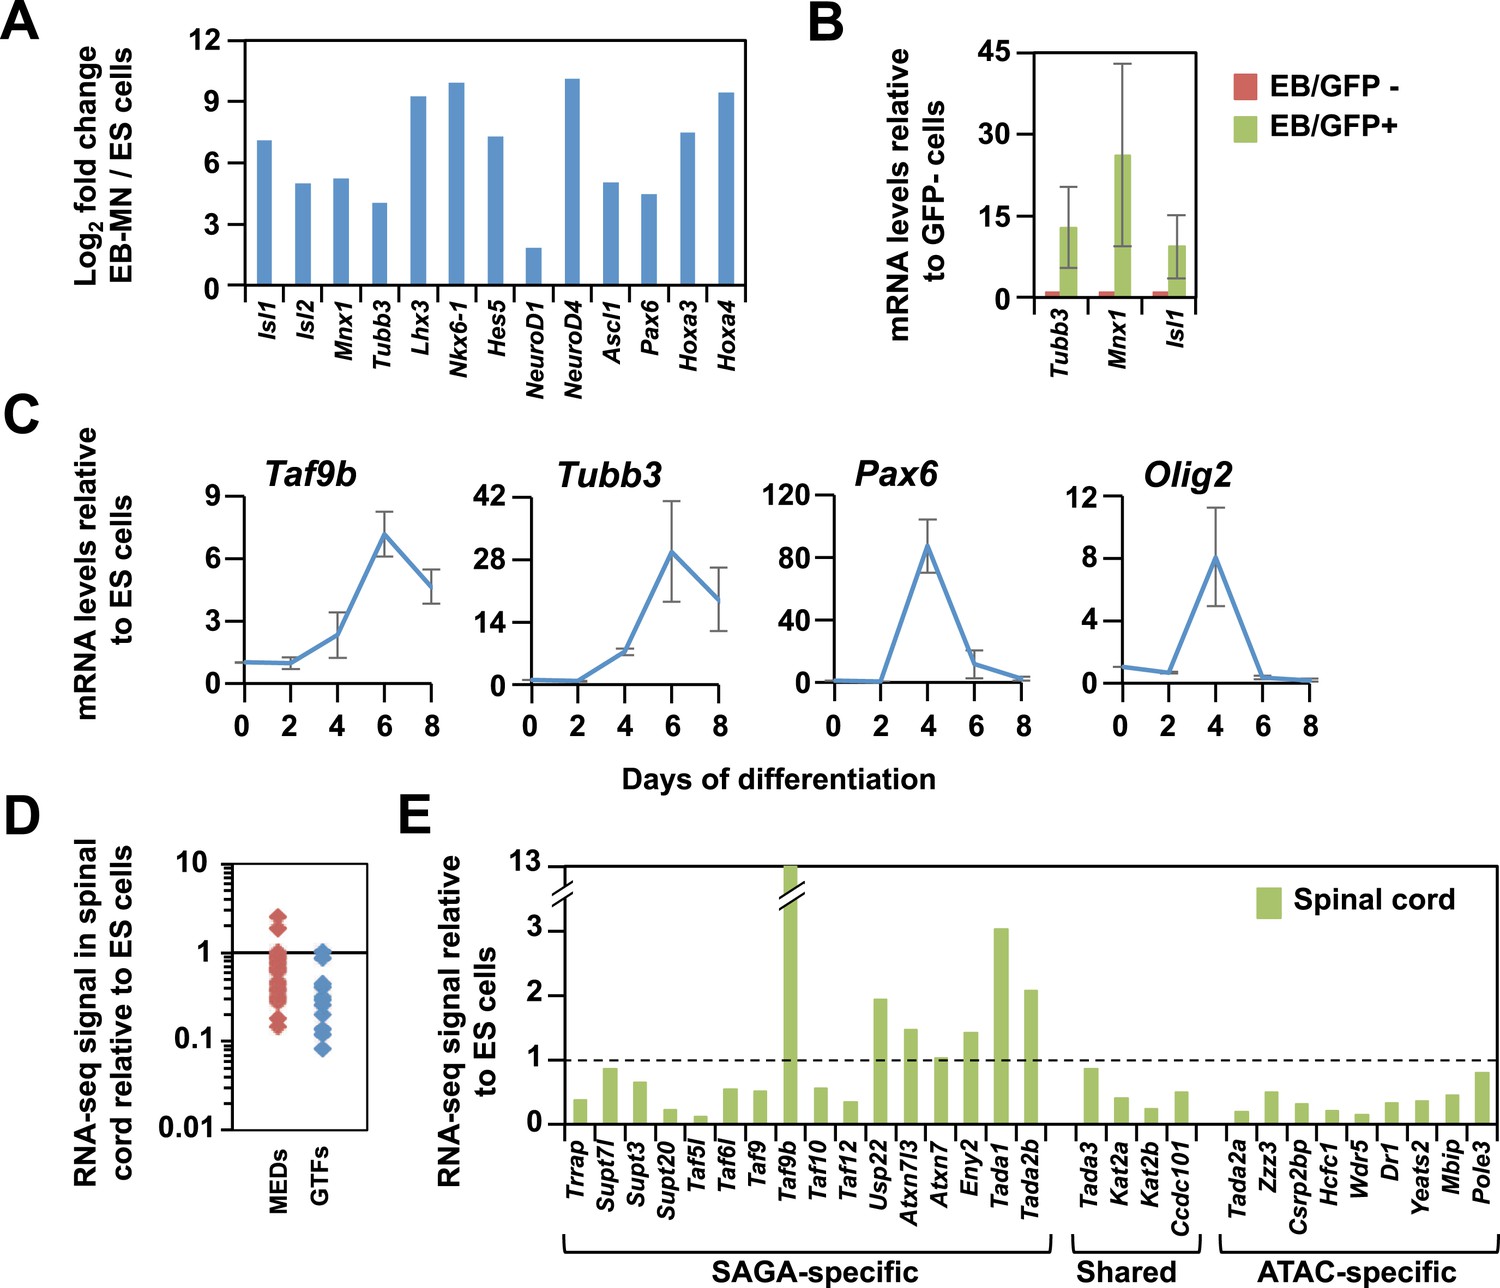
TAF9B is up-regulated upon neuronal differentiation.
(A) Gene expression levels detected by RNA-seq analysis comparing mouse ES cells and EB-MN cells differentiated for 6 days. Fold inductions are shown as log2 fold change between EB-MN and ES cells. (B) Mouse ES cells containing a MN-specific GFP marker were used to isolate GFP expressing (GFP+) and GFP negative (GFP−) cells and qRT-PCR analysis was done to compare levels of induction of neuronal markers Tubb3, Mnx1, and Isl1 in both populations. Bars show mean ± SD of three biological replicates. (C) qRT-PCR analysis detecting Taf9b, neuronal marker Tubb3, and progenitor markers Pax6 and Olig2 in mouse ES cells differentiated into EB-MN in the presence of SAG and Notch inhibitor DAPT (‘Materials and methods’). Graphs represent mean ± SD of three biological replicates. (D) RNA-seq analysis comparing the expression levels of components of the core promoter machinery between mouse ES cells and newborn spinal cord tissue. Data points show FPKM values of spinal cord tissue relative to FPKM values of ES cells. MEDs = mediator subunits, GTFs = General transcription factors subunits (TFIIA-TFIIH, not including TFIID). (E) RNA-seq analysis comparing the expression levels of the components of the SAGA and ATAC complexes between mouse ES cell and newborn spinal cord tissue.
Figure 2
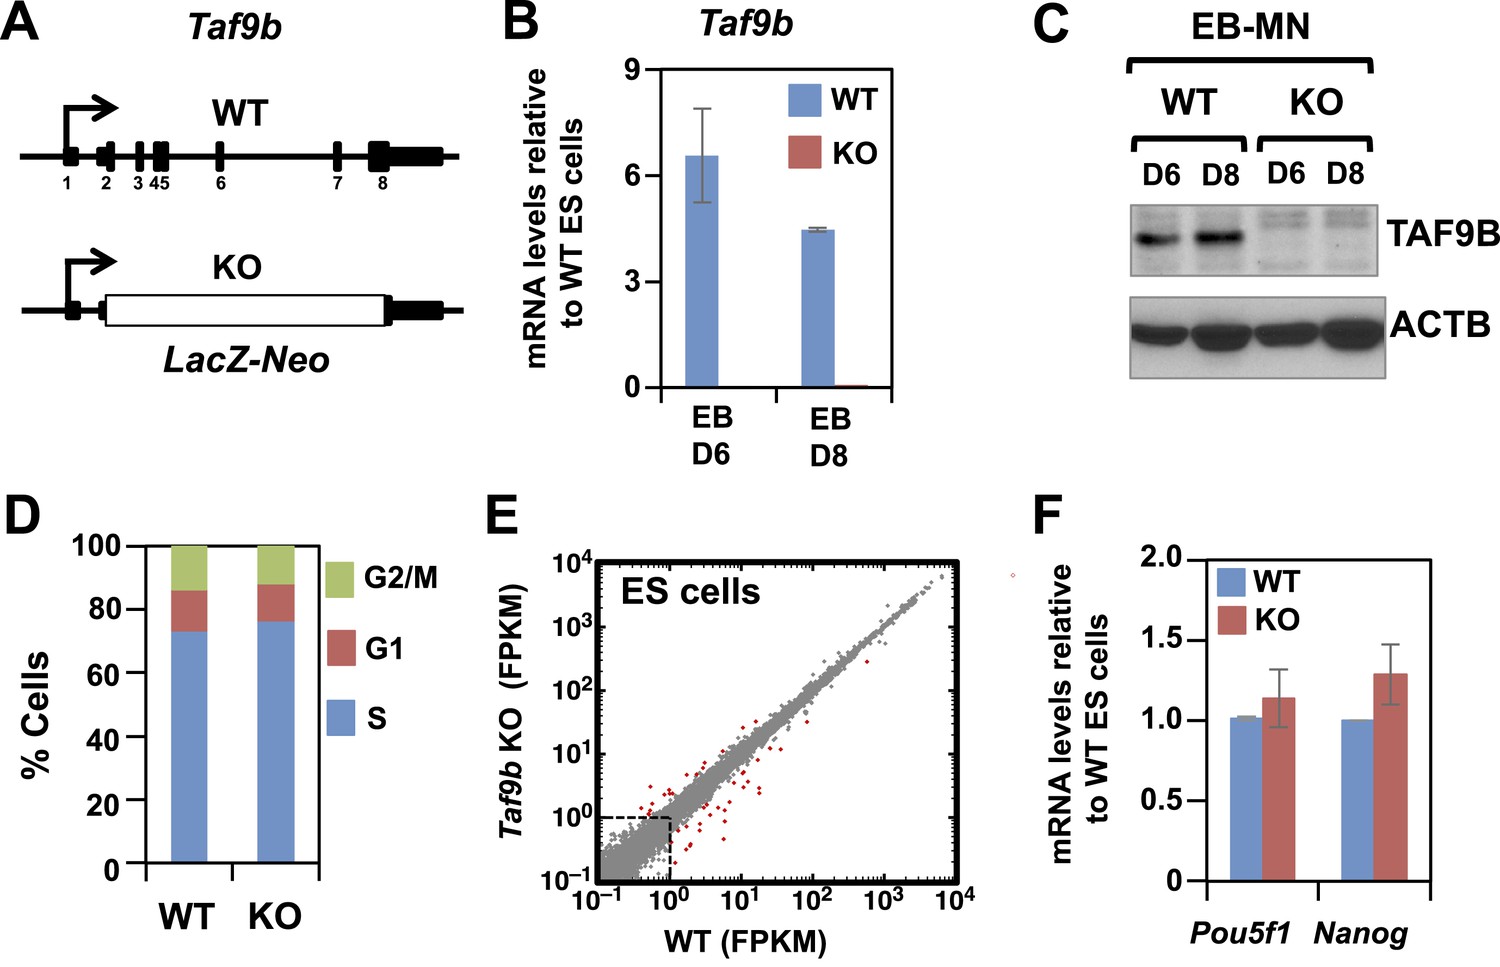
TAF9B is dispensable for global gene expression in murine ES cells.
(A) In Taf9b KO murine ES cells a LacZ-Neo cassette replaces all protein coding exons of Taf9b gene on the X chromosome. (B) qRT-PCR of in vitro differentiated EB-MN for 6 and 8 days detecting the expression of Taf9b in WT and Taf9b KO cells. Bars show mean ± SEM of three biological replicates. (C) Western blot analysis of in vitro differentiated EB-MN for 6 and 8 days detecting the expression of TAF9B in WT and Taf9b KO cells. (D) Cell cycle profile of WT and Taf9b KO ES cells based on BrdU incorporation. Graph represents average values of two independent biological duplicates. (E) RNA-seq analysis of WT and Taf9b KO ES cells grown in undifferentiated conditions. Scatter plot represents FPKM values for genes expressed in WT and Taf9b KO cells. Red dots are genes whose expression is affected more than twofold with p-values <0.05. Gray dots represent genes not changing more than the selected cutoff. (F) qRT-PCR analysis of the ES cell markers Pou5f1 and Nanog in WT and Taf9b KO ES cells grown in undifferentiated conditions. Bars show mean ± SEM of three biological replicates.
Figure 3
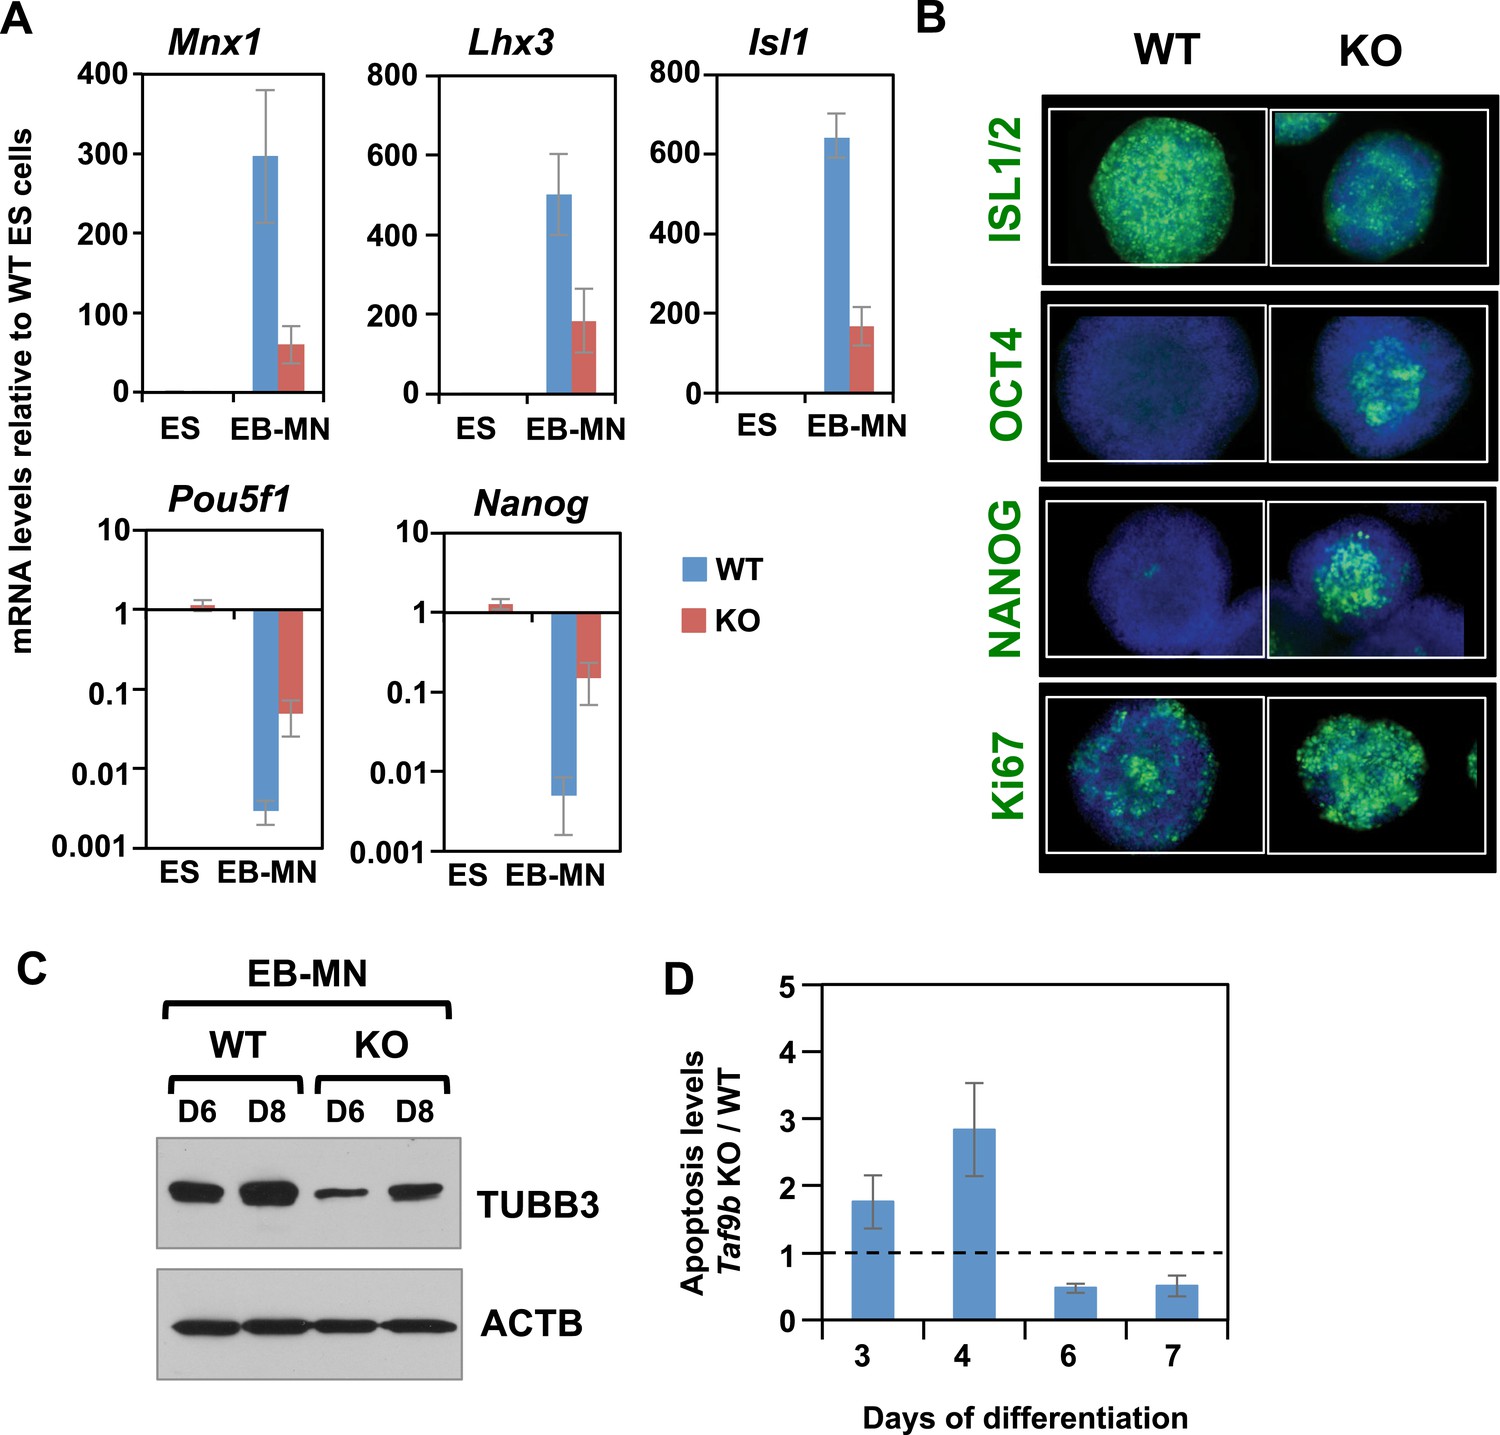
TAF9B is required for efficient differentiation of murine ES cells into motor neurons in vitro.
(A) qRT-PCR analysis for the MN markers (Mnx1, Lhx3, Isl1) and ES cell markers (Pou5f1 and Nanog) in WT and Taf9b KO cells differentiated for 6 days. Values are relative to undifferentiated ES cells. Bars show mean ± SEM of three biological replicates. (B) WT and Taf9b KO EB-MN, differentiated for 6 days, were immunostained using antibodies against MN marker ISL1/2, ES cell markers OCT4 and NANOG, and cellular proliferation marker Ki67. (C) Western blot analysis of WT and Taf9b KO EB-MN samples differentiated for 6 and 8 days detecting neuronal marker TUBB3 and ACTB. (D) Apoptosis levels were determined using an annexin V based assay in WT and Taf9b KO cells at different time points during MN differentiation. Graph shows mean ± SEM for the ratio of Taf9b KO to WT cells in three biological replicates.
Figure 4 with 1 supplement
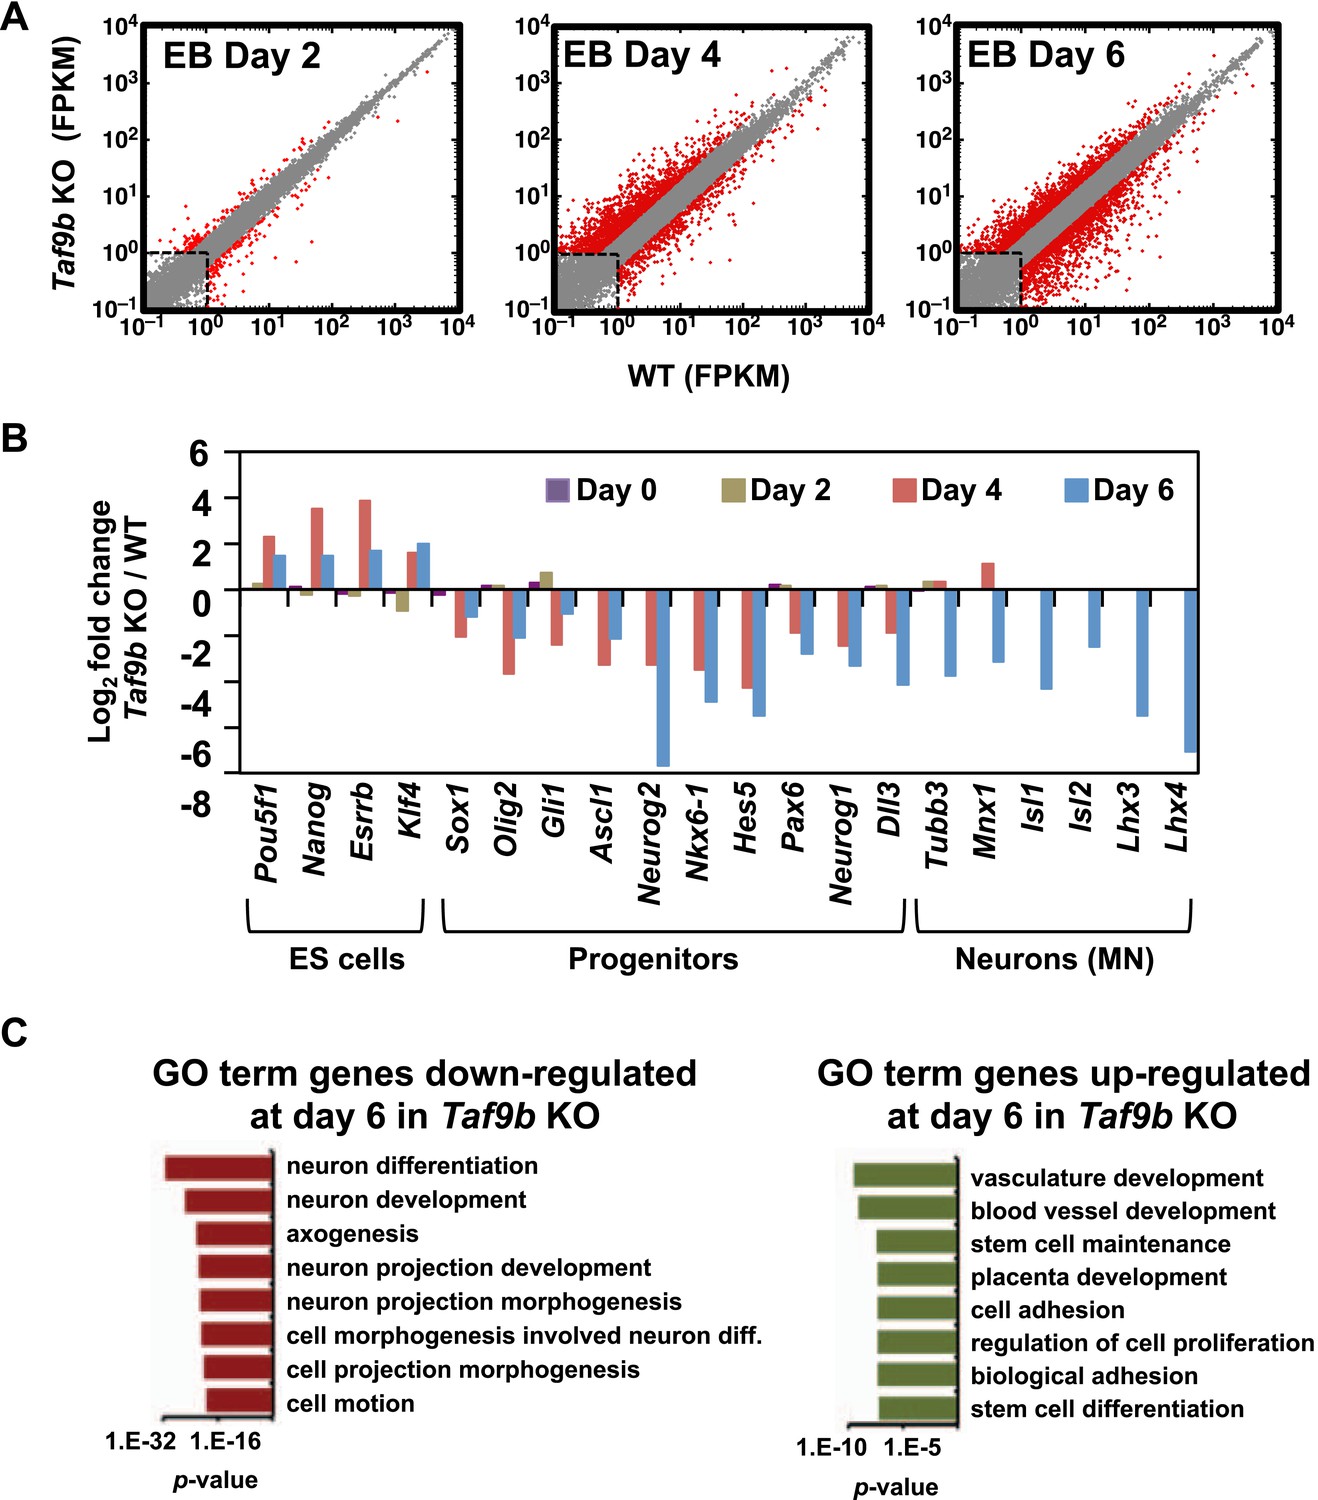
TAF9B is specifically required for the efficient activation of neuronal gene expression during in vitro motor neuron differentiation.
(A) RNA-seq analysis of WT and Taf9b KO cells at different time points during EB-MN differentiation. Scatter plots represent FPKM values for genes expressed in WT and Taf9b KO cells. Red dots are genes whose expression is affected more than twofold with p-values <0.05. Gray dots represent genes not changing more than the selected cutoff. (B) Selected genes from RNA-seq analysis are shown as log2 fold change between Taf9b KO and WT cells. Examples are given for key genes expressed in ES cells, progenitor cells, and motor neurons. (C) GO term analysis of genes affected by the loss of TAF9B in RNA-seq analysis of EB-MN differentiated for 6 days. Lists show the top eight GO term Biological Process categories obtained ranked by p-value.
Figure 4—figure supplement 1
TAF9B is specifically required for the efficient activation of neuronal gene expression during in vitro motor neuron differentiation.
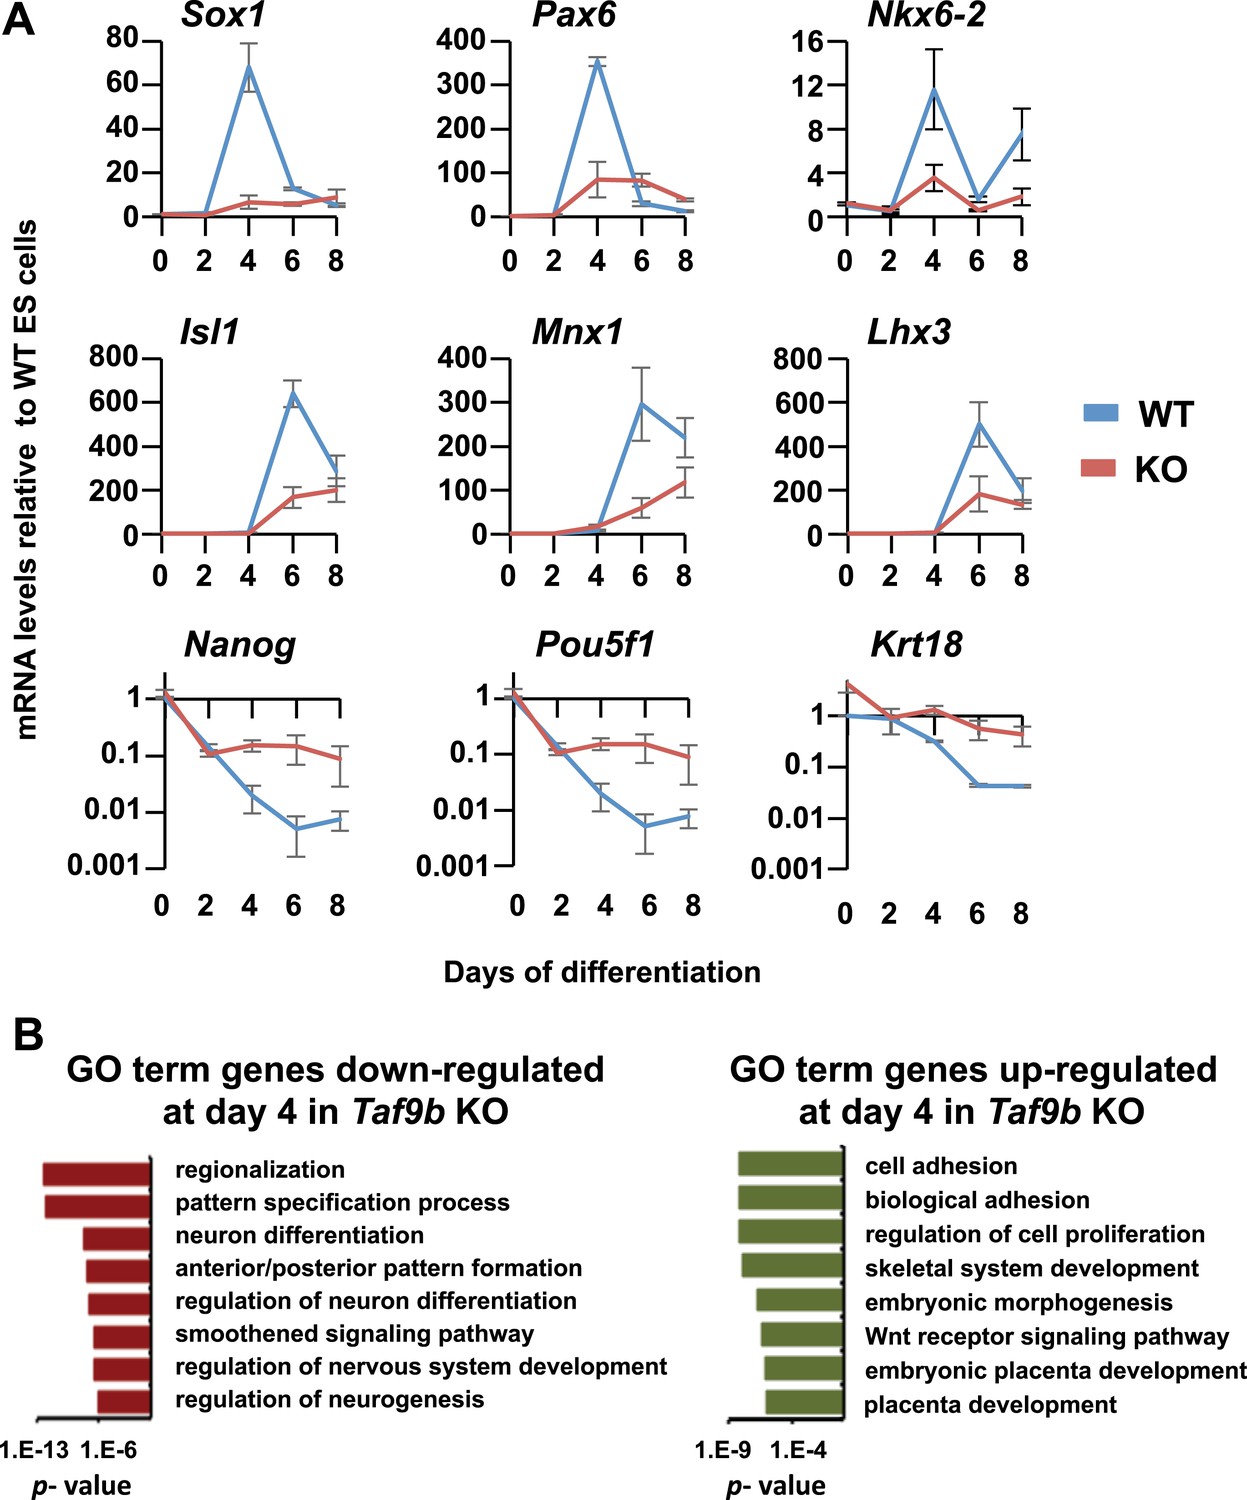
(A) qRT-PCR analysis of progenitor markers (Sox1, Pax6, Nkx6-2) during differentiation of WT and Taf9b KO ES cells into EB-MN. qRT-PCR analysis of MN markers (Isl1, Mnx1, Lhx3) and ES cell markers (Pou5f1, Nanog) from Figure 3 as well as Krt18 are shown as full time course. Graphs show mean ± SEM of three biological replicates. (B) GO term analysis of genes affected by the loss of TAF9B in RNA-seq analysis of EB-MN differentiated for 4 days. Lists show the top eight GO term Biological Process categories obtained ranked by p-value.
Figure 5 with 1 supplement
TAF9B binds promoter and distal regions of neuronal genes.
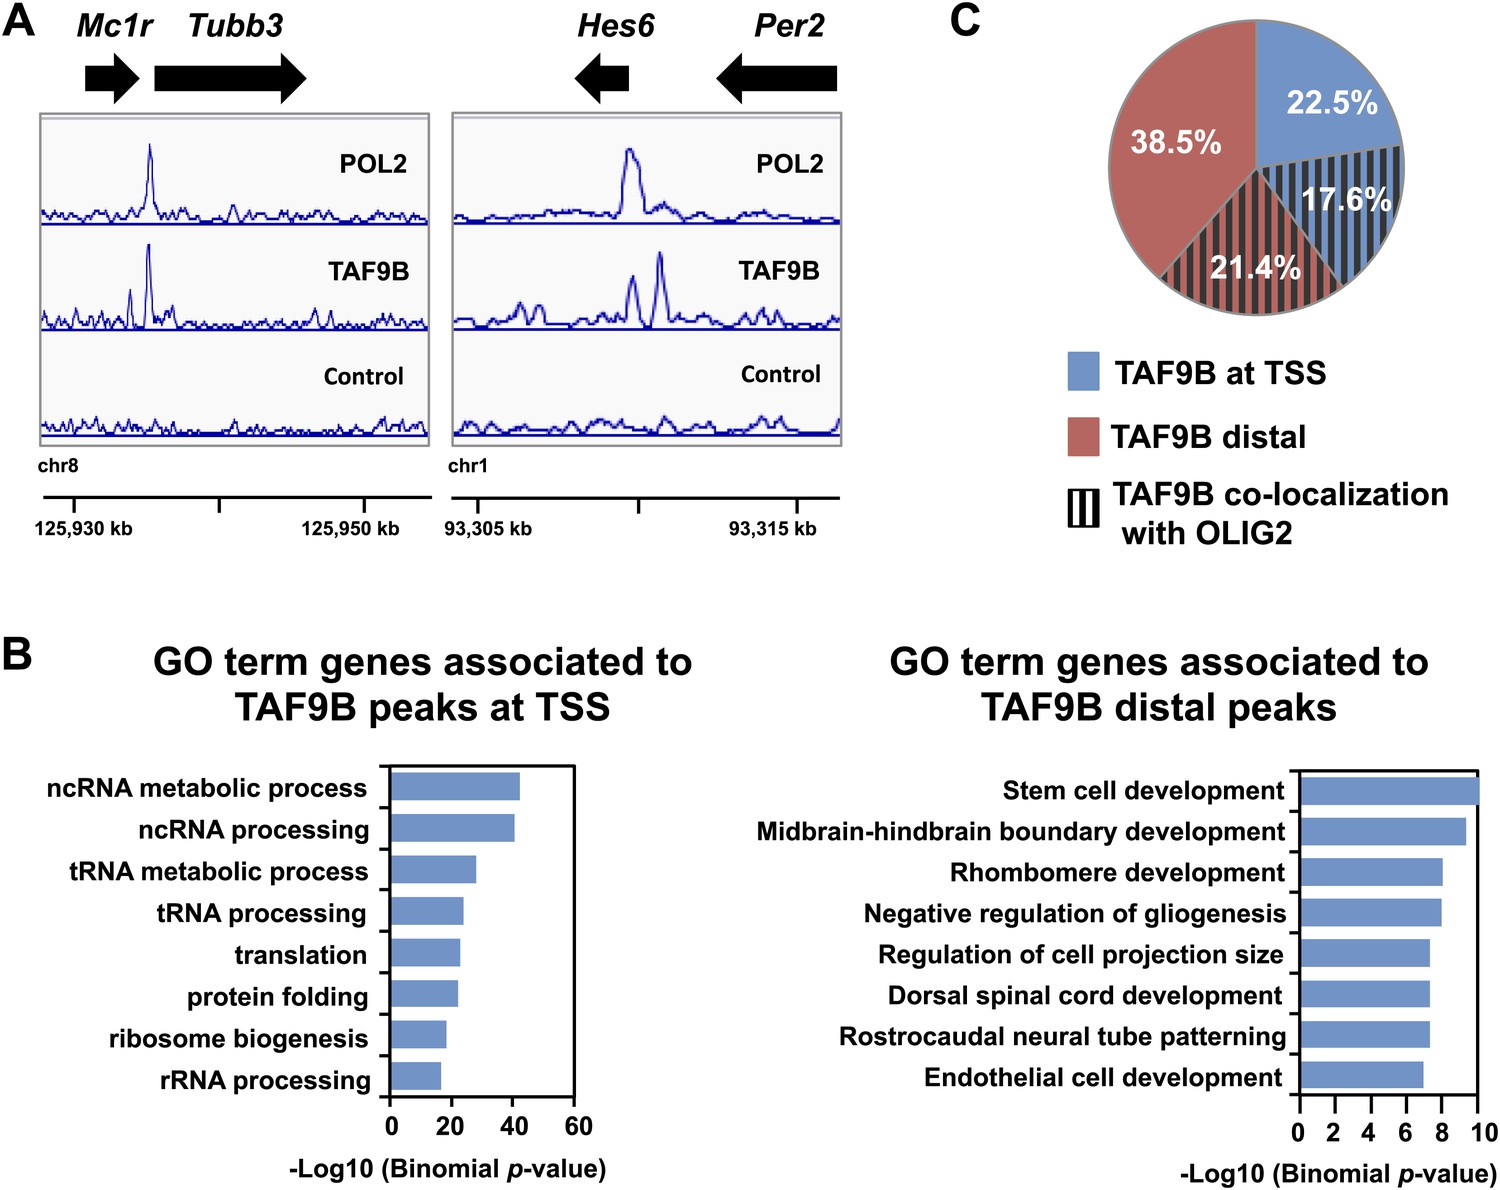
(A) ChIP-seq analysis of TAF9B and RNA POL2 binding sites in EB-MN samples differentiated for 8 days. TAF9B and RNA POL2 ChIP-seq peaks examples are given for Tubb3 and Hes6 genes. (B) List of top GO terms Biological Process of genes associated to TAF9B distal peaks and TAF9B peaks at annotated transcription start sites (TSS) ranked by p-value. Association of ChIP-seq peak to annotated genes and GO analysis was performed using GREAT. (C) Co-localization of TAF9B distal peaks and TAF9B peaks at TSS with OLIG2 ChIP-seq peaks in EB-MN samples.
Figure 5—figure supplement 1
TAF9B binds promoter and distal regions of neuronal genes.
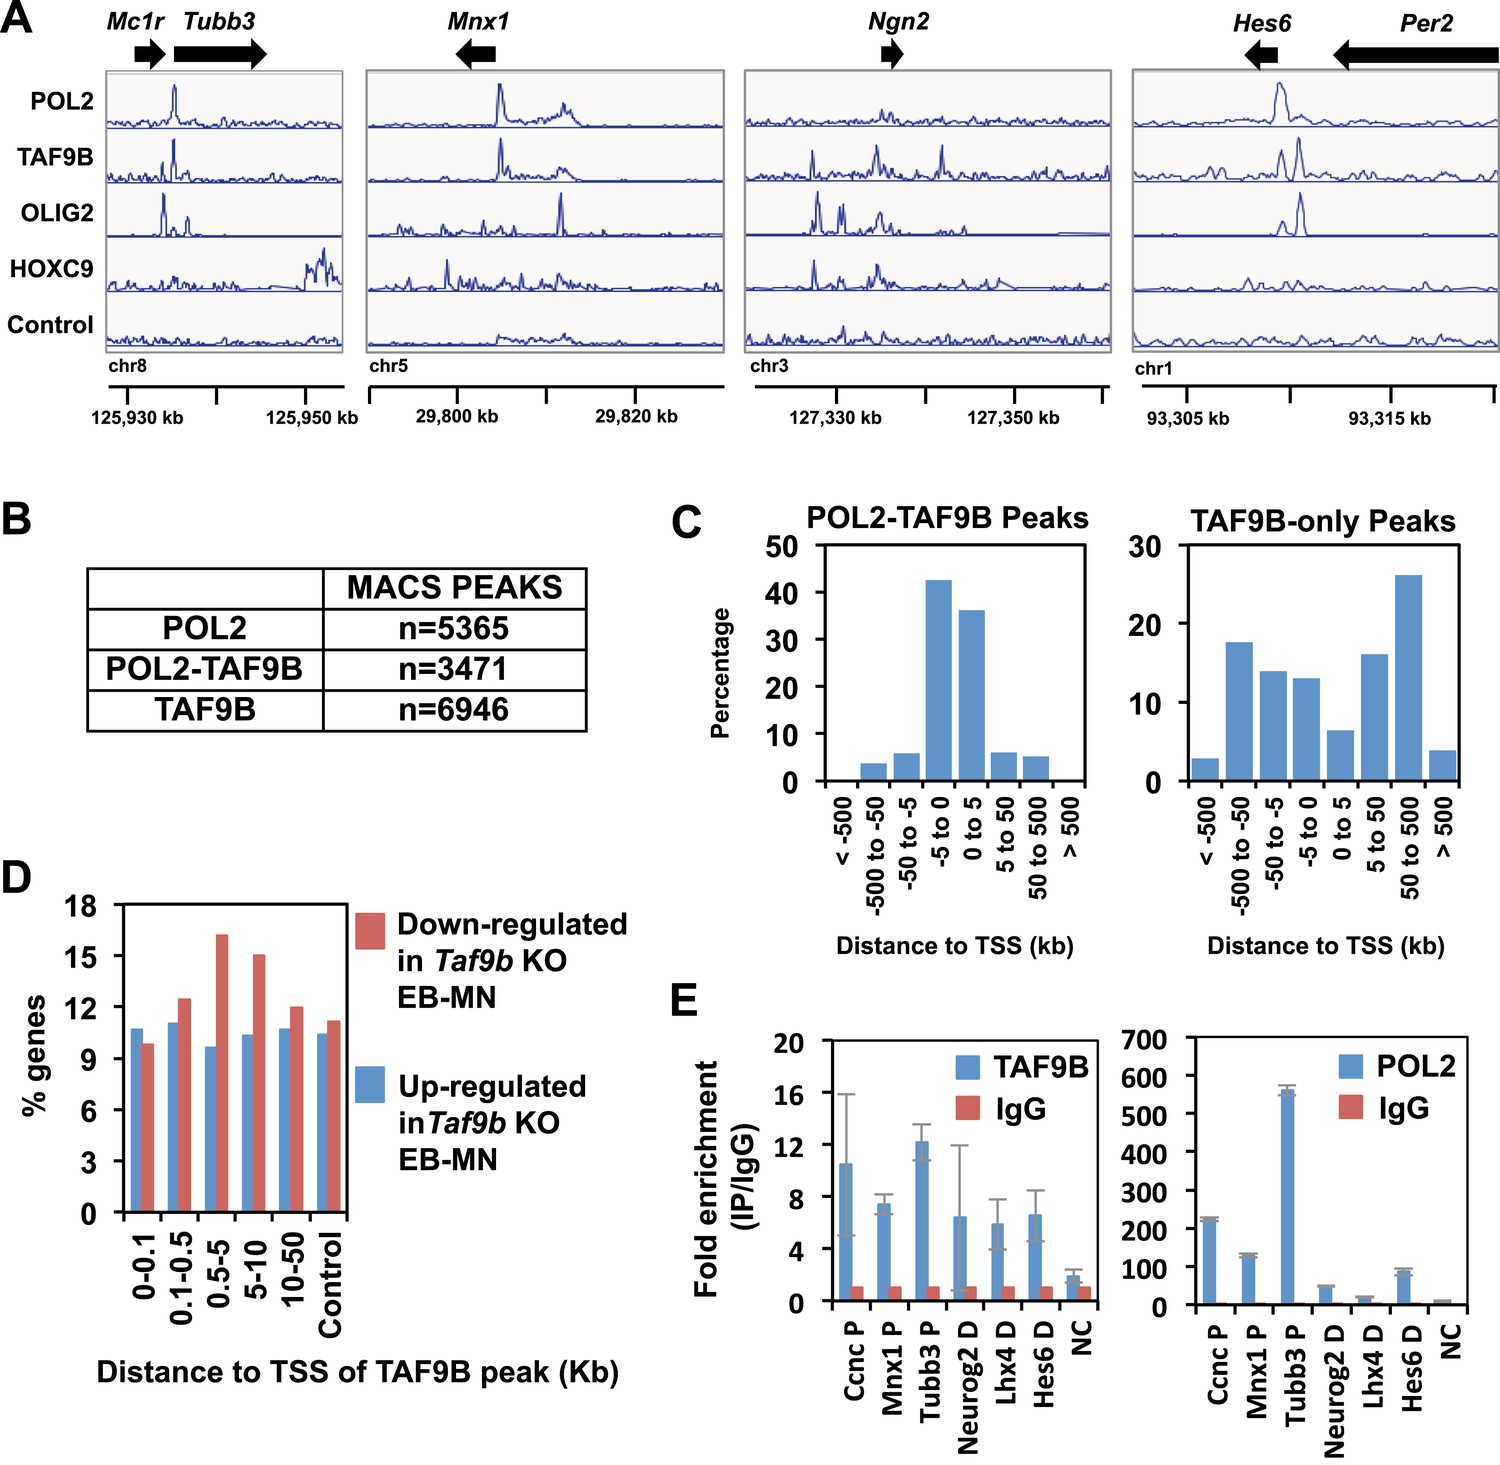
(A) TAF9B, OLIG2, HOXC9 and RNA POL2 ChIP-seq peaks examples are given for Tubb3, Mnx1, Ngn2 and Hes6 genes. (B) Total numbers of peaks obtained by MACS in each ChIP-seq category. (C) ChIP-seq analysis of TAF9B and RNA POL2 binding sites in EB-MN samples relative to their distance to annotated transcription start sites (TSS) performed using GREAT. (D) Percentage of genes affected more than twofold in the absence of TAF9B as determined by RNA-seq analysis in Taf9b KO EB-MN differentiated for 6 days. Genes are grouped in different categories depending on the distance of the TAF9B peaks from their TSS. Genes associated to TAF9B-only peaks were used for the analysis. A gene list randomly generated was used as control. (E) Representative ChIP-qPCR analysis of TAF9B and RNA POL2 of selected loci identified by ChIP-seq. D = distal region, P = proximal promoter, NC = negative control. Bars represent mean ± SD of three replicates.
Figure 6
TAF9B is associated with PCAF.
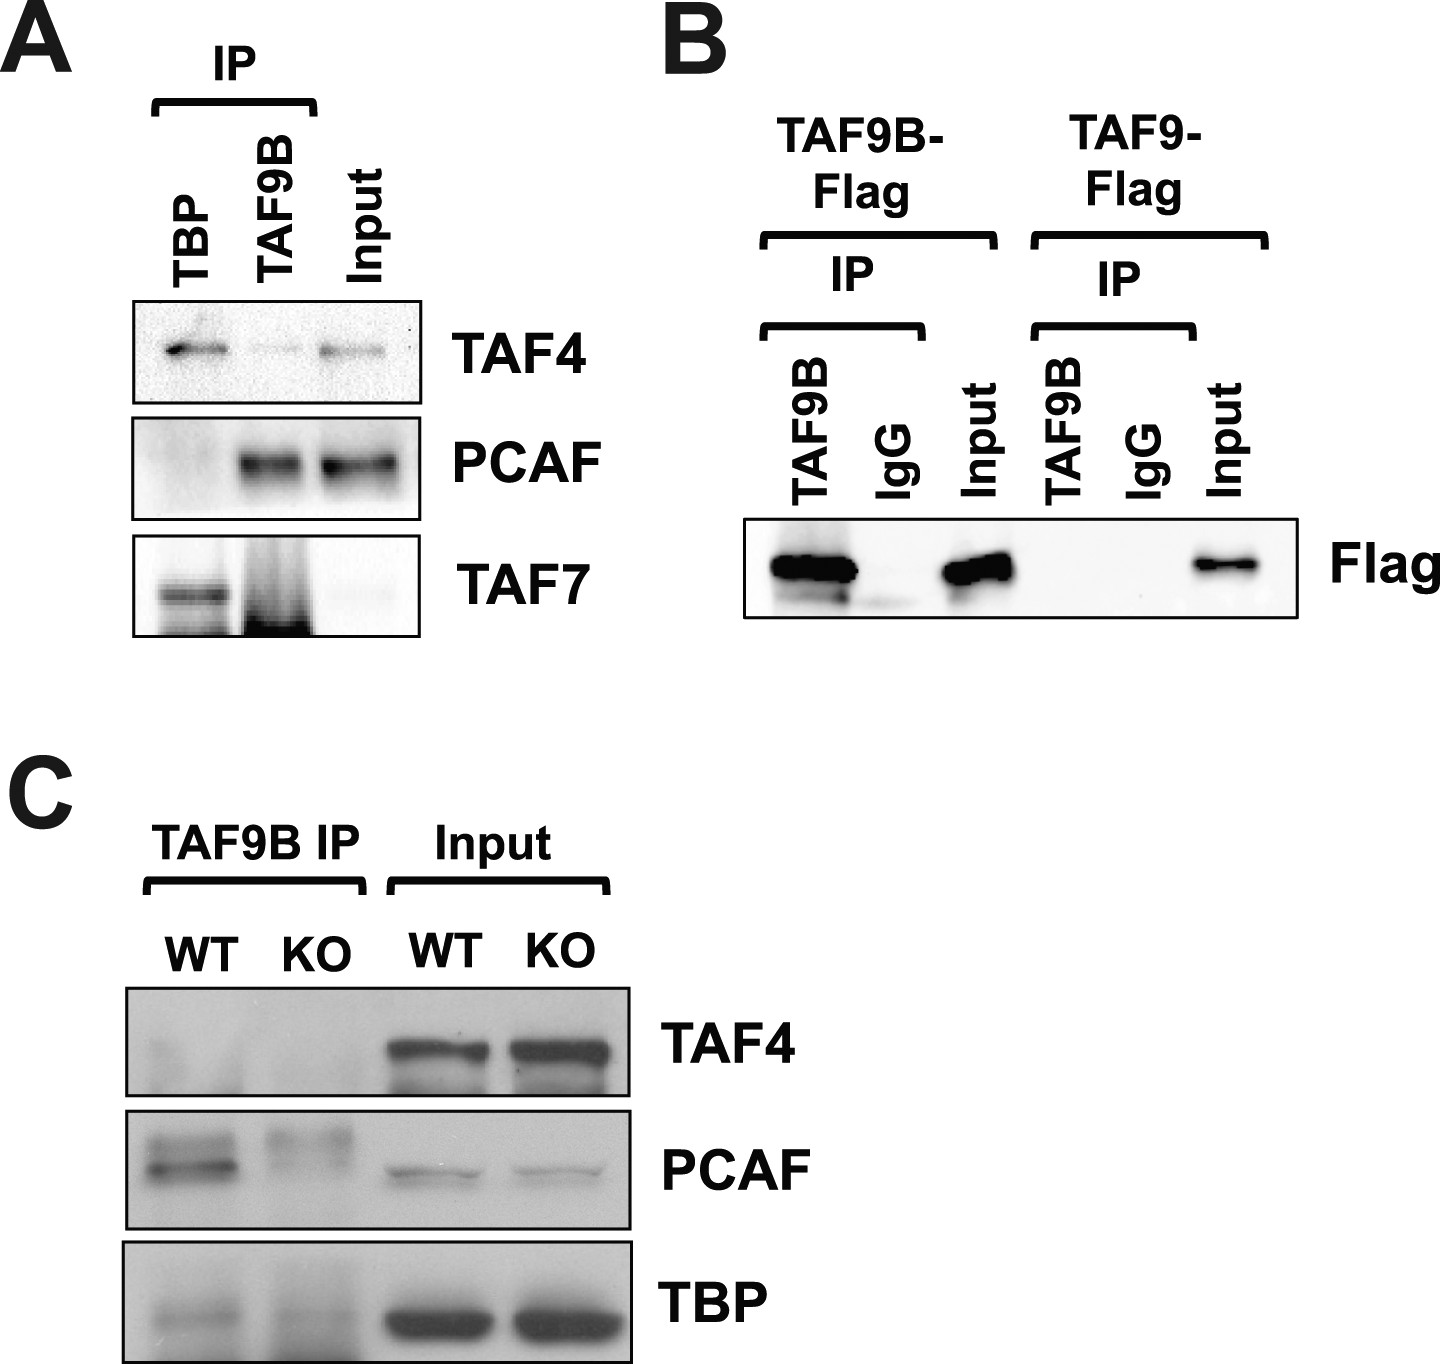
(A) TAF9B and TBP were immunoprecipitated from EB-MN cells differentiated for 8 days and co-immunoprecipitated proteins analyzed by western blotting using antibodies against the TFIID subunits TAF4 and TAF7, and the histone acetyltransferase PCAF. (B) 293T cells were transfected with pCMV-3xFLAG-TAF9B or -TAF9, immunoprecipitated with TAF9B antibodies, and analyzed by western blotting using anti-Flag antibodies. (C) TAF9B was immunoprecipitated from spinal column extracts from WT and Taf9b KO newborn mice and co-immunoprecipitated proteins were analyzed by western blotting detecting TAF4, TBP and PCAF.
Figure 7 with 1 supplement
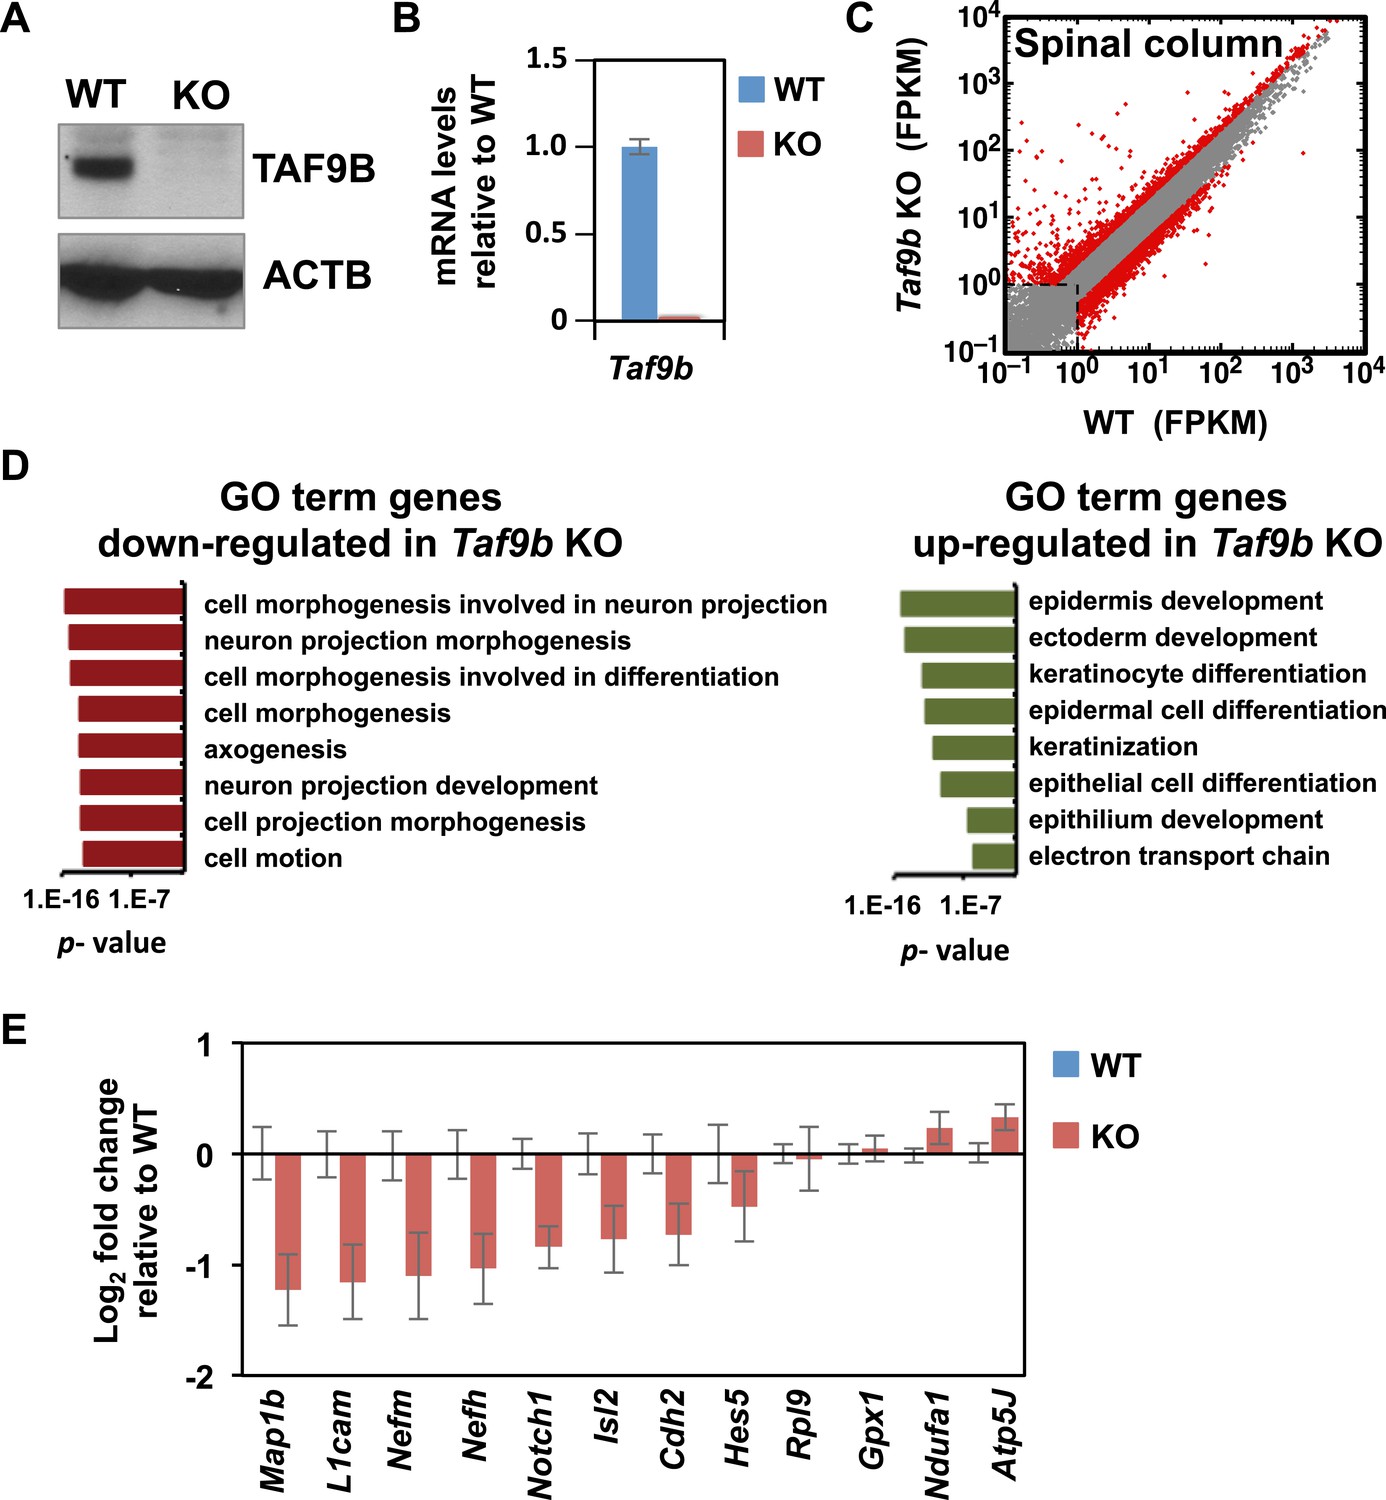
TAF9B controls neuronal gene expression in vivo.
(A) Western blot analysis of spinal cord tissue from WT and Taf9b KO newborn mice detecting TAF9B and ACTB as control. (B) Spinal cord tissue from WT and Taf9b KO newborn mice were dissected and analyzed by qRT-PCR for Taf9b expression. Graph shows mean ± SEM of three biological replicates. (C) RNA-seq analysis of dissected lumbar spinal column tissue from WT and Taf9b KO newborn mice. Scatter plot represents FPKM values of genes expressed in WT and Taf9b KO samples. Red dots are genes whose expression is affected more than twofold with p-values <0.05. Gray dots represent genes not changing more than the selected cutoff. (D) GO term analysis of genes affected by the loss of TAF9B in RNA-seq analysis. List shows the top eight GO term Biological Process categories obtained ranked by p-value. (E) Gene expression analysis by qRT-PCR of lumbar spinal columns tissues of newborn mice. Graphs represent mean ± SEM of littermate comparisons (WT n = 6, KO n = 8).
Figure 7—figure supplement 1
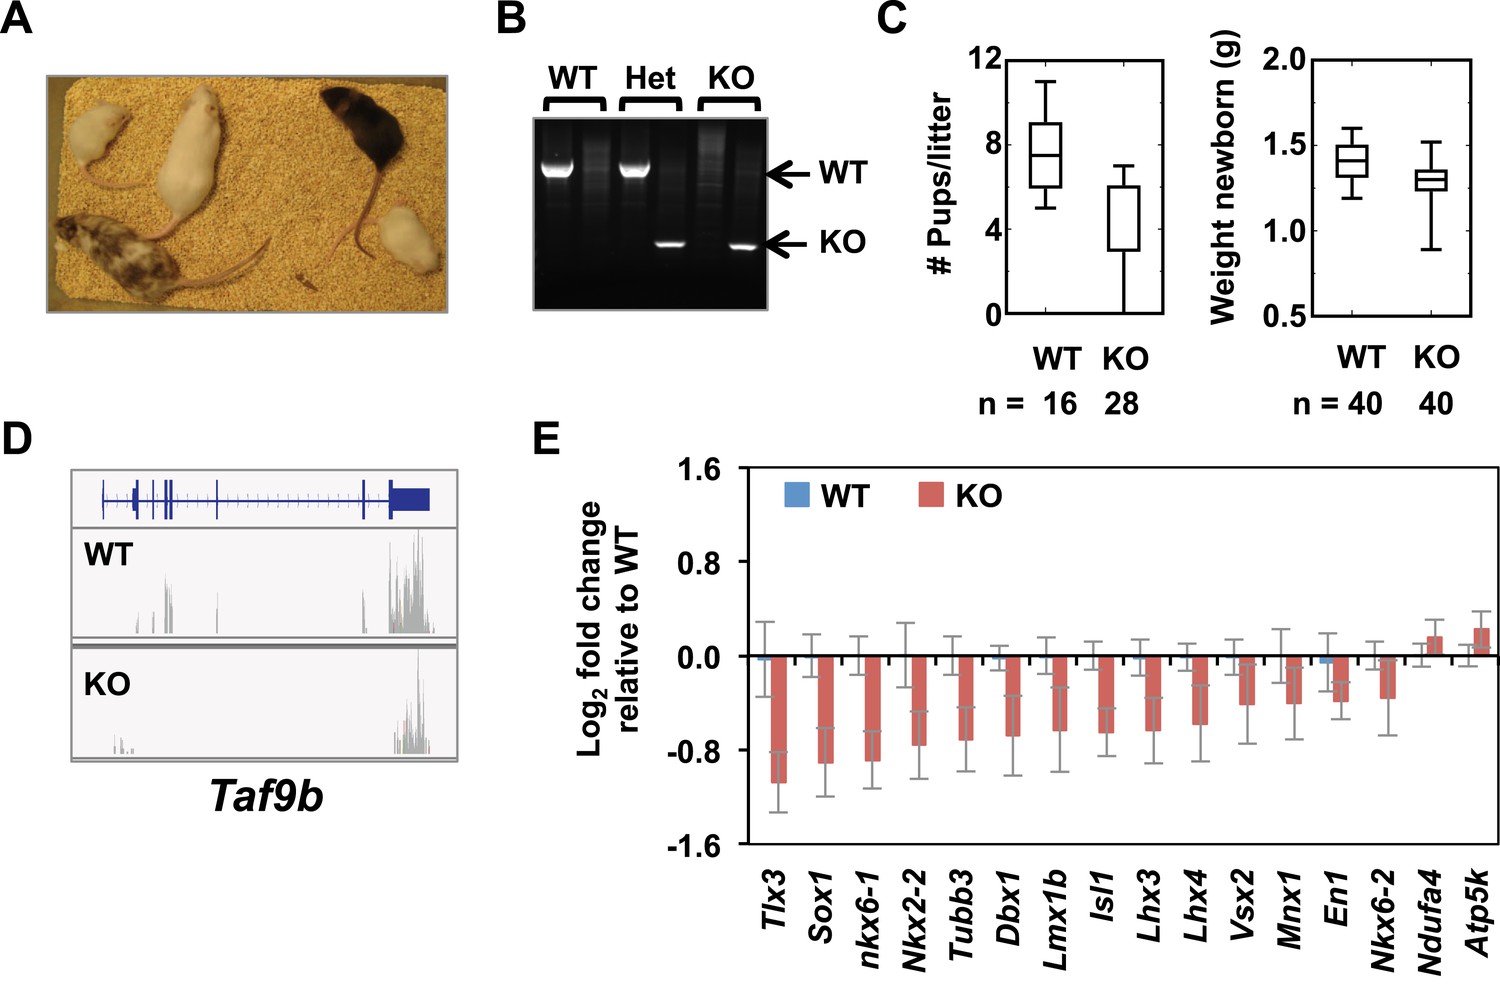
TAF9B controls neuronal gene expression in vivo.
(A) Taf9b KO ES cells were used to generate a Taf9b chimeric mouse which was subsequently mated with WT to test for germline transmission and obtain Taf9b heterozygous mice. (B) Representative PCR-based DNA genotyping of Taf9b KO mice. Primers are described in Supplementary file 3. (C) Number of pups and weight of newborn mice from WT × WT and KO × KO matings. (D) RNA-seq data of spinal cord sample for Taf9b locus in WT and Taf9b KO animals. (E) Gene expression analysis by qRT-PCR of lumbar spinal columns tissues of newborn mice. Graphs represent mean ± SEM of littermate comparisons (WT n = 6, KO n = 8).
Additional files
-
Supplementary file 1
GO Term annotation of RNA-seq and ChIP-seq results.
- https://doi.org/10.7554/eLife.02559.014
-
Supplementary file 2
Gene expression analysis of neuronal markers in Taf9b KO mouse.
- https://doi.org/10.7554/eLife.02559.015
-
Supplementary file 3
Sequences of oligonucleotides used in this study.
- https://doi.org/10.7554/eLife.02559.016
Download links
A two-part list of links to download the article, or parts of the article, in various formats.
Downloads (link to download the article as PDF)
Open citations (links to open the citations from this article in various online reference manager services)
Cite this article (links to download the citations from this article in formats compatible with various reference manager tools)
Core promoter factor TAF9B regulates neuronal gene expression
eLife 3:e02559.
https://doi.org/10.7554/eLife.02559


