Orbitofrontal neurons acquire responses to ‘valueless’ Pavlovian cues during unblocking
- National Institute on Drug Abuse, United States
- University of Pittsburg, United States
- University of Maryland School of Medicine, United States
- National Taiwan University, Taiwan
- Johns Hopkins University, United States
Figures
Figure 1 with 1 supplement
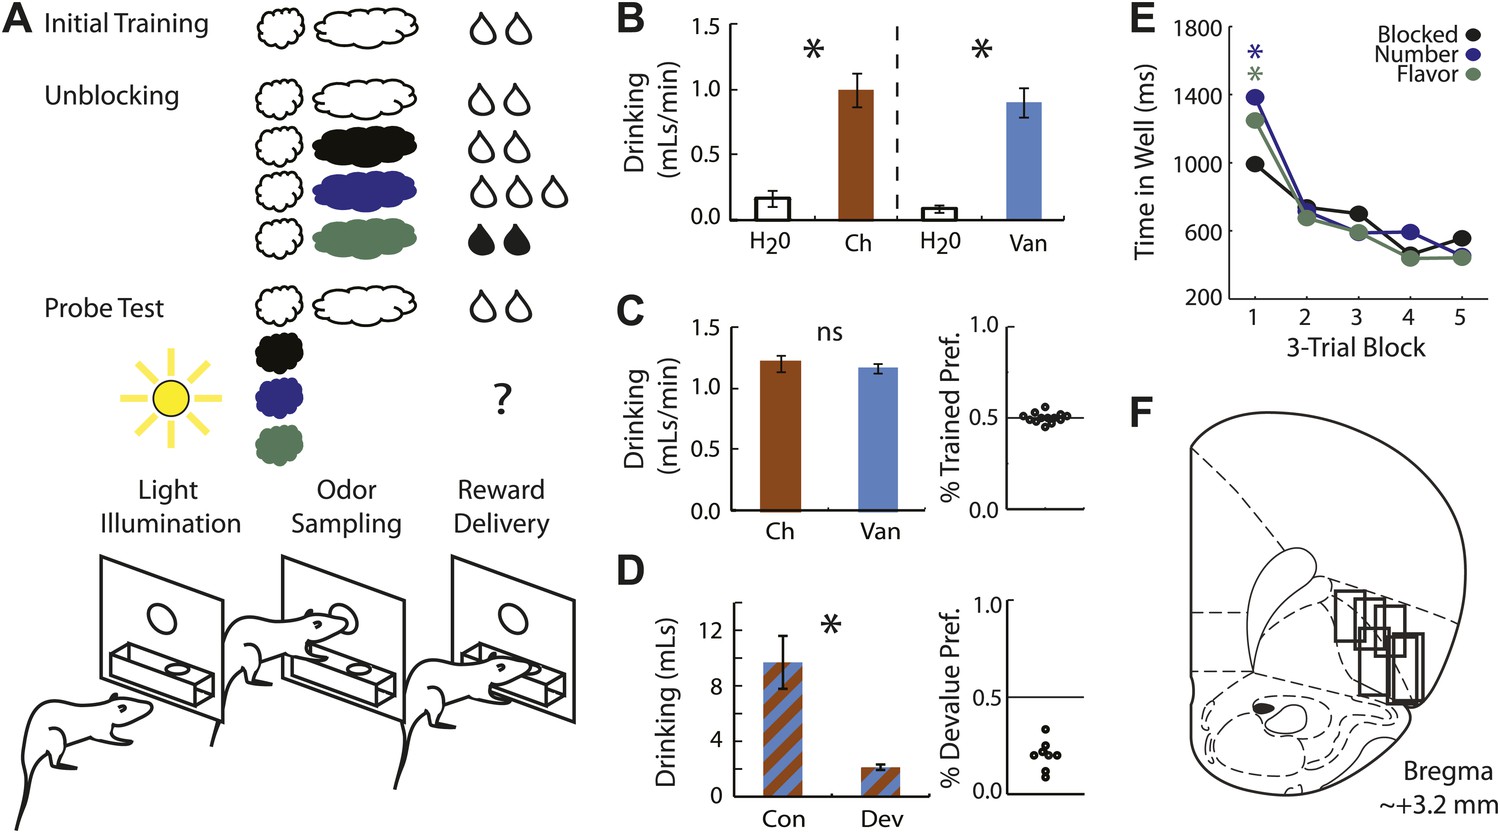
Experimental outline, behavior summary and recording sites.
(A) Thirsty rats were initially trained to enter an odor port following illumination of a house light and respond at reward well below for two drops of flavored milk. Unblocking sessions consisted of four trial types. The first was a reminder of initial training. On the remaining three trial types, the originally trained odor was briefly presented followed by 1 of 3 novel odors. The reward following the novel odors was either unchanged (black; blocked trials), increased in number (blue; number trials), or its flavor was altered (green; flavor trials). Learning was assessed in a probe test in which the novel odors were presented in isolation, without reward. (B) 10-min consumption testing between chocolate and water, and vanilla and water on non-training days found that both were significantly and equally preferred to water (ANOVA, F1,5 > 5, p's < 0.05). (C) 2-min preference testing between chocolate and vanilla immediately following unblocking sessions found no flavor preference (t test, p > 0.1). Scatter plot (right) shows preference for the trained flavor on each individual test (n = 13). (D) 20-min consumption testing from a separate group of rats (n = 8) that received selective devaluation of one of the flavors found a significant difference in consumption between the non-devalued (Con) and devalued (Dev) flavors (t test, p < 0.01). This was true for every rat tested (right). (E) Time in the reward well is plotted for the probe test trials. ANOVA for time spent in the reward well with odor (blocked, number and flavor) and trial (1-15) as factors found a significant odor x trial interaction (F1,47 = 3.45, p < 0.05). Planned comparisons confirmed that on the first three trials rats spent significantly more time in the reward well following number and flavor odors compared to blocked (p's < 0.05) but responding to number and flavor did not differ (p > 0.1). (F) Single unit activity was recorded from the lateral orbital and agranular insular cortices at roughly 3.2 mm anterior to bregma. *p < 0.05; ns = not significant.
Figure 1—figure supplement 1
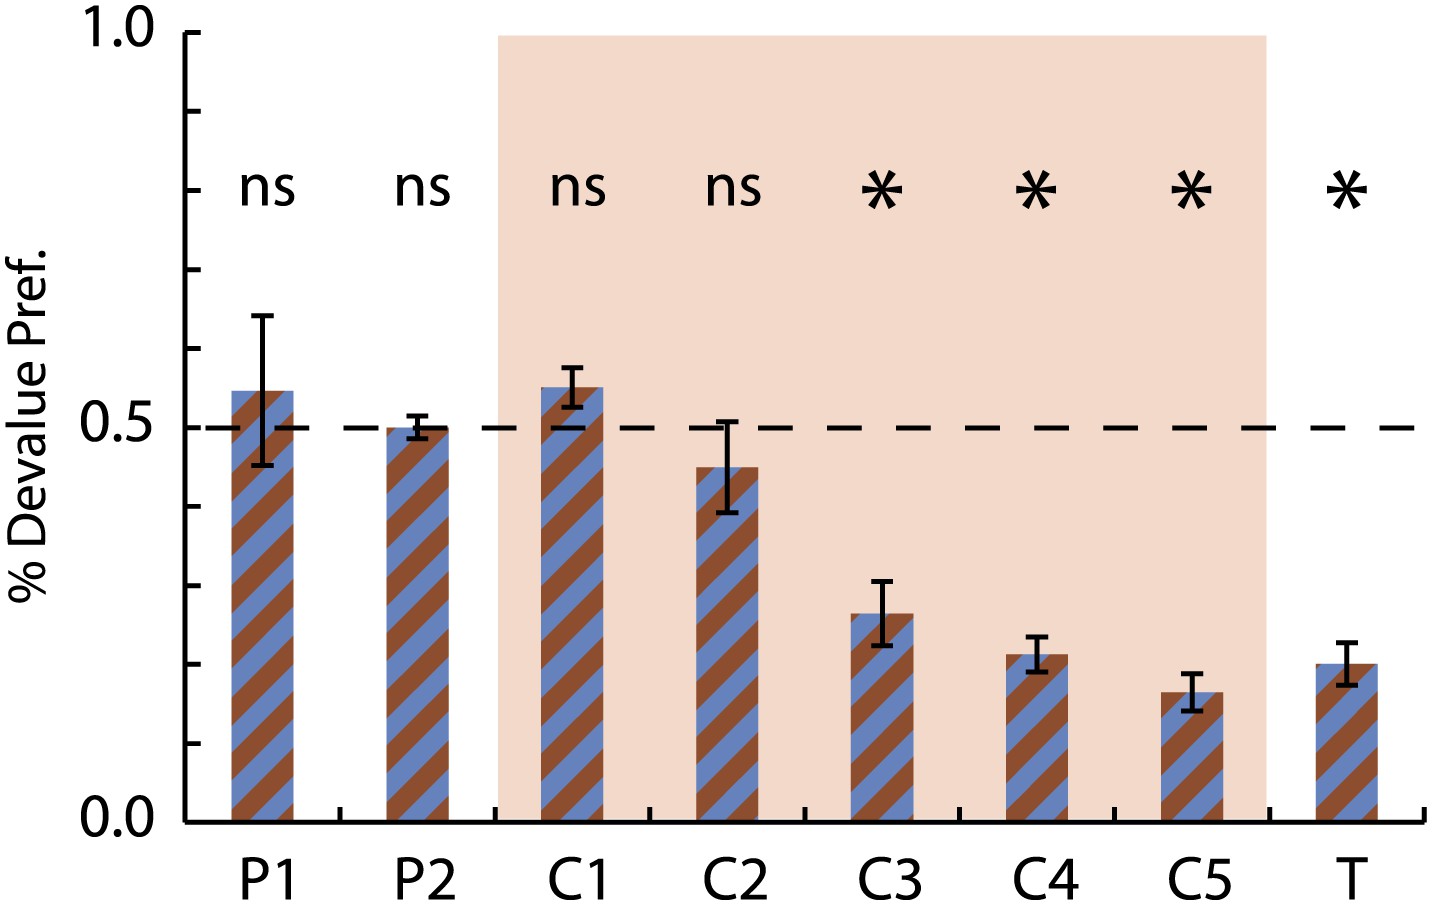
Selective conditioned flavor aversion preference data.
Preference for the devalued milk flavor (devalued)/(devalued +non-devalued) is shown for the 2 days of pre-exposure (P1-2), the 5 days of conditioning (C1-5, red background) and the final choice test (T). A value of 0.5 indicates equal preference while a value of 0.0 indicates an aversion to the devalued flavor. ANOVA for consumption over the 5 days of conditioning with session, flavor (choc vs van) and treatment (control vs devalue) found a significant session × treatment interaction (F4,28 = 10.91, p < 0.05) but no effect of or interaction with flavor. Asterisks indicate significance of a one-sample t test comparing % Devalue Preference to 0.5.
Figure 2 with 4 supplements

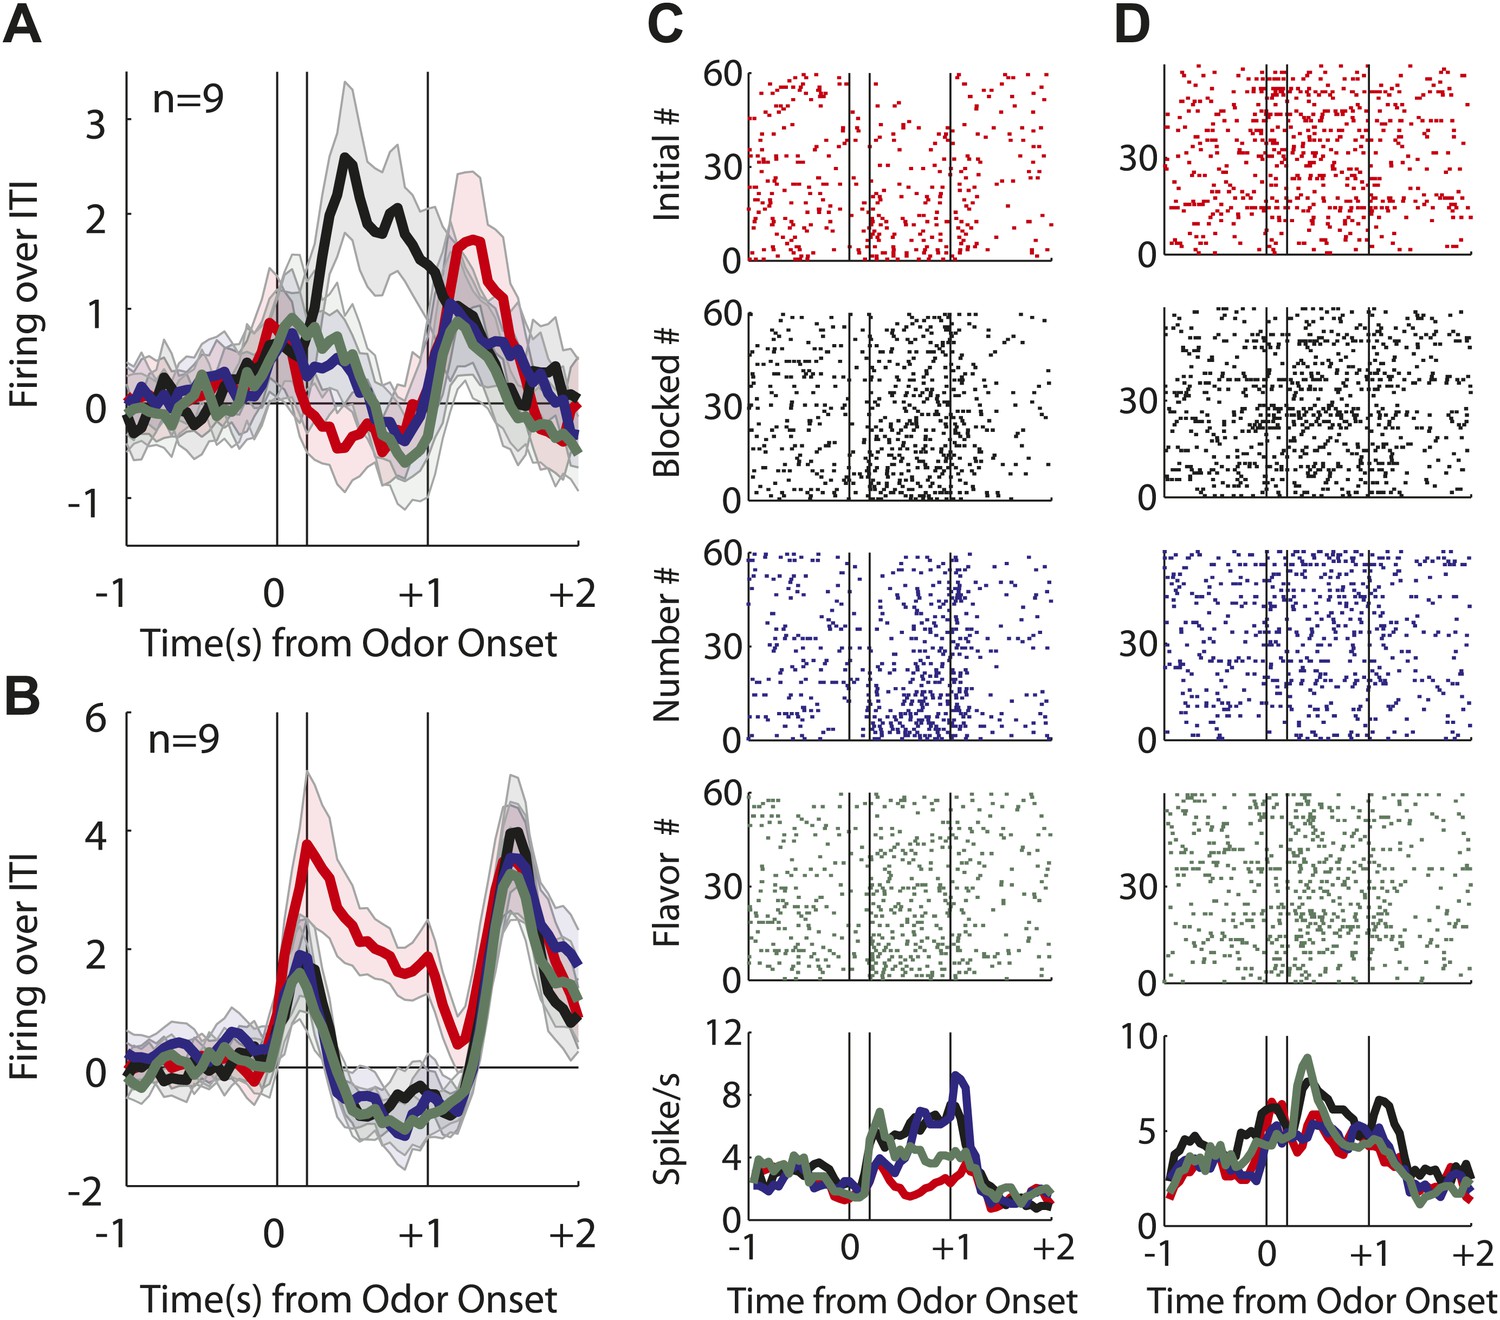
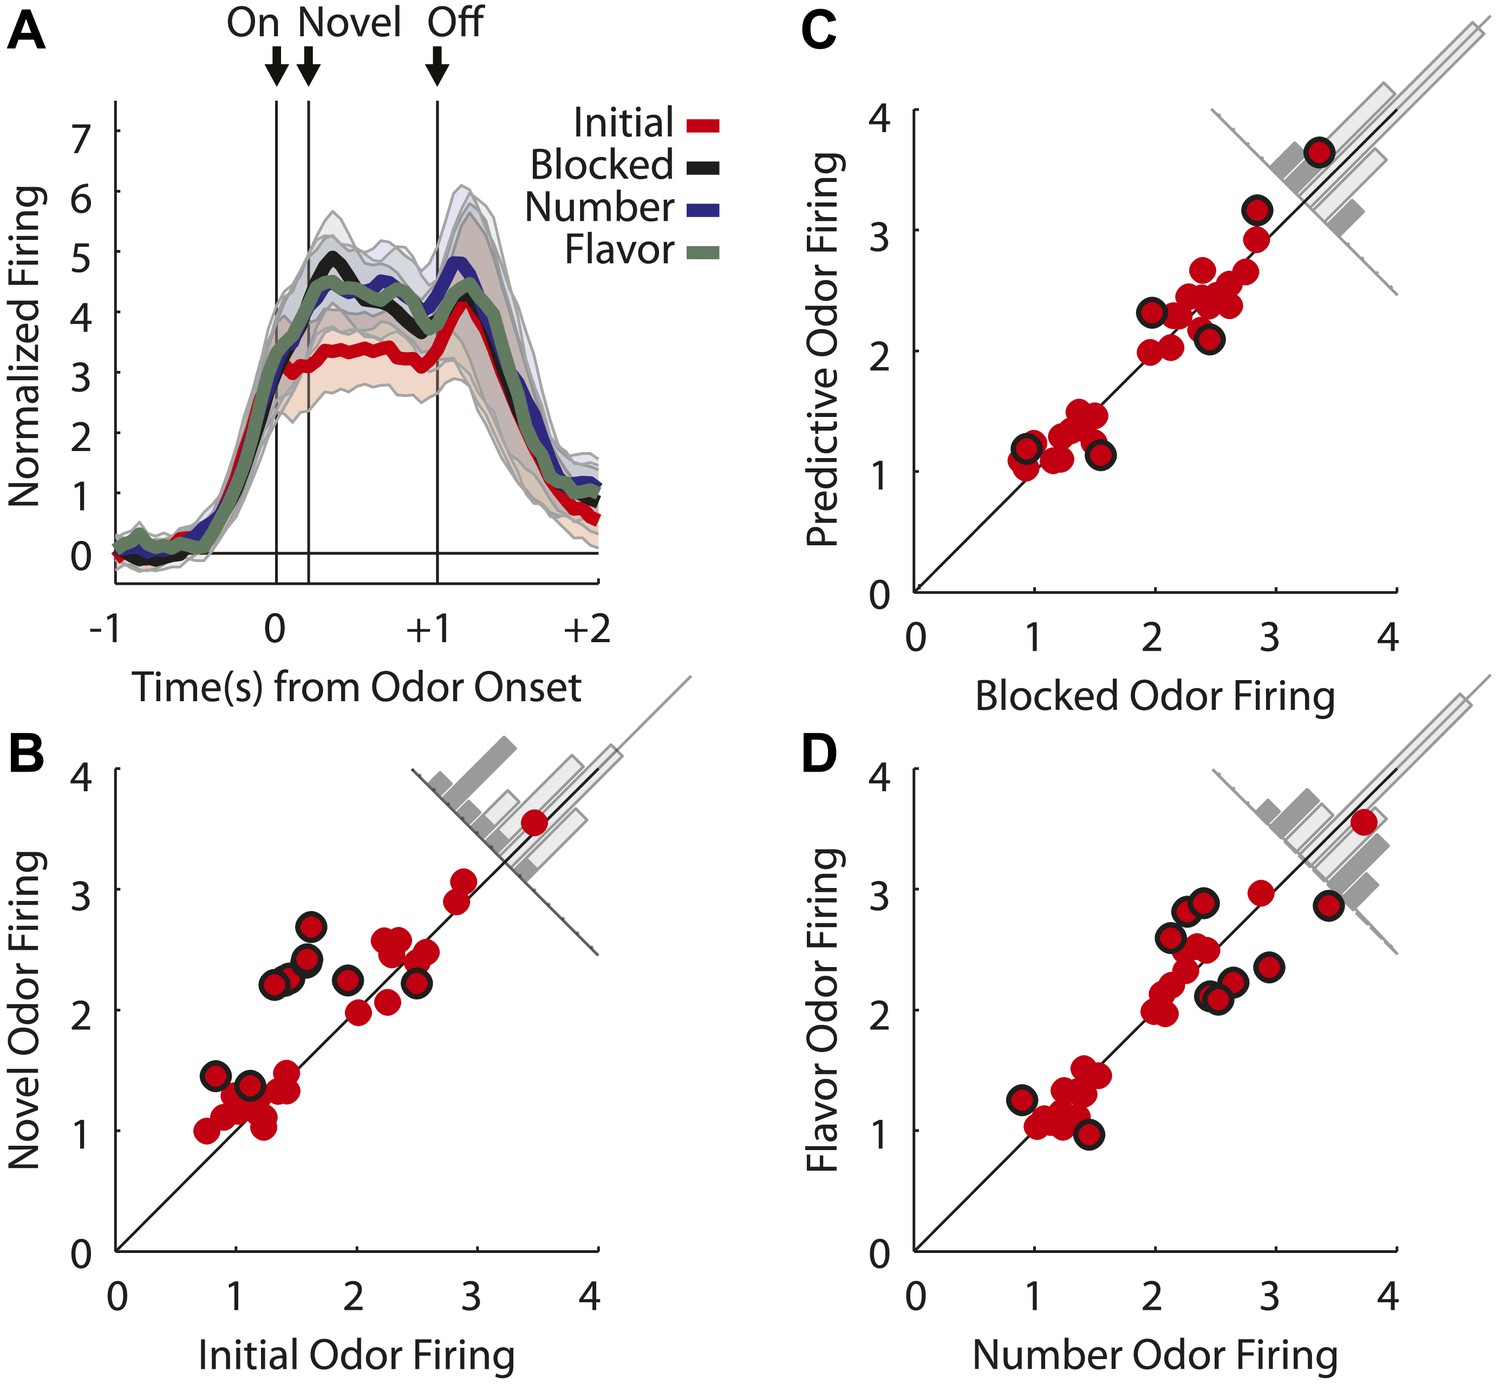
Single unit and population firing of putative salience neurons.
(A) Raster plots for firing of a single unit are shown for all initial (red), blocked (black), number (blue) and flavor trials (green). Odor on (On) is indicated by the first vertical line, onset of novel odor (Nov) by the second vertical line and odor offset (Off) by the third. Each tick represents a spike. Average activity across all trials for each odor is plotted (bottom). (B) Mean neural activity (novel odor epoch–ITI) for the putative salience neurons (n = 55) is plotted. Line color as indicated in raster plots; shaded areas indicate standard error of mean. ANOVA with bin and odor as factors found significant effects of bin, odor and the bin × odor interaction (F1,54 > 2.0, p's < 0.01). ANOVA restricted to the novel odor period with odor and time (first 500 ms vs second 500 ms, shown in upper right inset) as factors found only a main effect of odor (F1,54 = 13.0, p < 0.01). Significant firing to the novel odors over the initial odor was observed throughout the novel odor period. (C) A scatter plot of novel odor firing vs initial odor firing is shown for putative salience neurons (n = 55). A signed square root transformation of firing was used to best visualize population spread; all statistics were performed on non-transformed firing rates. Individual neurons showing significant differences in firing between the odors are outlined in black (t test, p < 0.05). A non-parametric sign test found significant, preferential firing to the novel odors (Z = 3.24, p < 0.01). The population bias towards novel odor firing is apparent in the bar histogram aligned to the diagonal axis; on which the difference score for each neuron is plotted. Light gray bars represent units showing no differential firing; dark gray bars represent units showing significant differential firing. (D) A scatter plot of predictive vs blocked odor firing is shown. A sign test found no differential firing to the predictive and blocked odors by the putative salience population (Z = 0.54, p > 0.1). (E) A scatter plot of flavor and number odor firing is shown. A sign test found no differential firing to the number and flavor odors (Z = 0.27, p > 0.1). (F) Differential firing to the novel odors vs the initial odor on the first 10 trials of the first unblocking day was calculated and plotted for the putative salience population (n = 31). Differential firing was calculated in a 300-ms sliding window for each 50-ms bin moving away from novel odor onset: (mean [(blocked odor–ITI) + (number odor–ITI) + (flavor odor–ITI)]–initial odor–ITI). The difference score for each bin was then plotted, with dark red bins indicating maximal differential firing to the novel odors and dark blue indicating the opposite pattern (y-axis shown on right of heat plot). (G) The significance of the increased firing to the novel odors was determined by performing a one-tailed t test, comparing increases in differential firing to 0, using a significance of p < 0.05 and a sliding window as in (F). Red bins indicate significant elevations in firing to the novel odors over the initial odor.
Figure 2—figure supplement 1
Odor-responsive units not included in primary analyses.
Of the 37 units not analyzed in the main text, (A) nine showed selective responding to the blocked odor and (B) nine showed selective responses to the initial odor. The remaining neurons showed responses to different combinations of odors. (C) Neuron fired maximally to the number and blocked odors, possibly signaling predicted reward flavor, independent of number. (D) Neuron fired maximally to the flavor and blocked odors, possibly signaling predicted reward number, independent of flavor. However, these patterns were rare and were not reflective of the odor-responsive population.
Figure 2—figure supplement 2
Firing of putative salience neurons on unblocking day 1.
An identical analysis of only day 1 salience neurons (n = 31) revealed nearly identical patterns as those reported when both day 1 and 2 neurons were analyzed. (A) ANOVA and subsequent post-hoc tests revealed identical significant results as in Figure 2B of the main text. (B) Sign test for novel vs initial odor firing differed slightly in it only approached significance (p = 0.07). (C and D) All other comparisons for salience neurons were identical to those reported in the main text.
Figure 2—figure supplement 3
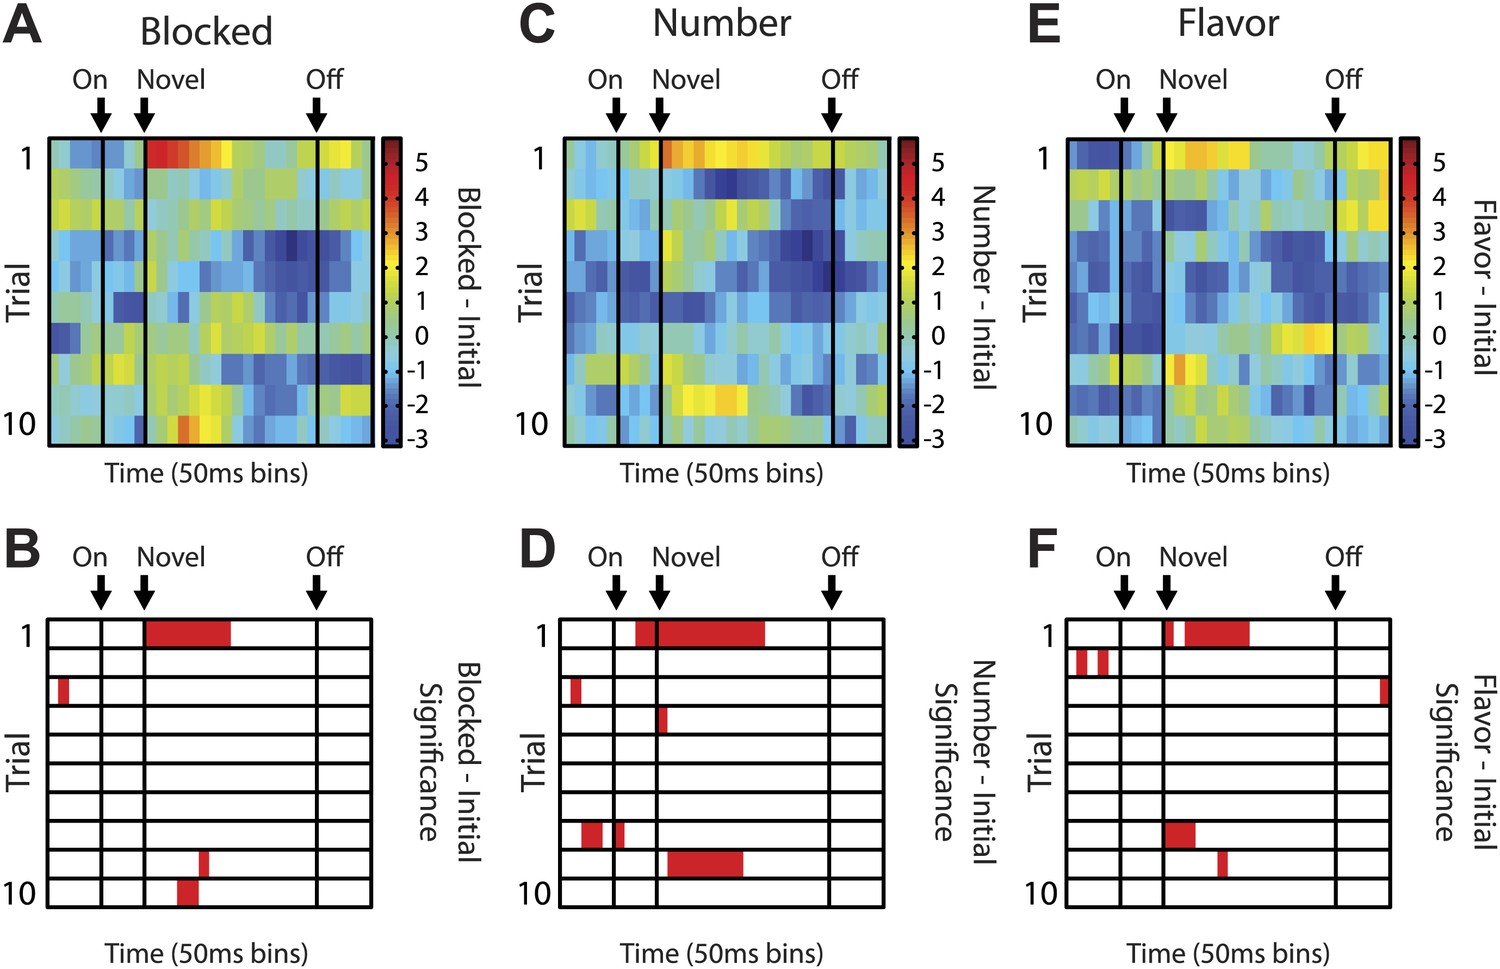
Heat plots for putative salience neurons for each novel odor.
Analyses identical to those performed in Figure 2F,G of the main text, in which mean firing to all three novel odors was analyzed, were performed for each individual novel, odor. Separate analyses of temporal firing to (A and B) blocked vs initial odor firing (C and D) number vs initial odor firing and (E and F) flavor vs initial odor firing revealed nearly identical patterns. Maximal responding is observed early on trial 1 and no or diminished responding is observed on subsequent trials.
Figure 2—figure supplement 4
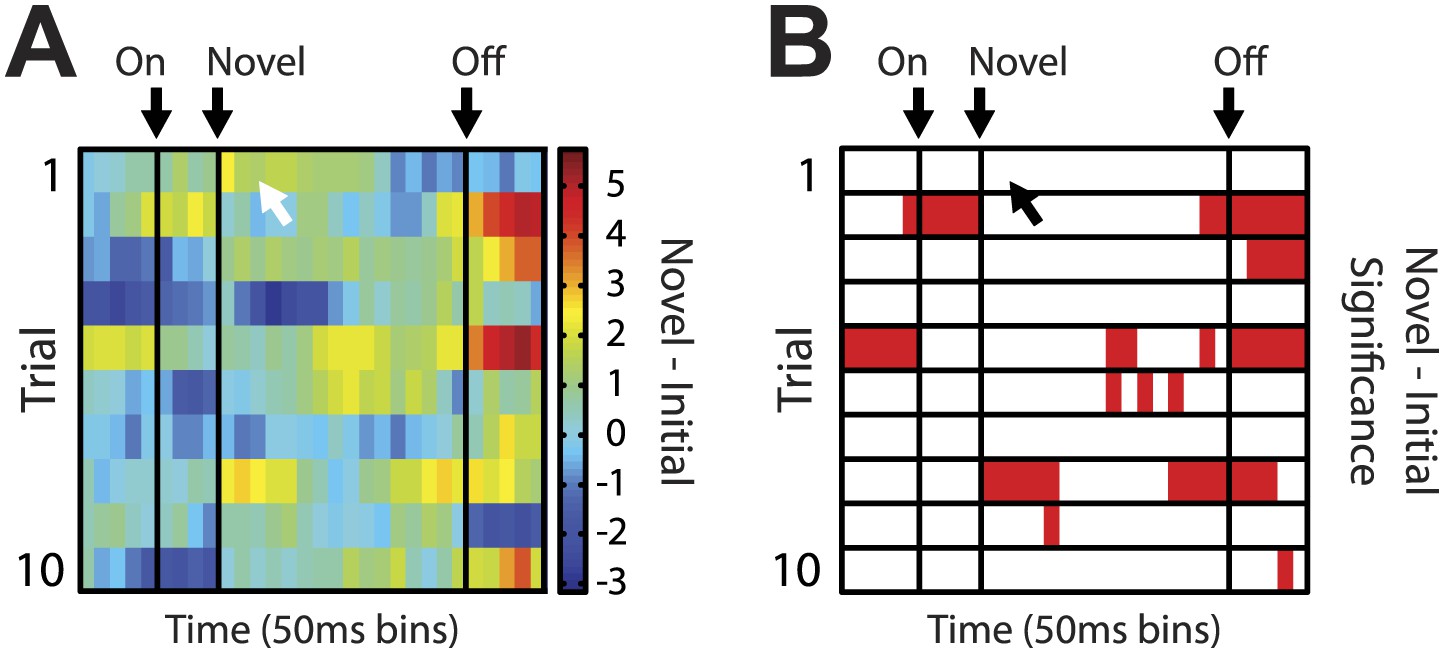
Heat plot for putative salience neurons on unblocking day 2.
Analyses identical to those in Figure 2F,G of the main text were performed for salience neurons on unblocking day 2. (A) Salience neurons on unblocking day 2 did not show the same temporal response to the first presentation of novel odors. The white arrow indicates where maximum response was observed in unblocking day 1 neurons. (B) This description is confirmed by statistical analysis which found no significant increase in firing on the first presentation of day 2; but did find significance later in the odor period on subsequent trials.
Figure 3 with 1 supplement
Single unit and population firing of putative predictive neurons.
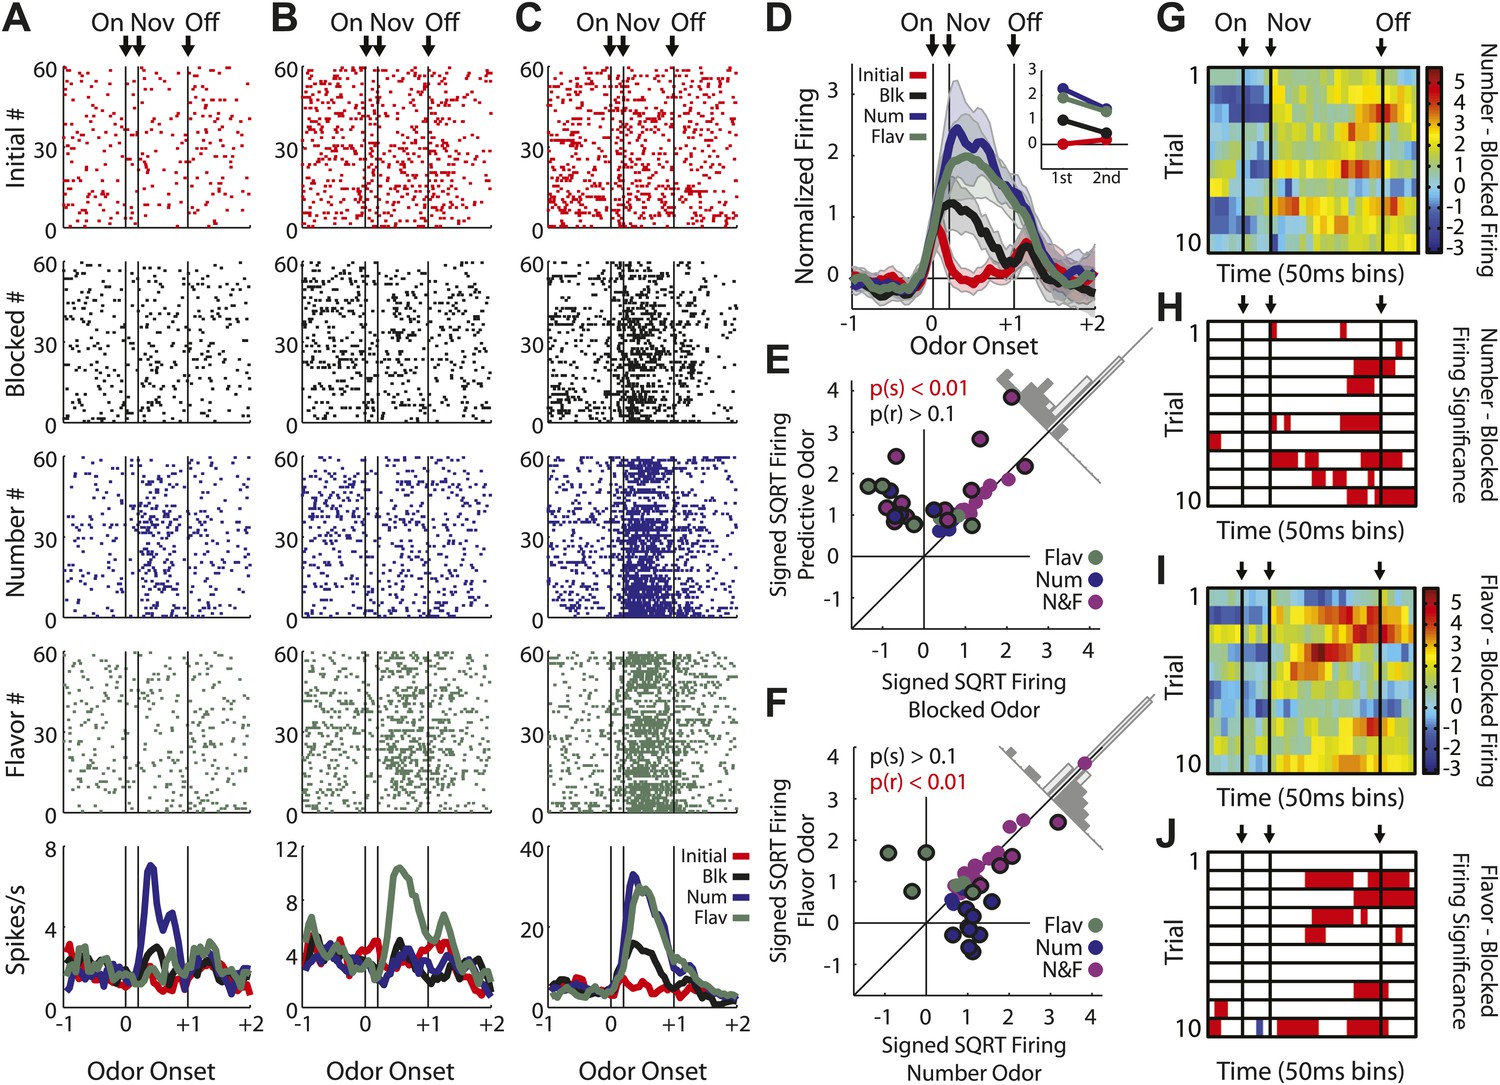
Single units plotted exactly as in Figure 2A showing (A) selective firing to the number odor (B) selective firing to the flavor odor (C) firing to both number and flavor odors. (D) Mean neural activity (novel odor epoch–ITI) for the putative predictive neurons (n = 43) is plotted. Meaning of line colors and shading is maintained. ANOVA with bin and odor as factors found significant effects of bin, odor and the bin × odor interaction (F1,42 > 2.0, p's < 0.01). ANOVA restricted to the novel odor period with odor and time (first 500 ms vs second 500 ms, shown in upper right inset) as factors found a main effect of odor (F1,42 = 58.5, p < 0.01) and an odor × time interaction (F1,42 = 3.9, p < 0.05). At both times firing to the predictive odors was significantly greater than the blocked and initial odors; blocked firing was greater than initial firing only in the first half. (E) A scatter plot comparing firing to the predictive odors (signed square-root transform) vs the blocked odor is shown for the predictive population (n = 43). Within this population there were three kinds of neurons based on firing vs ITI: number only (blue), flavor only (green) or flavor and number (purple). A sign test found significant, preferential firing to the predictive odors (Z = 4.88, p(s) < 0.01). Across all neurons there was zero correlation between predictive odor firing and blocked odor firing (R2 = −0.01, p(r) = 0.39). (F) A scatter plot comparing firing to the flavor and number odors is shown for the predictive population (n = 43). While some neurons did show differential firing (outlined in black) to either the number (n = 14) or flavor (n = 4) odor a sign test found no bias in firing to the number or flavor odor across the entire population. (Z = 0.60, p > 0.1). Across all neurons there was a highly significant, positive relationship between number and flavor odor firing (R2 = 0.88, p < 0.01). (G) Differential firing to the number odor vs the blocked odor on the first 10 trials of the first unblocking day was calculated and plotted for the number-responsive units within the predictive population (n = 21). This was done in as in (Figure 2F) except that the difference score was calculated as: (number odor–ITI)—(blocked odor–ITI). (H) Significance for increased firing to the number odor over the blocked odor was calculated as in (G). Red bins indicate significant elevations in firing to the number odor over the blocked odor. Blue bins would indicate significant decreases in firing to the number odor below the blocked odor. (I) Differential firing to the flavor odor vs blocked odor on the first 10 trials of the first unblocking day was calculated and plotted for flavor-responsive units within the predictive population (n = 18) as was done in (G). (J) Significance of differential firing calculated and displayed as in (H).
Figure 3—figure supplement 1
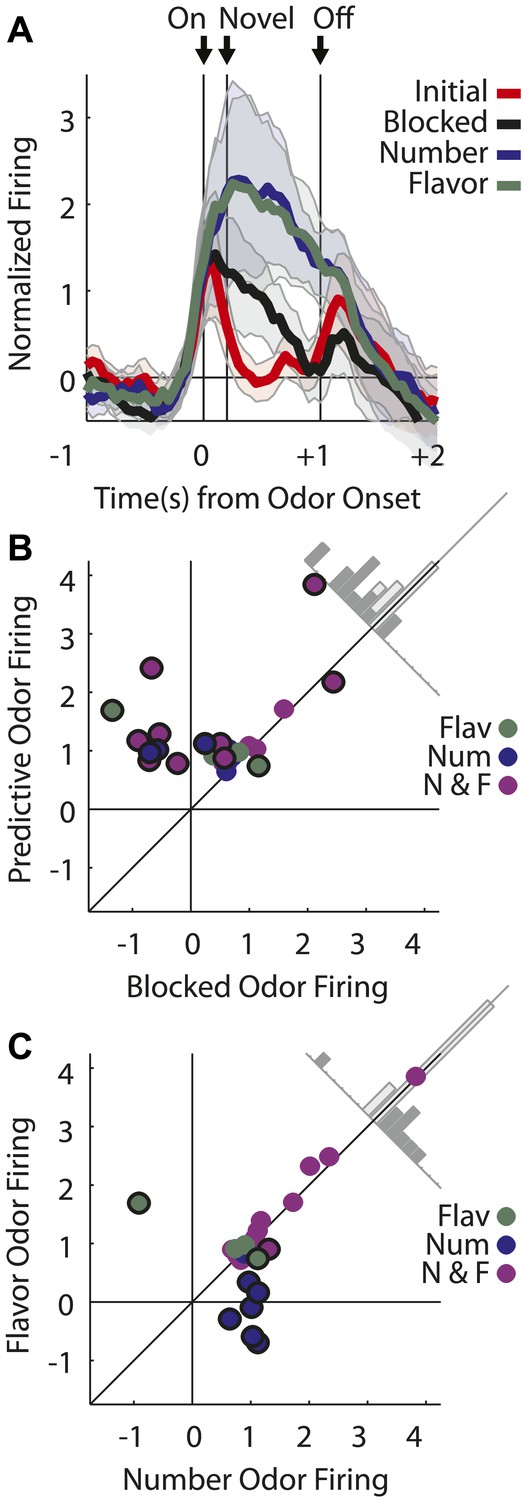
Firing of putative predictive neurons on unblocking day 1.
An identical analysis of only day 1 predictive neurons revealed identical patterns as those reported when both day 1 and 2 neurons were analyzed. (A) ANOVA, and subsequent post-hoc tests, revealed identical significant results as those reported in Figure 3D. (B) Sign test comparing predictive odor firing to blocked odor firing revealed a significant bias towards the predictive odors (p < 0.05). (C) Sign test comparing flavor and number odor firing found no population bias towards either odor (p > 0.1).
Figure 4

Outcome selectivity of predictive neurons.
(A) For each predictive neuron that significantly increased firing to the flavor odor (total n = 31; flavor-only n = 6 [green]; number and flavor n = 24 [purple]) we plotted its selective firing to the flavor odor (x-axis; [normalized flavor odor firing – mean(normalized initial odor firing, normalized blocked odor firing, normalized number odor firing)]) against its selective firing to the flavor outcome (y-axis; [normalized flavor outcome firing – mean(normalized initial outcome firing, normalized blocked outcome firing, normalized number outcome firing)]). Comparison of odor firing of single neurons to the population found a single outlier (neuron firing was 3 stdev > population firing). The outlier was omitted from this analysis. There was a significant, positive relationship such that greater selective firing to the flavor odor was associated with greater selective firing the flavor outcome (R2 = 0.41, p < 0.01). (B) This relationship was restricted to the flavor outcome; plotting selective flavor odor firing against selective number outcome firing revealed zero correlation (R2 = 0.01, p = 0.70; calculation identical to A only mean(blocked, initial and flavor outcome firing) was subtracted from number outcome firing. (C) For each predictive neuron that significantly increased firing to the number odor (total n = 37; number only n = 12 [blue]; number and flavor n = 23 [purple]) we plotted it's selective firing to the number odor (x-axis; [normalized number odor firing – mean(normalized initial odor firing, normalized blocked odor firing, normalized flavor odor firing)]) against its selective firing to the number outcome (y-axis; [normalized number outcome firing – mean(normalized initial outcome firing, normalized blocked outcome firing, normalized flavor outcome firing)]). Two neurons showed selective odor firing 3 stdev above the population mean and were excluded from analysis. There was a significant, positive relationship such that greater selective firing to the number odor was associated with greater selective firing the number outcome (R2 = 0.27, p < 0.01). (D) This relationship was restricted to the number outcome; plotting selective number odor firing against selective flavor outcome firing revealed zero correlation (R2 = 0.04, p = 0.26) calculation identical to C only mean(blocked, initial and number outcome firing) was subtracted from flavor outcome firing. Finally, these statistical patterns were maintained if the flavor-only and number-only neurons were analyzed in isolation: (A) R2 = 0.71, p = 0.03, (B) R2 = 0.01, p = 0.82, (C) R2 = 0.48, p = 0.01 and (D) R2 = 0.18, p = 0.17. Flav = flavor, Num = number, N&F = number and flavor.
Download links
A two-part list of links to download the article, or parts of the article, in various formats.
Downloads (link to download the article as PDF)
Open citations (links to open the citations from this article in various online reference manager services)
Cite this article (links to download the citations from this article in formats compatible with various reference manager tools)
Orbitofrontal neurons acquire responses to ‘valueless’ Pavlovian cues during unblocking
eLife 3:e02653.
https://doi.org/10.7554/eLife.02653


