Loss of the multifunctional RNA-binding protein RBM47 as a source of selectable metastatic traits in breast cancer
- Memorial Sloan-Kettering Cancer Center, United States
- University of Cambridge, United Kingdom
- The Rockefeller University, United States
- Howard Hughes Medical Institute, The Rockefeller University, United States
- Howard Hughes Medical Institute, Memorial Sloan-Kettering Cancer Center, United States
Figures
Figure 1 with 1 supplement
RBM47 expression associated with breast cancer progression.
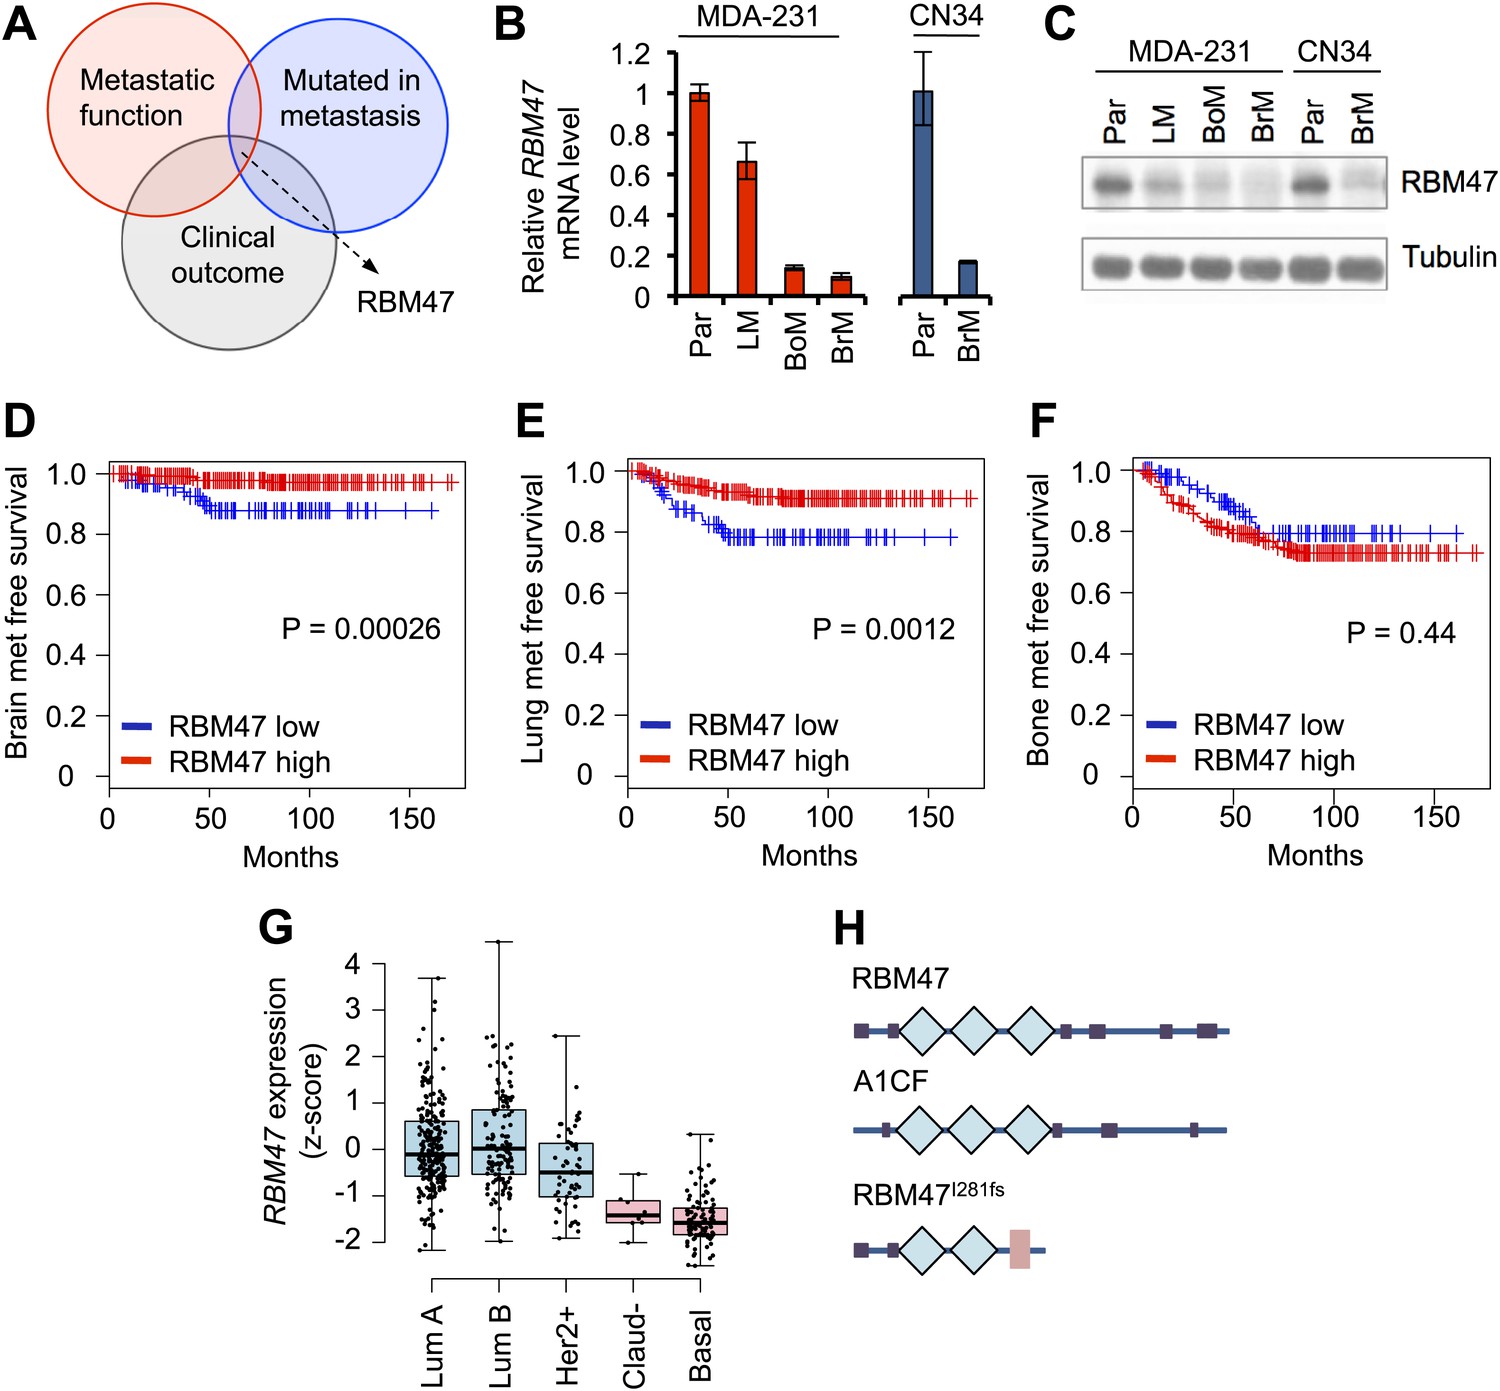
(A) A schematic of the analytical approach. Genes identified as mutated in a breast cancer brain metastasis by Ding et al. (2010) where compared to metastasis-associated gene expression traits in both clinical data sets and experimental model systems. This identified RBM47 as a putative breast cancer suppressor gene. (B) RBM47 mRNA expression measured by quantitative real-time RT-PCR in two cell line systems of breast cancer metastasis. In both panels, the data are normalized to the parental cell line (Par). Error bars represent 95% confidence intervals obtained from multiple PCR reactions. LM, lung metastatic derivative; BoM, bone metastatic derivative; BrM, brain metastatic derivative. (C) RBM47 protein expression measured by Western blotting. Samples as in (B). Tubulin used as a loading control. (D) Brain metastasis free survival in a cohort of 368 untreated breast cancer patients. Cases classified based on RBM47 mRNA expression, bottom 1/3 in blue, top 2/3 in red. p-value derived from a Cox proportional hazards model using RBM47 expression as a continuous variable. (E) Lung metastasis free survival in a cohort of 368 untreated breast cancer patients. Cases classified based on RBM47 mRNA expression, bottom 1/3 in blue, top 2/3 in red. p-value derived from a Cox proportional hazards model using RBM47 expression as a continuous variable. (F) Bone metastasis free survival in a cohort of 368 untreated breast cancer patients. Cases classified based on RBM47 mRNA expression, bottom 1/3 in blue, top 2/3 in red. p-value derived from a Cox proportional hazards model using RBM47 expression as a continuous variable.(G) RBM47 expression as measured by RNA-seq in the TCGA data set of 748 patients. Samples grouped based on breast cancer molecular subtype: luminal A, luminal B, Her2 positive, claudin low and basal. RBM47 expression is lower in claudin low and basal subtypes, both of which are associated with poor patient outcome. (H) A schematic showing the predicted protein structure of RBM47, its closest homologue A1CF, a known RNA-binding protein, and the predicted structure of RBM47I281fs mutant. Blue diamonds represent RRM motifs, pink rectangle represents a truncated RRM motif.
Figure 1—figure supplement 1
RBM47 expression and genetic alterations in human breast cancer.
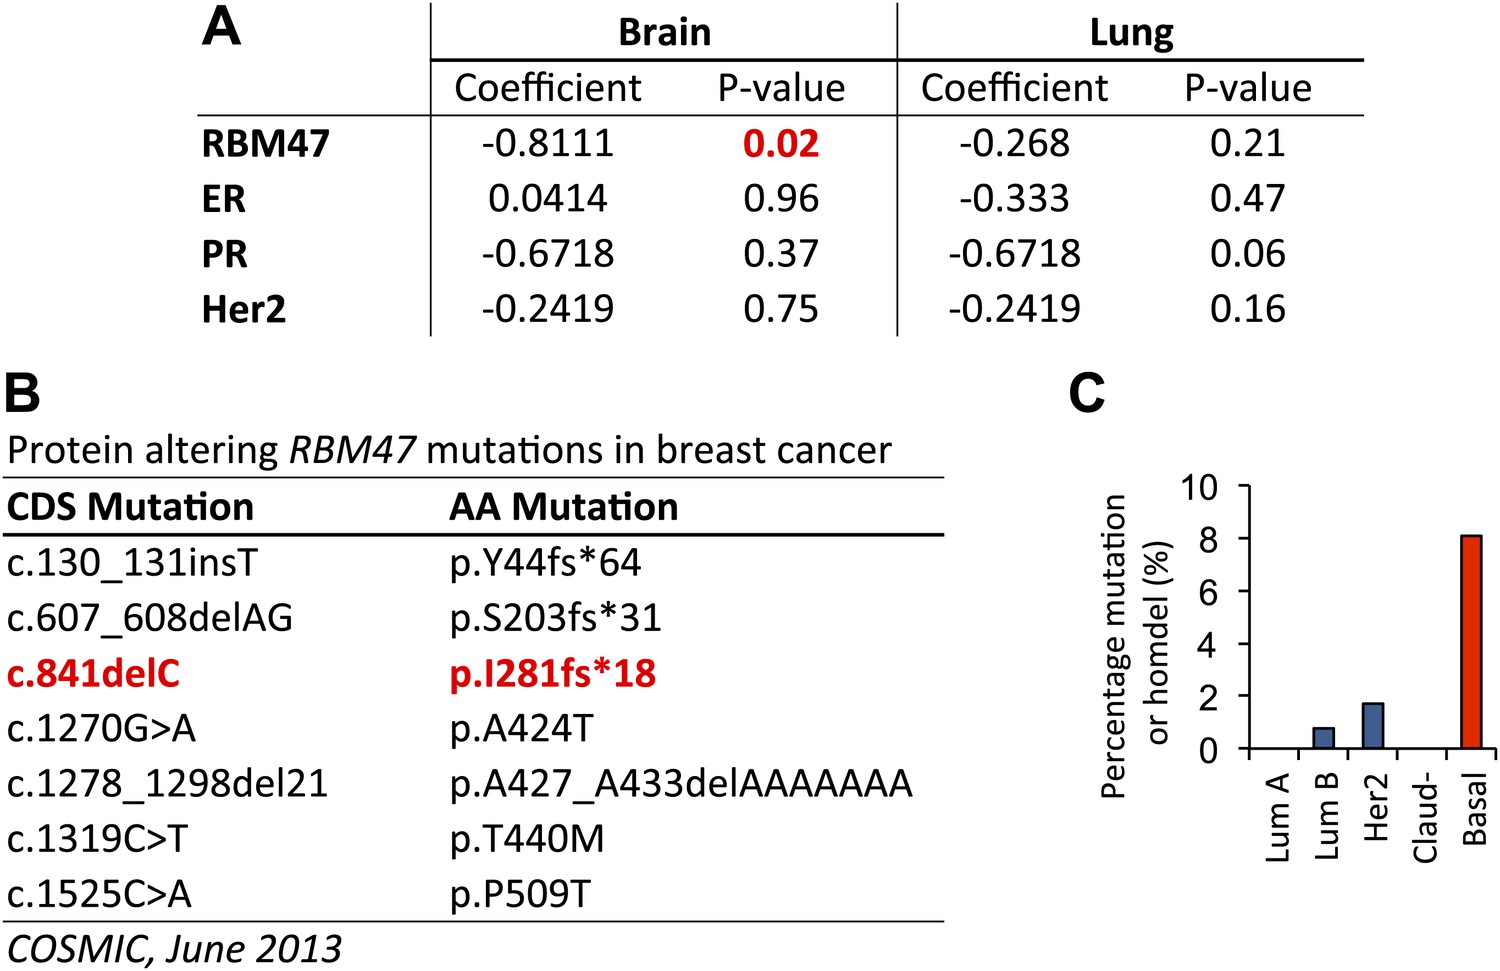
(A) Multivariate Cox proportional hazards models for both brain and lung metastasis free survival in a cohort of 368 untreated breast cancer patients. The model incorporates RBM47 expression as a continuous variable, estrogen receptor (ER) expression, progesterone receptor (PR) expression and Her2 expression. (B) A list of protein-altering RBM47 breast cancer mutations in the Catalogue of Somatic Mutations in Cancer database (COSMIC, http://cancer.sanger.ac.uk/cancergenome/projects/cosmic/) as of June 2013. (C) Percentage of genetic alterations, non-synonymous mutations or homozygous deletions, in RBM47 in the TCGA cohort of 748 breast cancers classified based on molecular subtypes: luminal A, luminal B, Her2 positive, claudin low and basal. A significant enrichment is observed in the basal subtype (p=0.00015, Fisher's exact test).
Figure 2 with 1 supplement
RBM47 suppresses metastatic breast cancer progression.
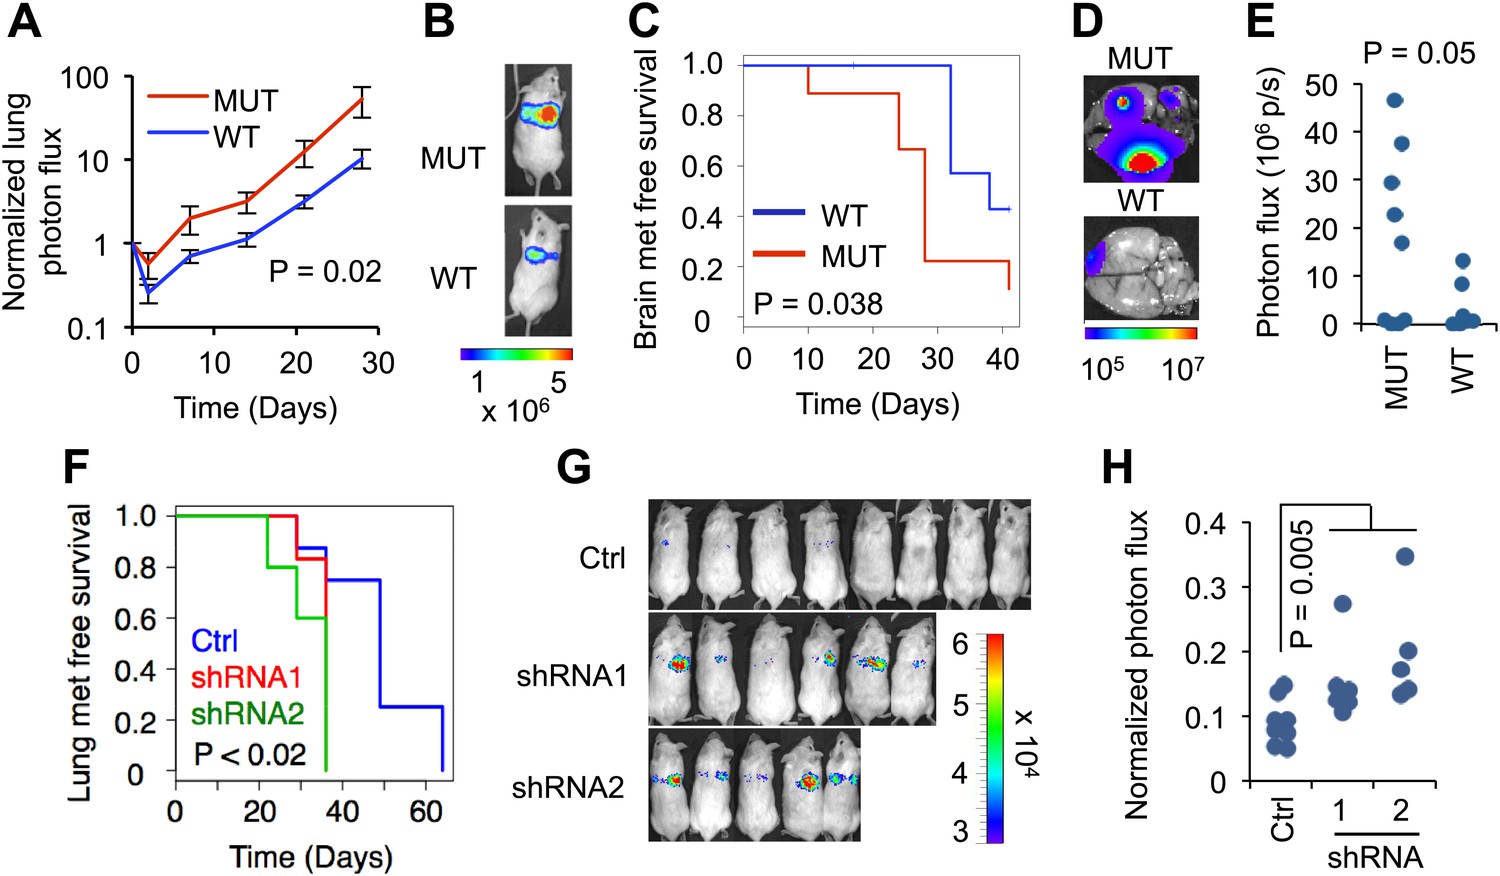
(A) Normalized lung photon flux in mice after tail vein inoculation of MDA231-LM2 cells expressing either wild type RBM47 or RBM47I281fs. p-value calculated utilizing repeated measures two-way ANOVA. N = 6 for RBM47I281fs, N = 8 for RBM47. (B) Representative bioluminescence images from the experiment shown in (A). The color scale shows bioluminescence (photons/second). (C) Brain metastasis free survival as determined by in vivo bioluminescence imaging in mice after intracardiac inoculation of MDA231-BrM2 cells expressing either wild type RBM47 or RBM47I281fs. p-value calculated using the log-rank test. N = 9 for RBM47I281fs, N = 7 for RBM47. (D) Representative bioluminescence images from the experiment shown in (C). The color scale shows bioluminescence (photons/second). (E) Ex vivo quantification of bioluminescence from brain metastases on day 42 of the experiment shown in panel (C). P-value calculated by two-tailed Student's t test. (F) Lung metastasis free survival as determined by in vivo bioluminescence imaging in mice after tail vein inoculation of parental MDA231 cells expressing either control vector (pGIPZ) or hairpins against RBM47 (shRNA1 and shRNA2). p-values calculated using the log-rank test. N = 8 for Ctrl group, N = 6 for shRNA1, N = 5 for shRNA2. (G) In vivo bioluminescence imaging on day 36 of the experiment shown in (F) demonstrates earlier emergence of detectable lung metastasis for the RBM47 knockdown groups when compared to the control animals. The color scale shows bioluminescence (photons/second). (H) Quantification of bioluminescence for the time point shown in (G). Data normalized to signal on day 0 for each animal. p-value calculated using the Wilcoxon rank-sum test.
Figure 2—figure supplement 1
RBM47 suppresses breast cancer progression.
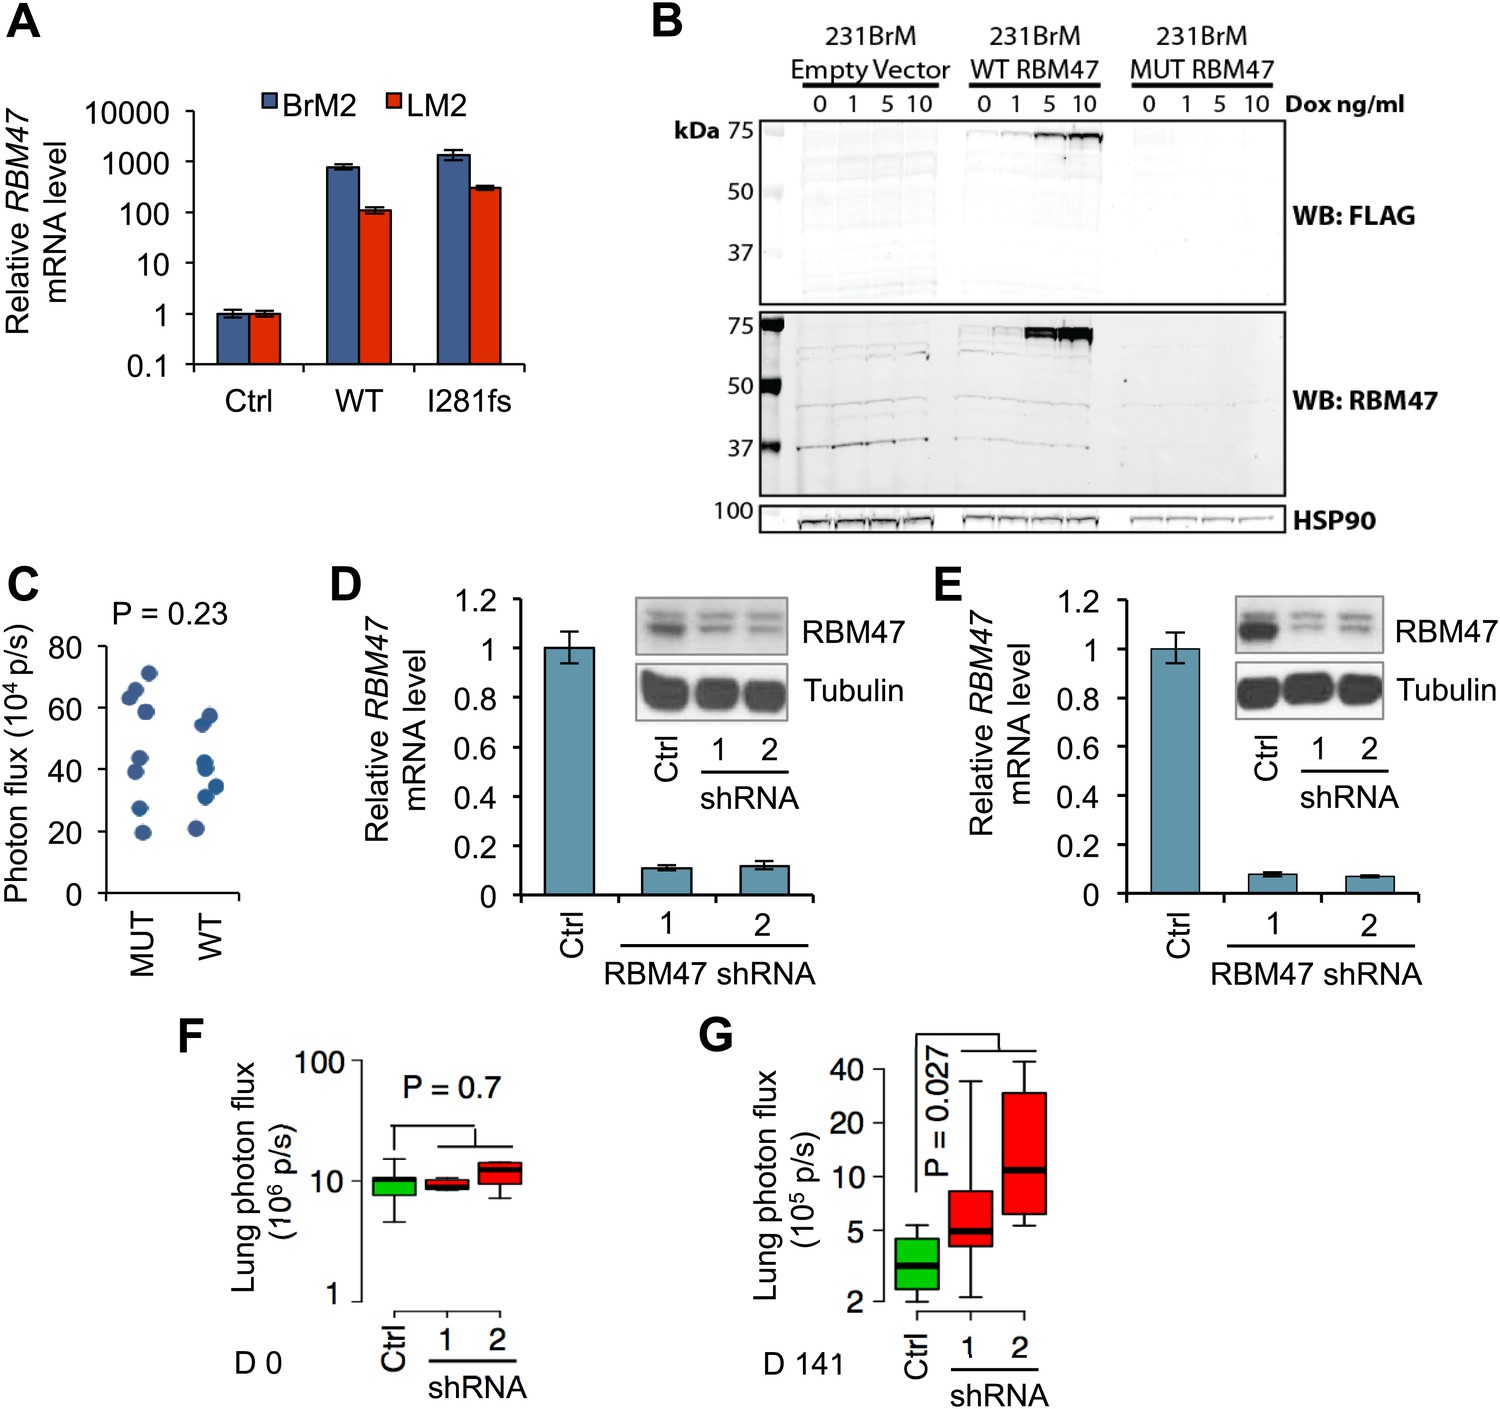
(A) RBM47 mRNA expression measured by quantitative real-time RT-PCR in 231-BrM2 and 231-LM2 cells transduced with either wild type RBM47 or RBM47I280fs-expressing cDNA constructs, respectively. The data are normalized to the untransduced control cell lines. Error bars represent 95% confidence intervals obtained from multiple PCR reactions. (B) Flag-RBM47 protein expression determined by Western blotting in non-clonal 231BrM2 tet-on Flag-RBM47 cells. No RBM47 or Flag protein is detected in the cells expressing Flag-RBM47I281fs (predicted size 34 kDa) treated with the same doxycycline doses. (C) Quantification of bioluminescence from the head of mice on day 0 of the experiment shown in Figure 2C. p-value calculated by two-tailed Student's t test. (D) RBM47 mRNA and protein expression measured by quantitative real-time RT-PCR and Western blotting, respectively, in parental MDA-231 cells expressing either control vector (pGIPZ) or hairpins against RBM47 (shRNA1 and shRNA2). Error bars represent 95% confidence intervals obtained from multiple PCR reactions. Tubulin used as a protein loading control. (E) RBM47 mRNA and protein expression measured by quantitative real-time RT-PCR and Western blotting, respectively, in parental CN34 cells expressing either control vector (pGIPZ) or hairpins against RBM47 (shRNA1 and shRNA2). Error bars represent 95% confidence intervals obtained from multiple PCR reactions. Tubulin used as a protein loading control. (F) Quantification of lung metastatic burden on day 0 by in vivo bioluminescence imaging in mice after tail vein inoculation of parental CN34 cells expressing either control vector (pGIPZ) or hairpins against RBM47 (shRNA1 and shRNA2). p-values calculated using two-sided Student's t test. N = 5 for all groups. (G) Quantification of lung metastatic burden on day 141 by in vivo bioluminescence imaging in mice after tail vein inoculation of parental CN34 cells expressing either control vector (pGIPZ) or hairpins against RBM47 (shRNA1 and shRNA2). p-values calculated using two-sided Student's t test. N = 4 for Ctrl group, N = 5 for shRNA1, N = 4 for shRNA2.
Figure 3 with 2 supplements

Clonal heterogeneity in RBM47 sensitivity.
(A) A lung metastatic nodule with strong RBM47 expression in a mouse inoculated with RBM47-transduced MDA231-LM2 cells. RBM47 protein expression detected by immunohistochemistry using an antibody against RBM47. (B) A lung metastatic nodule with weak RBM47 expression in a mouse inoculated with RBM47-transduced MDA231-LM2 cells. RBM47 protein expression detected by immunohistochemistry. Note the clearly reduced staining when compared to panel (A). (C) A lung metastatic nodule with weak RBM47 expression in a mouse inoculated with RBM47I280fs-transduced MDA231-LM2 cells. RBM47 protein expression detected by immunohistochemistry. Staining intensity similar to that seen in panel (B). (D) RBM47 expression in normal mouse lung. RBM47 protein expression detected by immunohistochemistry. Note small cells with strong RBM47 expression, similar to those seen in panels (B) and (C). (E) Brain metastasis free survival as determined by in vivo bioluminescence imaging in mice after intracardiac inoculation of WT10 cells. The RBM47 group received doxycycline in diet. p-value calculated using the log-rank test. N = 9 for both groups. (F) Representative ex vivo bioluminescence images from brain metastasis of the experiment shown in (E). The color scale shows bioluminescence (photons/second). (G) Ex vivo quantification of bioluminescence from brain metastases with and without RBM47 reintroduction. WT10 data from the experiment shown in (E). WT6 data from a similar experimental setup. p-value calculated by two-tailed Student's t test. N = 9 for Ctrl group, N = 10 for RBM47 group. (H) Brain metastasis free survival as determined by in vivo bioluminescence imaging in mice after intracardiac inoculation of MUT3 cells. The I281fs group received doxycycline in diet. p-value calculated using the log-rank test. N = 9 for Ctrl group, N = 7 for RBM47I281fs group. (I) Representative ex vivo bioluminescence images from brain metastases of the experiment shown in (H). The color scale shows bioluminescence (photons/second). (J) Ex vivo quantification of bioluminescence from brain metastases of the experiment shown in (H). p-value calculated by two-tailed Student's t test.
Figure 3—figure supplement 1
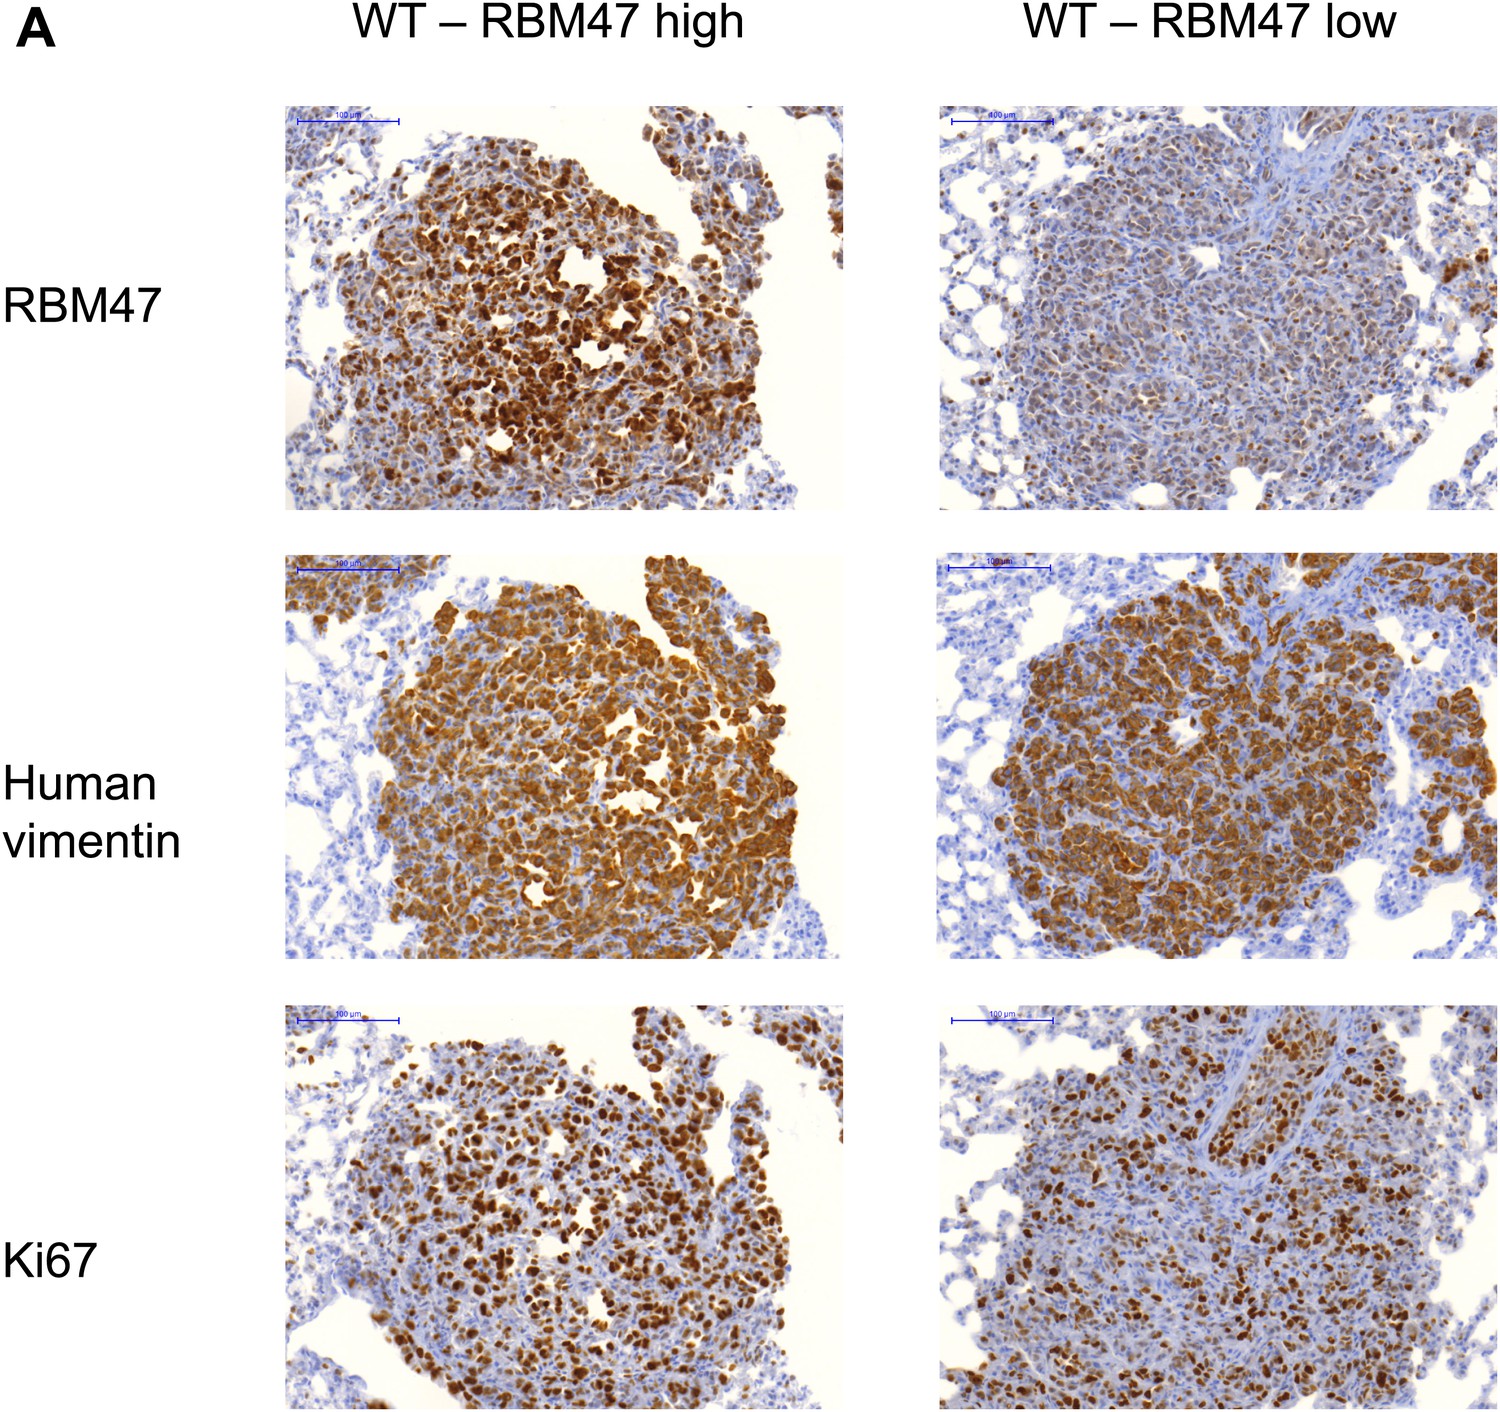
RBM47 expression in experimental metastases.
(A) Examples of lung metastatic nodules in a mouse inoculated with RBM47-transduced 231-LM2 cells. Some metastases have strong expression of RBM47 (left), whereas others show only weak RBM47 expression (right). Staining against human vimentin and Ki67 is shown for the same lesions.
Figure 3—figure supplement 2
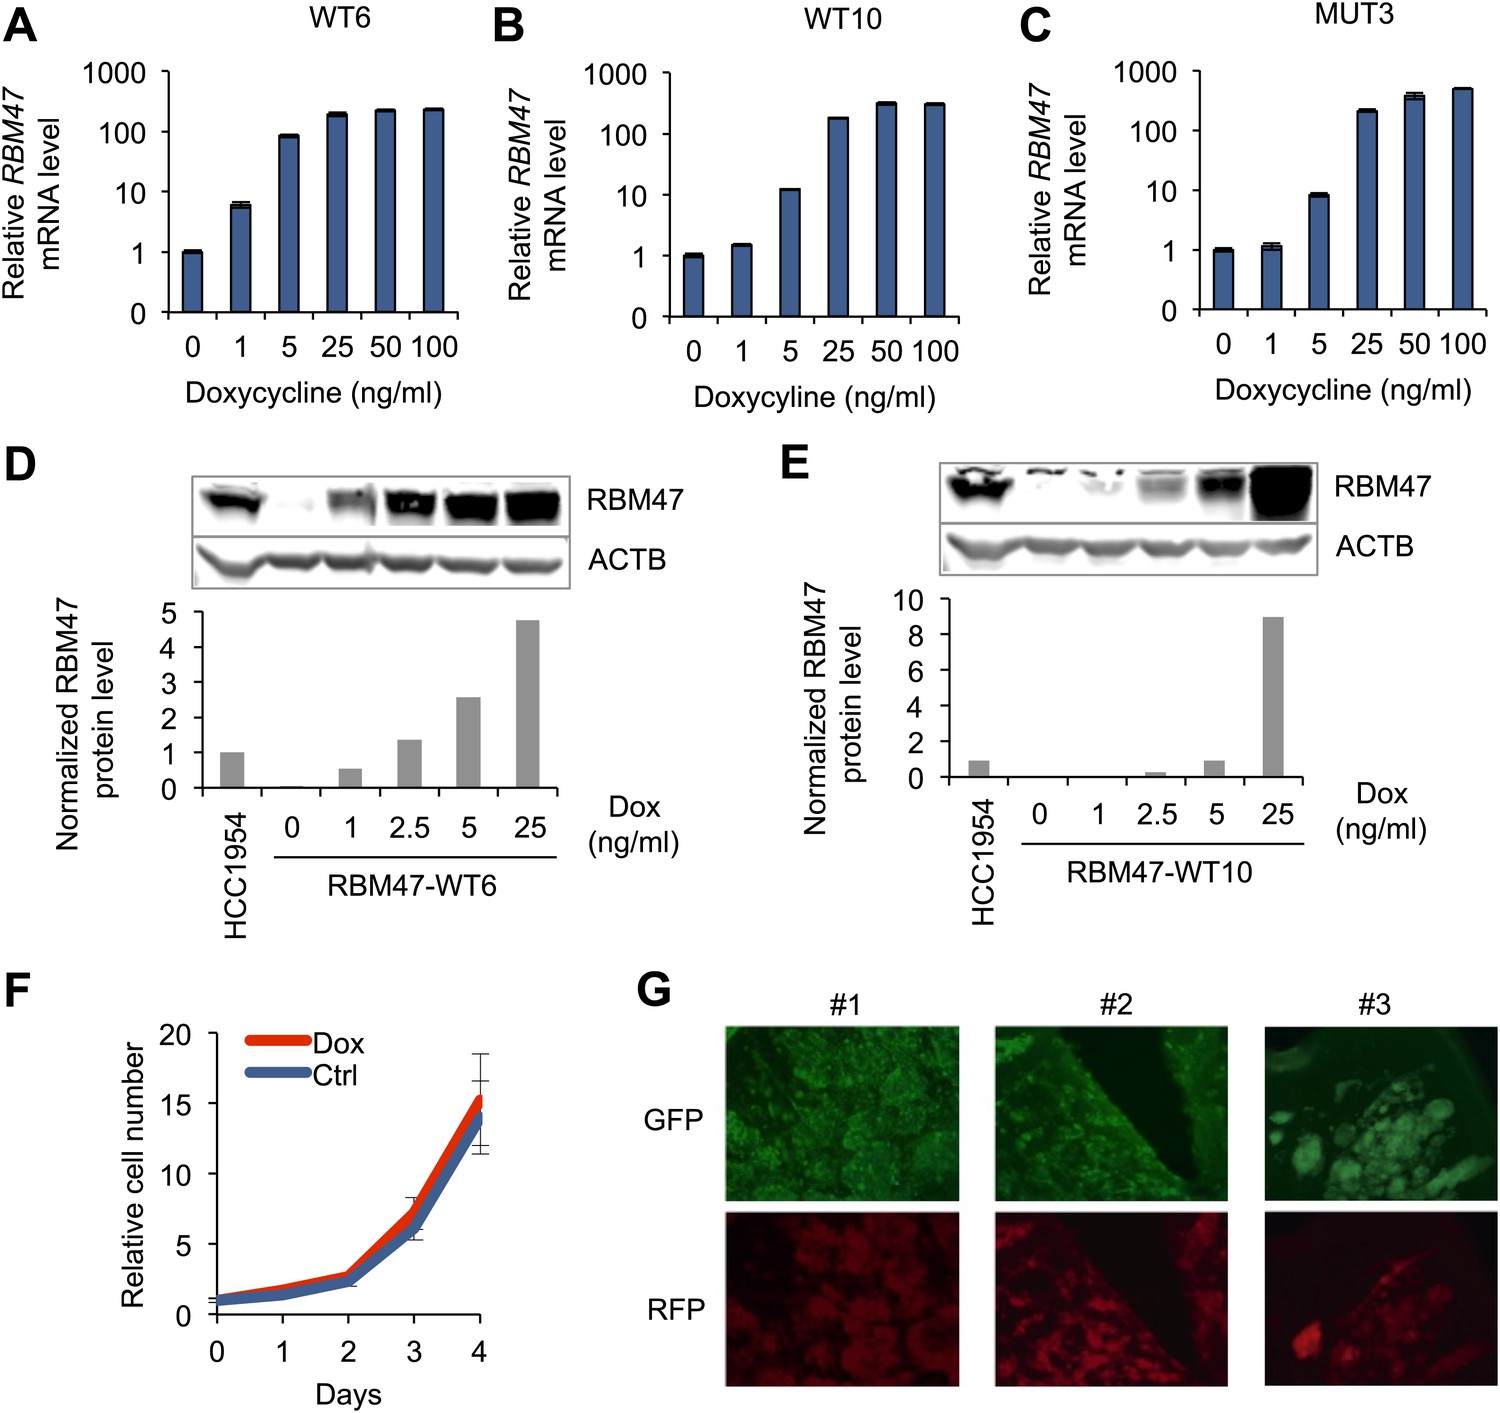
Model systems with inducible RBM47 expression.
(A) RBM47 mRNA expression measured by quantitative real-time RT-PCR in WT6 cells treated with increasing concentrations of doxycycline. Error bars represent 95% confidence intervals obtained from multiple PCR reactions. (B) RBM47 mRNA expression measured by quantitative real-time RT-PCR in WT10 cells treated with increasing concentrations of doxycycline. Error bars represent 95% confidence intervals obtained from multiple PCR reactions. (C) RBM47 mRNA expression measured by quantitative real-time RT-PCR in MUT3 cells treated with increasing concentrations of doxycycline. Error bars represent 95% confidence intervals obtained from multiple PCR reactions. (D) RBM47 protein expression detected by Western blotting in WT6 cells treated with increasing concentrations of doxycycline. ACTB used as a loading control. Quantification of signal shown in the lower panel, normalized to both ACTB loading control and the level of endogenous RBM47 detected in HCC1954 cells. (E) RBM47 protein expression detected by Western blotting in WT10 cells treated with increasing concentrations of doxycycline. ACTB used as a loading control. Quantification of signal shown in the lower panel, normalized to both ACTB loading control and the level of endogenous RBM47 detected in HCC1954 cells. (F) Proliferation of WT6 cells assessed under standard tissue culture conditions with and without doxycycline (2.5 ng/ml). (G) Demonstration of doxycycline-inducible gene induction in brain metastatic lesions formed by 231-BrM2 cells transduced with an inducible RFP construct. Cancer cells express constitutively GFP. Doxycycline treatment started on day 14 after intracardiac cancer cell inoculation. Doxycycline-inducible RFP expression can be seen in cancer cells.
Figure 4
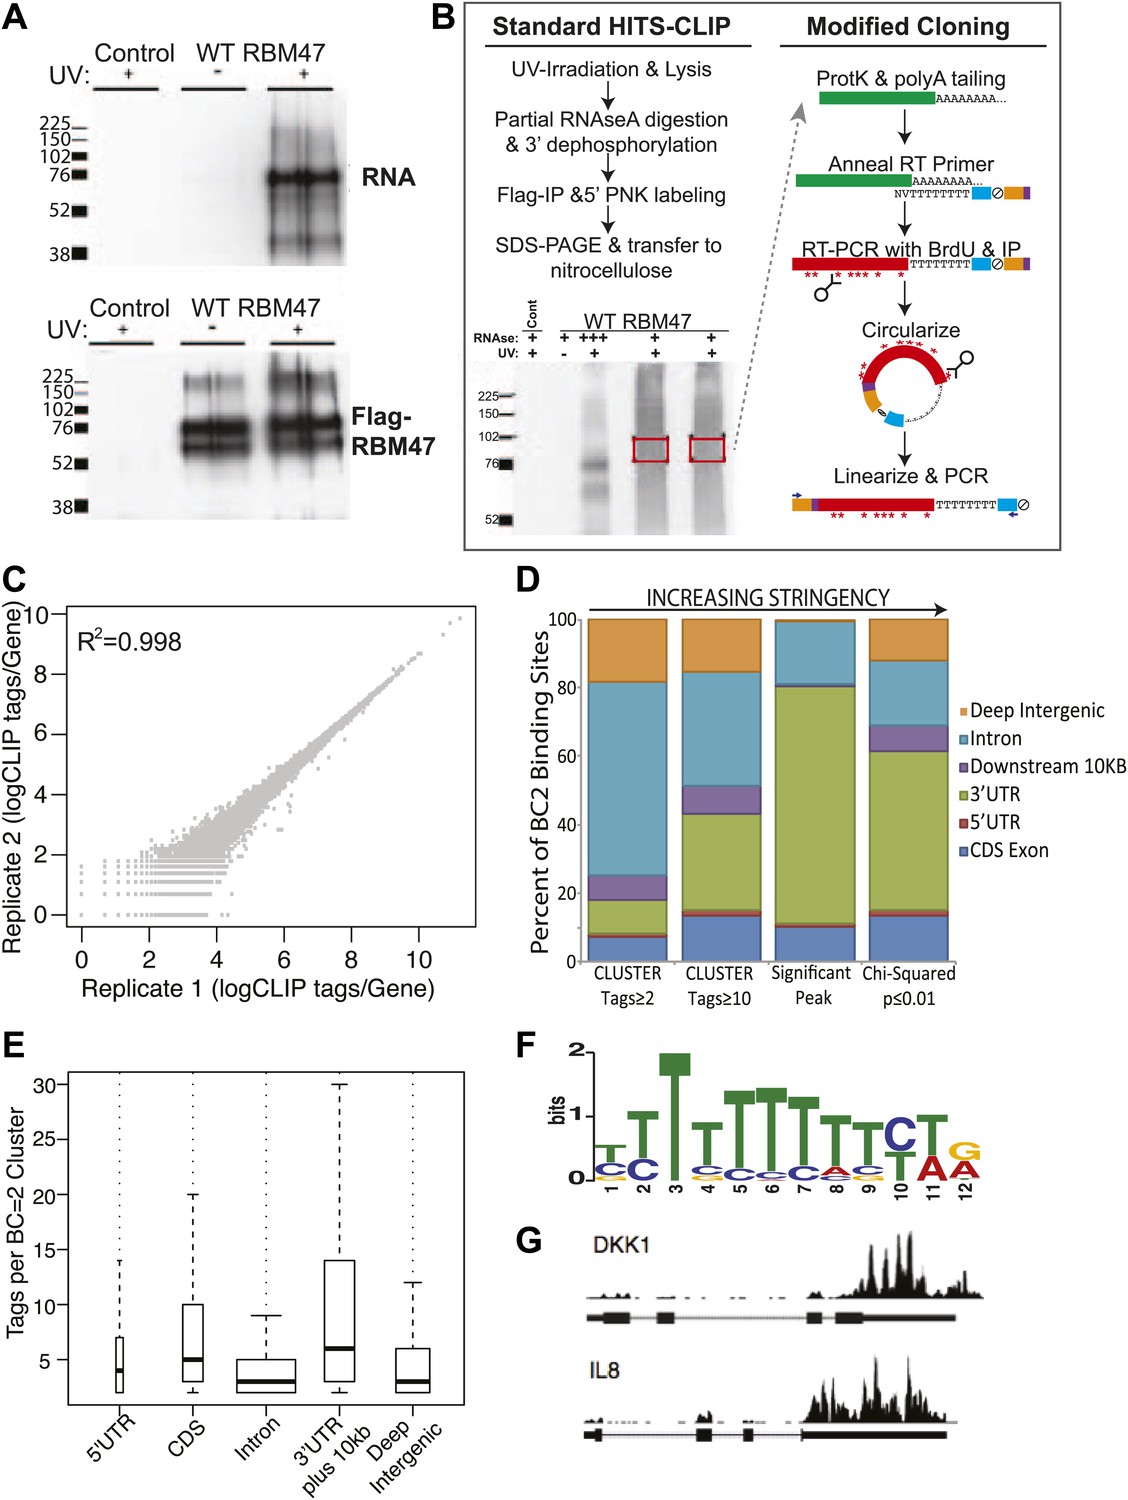
HITS-CLIP identifies genome-wide RBM47 binding maps.
(A) Radiolabelled RNA is detectable in RBM47-expressing 231-BrM2 metastatic cells that have been UV-irradiated indicating in vivo RNA binding ability. No RNA is detected in non-crosslinked cells despite the presence of ample immunoprecipitated Flag-RBM47 protein. No RNA or protein is detected in control 231-BrM2 transduced with empty vector. Samples run in duplicate. (B) Schematic of the modified HITS-CLIP protocol showing autoradiogram of duplicate Flag-RBM47 samples used. Purified RBM47-bound RNA fragments (green) were polyA tailed and reverse transcribed in the presence of Brd-U using a polydT-NV primer encoding the full sense sequence of the Illumina reverse sequencing primer (blue), an abasic furan that serves as an ApeI cut site (ξ), a partial reverse complement to the Illumina forward sequencing primer (orange), and two hexamer sequences (purple): a known-sequence index for multiplexing and a degenerate barcode used to distinguish unique cDNA clones from PCR duplicates. cDNA were stringently purified, circularized and linearized using ApeI to bring the Illumina sequence into correct orientation with respect to the cloned fragment, and the samples PCR amplified and deep sequenced. (C) RBM47 HITS-CLIP is highly reproducible between replicate experiments at the level of unique CLIP tags per transcript. (D) Increasing the stringency of biologically reproducible RBM47 binding site definition reveals predominant binding in 3′UTRs and intronic regions of target transcripts, with the most robust binding (tags per binding site) evident in 3′UTRs. (E) Distribution of tags number per biologically reproducible cluster in coding and non-coding regions of RBM47-targeted transcripts reveals a bimodal binding pattern between 3′UTRs and introns, with the latter having large numbers of reproducible yet less robust binding. (F) MEME analysis reveals an enrichment for polyU sequences (50 sites, p=2.4e−16) in the ±10 nt foot print region surrounding reproducible RBM47 deletion CIMS (357 sites with ≥5 mutations, FDR ≤0.01, Zhang and Darnell, 2011). (G) Widespread RBM47 binding is seen in target transcripts, as exemplified by binding patterns seen in the 3′UTRs of DKK1 and IL8.
Figure 5 with 1 supplement
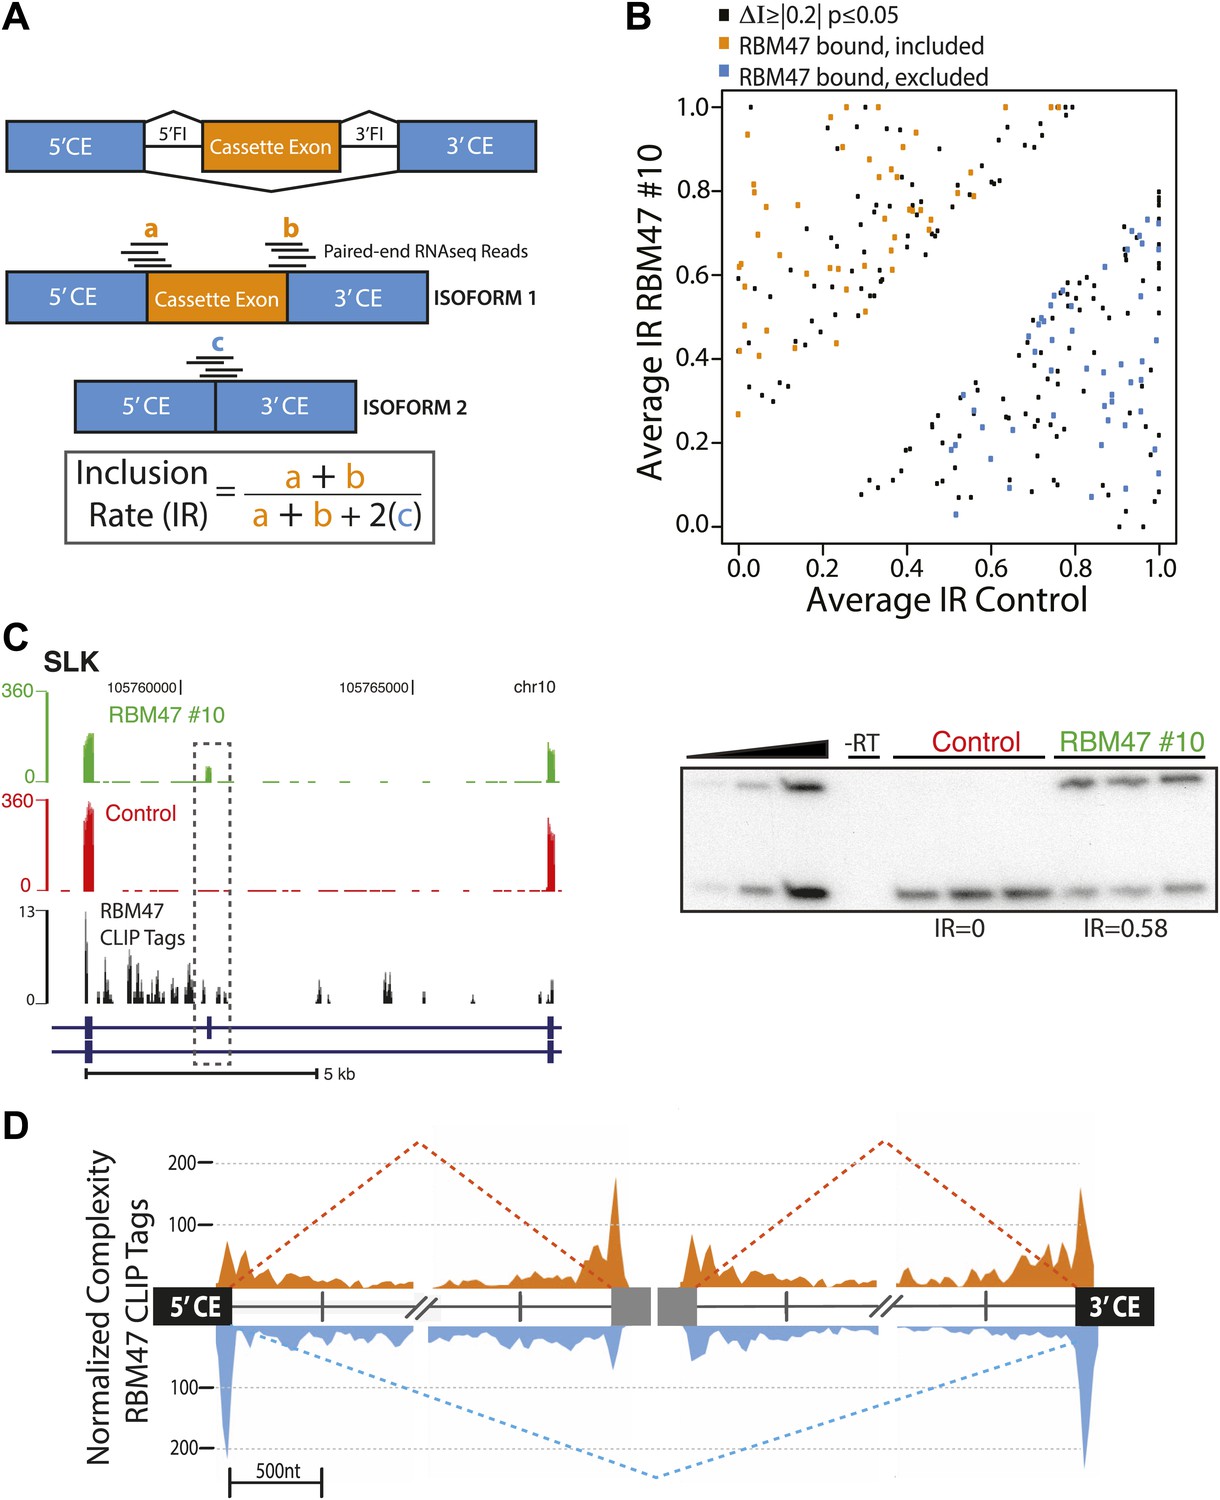
RBM47 regulates alternative splicing.
(A) Schematic showing the method used to calculate alternative exon inclusion rates from paired-end RNA-seq data. 5′CE–5′ flanking constitutive exon, 3′CE–3′ flanking constitutive exon, 5′FI–5′ Flanking intron, 3′FI–3′ Flanking intron. (B) Scatter plot of all expressed alternatively spliced CA exons showing RBM47-dependent change in inclusion (black, ≥10 RNA-seq reads spanning exon–exon junctions, ΔI ≥|0.2|, p≤0.05) with orange points indicating RBM47-bound and included CA exons, and blue points indicating bound and excluded exons, respectively. CA exons were considered bound given a total of tags ≥10 in BC2 tags ≥5 clusters mapping to the region spanning the start of the 5′CE to the end of the 3′CE. p-values calculated by Fisher's exact test using total isoform 1 and total isoform 2 RNA-seq reads in each condition. (C) Left panel shows a section of the SLK transcript (blue) that includes a CA exon (grey box). The top two panels show RNA-seq data from WT10 (green) and control cells (red), with RBM47 HITS-CLIP tags mapping to the region shown beneath in black. Increased RNA-seq signal corresponding to the CA exon is seen in the presence of RBM47 expression, while robust binding is evident in the 5′FI. Independent RT-PCR validation of this splice is shown in the right panel, with IR calculated using ImageJ analysis of autoradiograms. (D) Normalized complexity map of RBM47-dependent alternative splicing of CA exons. Orange and blue peaks represent binding associated with RBM47-dependent exon inclusion and exclusion, respectively.
Figure 5—figure supplement 1
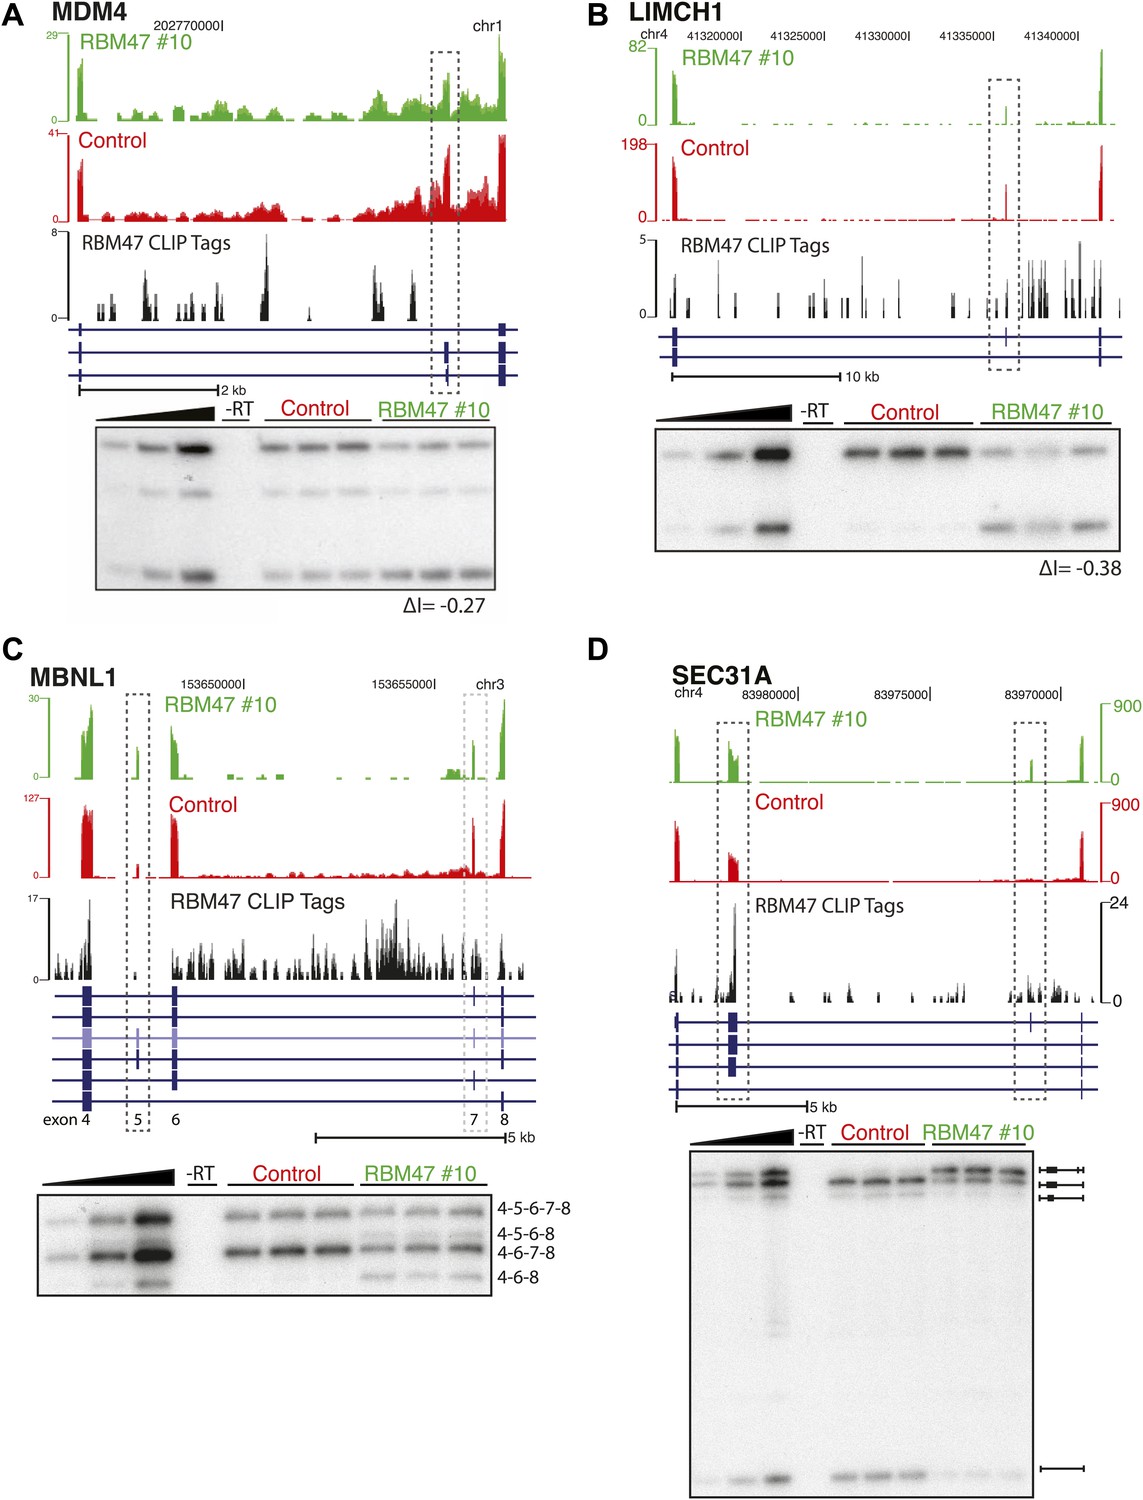
RBM47-dependent splicing events.
(A) RBM47-dependent exclusion of exon 6 of MDM4, as in Figure 5C. (B) RBM47-dependent exclusion of a CA in LIMCH1, as in Figure 5C. (C) RBM47-dependent inclusion of exon 5 in MBNL1, as in Figure 5C. (D) RBM47-dependent inclusion of two CA exons in SEC31A, as in Figure 5C.
Figure 6 with 1 supplement

RBM47-induced changes in mRNA levels.
(A) Distribution of p-values from correlation analysis of doxycycline concentration and gene expression for all genes in WT6, WT10 and MUT3 cell lines, respectively. Global gene expression determined by RNA-seq. (B) Distribution of correlation coefficients between doxycycline concentration and gene expression in WT6, WT10 and MUT3 cell lines, respectively. (C) Heat maps showing the top 102 positively (UP) correlated and 92 negatively (DOWN) correlated genes with RBM47 expression in WT6 and WT10 cells. The expression of these genes does not correlate with RBM47I280fs expression in the MUT3 cells. (D) RBM47 mRNA expression in the TCGA cohort of breast cancer samples classified by the clusters shown in Figure 6—figure supplement 1C. p-value determined by two-tailed Student's t test. (E) Fold change between Cluster 1 and Cluster 2 shown for the 102 positively and 92 negatively correlated RBM47 target genes, respectively. Positive fold change shows higher expression in Cluster 2, which has lower expression of RBM47. The genes that are induced upon RBM47 reintroduction tend to have lower expression in Cluster 2, and the genes that show lower expression upon RBM47 reintroduction tend to have higher expression in Cluster 2. This is in line with the experimental results shown in panel (C). P-value determined by two-tailed Student's t test. (F) Pie charts showing the fraction of target genes with more than 100 RBM47 tags for both the 102 positively and 92 negatively correlated RBM47 target genes. (G) Tags per transcript plotted for both the positively and negatively correlated RBM47 target genes that showed more than 1 tag. The only two binding partners with >104 tags represent DKK1 and IL8, respectively. (H) Secreted DKK1 and IL8 protein levels determined by ELISA in WT6 cells treated with the indicated doxycycline concentrations. VEGFA used as a control.
Figure 6—figure supplement 1
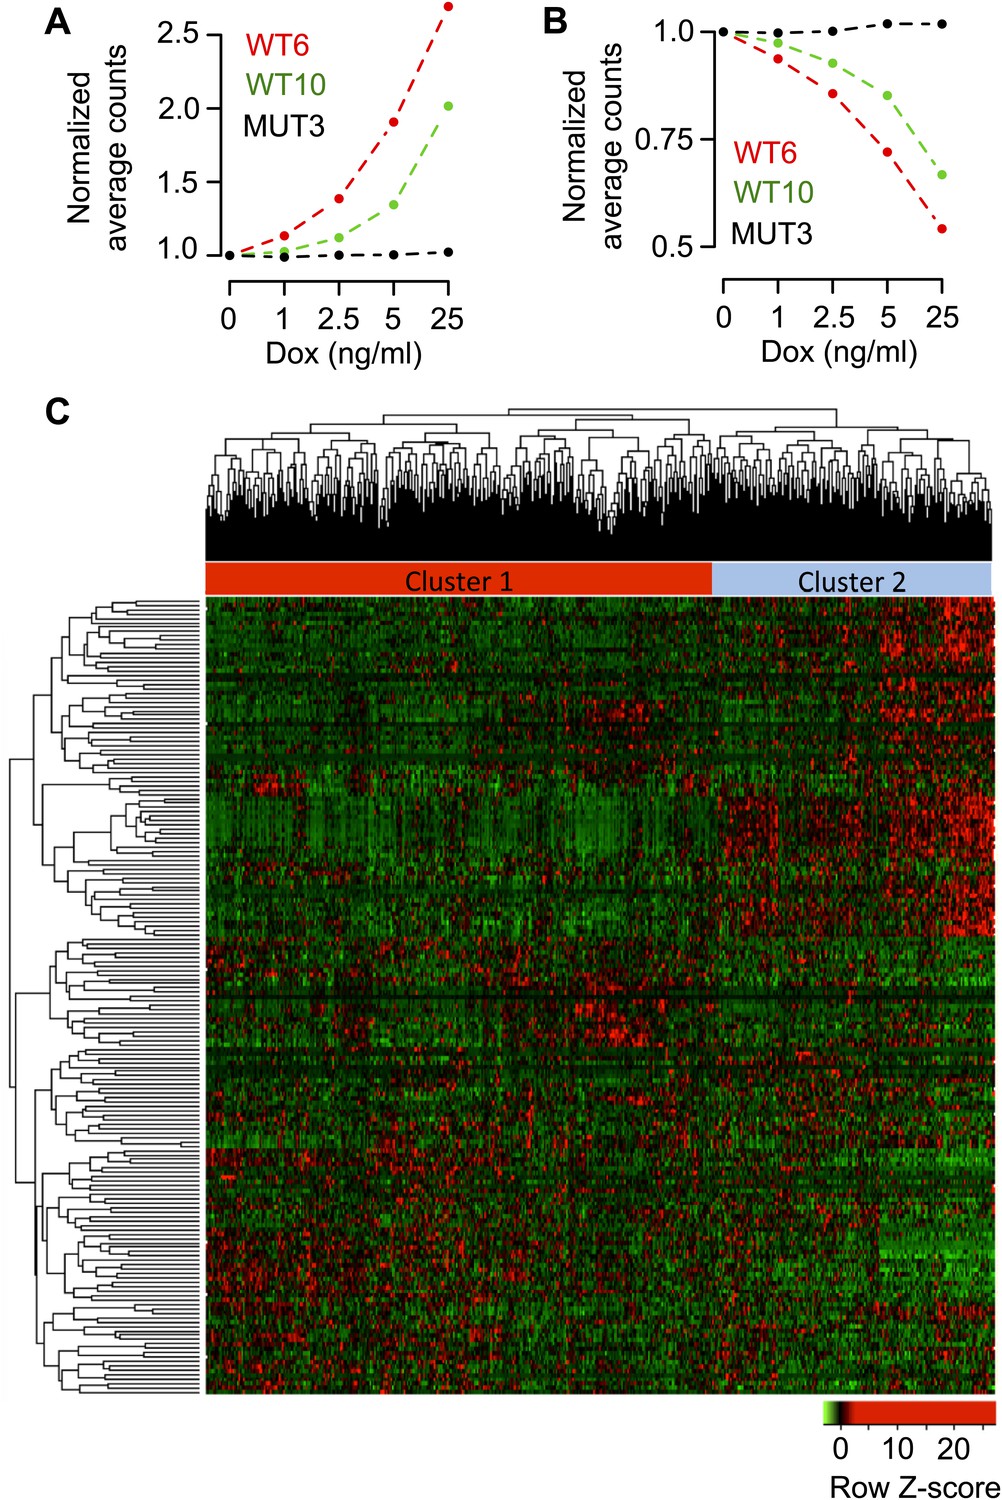
Transcriptomic signature of RBM47 reintroduction.
(A) Normalized average RNA-seq reads per transcript for the 102 positively correlated RBM47 target genes shown for WT6, WT10 and MUT3 cells treated with the indicated doxycycline concentrations. (B) Normalized average counts for the 92 negatively correlated RBM47 target genes shown for WT6, WT10 and MUT3 cells treated with the indicated doxycycline concentrations. (C) A heatmap showing unsupervised hierarchical clustering in the TCGA cohort of 748 samples using the 194 RBM47 target genes identified by RNA-seq. Two main clusters are detected.
Figure 7 with 1 supplement
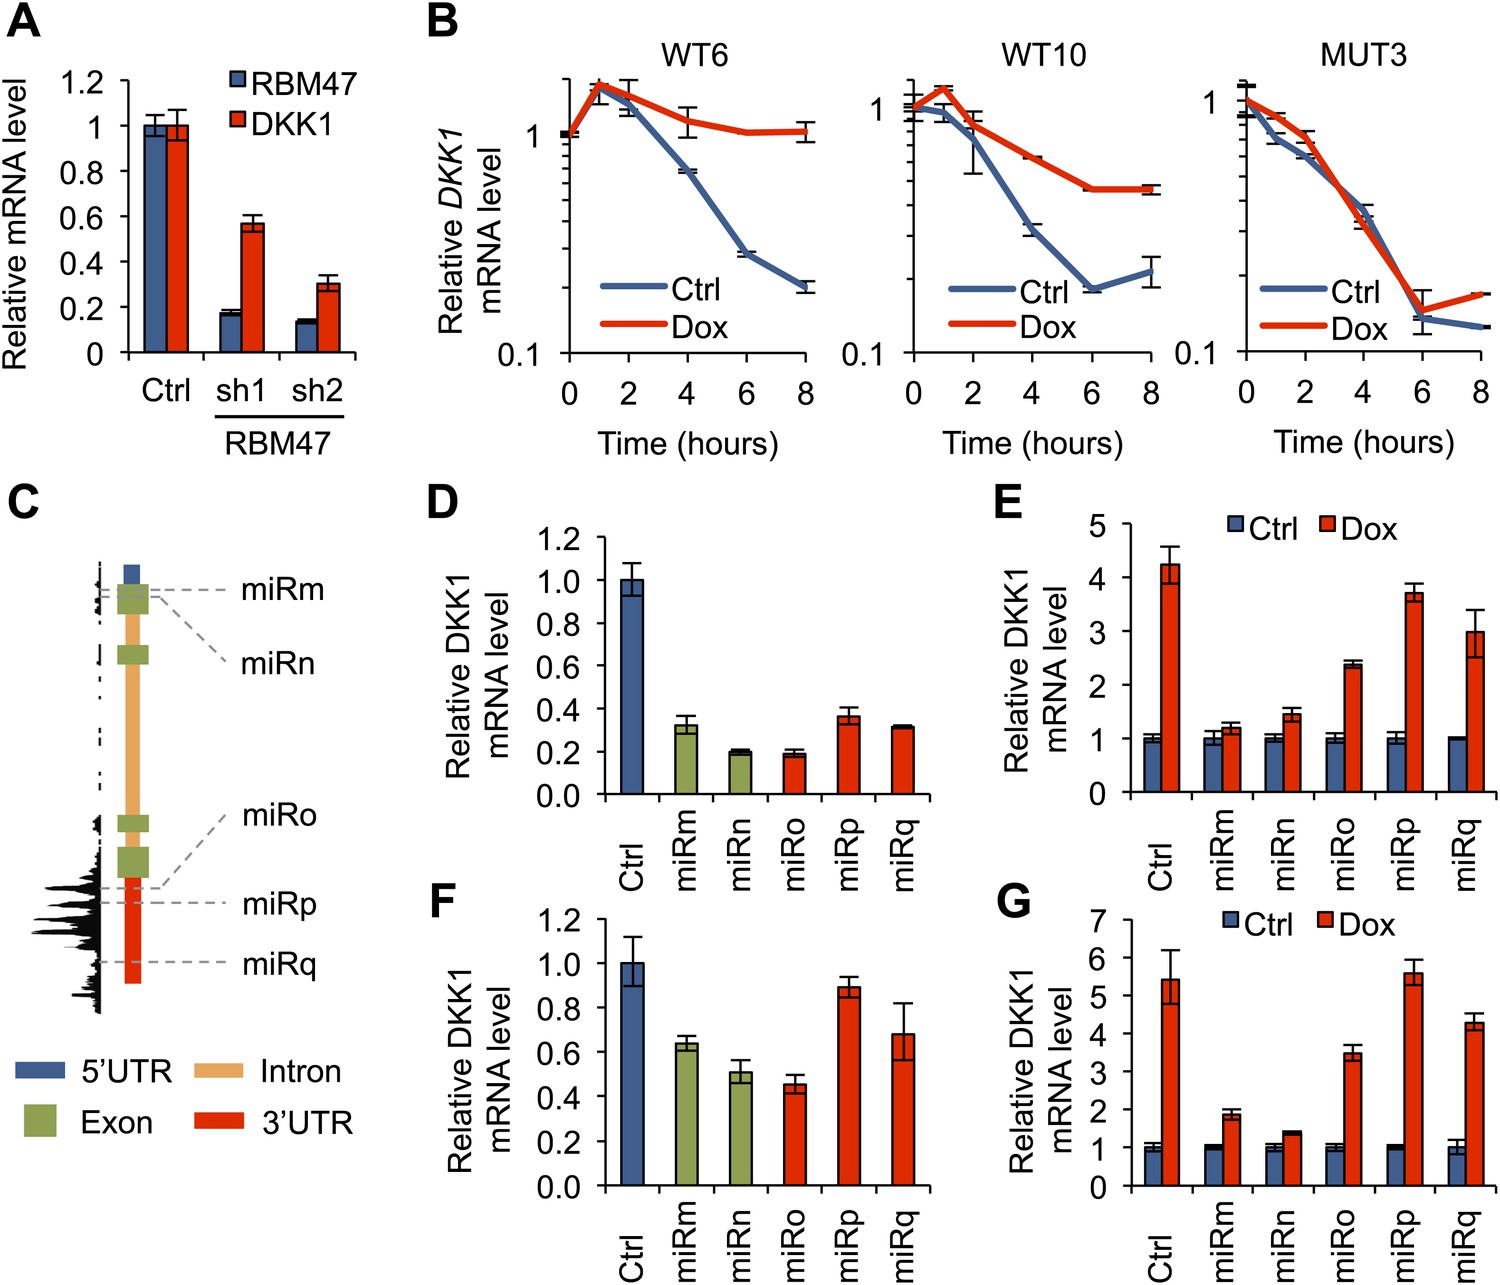
RBM47 modulates DKK1 mRNA stability.
(A) RBM47 and DKK1 mRNA expression measured by quantitative real-time RT-PCR in SKBR3 cells expressing either control vector (pGIPZ) or hairpins against RBM47 (shRNA1 and shRNA2). Error bars represent 95% confidence intervals obtained from multiple PCR reactions. (B) DKK1 mRNA stability determined by measuring mRNA levels by quantitative real-time RT-PCR in WT6, WT10 and MUT3 cells, treated with or without doxycycline, after inhibition of transcription with actinomycin D. Data normalized to time point 0. Error bars represent 95% confidence intervals obtained from multiple PCR reactions. WT6: T1/2 Ctrl = 2.3 hr, T1/2 Dox = 9.8 hr; WT10: T1/2 Ctrl = 2.4 hr, T1/2 Dox = 5.4 hr; MUT3: T1/2 Ctrl = 2.1 hr, T1/2 Dox = 2.2 hr. (C) Schematic showing the locations of different DKK1 miR-constructs in relation to DKK1 genomic locus and RBM47 binding patterns. miRm and miRn target exon 1 that is not bound by RBM47. miRo, miRp and miRq target DKK1 3′UTR that is strongly bound by RBM47. (D) DKK1 mRNA expression measured by quantitative real-time RT-PCR in WT6 cells expressing either control vector (pGIPZ) or the five DKK1-targeting miR constructs shown in panel (C). Error bars represent 95% confidence intervals obtained from multiple PCR reactions. (E) DKK1 mRNA expression measured by quantitative real-time RT-PCR in WT6 cells expressing either control vector (pGIPZ) or the five DKK1-targeting miR constructs, with or without doxycycline treatment. Data normalized to the non-treated control for each cell line separately. Error bars represent 95% confidence intervals obtained from multiple PCR reactions. (F) DKK1 mRNA expression measured by quantitative real-time RT-PCR in WT10 cells expressing either control vector (pGIPZ) or the five DKK1-targeting miR constructs shown in panel (C). Error bars represent 95% confidence intervals obtained from multiple PCR reactions. (G) DKK1 mRNA expression measured by quantitative real-time RT-PCR in WT10 cells expressing either control vector (pGIPZ) or the five DKK1-targeting miR constructs, with or without doxycycline treatment. Data normalized to the non-treated control for each cell line separately. Error bars represent 95% confidence intervals obtained from multiple PCR reactions.
Figure 7—figure supplement 1

Effects of RBM47 knockdown on DKK1 mRNA.
(A) RBM47 and DKK1 mRNA expression measured by quantitative real-time RT-PCR in ZR-75-30 cells expressing either control vector (pGIPZ) or a hairpin against RBM47 (shRNA2). Error bars represent 95% confidence intervals obtained from multiple PCR reactions.
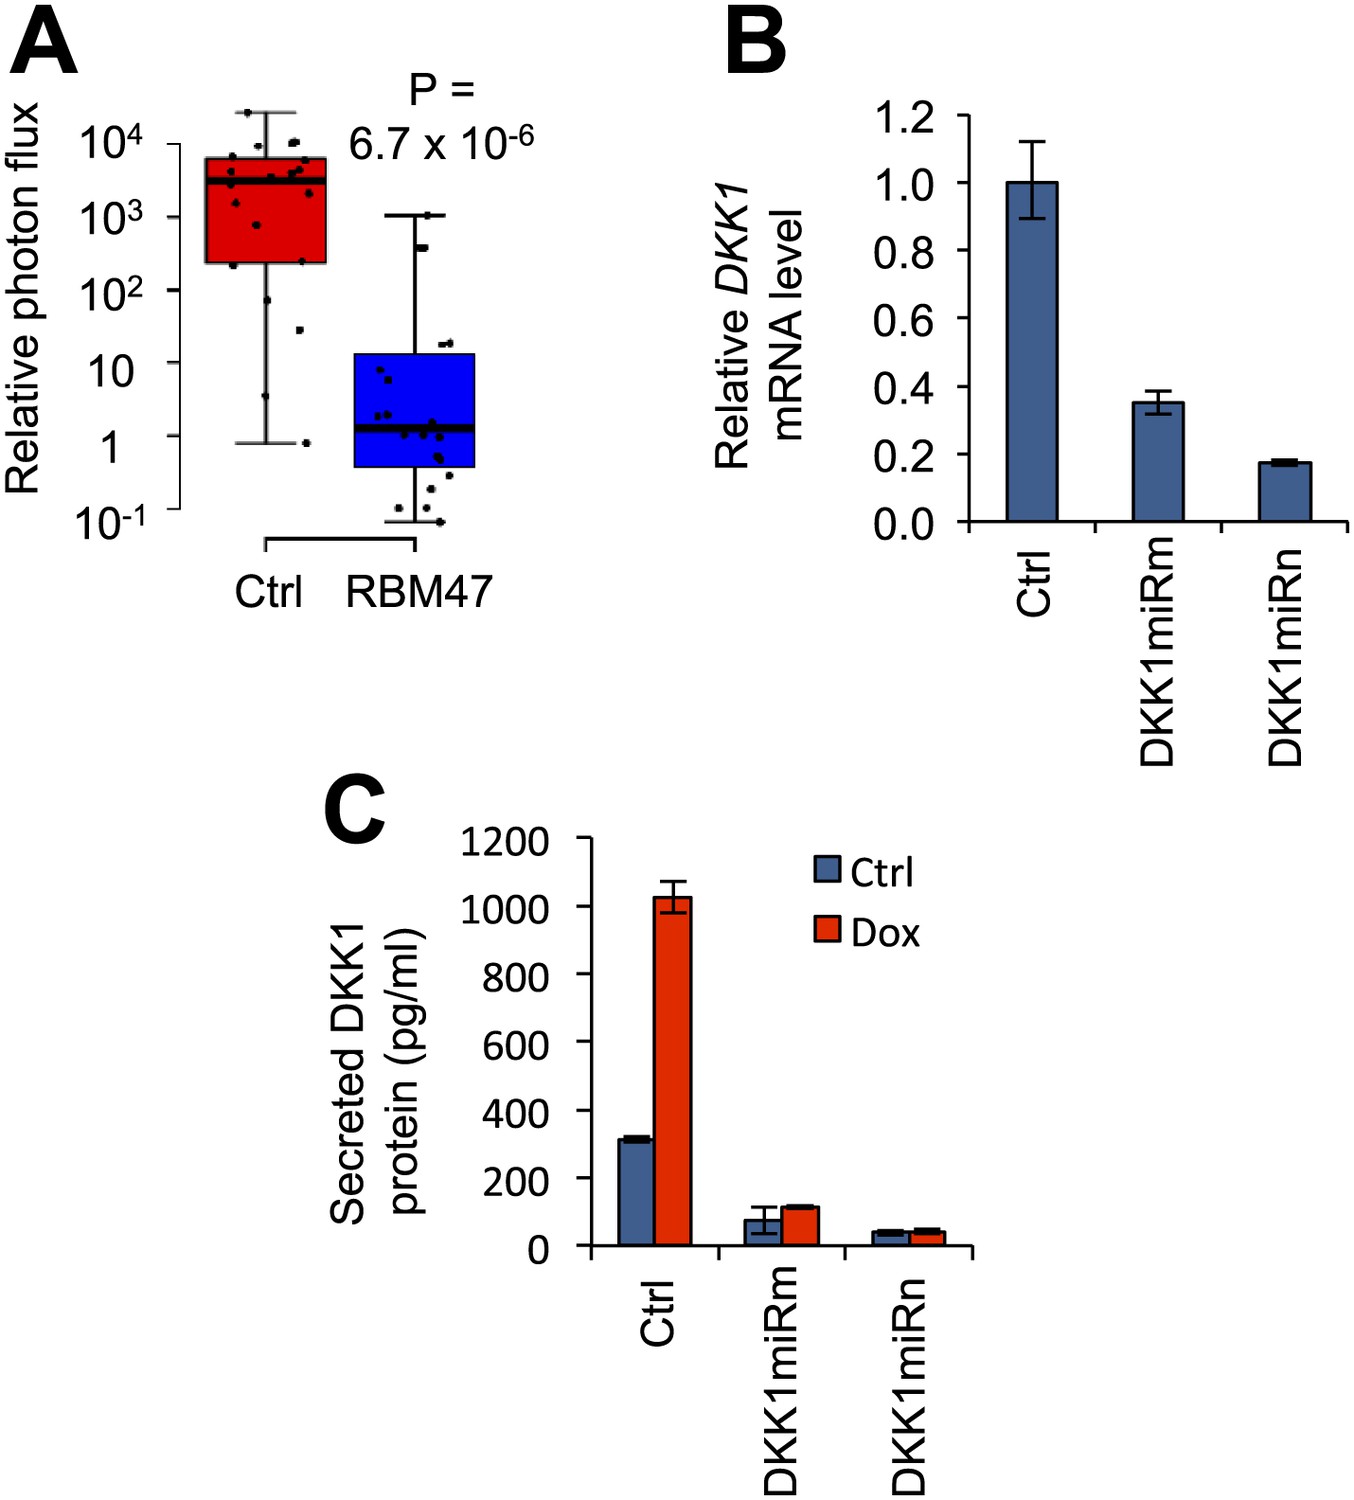
Figure 8 with 1 supplement
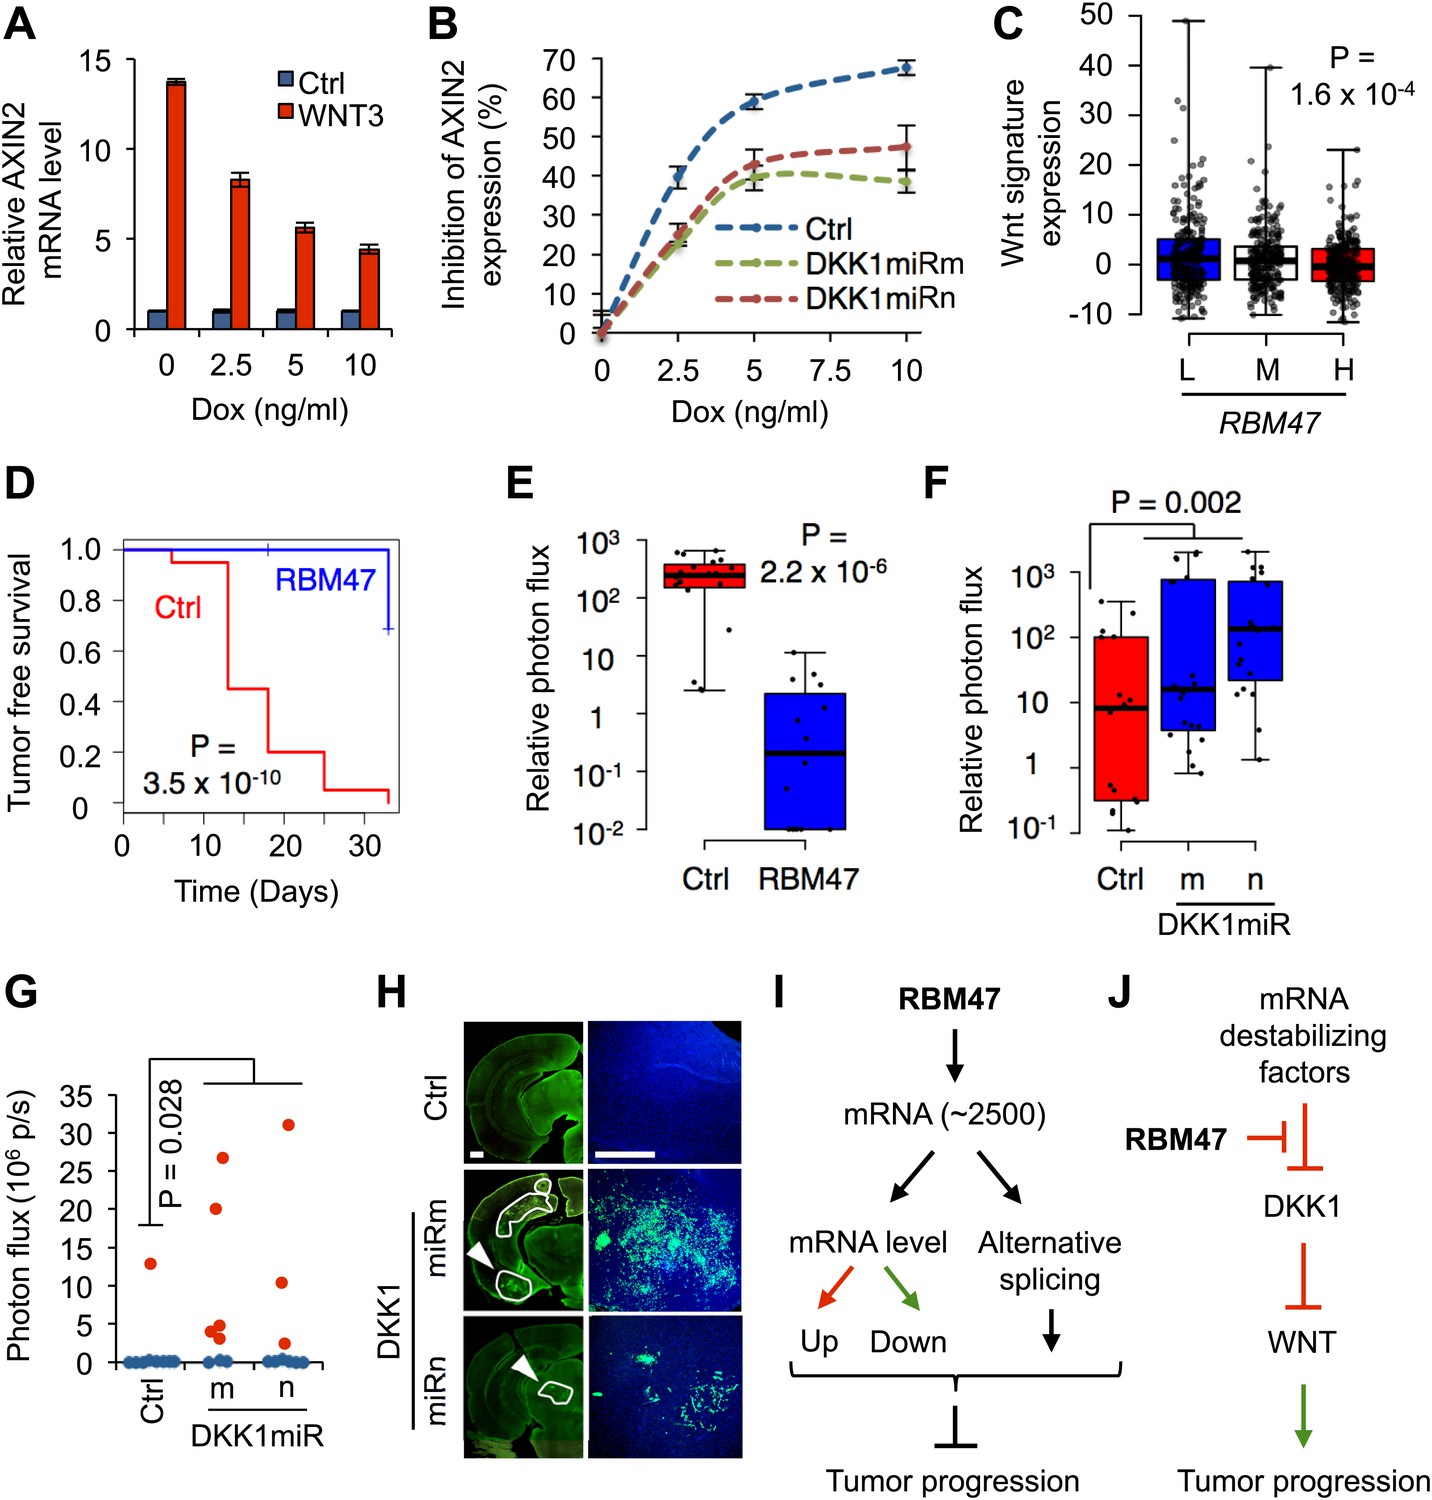
RBM47 suppresses tumor progression via Wnt inhibition.
(A) AXIN2 mRNA levels determined by quantitative real-time RT-PCR in WT6 cells treated with recombinant WNT3A in the presence of increasing concentrations of doxycycline. Error bars represent 95% confidence intervals obtained from multiple PCR reactions. (B) Normalized level of AXIN2 mRNA inhibition as determined by quantitative real-time RT-PCR in WT6 cells transduced wither with control vector or shRNAmiR constructs targeting the first exon of DKK1. The cells were treated with recombinant WNT3A in the presence of increasing concentrations of doxycycline. Error bars represent 95% confidence intervals obtained from multiple PCR reactions. (C) Wnt pathway activity assessed in the TCGA cohort of primary breast tumors, grouped by RBM47 expression tertiles (L, low; M, medium; H, high). Wnt signature value calculated as sum of z-scores for a curated set of 16 Wnt target genes in breast cancer. p-value determined by linear regression analysis. (D) Mammary tumor re-initiation assay. 5,000 WT6 cells implanted orthotopically in mice. RBM47 induced by doxycycline feed. Tumor growth detected by bioluminescence. p-value determined by the log-rank test. N = 20 tumors for each group. (E) Quantification of mammary tumor burden by in vivo bioluminescence imaging on day 33 of the experiment shown in (D). Data normalized to day 0 for each tumor. p-value calculated by the Wilcoxon rank-sum test. (F) Quantification of mammary tumor burden by in vivo bioluminescence imaging in mice inoculated with 231-Brm2 cells transduced with either control (pGIPZ) or DKK1-targeting shRNAmiR constructs. Data normalized to day 0 for each tumor. p-value calculated by one-tailed Wilcoxon rank-sum test. (G) Quantification of ex vivo brain bioluminescence shown for mice inoculated intracardiacly with WT6 cells transduced with either control (pGIPZ) or DKK1-targeting shRNAmiR constructs in the presence of RBM47, that is doxycycline in diet. One out of 9 (11%) control mice developed robust brain metastasis whereas 8/17 (47%) mice in the DKK1 knockdown groups showed metastasis. p-value calculated by one-tailed Student's t test. (H) Representative images of coronal brain sections analyzed for GFP immunofluorescence from the experiment shown in panel (G). Lesion contours are marked in white. Arrowheads indicate the lesions shown in higher magnification on the right; a similar brain area is shown for the control group. Scale bar 500 μm. (I) At the global level, RBM47 binds to ∼2500 target mRNAs. However, the abundance or alternative splicing of only a fraction of these change depending on RBM47 status. The target genes represent molecules from various signaling pathways. The net effect of growth promoting and inhibiting alterations determine whether RBM47 loss is beneficial for a particular cancer clone. (J) At the target mRNA level, the effects of RBM47 are dependent on the presence of other factors that modulate mRNA processing. Hence, the phenotype of RBM47 loss depends on the intracellular molecular milieu on a per transcript basis. This is exemplified by the interaction of RBM47 with DKK1 mRNA.
Figure 8—figure supplement 1
DKK1 as a mediator of RBM47-dependent tumor suppression.
(A) Quantification of mammary tumor burden by in vivo bioluminescence imaging on day 36 after 5,000 WT10 cells were implanted orthotopically in mice. RBM47 induced by doxycycline feed. Data normalized to day 0 for each tumor. p-value calculated by the Wilcoxon rank-sum test. (B) DKK1 mRNA measured by quantitative real-time RT-PCR in 231-BrM2 cells transduced with either control (pGIPZ) or DKK1-targeting shRNAmiR constructs. Error bars represent 95% confidence intervals obtained from multiple PCR reactions. (C) Secreted DKK1 protein levels determined by ELISA in WT6 cells transduced with either control (pGIPZ) or DKK1-targeting shRNAmiR constructs, with or without doxycycline treatment.
Additional files
-
Supplementary file 1
RBM47-bound alternatively spliced exons showing RBM47-dependent ΔI ≥|0.2|.
- https://doi.org/10.7554/eLife.02734.019
-
Supplementary file 2
mRNAs changed upon RBM47 reintroduction.
- https://doi.org/10.7554/eLife.02734.020
-
Supplementary file 3
RBM47 bound transcripts.
- https://doi.org/10.7554/eLife.02734.021
Download links
A two-part list of links to download the article, or parts of the article, in various formats.
Downloads (link to download the article as PDF)
Open citations (links to open the citations from this article in various online reference manager services)
Cite this article (links to download the citations from this article in formats compatible with various reference manager tools)
Loss of the multifunctional RNA-binding protein RBM47 as a source of selectable metastatic traits in breast cancer
eLife 3:e02734.
https://doi.org/10.7554/eLife.02734


