Reversal of β cell de-differentiation by a small molecule inhibitor of the TGFβ pathway
- Harvard Stem Cell Institute, Harvard University, United States
- Howard Hughes Medical Institute, Harvard University, United States
Figures
Figure 1
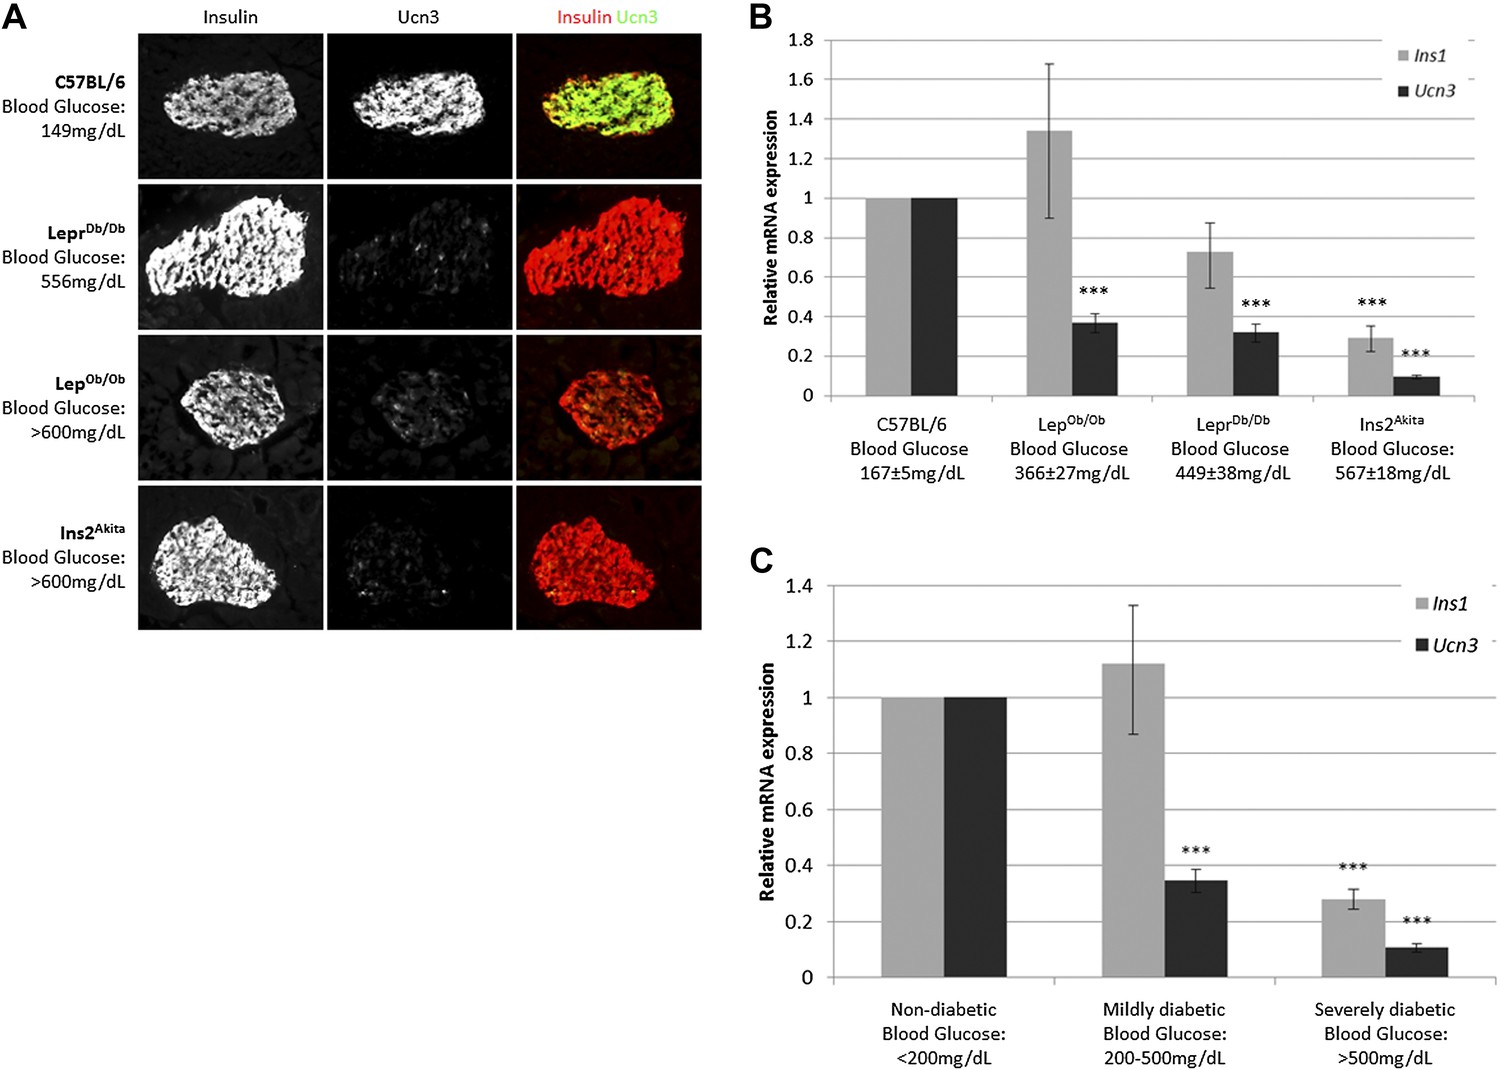
Loss of Ucn3 expression is an early marker for β cell de-differentiation in diabetes.
(A) Immunostaining with antibodies against insulin (red) and Ucn3 (green) in pancreata from T2D (LepOb/Ob and LeprDb/Db), insulin-dependent diabetic (Ins2Akita), and healthy control (C57BL/6) mice. Ucn3 protein but not insulin protein is down regulated in diabetic pancreata compared to the healthy control. (B) Quantitative Real-Time PCR analysis of Ins1 and Ucn3 gene expression in islets from C57BL/6 (n = 10), LepOb/Ob (n = 9), LeprDb/Db (n = 8), and Ins2Akita (n = 11) mice. Ucn3 mRNA is significantly reduced in all diabetes models, while insulin mRNA is significantly reduced only in the most diabetic model (Ins2Akita). (C) Quantitative Real-Time PCR analysis of Ins1 and Ucn3 gene expression in islets from non-diabetic control mice (n = 10; average blood glucose 167 ± 5 mg/dl), mildly diabetic (n = 16; average blood glucose 381 ± 17 mg/dl) and severely diabetic mice (n = 11; average blood glucose 588 ± 8 mg/dl). Error bars represent ±SEM. ***p < 0.001.
Figure 2 with 1 supplement
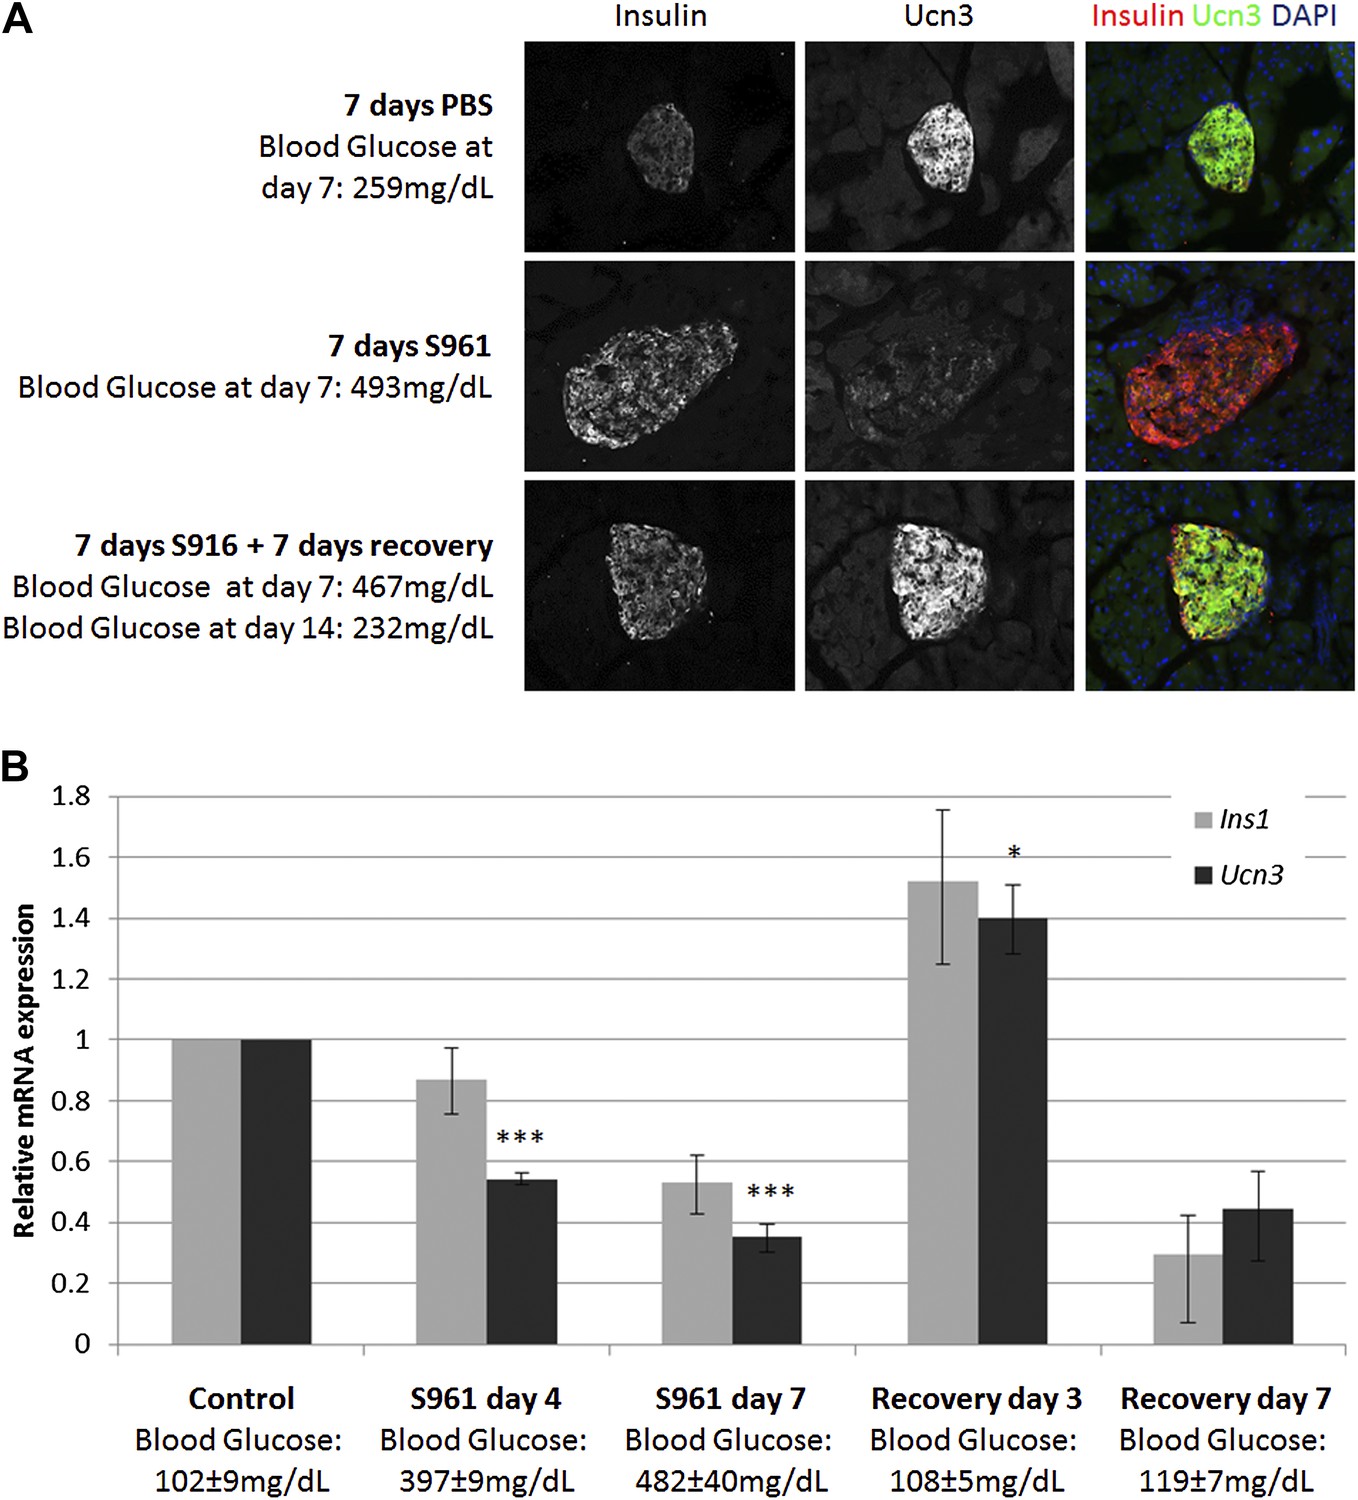
Insulin resistance-induced β cell de-differentiation is reversible.
(A) Immunostaining with antibodies against insulin (red) and Ucn3 (green) in pancreata from wild-type C57BL/6 mice treated with either vehicle (PBS) or S961 (insulin receptor antagonist) for 7 days (upper and middle panels) or treated with S961 for 7 days followed by a 7-day-recovery period in the absence of S961 (lower panel). Ucn3 protein expression is down regulated in β cells following 7 days S961 treatment but returns to normal expression levels upon remission to normoglycaemia (see text). Nuclei are stained with DAPI (blue). (B) Quantitative Real-Time PCR analysis of Ins1 and Ucn3 gene expression in islets from ICR lean mice taken at different time points during S961-induced de-differentiation and post S961 withdrawal recovery (n = 3 mice for each stage). S961 osmotic pumps are transplanted on day 0 and removed on day 7. Control designates mice not treated with S961. Error bars represent ±SEM. *p < 0.05; ***p < 0.005.
Figure 2—figure supplement 1
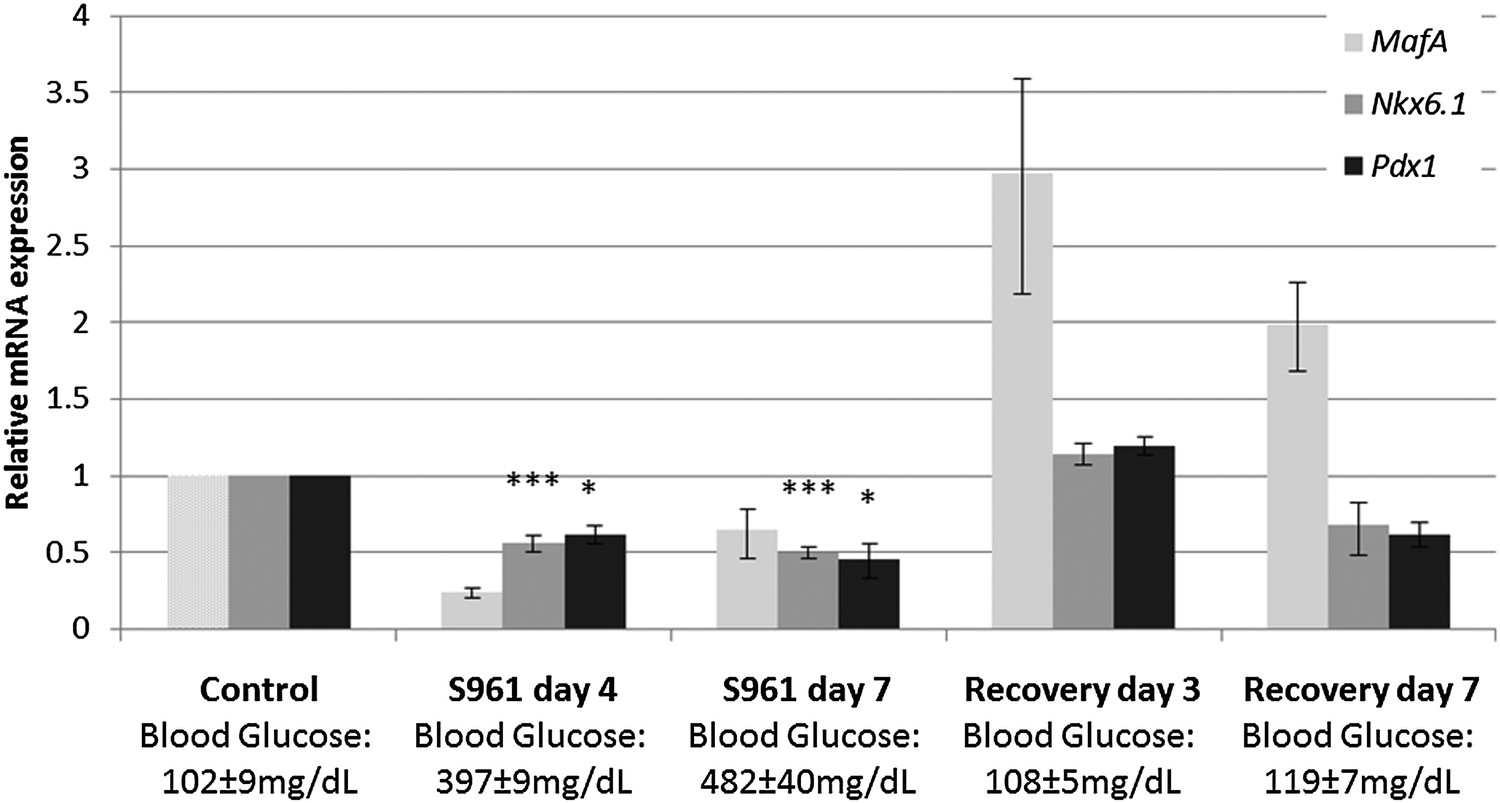
Expression of β cell genes during S961-induced de-differentiation and subsequent recovery.
Quantitative Real-Time PCR analysis of MafA, Nkx6.1, and Pdx1 gene expression in islets from ICR lean mice taken at different time points during S961-induced de-differentiation and post S961 withdrawal recovery (n = 3 mice for each stage). S961 osmotic pumps are transplanted on day 0 and removed on day 7. Control designates mice not treated with S961. Error bars represent ±SEM. *p < 0.05; ***p < 0.005.
Figure 3 with 3 supplements

Adherent culture-induced β cell de-differentiation is reversible.
(A) RCU reporter mice are made by crossing mice homozygous for the Insulin2-Cre transgene with mice doubly-homozygous for Rosa26-lox-stop-lox-H2BmCherry and Ucn3-GFP. Insulin expression in RCU progeny is permanently marked by red nuclear fluorescence, and Ucn3 expression is marked by green cytoplasmic fluorescence. (B) Pancreas sections of PBS-treated control and S961-treated diabetic RCU mice. Ucn3-GFP is reduced in diabetic mice, but not in controls, and Ucn3 expression returns after remission from diabetes. All images show live (unstained) reporter fluorescence. (C) De-differentiation and re-differentiation of RCU islets cultured in vitro. Islets from adult RCU mice were isolated and plated on 804G matrix for 1 week (left and middle panel). Note islet spreading and loss of Ucn3-GFP in the de-differentiated islets (middle panel). After 7 days, the de-differentiated islets were transplanted into euglycemic SCID mice for 3 weeks (right panel) after which time the transplants show the return of Ucn3 expression in β cells.
Figure 3—figure supplement 1
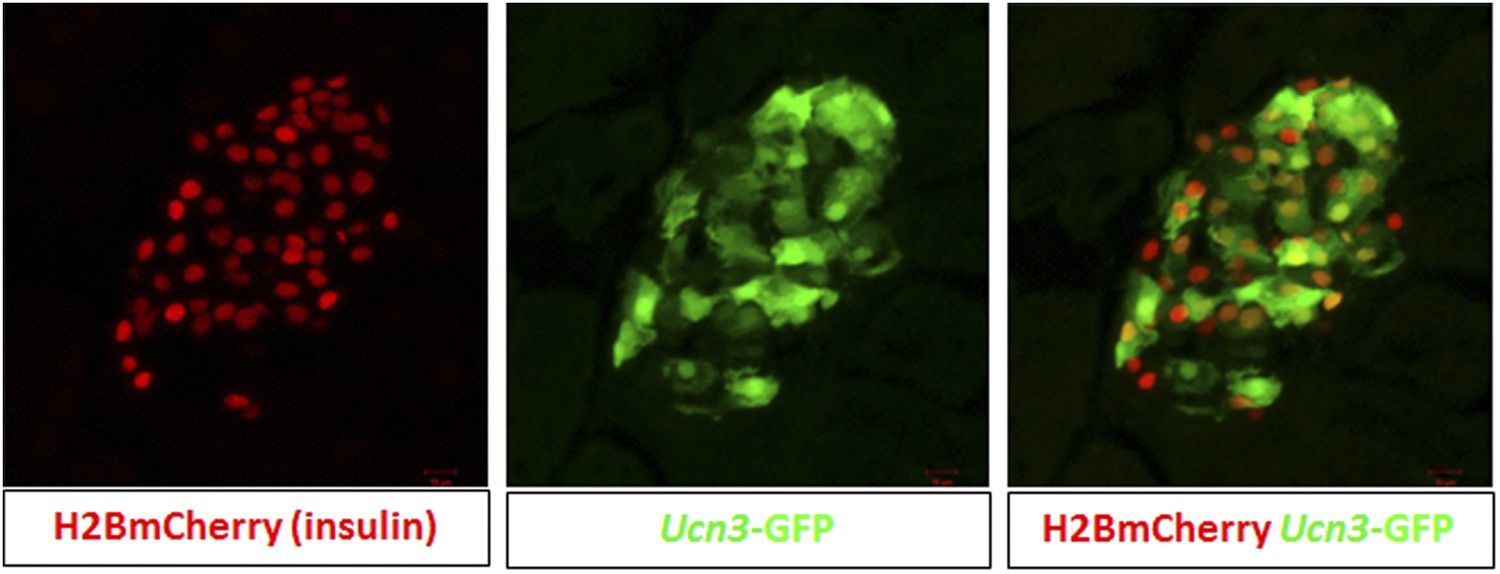
RCU mice show nuclear insulin expression-coupled mCherry and Ucn3-derived cytoplasmic GFP.
Shown are confocal images of an islet from an adult RCU mouse. Note co-localization of nuclear H2BmCherry (red) and cytoplasmic GFP (green).
Figure 3—figure supplement 2
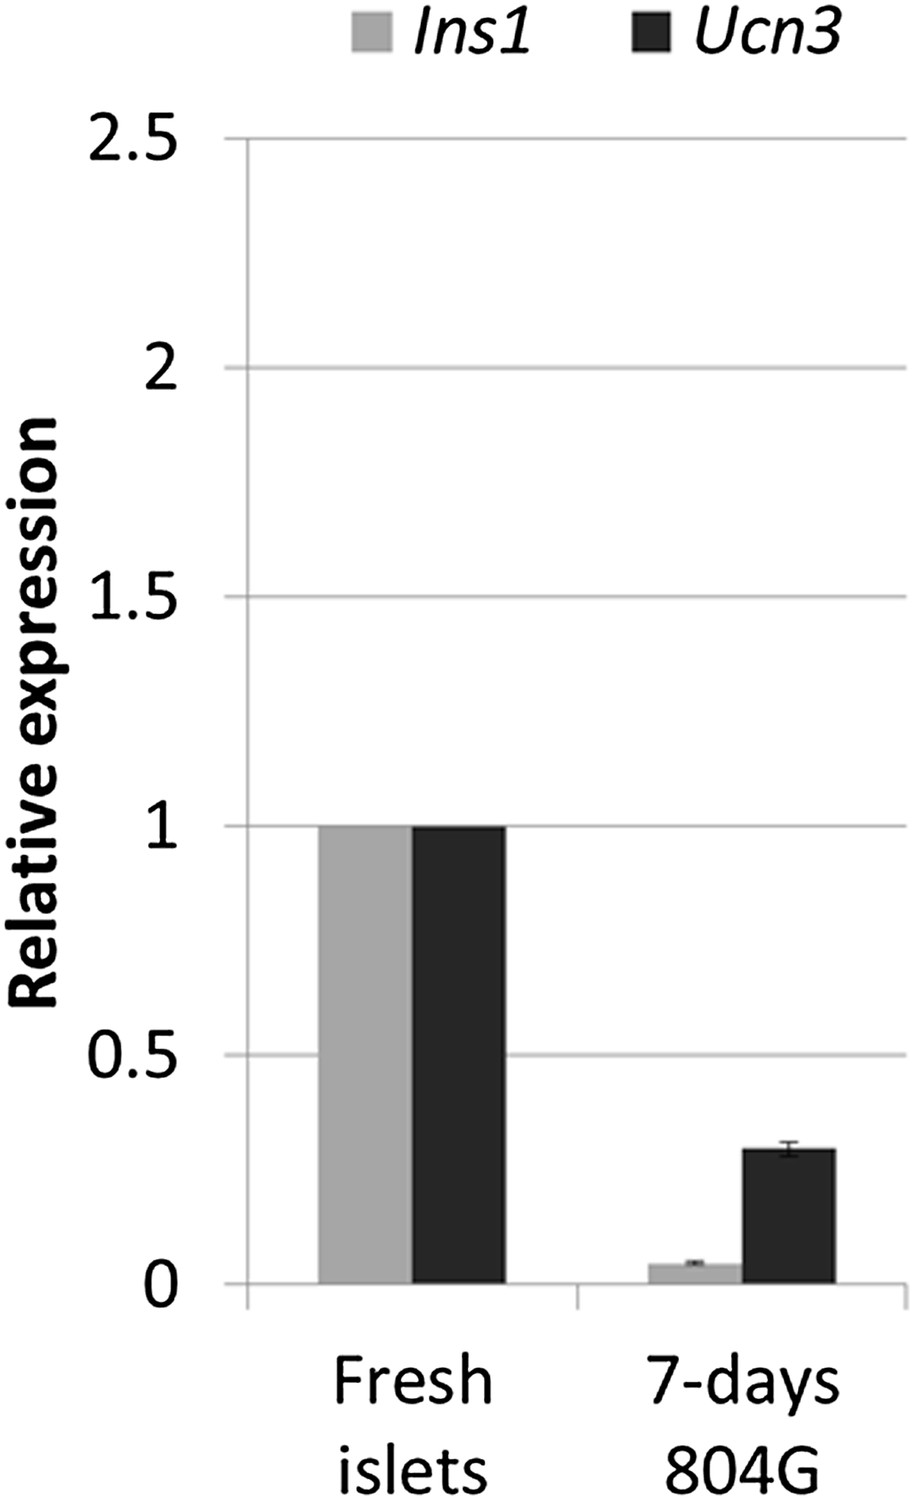
Ucn3 and insulin expression are down regulated in islets grown in adherent culture.
Shown are quantitative Real-Time PCR analyses of Ins1 and Ucn3 from islets of wild-type C57BL/6 mice grown on 804G matrix for 1 week. Each bar represents average gene expression in three independent experiments.
Figure 3—figure supplement 3
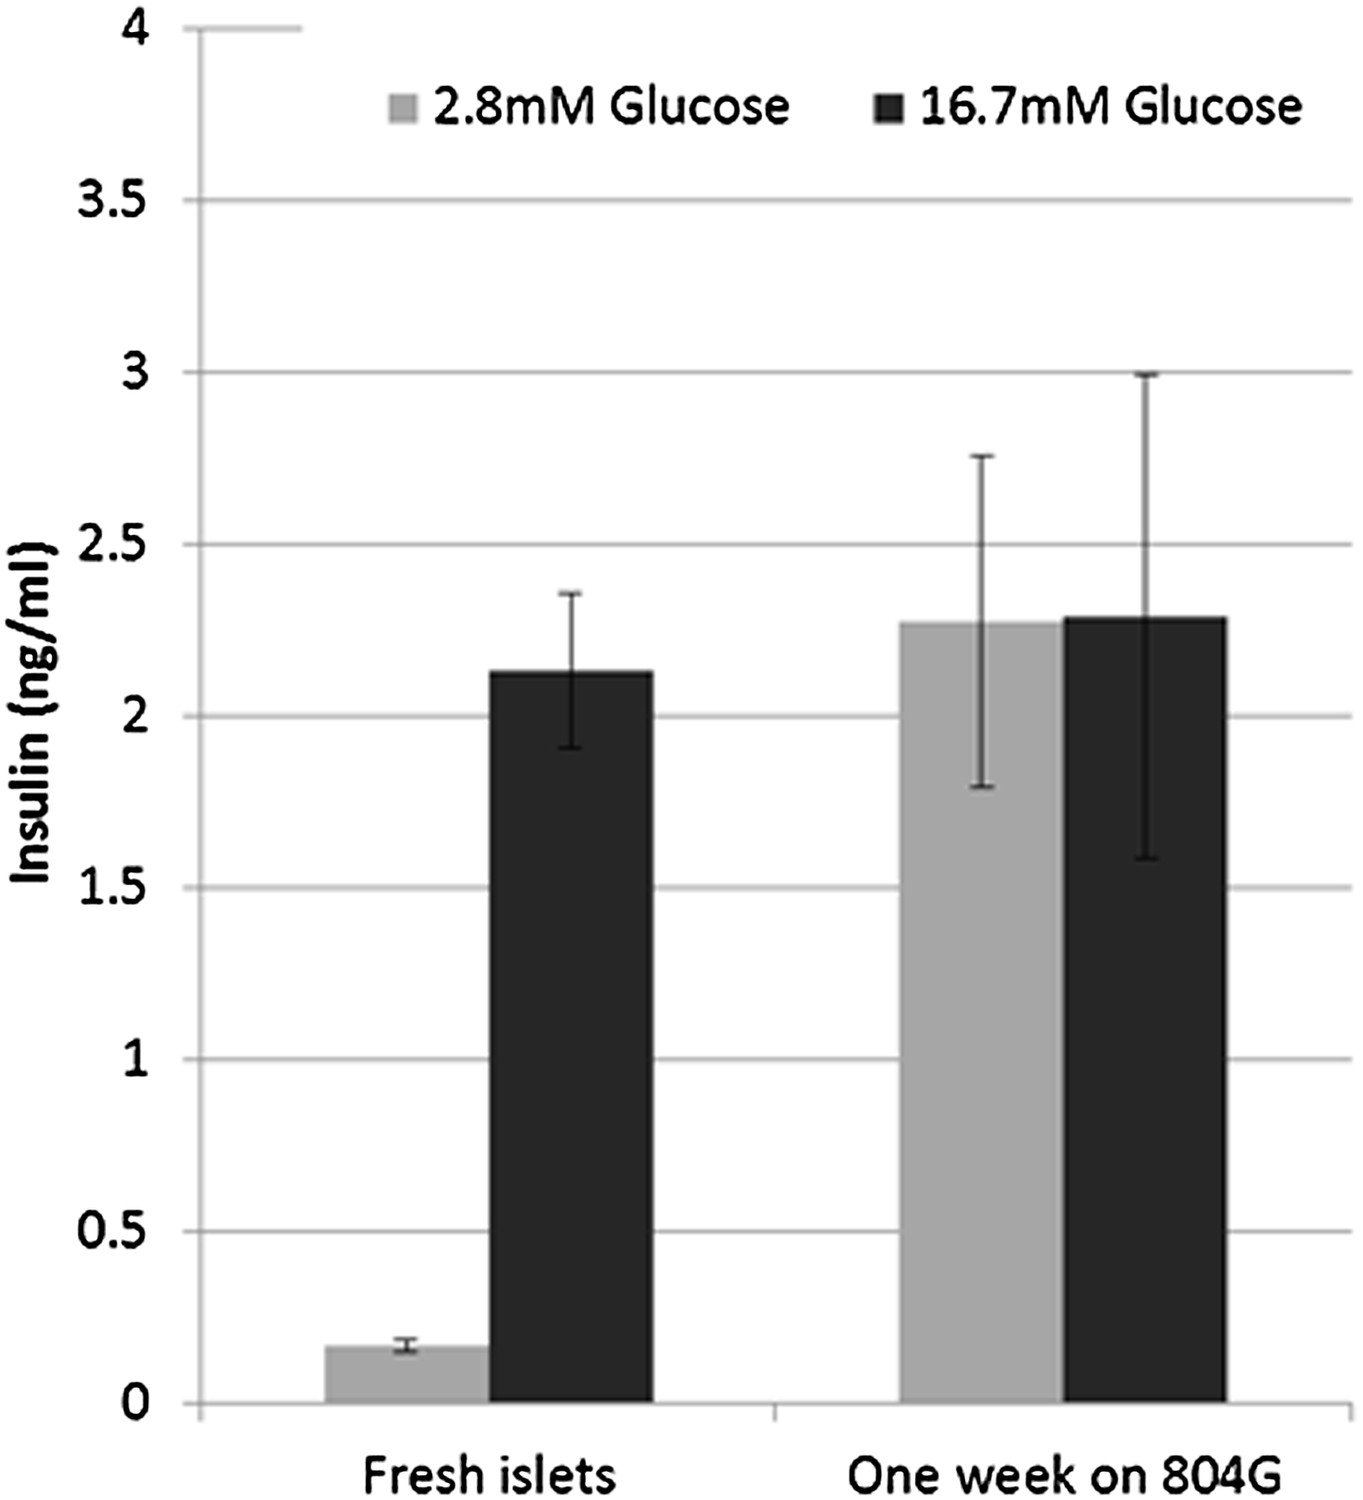
β cells lose glucose-stimulated insulin secretion upon de-differentiation in culture.
Shown are static GSIS analyses of adult islets de-differentiated on 804G for 1 week. Each bar represents average insulin secretion of three biological repeats.
Figure 4
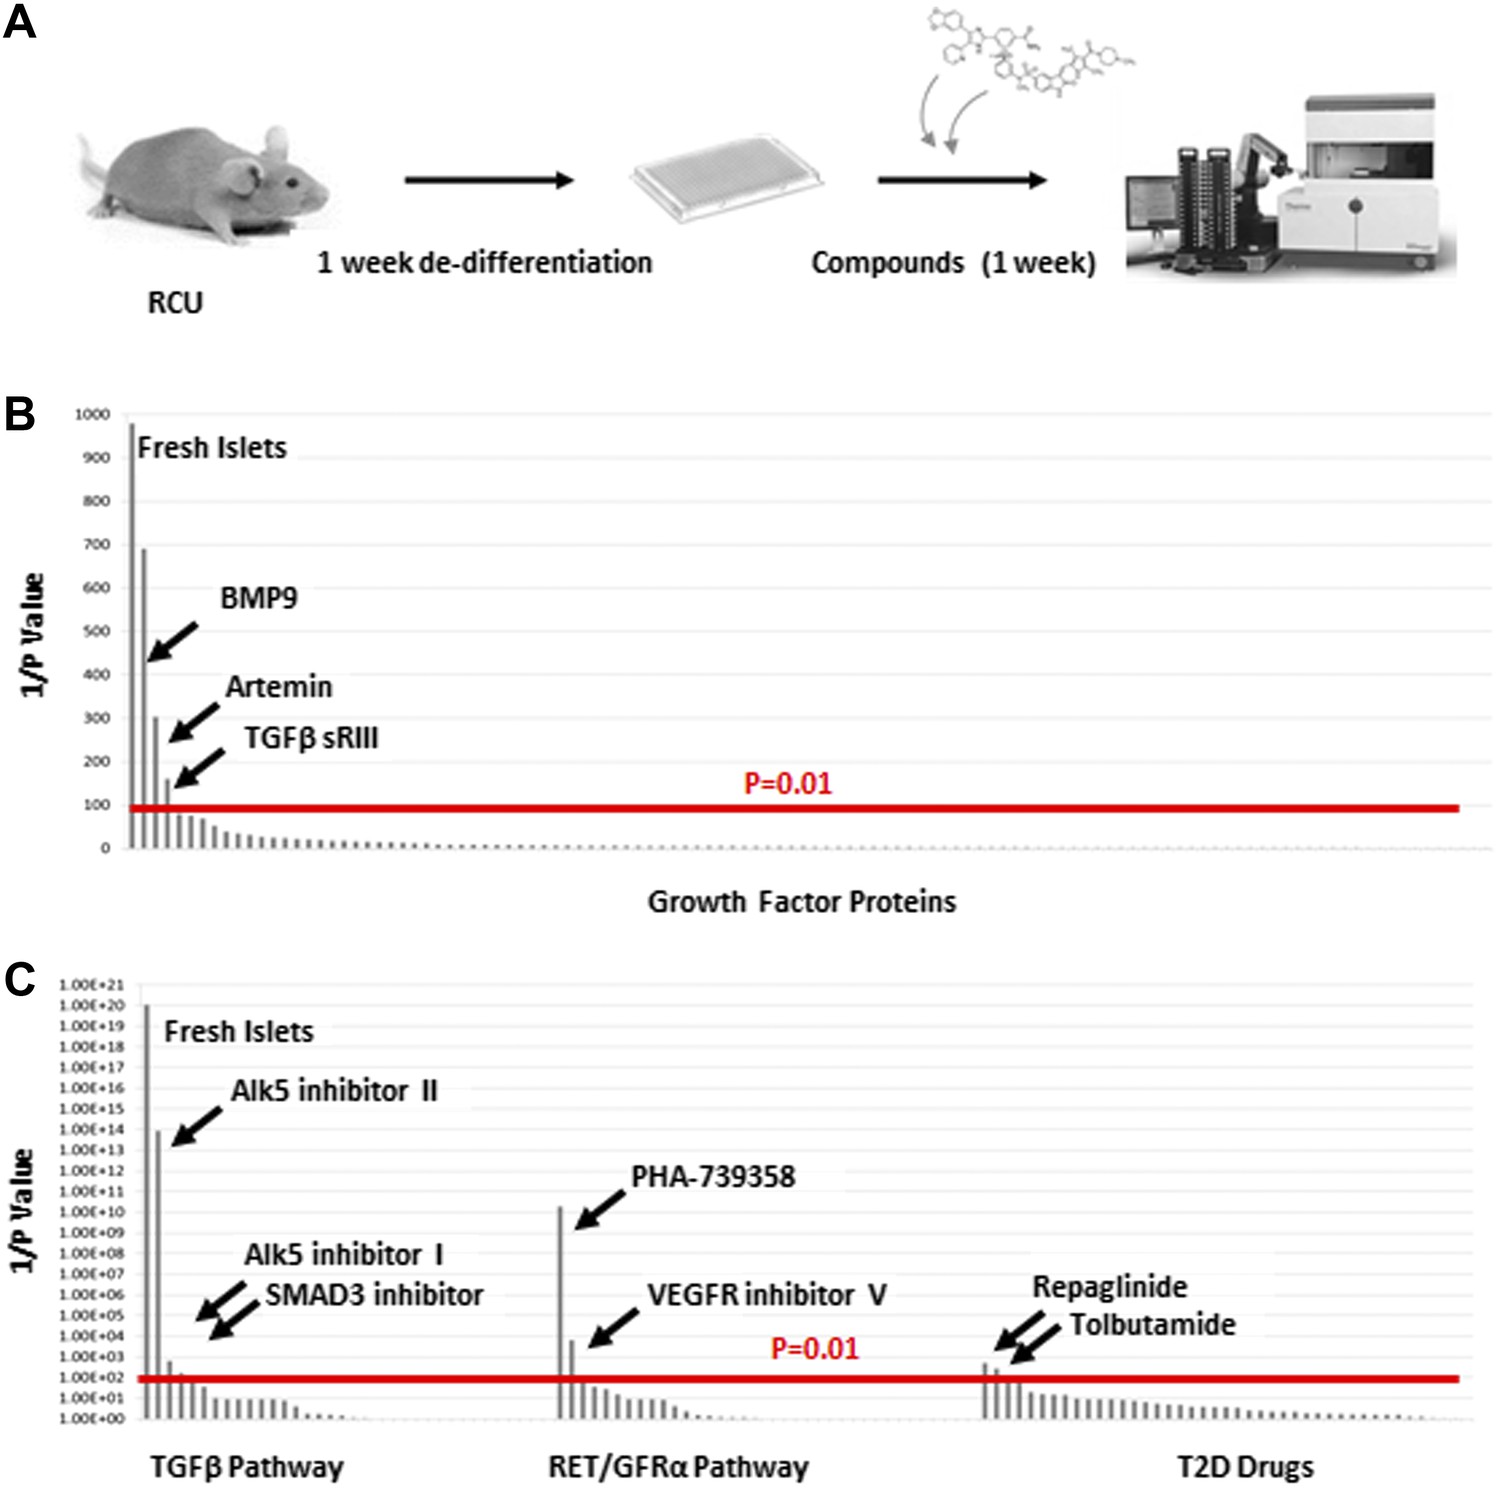
TGFβ pathway inhibitors and Artemin signaling reverse β cell de-differentiation.
(A) Islets from adult RCU mice are isolated and plated on 804G matrix for 1 week in a 384-well plate format during which time the β cells de-differentiate. A compound library is added on day 7, and islets are cultured for an additional week in the presence of compounds. Each compound is tested in duplicates of two or three concentrations. Fresh un-manipulated RCU islets are used as a positive control, and DMSO- or untreated islets are used as negative controls. Islets are fixed on day 11 for automated imaging and subsequent analysis. Percentages of mCherry positive cells that co-express GFP are calculated for each well and used to identify conditions that significantly increase the number of GFP positive cells over negative (DMSO- or non-treated) controls. Positive hits are selected according to their statistical significance (p value) over the negative control. (B) Results of screen with 114 growth factor proteins. Factors are ordered from left to right based on the p-value of their Ucn3-GFP fluorescence over the negative (non-treated) control. For convenience, values on the Y axis are presented as 1/p-value. Red bar represents the threshold for statistical significance (p < 0.01). (C) Results of screen with 19 TGFβ pathway inhibitors, 18 RET/GFRα3 inhibitors, and 42 known T2D drugs. Factors are ordered from left to right based on the statistical p-value of their Ucn3-GFP fluorescence over the negative (DMSO-treated) control as above. For convenience, values on the Y axis are presented as 1/p-value. Red bar represents the threshold for statistical significance (p < 0.01). A full list of the factors tested is presented in the Supplementary file 1.
Figure 5 with 1 supplement
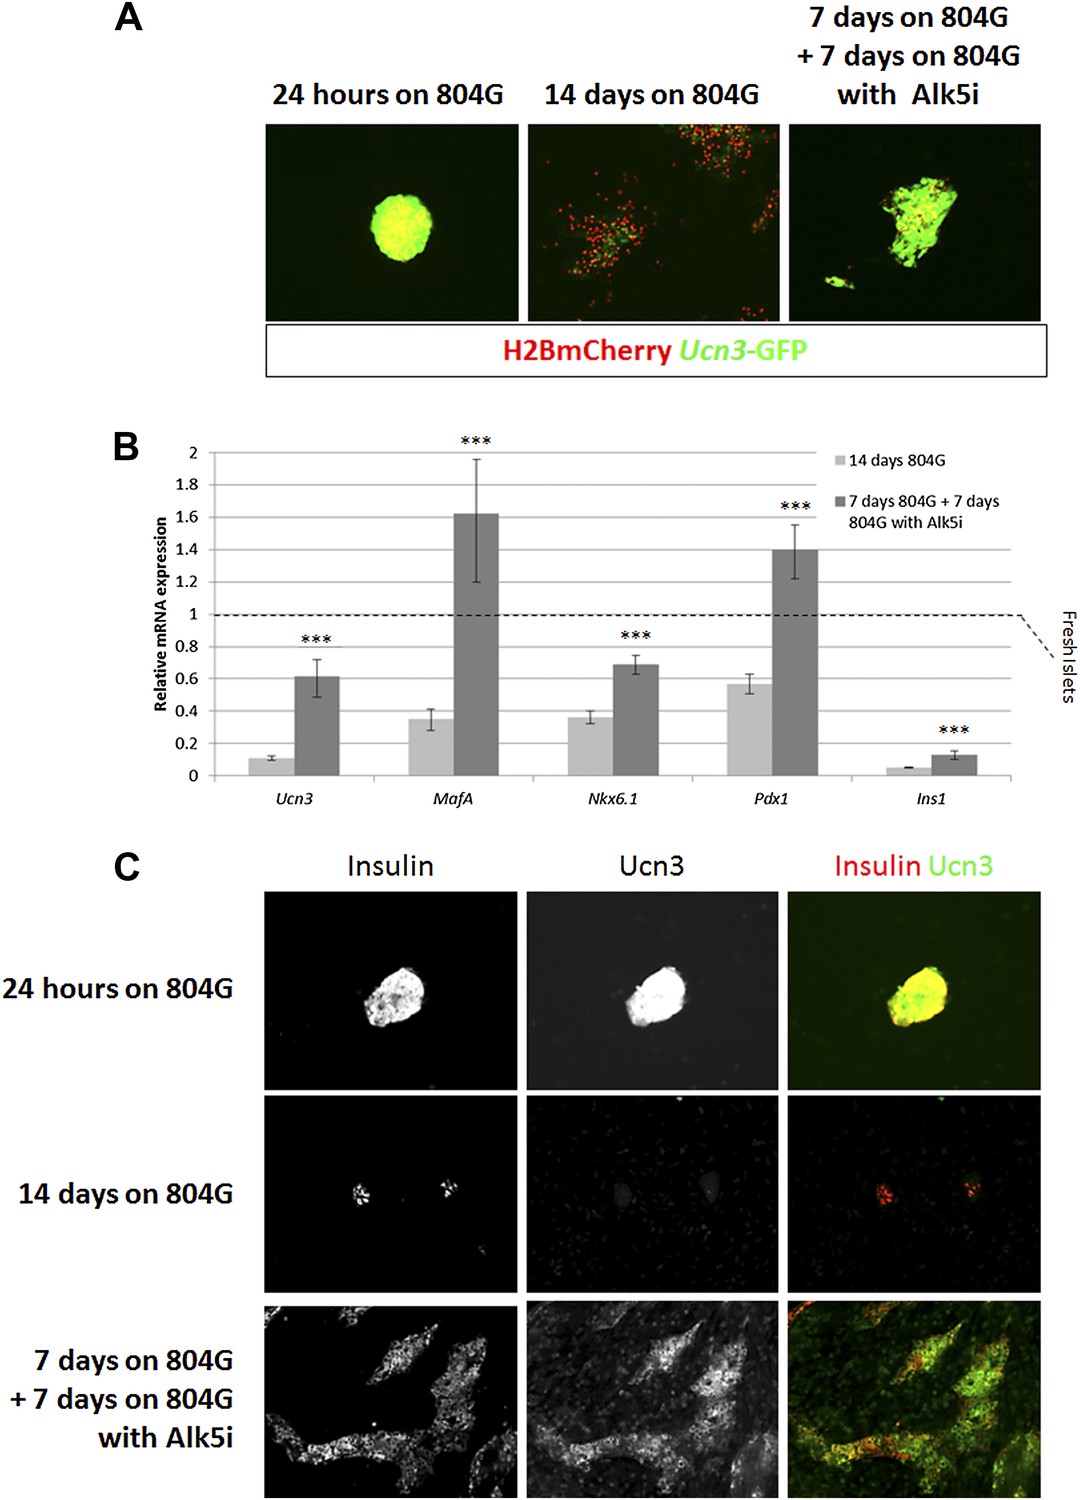
Alk5 inhibitor II restores β cell maturation in 804G-induced β cell de-differentiation.
(A) Islets from adult RCU mice were isolated and plated on 804G matrix for 14 days with or without the addition of Alk5i at day 7 (right and middle panels, respectively). Live fluorescence images of H2BmCherry and Ucn3-GFP were taken on day 14, and compared to fresh RCU islets cultured on 804G for 24 hr. (B) H2BmCherry-positive cells from the above cultured were sorted by FACS and subjected to qRT-PCR analysis for the expression of various mature β cell genes. Statistical significance relates to the difference between Alk5i-treated and non-treated islets for each gene. Expression levels are normalized to the levels of freshly isolated islets (dashed line). Error bars represent ±SEM of three biological repeats. ***p < 0.001. B.G. (C) Immunostaining with antibodies against insulin (red) and Ucn3 (green) in islets from ICR mice treated as above.
Figure 5—figure supplement 1
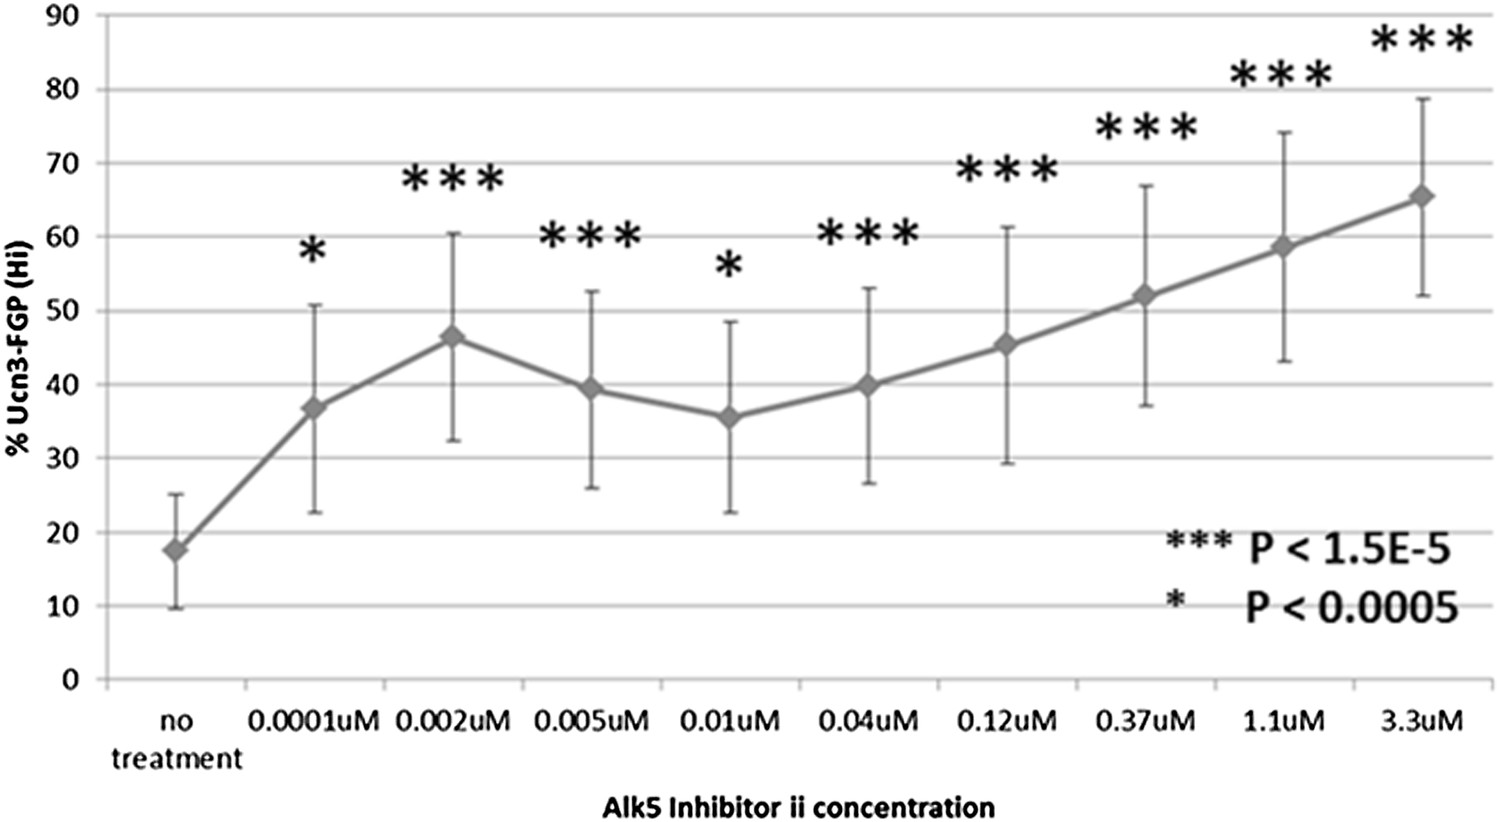
Alk5 inhibitor II induces Ucn3-GFP in RCU islets in a dose-dependent manner.
Shown is a dose-curve for the induction of Ucn3-GFP in RCU islets de-differentiated on 804G matrix for 1 week, following by 1 week treatment with the indicated concentration of ALk5 inhibitor II. Bars represent ±S.D.
Figure 6 with 1 supplement
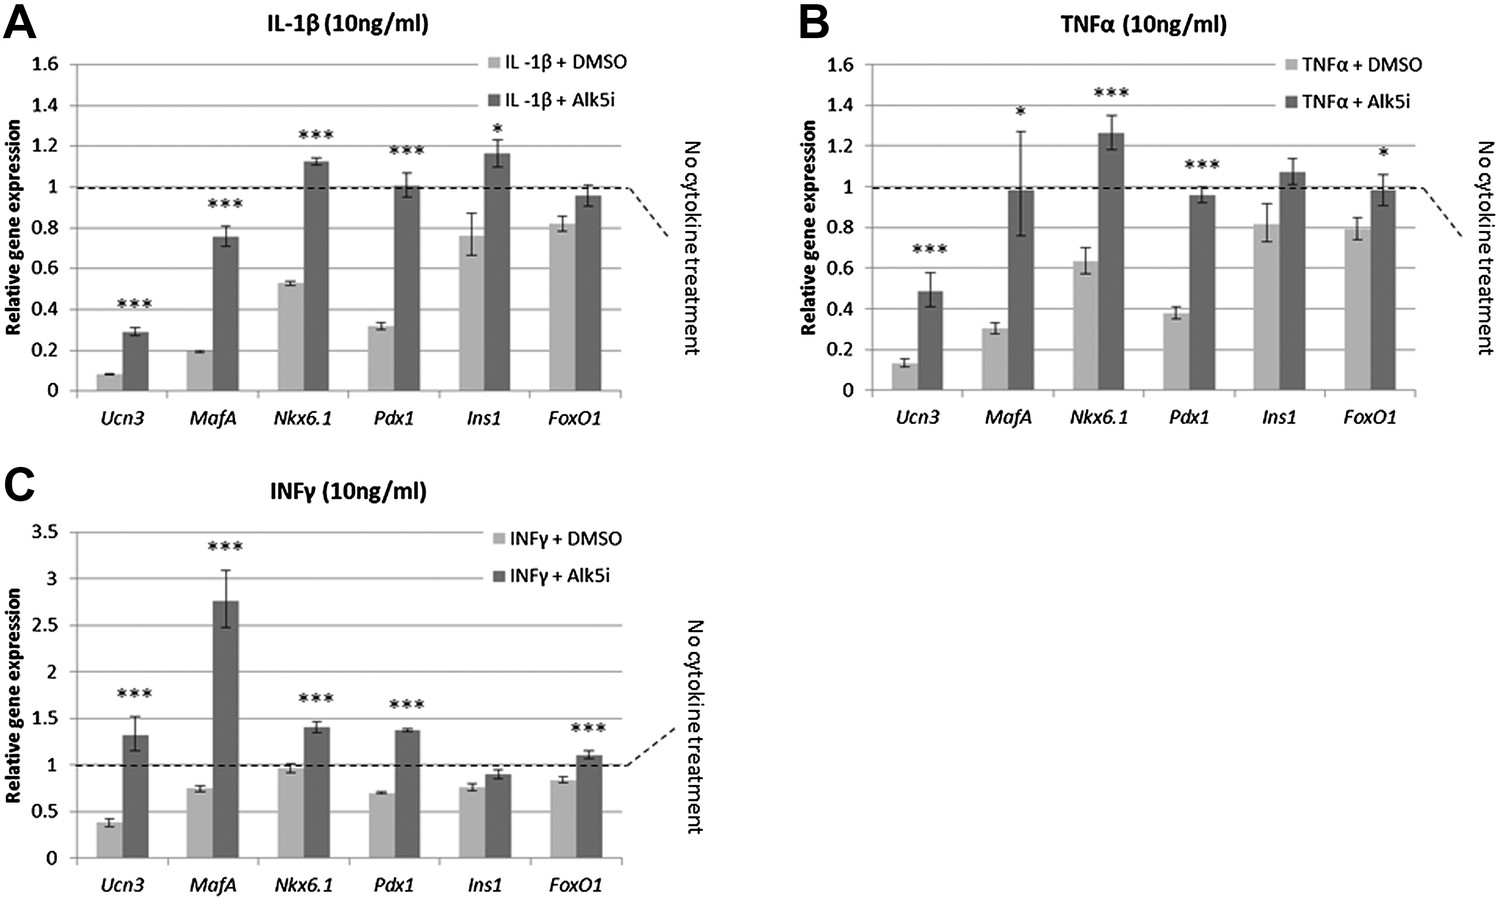
Alk5 inhibitor II induces expression of mature β cell transcription factors and prevents their reduction under cytokine stress.
Quantitative Real-Time PCR analysis of gene expression in wild-type islets treated with cytokines as shown (A) IL-β, (B) TNFα, (C) INFγ. Each bar represents average gene expression in three independent experiments. Expression levels are normalized to the levels of control islets not treated with any cytokine (dashed line). Statistical significance relates to the difference between Alk5i-treated and DMSO-treated islets for each gene. Error bars represent ±SEM. *p < 0.05; ***p < 0.005.
Figure 6—figure supplement 1
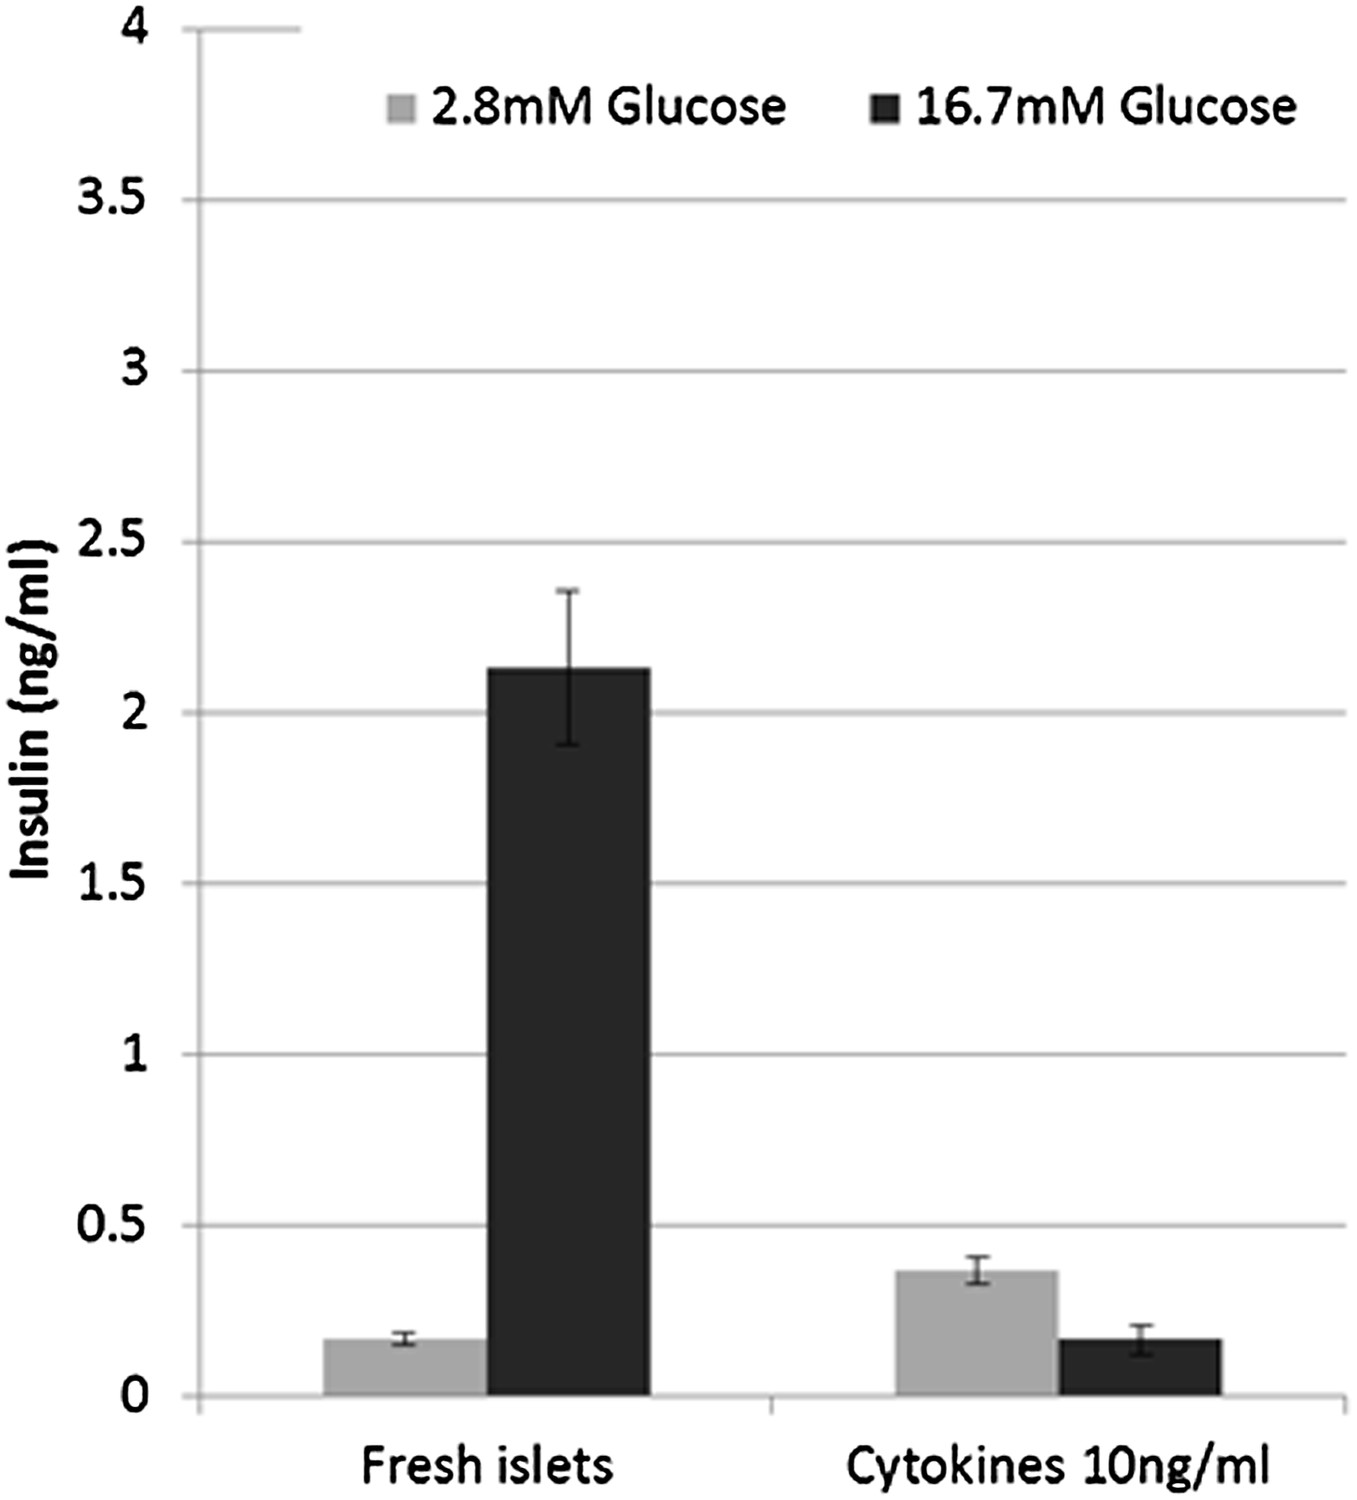
β cells lose glucose-stimulated insulin secretion upon cytokine treatment.
Shown are static GSIS analyses of adult islets treated with a combination of IL-1β, TNFα, and INFγ (10 ng/ml each). Each bar represents insulin secretion in three biological repeats.
Figure 7
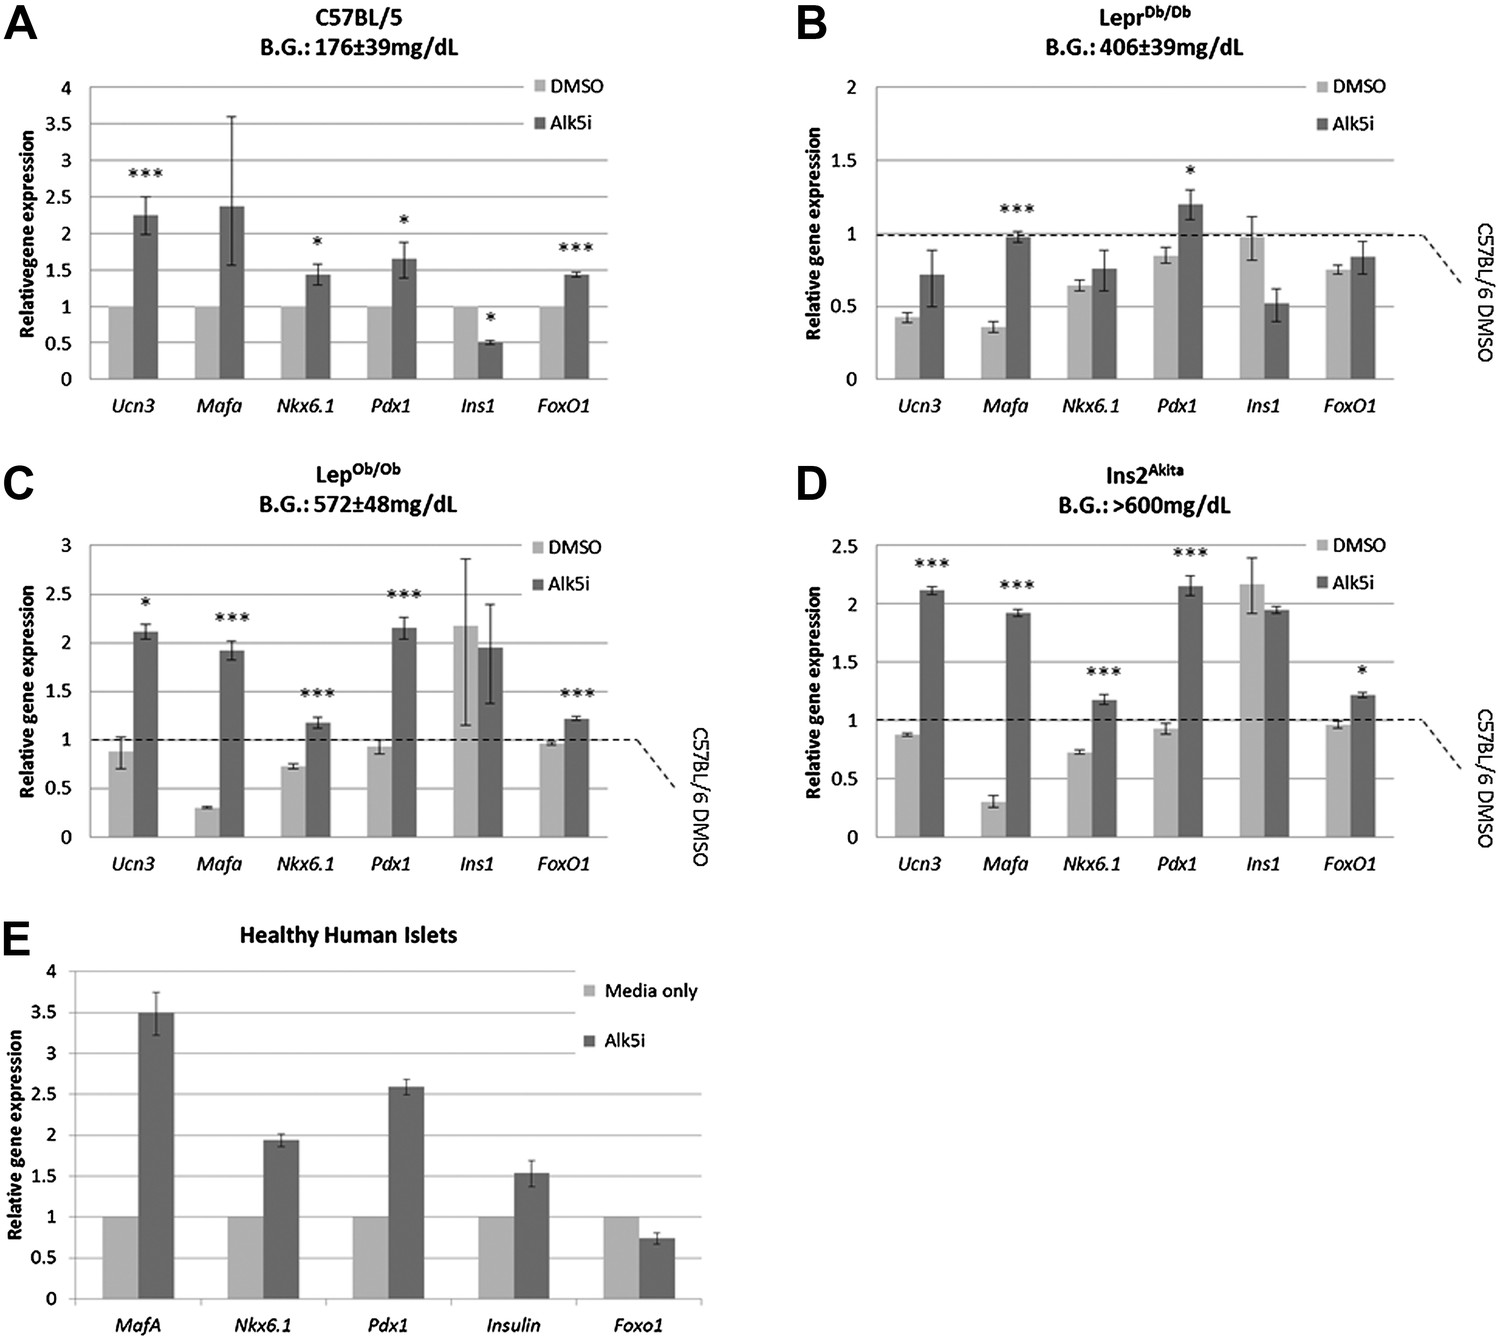
Alk5 inhibitor II induces expression of mature β cell transcription factors even in β cells that were exposed to extreme diabetic conditions for several months.
(A–D) Alk5 inhibitor II (Alk5i) induces expression of specific β cell genes in islets from healthy and severely diabetic mice. Shown are quantitative Real-Time PCR analysis of gene expression in islets of healthy control (C57BL/6) and diabetic mice (LeprDb/Db, LepOb/Ob, and Ins2Akita). Each bar represents average gene expression in three independent experiments for each group. Statistical significance relates to the difference between Alk5i-treated and DMSO-treated islets for each gene. Expression levels are normalized to the levels of C57BL/6 islets treated with DMSO (dashed line). Error bars represent ±SEM. *p < 0.05; ***p < 0.005. B.G. = Blood glucose level at time of sacrifice. (E) Alk5 inhibitor II (Alk5i) induces expression of specific β cell transcription factors in human islets. Shown are quantitative Real-Time PCR analyses of gene expression. Error bars represent three technical repeats on islets from a single donor. Error bars represent ±SEM.
Additional files
-
Supplementary file 1
A list of all compounds used in the automated screen. (A) Listed are all growth factors used in the initial screen (Figure 4B) (B) Listed are all small molecules used in the secondary screen (Figure 4C). Working concentration (ng/ml for growth factors and µM for small molecules), percentage of Ucn3-GFP positive cells and p value of all replicates are listed for each compound.
- https://doi.org/10.7554/eLife.02809.016
Download links
A two-part list of links to download the article, or parts of the article, in various formats.
Downloads (link to download the article as PDF)
Open citations (links to open the citations from this article in various online reference manager services)
Cite this article (links to download the citations from this article in formats compatible with various reference manager tools)
Reversal of β cell de-differentiation by a small molecule inhibitor of the TGFβ pathway
eLife 3:e02809.
https://doi.org/10.7554/eLife.02809


