Potassium dependent rescue of a myopathy with core-like structures in mouse
- University of Colorado, Anschutz Medical Campus, United States
Figures
Figure 1
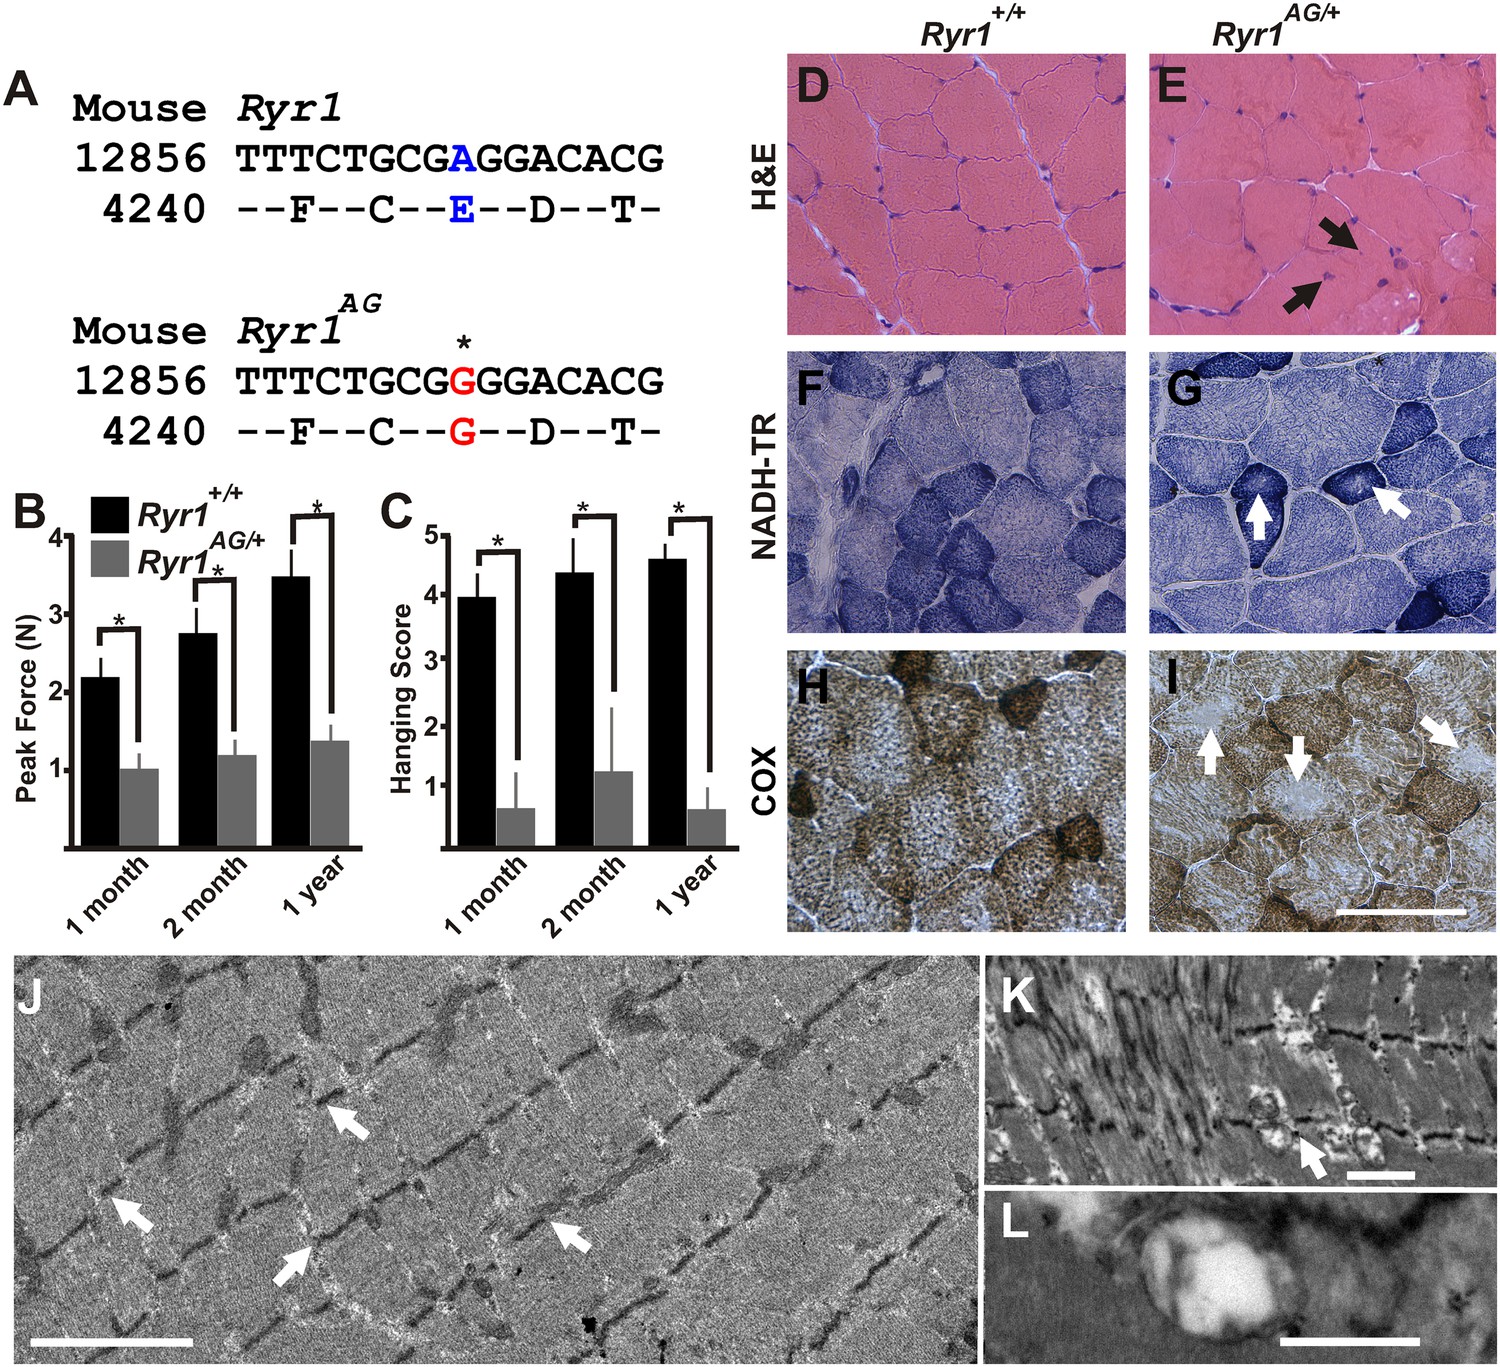
ENU-induced Ryr1AG mutation mimics clinical and pathological features of CCD in heterozygous mice.
(A) Missense mutation in exon 93 of Ryr1 changes A to G, resulting in substitution of glutamic acid with glycine (E4242G). (B) Average grip strength assayed using vertical digital push–pull strain gauge on Ryr1+/+ and Ryr1AG/+ mice at different ages raised on control 0.6% potassium diet. (C) In vivo hanging task determination of upper-body strength of Ryr1+/+ and Ryr1AG/+ mice at different ages (B, C, 10 trials/mouse, n = 5 per set). (D, E) H&E staining indicate central nuclei (arrows) in Ryr1AG/+ (E) but not Ryr1+/+ (D) vastus lateralis muscle from 1-year old mice raised on control 0.6% potassium diet. (F, G) NADH-TR staining indicates cores (white arrows) in 1-year old vastus lateralis of RyR1AG/+ but not Ryr1+/+. (H, I) Cytochrome oxidase (COX) staining denotes a decrease in mitochondrial function (white arrows) in vastus lateralis muscle of Ryr1AG/+ (I) compared to Ryr1+/+ (H). Scale bar = 50 μm. (J–L) Transmission electron microscopy of 2-month old Ryr1AG/+ soleus muscle. (J, K) Regions of Z line streaming and associated sarcoplasmic disruption and cores (white arrows) of myofibrils. (L) Enlarged T-tubules are present in type I fibers (scale bars: J = 1 μm; K = 2 μm; L = 0.2 μm ).
Figure 2
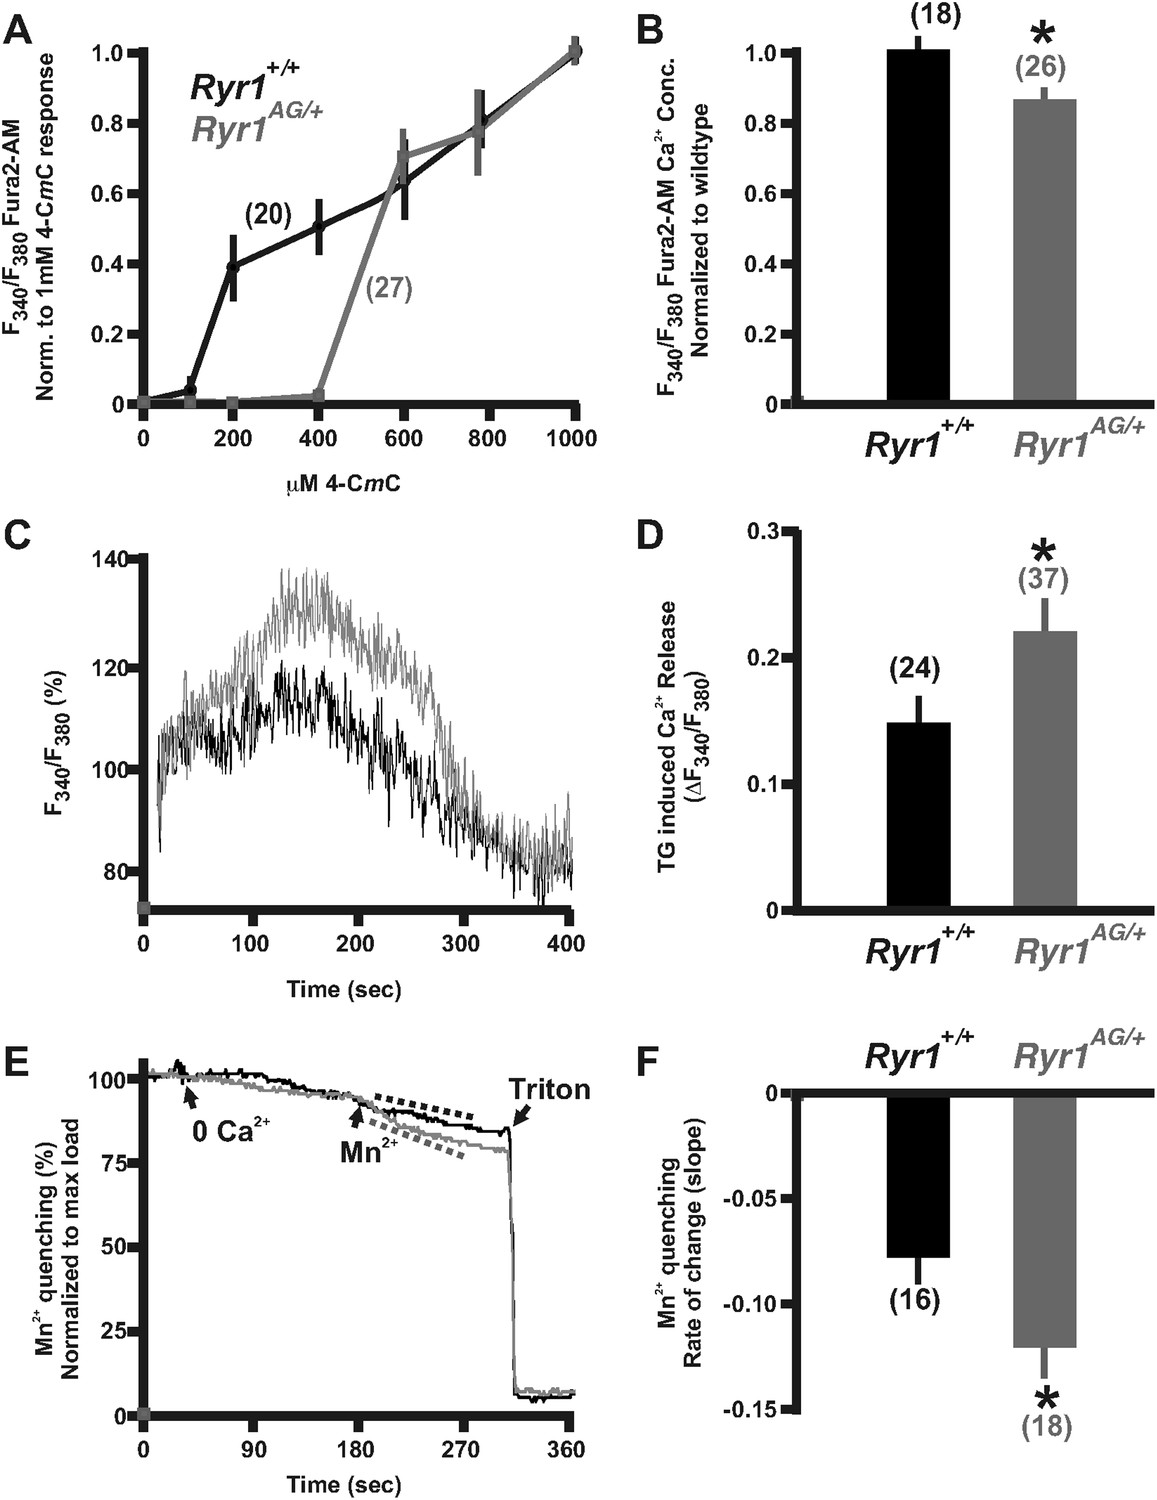
Calcium homeostasis is disrupted in Ryr1AG/+ muscle.
Fura-2 ratiometric imaging of myoplasmic Ca2+ in 2-month old muscle. (A) Ratiometric analysis of 4-CmC sensitivity in soleus muscles of wild-type (black) and Ryr1AG/+ littermates (grey). (B) Average ratiometric analysis of myoplasmic Fura-2 signal normalized to wild-type signal (n above bar represents number of analyzed fibers). (C) Representative fura-2 ratiometric signal of muscle fibers showing percent change after addition of 20 μM thapsigargin (TG) from wild-type (black) and Ryr1AG/+ (grey) littermate. (D) TG induced maximum response in muscle fibers (n above bar represents number of analyzed fibers). (E, F) Representation and quantification of Mn2+ quenching of Fura-2 fluorescence ratiometric signal illustrating increased influx of store operated calcium entry in soleus muscle fibers of Ryr1AG/+ (grey) muscle fibers compared to wild-type (black) muscle fibers (dash lines represent slope). In (E), arrows indicate when media was introduced with 0 Ca2+ followed by 0.5 mM Mn2+.
Figure 3
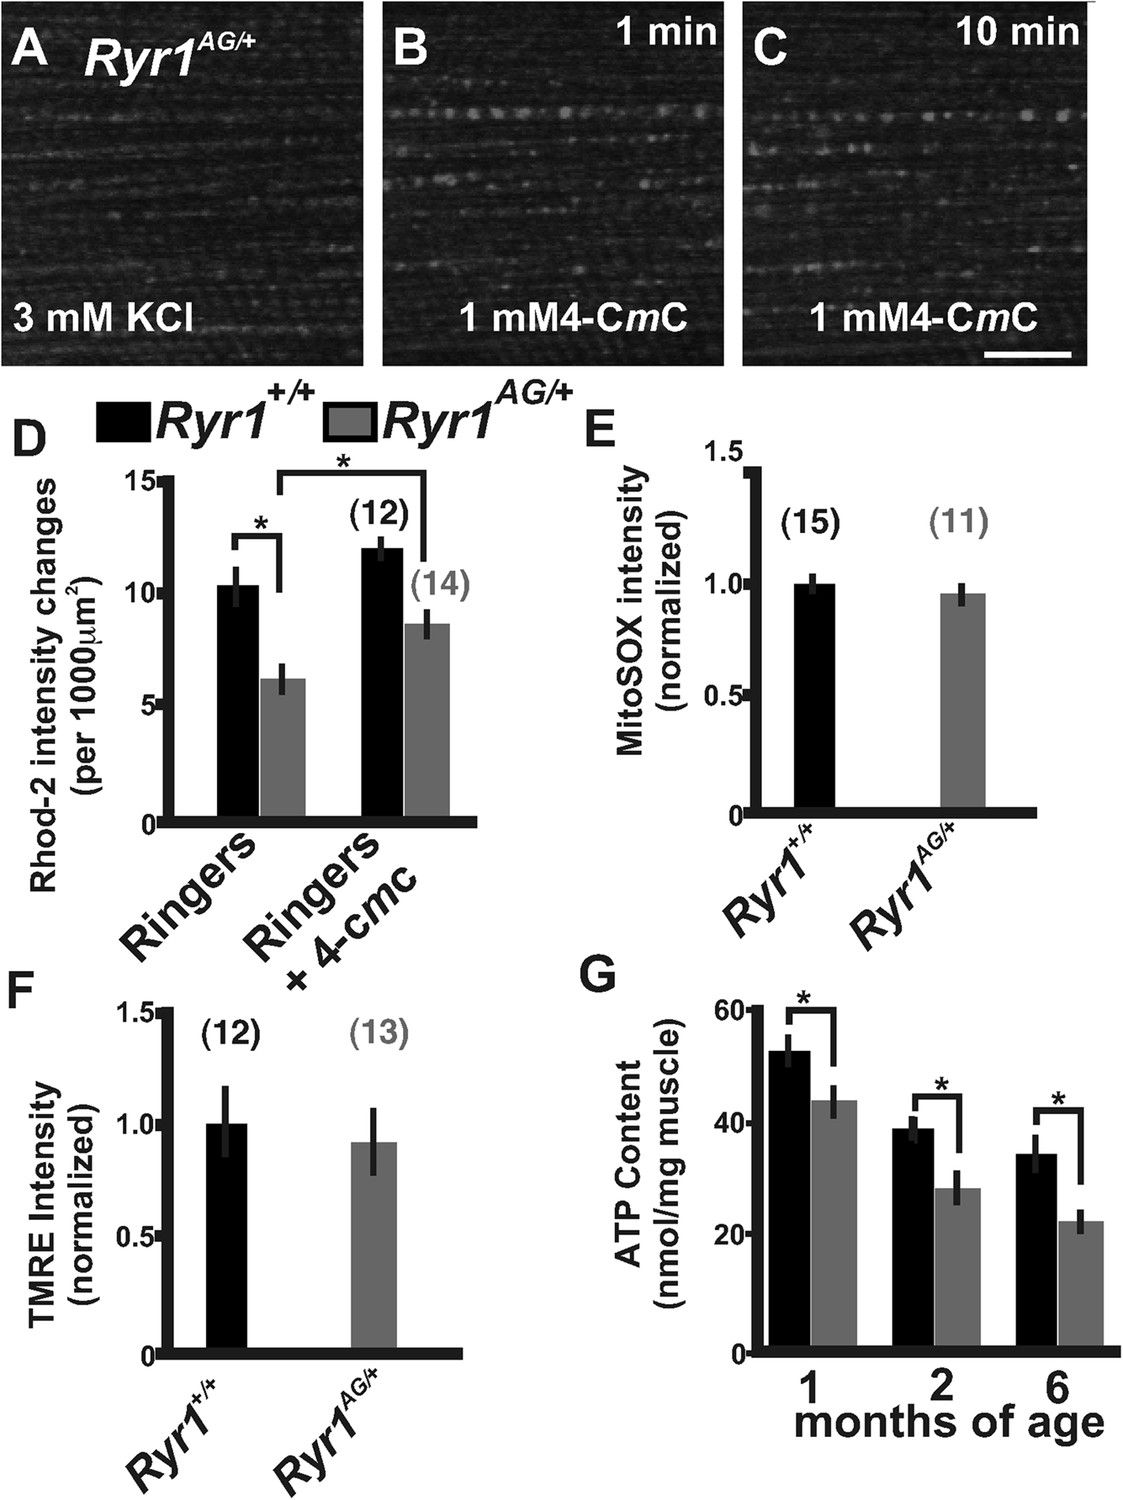
Defects in mitochondrial function in Ryr1AG/+ mice.
(A–C) Representative isolated fiber with Rhod2 fluorescence of 2-month old Ryr1AG/+ in 3 mM KCl (A) and 1 min (B) and 10 min (C) after application of 1 mM 4-CmC (punctate fluorescence are calcium marks). (D) Quantification of mitochondrial calcium marks visualized with Rhod2-AM from isolated soleus muscle fibers from Ryr1+/+ (black bars) and Ryr1AG/+ (gray bars) mice. (E) Superoxide labeling of isolated muscle fibers from Ryr1+/+ and Ryr1AG/+ mice. (F) Intensity of TMRE labeling of isolated soleus muscle fibers from Ryr1+/+ and Ryr1AG/+ littermates with saponin. The numbers on top of bars in graphs represent number of fibers examined. (G) ATP content from Ryr1+/+ and Ryr1AG/+ isolated soleus muscle from age-matched mice (n = 4 for each age and group). Scale bar = 5 μm.
Figure 4 with 1 supplement
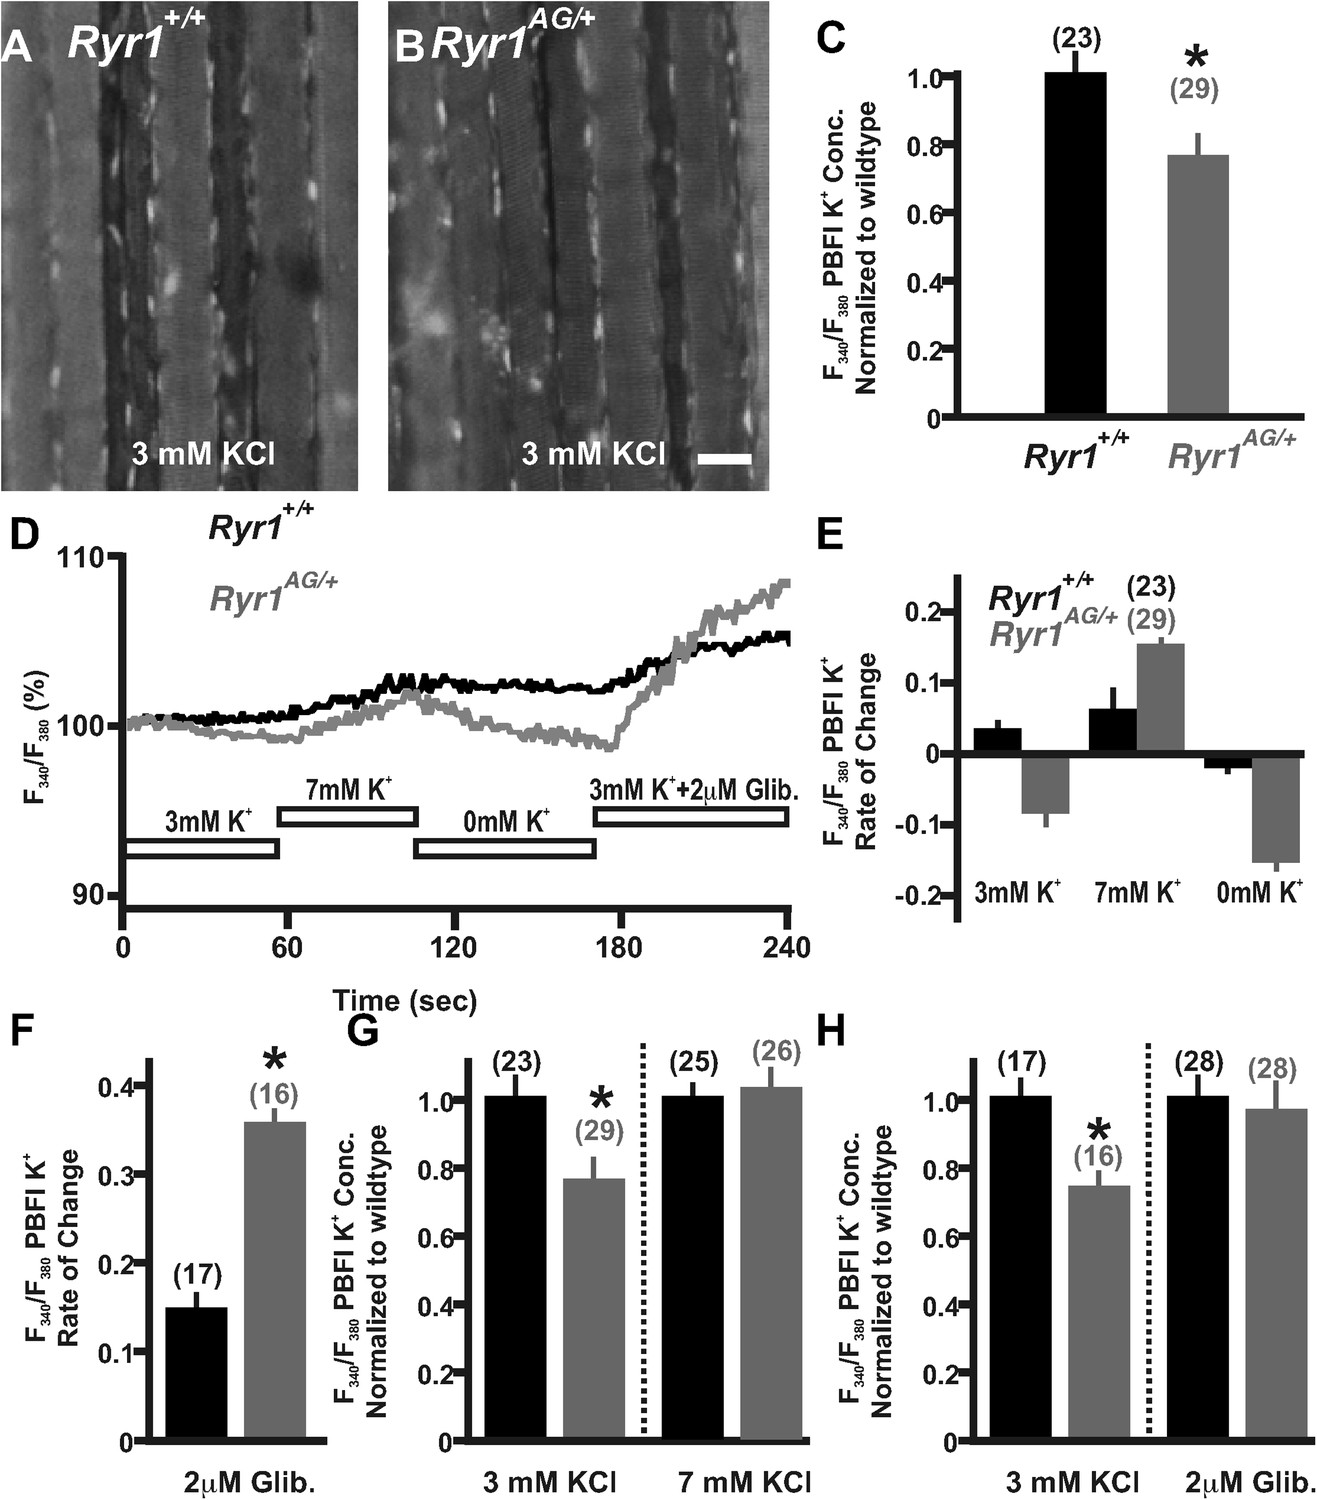
Detection and compensation of an internal potassium leak in RyR1AG/+ muscle.
Fluorescence imaging of PBFI at 340 nm in Ryr1+/+ (A) and Ryr1AG/+ (B) soleus muscle in 3 mM Ringer's solutions. (C) Ratiometric potassium imaging obtained at 340 and 380 nm wavelengths provided a ratio of fluorescence in Ryr1+/+ (black) and Ryr1AG/+ (grey) soleus muscle (normalized to Ryr1+/+). (D) Representation of the ratiometric imaging experimental paradigms used in Figure 4 showing bath applications of 3 mM KCl, 7 mM KCl, 0 mM KCl, and 3 mM KCl with 2 μM glibenclamide in Ringer's solutions. (E) Slope of intracellular K+ fluorescence intensities in experimental conditions. (F, H) Normalized intracellular K+ concentration in Ryr1+/+ (black) and Ryr1AG/+ (grey) soleus muscle in 3 mM KCL (F, H) compared to soleus from contralateral limb in 7 mM KCl Ringer's solutions (F) or 3 mM KCL plus 2 μM Glibenclamide (H) (muscle was bathed in solutions for 1.5 hr before imaging, n is the number of fibers examined from four mice). (G) Rate of change in PBFI fluorescence after acute bath application of 2 μM Glibenclamide. Scale bar = 20 μm.
Figure 4—figure supplement 1
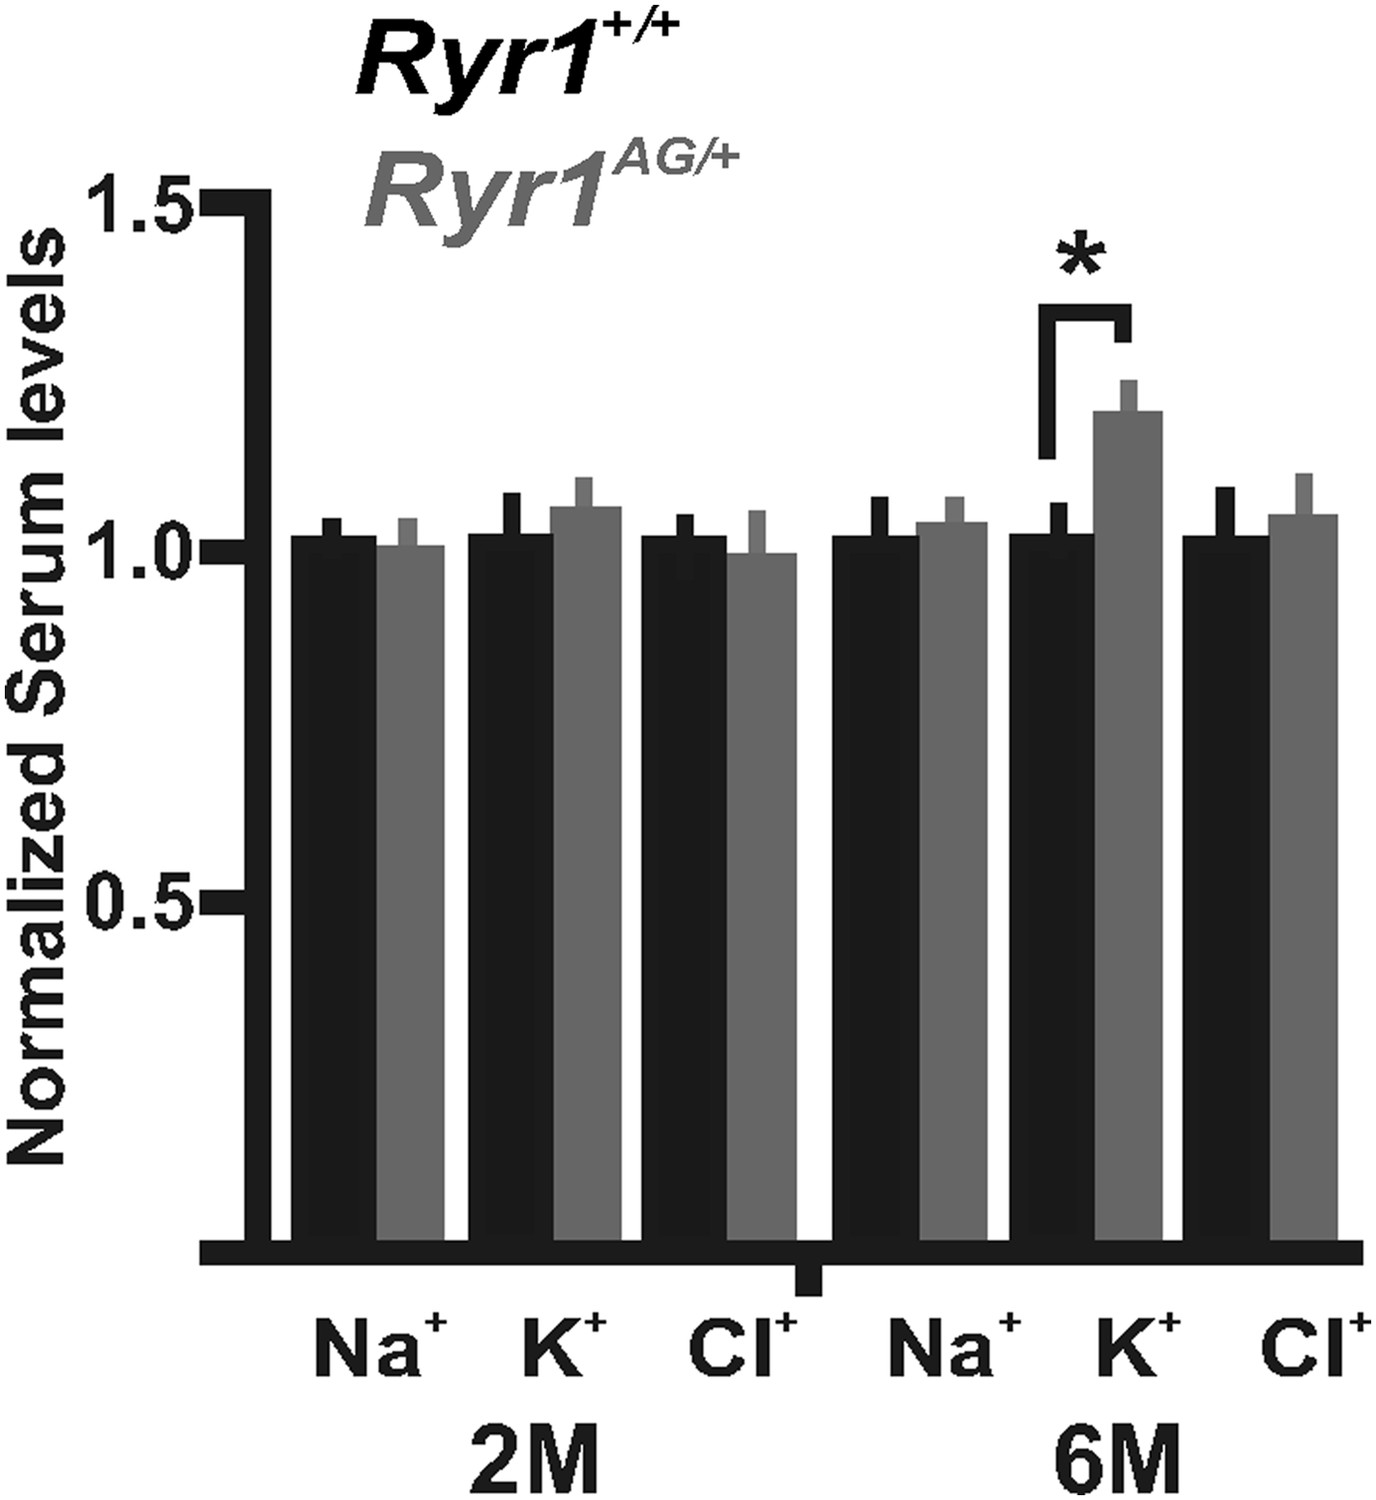
Serum level measurements from Ryr1+/+ (black bars) and Ryr1AG/+ (grey bars) in 2- and 6-month old mice.
Measurements of serum levels were performed on Ryr1+/+ (black bars) and Ryr1AG/+ (grey bars) in 2- and 6-month old mice (n = 6 samples per group per age for Ryr1+/+ and Ryr1AG/+).
Figure 5

Altered activity of KATP channels involved in potassium transport.
(A) Western blots of membrane enriched lysate (that lacks mitochondria, peroxisomes, and lysosomes) from 2-month old wild-type and heterozygous Ryr1AG/+ soleus muscle analyzed for KATP6.1, KATP6.2, and KIR2.1. (B) Quantification of protein levels from Western blots of membrane enriched lysates. Each sample was first normalized to its own loading control and then the values from mutant and wild-type on the same blot were compared. Statistical analyses were determined from a minimum of 3 blots and at least two independent samples (n = 4 for each Western). (C) KATP current densities of isolated soleus muscle fibers from 2-month old wild-type and Ryr1AG/+ littermates with and without glibenclamide. Numbers on top of bars are number of fiber recordings. (D–E) Representative current density recordings with the same tip resistance from Ryr1+/+ and Ryr1AG/+ soleus muscle fibers (E) with and (D) without 2 μM glibenclamide.
Figure 6 with 1 supplement
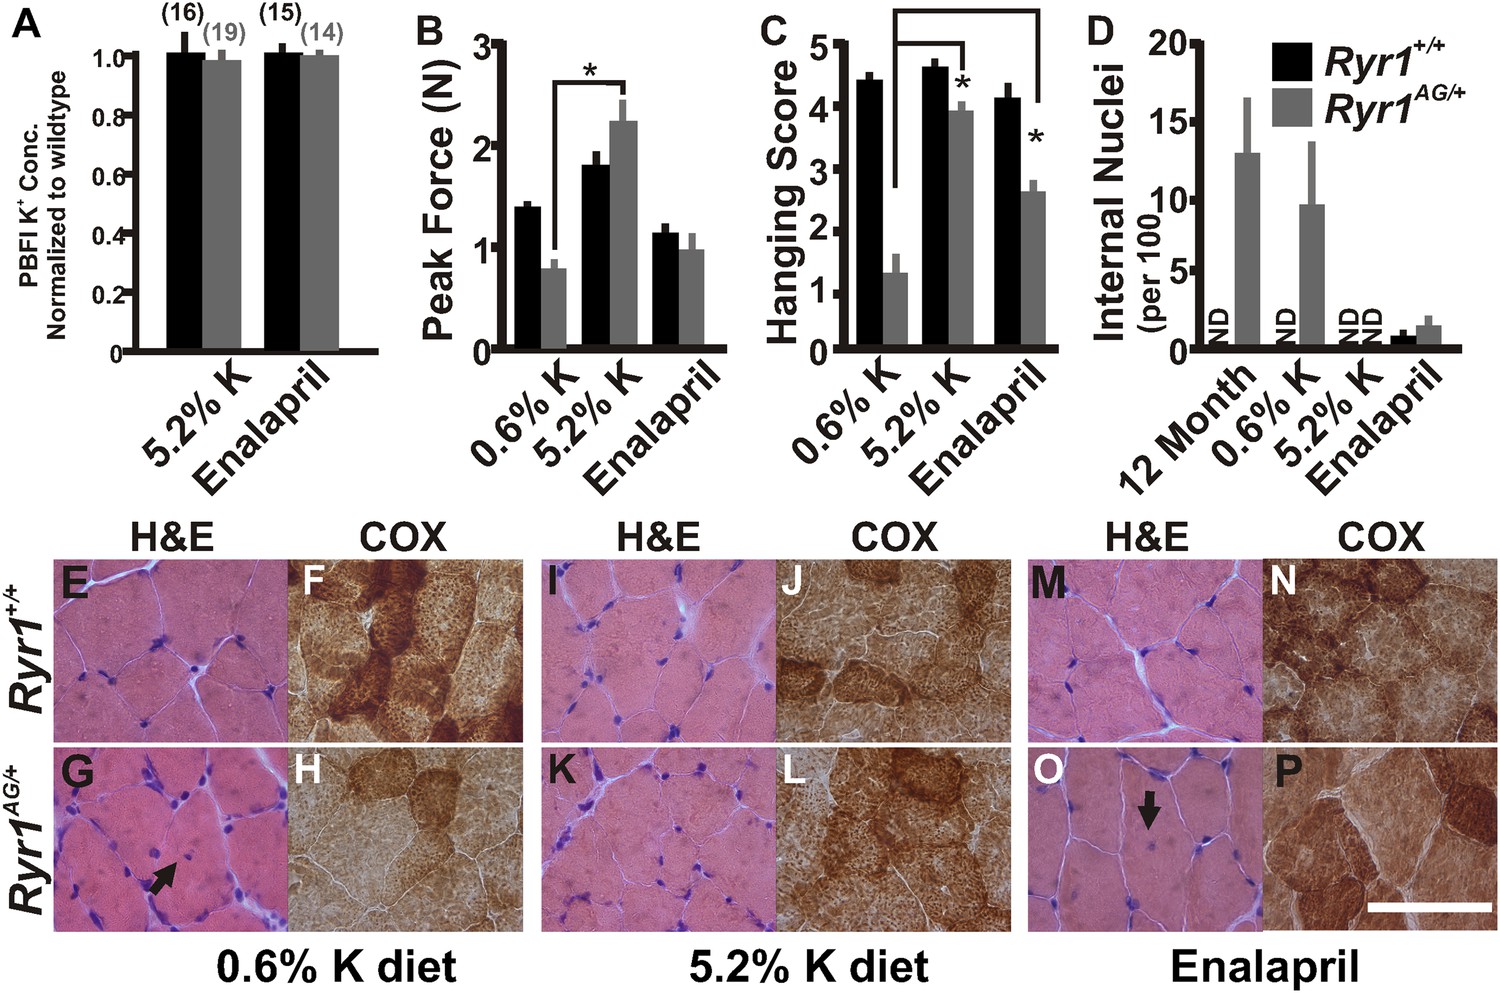
Increased potassium diet can rescue muscle strength and reverse the CCD histology and myopathy.
(A) Normalized internal potassium concentrations of soleus muscle from 2-month old Ryr1+/+ and Ryr1AG/+ mice fed 0.6% K+ diet for 4 weeks, then placed on 5.2% K+ diet or 0.6% diet + enalapril for 4 weeks, and then bath exposed to different extracellular potassium concentrations. (B, C) Average grip strength (B, five trials/mouse and 5 mice/set; p values <0.001) and in vivo hanging task (C, 10 trials/mouse, n = 5 per set; p values <0.001) assayed from 2-month old Ryr1+/+ (black bar) and Ryr1AG/+ (grey bar) mice maintained for 4 weeks on control 0.6% K+ diet, 5.2% K+ diet, or 0.6% K+ diet supplemented with enalapril. (D) Quantification of number of internalized nuclei per 100 myofibers in 12-month old mice or in 2-month old mice maintained for 4 weeks on control 0.6% K+ diet, 5.2% K+ diet, or 0.6% K+ diet supplemented with enalapril (n = 10 per muscle, n = 3 per set of muscles for total of n = 30; p values <0.001). (E–P) Vastus lateralis myofibers from 2-month old Ryr1+/+ and Ryr1AG/+ mice maintained for 4 weeks on control 0.6% K+ diet, 5.2% K+ diet, or 0.6% K+ diet supplemented with enalapril. Cross-sections stained with H&E (left panels) and COX (right panels). Ryr1AG/+ mice on 5.2% K diet show increased COX staining and no internalized nuclei, similar to Ryr1+/+. These pathological features are still observed in Ryr1AG/+ mice on 0.6% K+ diets. Enalapril increases COX staining but some internalized nuclei are observed, even in Ryr1+/+. Scale bar = 50 μm; error bars as standard error of the mean (SEM).
Figure 6—figure supplement 1
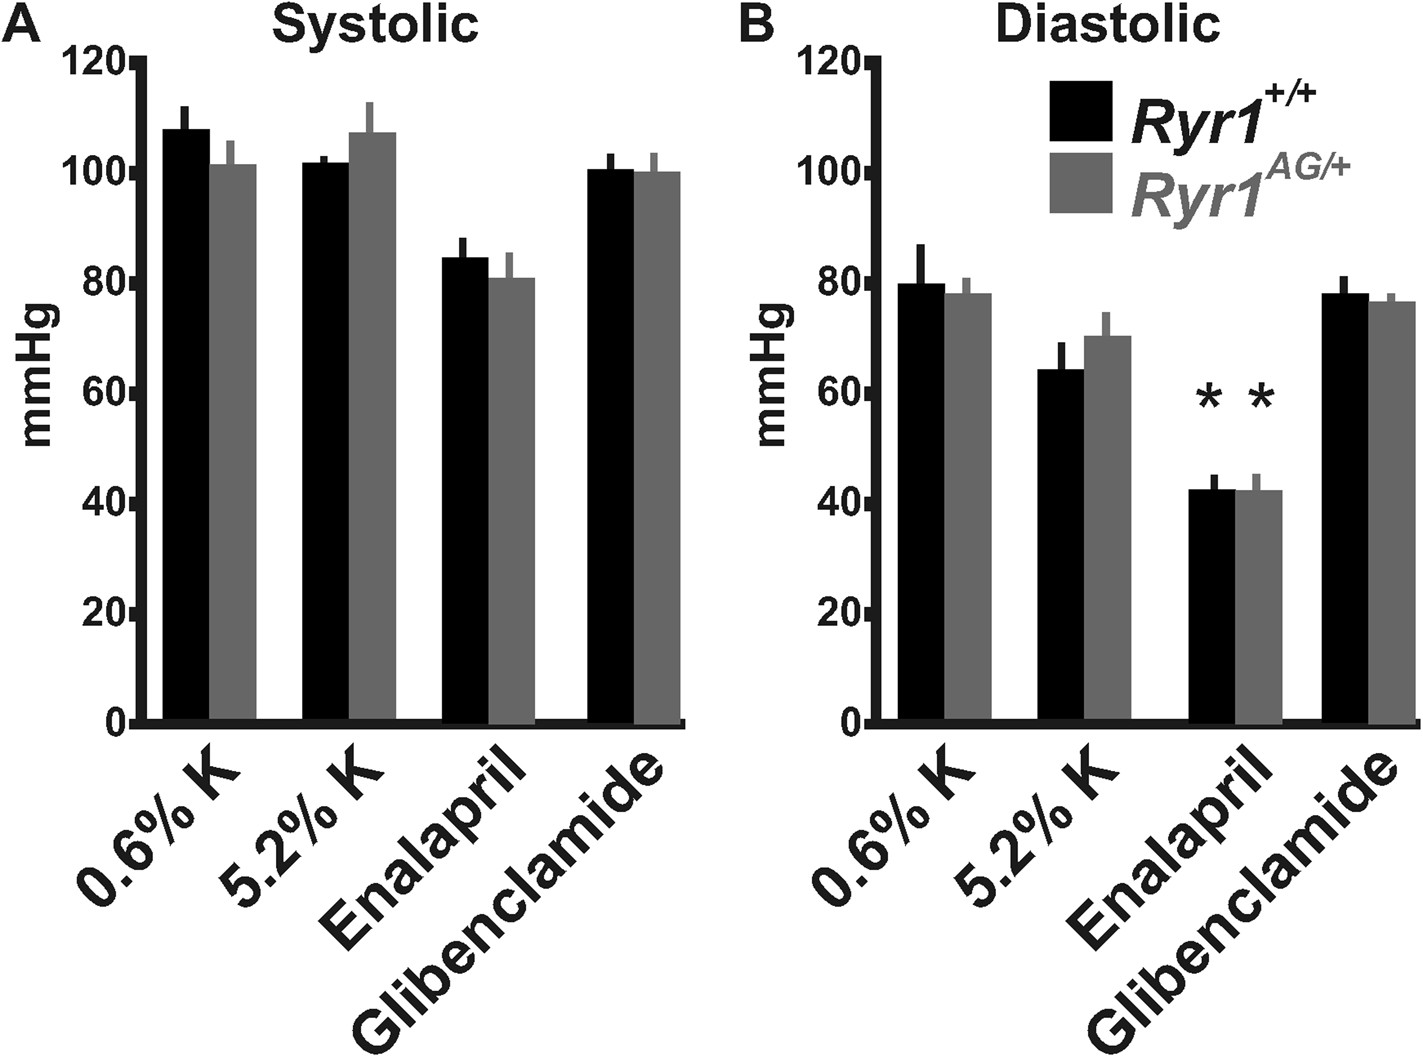
Blood pressure measurements from Ryr1+/+ (black bars) and Ryr1AG/+ (grey bars) in 2-month old mice.
Non-invasive measurements of systolic (A) and diastolic (B) blood pressure were performed using a Visitec-2000 tail-cuff apparatus. Measurements were taken for 3 days to acclimatize the animals for a more reproducible blood pressure measurement and then the data were collected on day 4.
Figure 7
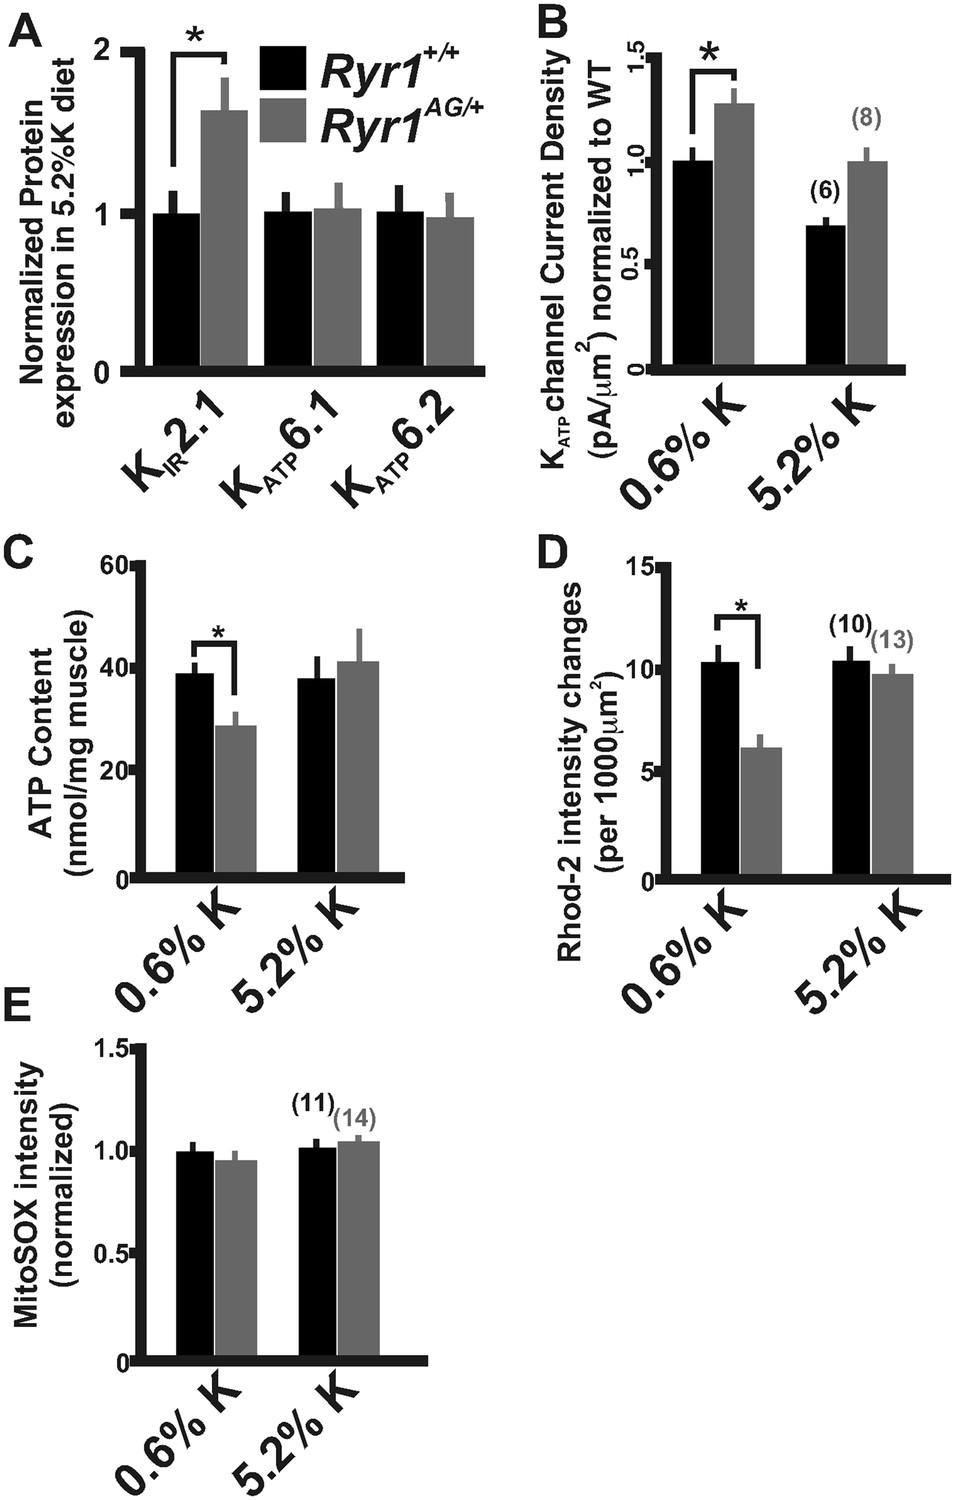
Increased potassium diet influences KATP channel activity and mitochondrial function.
(A) Membrane enriched lysate (lacking mitochondria, peroxisomes, and lysosomes) from soleus muscle of 2-month old Ryr1+/+ and Ryr1AG/+ mice fed 5.2% potassium supplemented diet for 4 weeks analyzed by Western blot for KATP6.1, KATP6.2, and KIR2.1 (* is p < 0.001). (B) KATP current densities of isolated soleus muscle fibers from Ryr1+/+ and Ryr1AG/+ littermates after 4 weeks on 5.2% K diet compared to 0.6% K diet. (C) ATP content from Ryr1+/+ and Ryr1AG/+ isolated soleus muscle from mice on 0.6% or 5.2% potassium diet. (D) Quantification of calcium marks visualized with Rhod2-AM from isolated soleus muscle from Ryr1+/+ and Ryr1AG/+ mice with and without diet therapy. (E) Superoxide labeling of isolated soleus muscle from Ryr1+/+ and Ryr1AG/+ mice with and without therapy. Error bars as standard error of the mean (SEM).
Figure 8
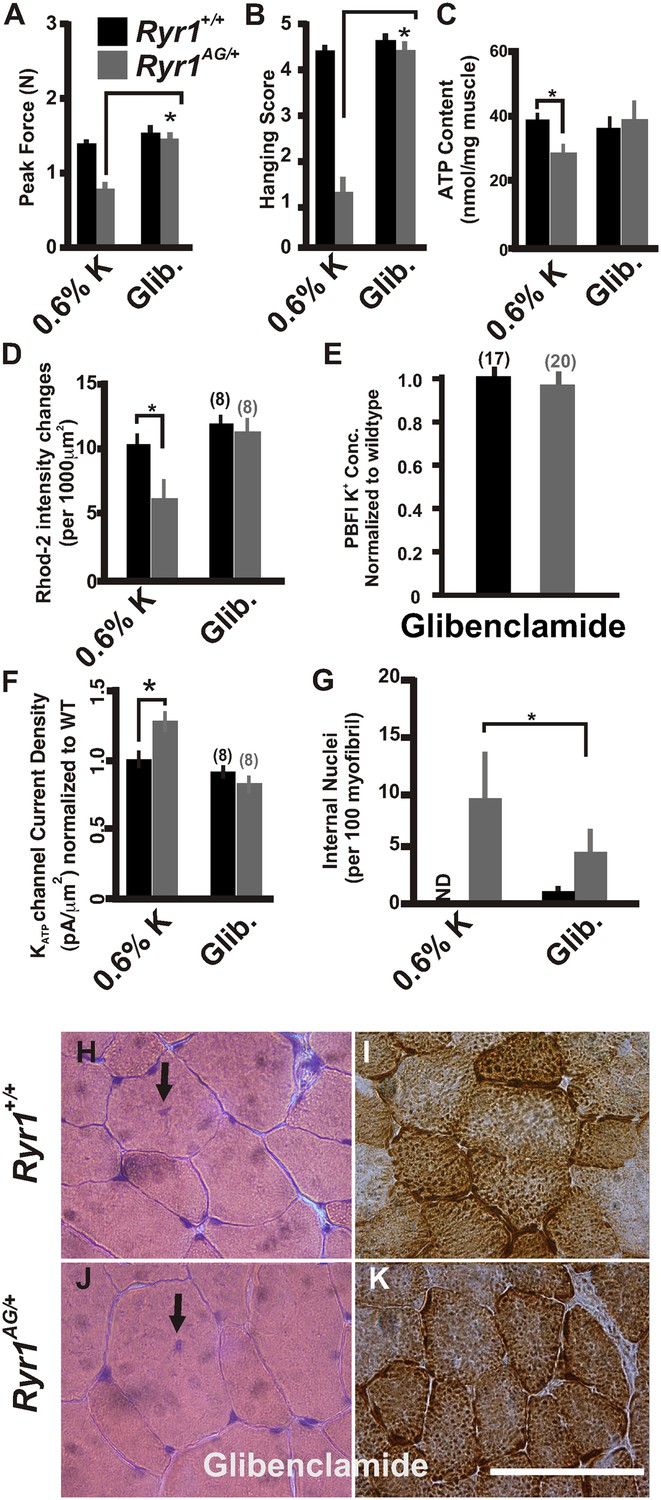
Inhibition of KATP channels can reverse the histological and myopathic phenotypes.
(A, B) Average grip strength (A, five trials/mouse and 5 mice/set; p values <0.001) and in vivo hanging task (B, 10 trials/mouse, n = 5 per set; p values <0.001) assayed from 2-month old Ryr1+/+ (black bar) and Ryr1AG/+ (grey bar) mice maintained for 4 weeks on 0.6% K diet and glibenclamide (15 mg/kg/day). (C) ATP content from soleus muscle of Ryr1+/+ and Ryr1AG/+ mice after 4 weeks on 0.6% K diet without or with glibenclamide (n = 4 muscles per condition). (D) Quantification of calcium marks visualized with Rhod2-AM from isolated soleus muscle from Ryr1+/+ and Ryr1AG/+ mice with and without glibenclamide therapy. (E) Normalized internal potassium concentrations after glibenclamide therapy. (F) KATP current densities of isolated soleus muscle fibers from Ryr1+/+ and Ryr1AG/+ littermates after 4 weeks on glibenclamide therapy compared to 0.6% K diet. (G) Quantification of number of internalized nuclei per 100 myofibers in all conditions (n = 10 per muscle, n = 3 per set of muscles for total of n = 30; p values <0.001). (H–K) Vastus lateralis myofiber from Ryr1+/+ and Ryr1AG/+ mice maintained for 4 weeks on glibenclamide. Arrow in Ryr1+/+ myofiber (F) shows the rare occurrence of internal nuclei. Cross-sections stained with H&E (left panels) and COX (right panels). Ryr1AG/+ mice on glibenclamide show increased COX staining, similar to Ryr1+/+. Scale bar = 50 μm; error bars as standard error of the mean (SEM).
Figure 9
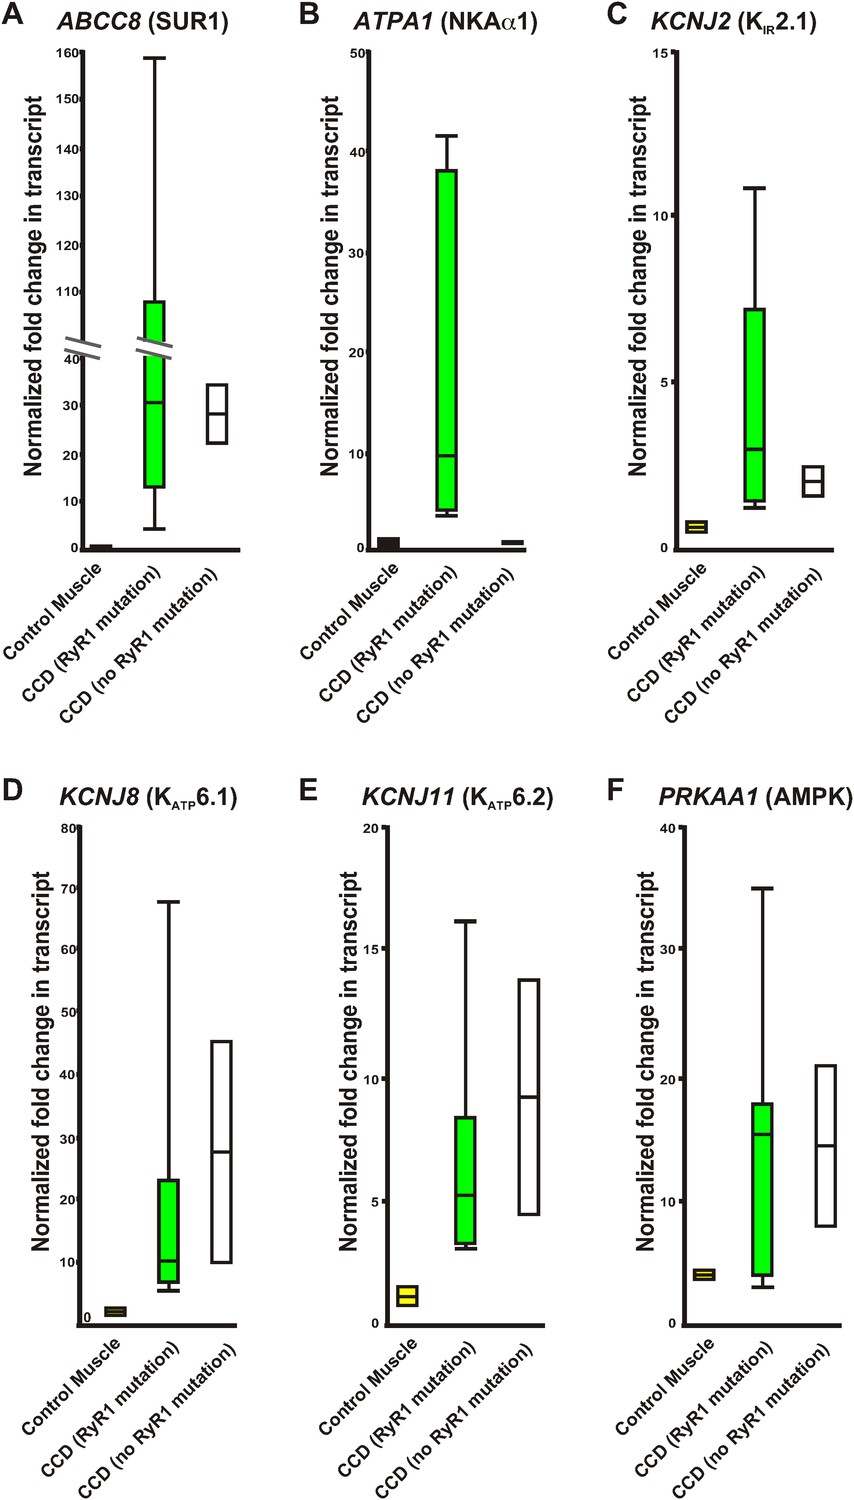
Relative variation of quantitative qRT-PCR of human control RNA and RNA from human muscle biopsies.
Whisker plots derived from the data in Table 2 of control muscle (yellow), congenital myopathy (CCD) with a mutation in RyR1 (green), and without a mutation in RyR1 (white). (A) ABCC8, (B) ATPA1, (C) KCNJ2, (D) KCNJ8, (E) KCNJ11, (F) PRKAA1. Values normalized to GAPDH before normalization to pooled control human muscle RNA.
Tables
Table 1
Core-like structures in type 1 muscle fibers of 1-year old RyR1AG/+ mice as revealed by NADH-TR and COX labeling
| NADH-TR negative cores | COX negative cores | |
|---|---|---|
| Vastus lateralis | 6.2 ± 2.4 | 7.8 ± 2.1 |
| Adductor magnus muscle | 9.3 ± 2.9 | 9.7 ± 2.2 |
| Soleus muscle | 8.9 ± 1.8 | 8.1 ± 1.4 |
-
Average values from 100 fibers with 10 slices per muscle and three muscles per group.
Table 2
Number of Z line streaming sites within 100 μm2 grid in 2-month old wild-type and RyR1AG/+ soleus muscle
| Genotype | 12-month old | 2-month old | |||
|---|---|---|---|---|---|
| 0.6% Diet | 5.2% Diet | Enalapril | Glibenclamide | ||
| Ryr1+/+ | 0.48 ± 0.21 | 0.04 ± 0.01 | 0.03 ± 0.01 | 0.05 ± 0.03 | 0.09 ± 0.08 |
| Ryr1AG/+ | 10.67 ± 0.82** | 3.75 ± 0.05** | 0.34 ± 0.16* | 1.13 ± 0.14** | 1.12 ± 0.02** |
-
Average values from five grids per mice and three mice per group. Asterisks indicate significant value *<0.05, **<0.005.
Table 3
Quantitative RT-PCR of muscles from 2-month old wild-type and heterozygous Ryr1AG/+ mice fed for 4 weeks on the indicated diets
| Gene | 0.6% K Diet | 5.2% K Diet | ||
|---|---|---|---|---|
| Ryr1+/+ | Ryr1AG/+ | Ryr1+/+ | Ryr1AG/+ | |
| Abcc8 (SUR1) | ||||
| Vastus lateralis | 1.00 ± 0.07 | 1.30 ± 0.21** | 1.05 ± 0.30 | 1.51 ± 0.33* |
| Tibialis anterior | 1.00 ± 0.04 | 1.20 ± 0.17*** | 1.09 ± 0.23 | 1.31 ± 0.27* |
| Adductor magnus | 1.00 ± 0.12 | 1.28 ± 0.22* | 0.98 ± 0.23 | 1.61 ± 0.42* |
| Abcc9 (SUR2) | ||||
| Vastus lateralis | 1.00 ± 0.19 | 0.81 ± 0.24 | 1.03 ± 0.20 | 1.09 ± 0.18 |
| Tibialis anterior | 1.00 ± 0.23 | 0.86 ± 0.21 | 0.99 ± 0.13 | 1.18 ± 0.20 |
| Adductor magnus | 1.00 ± 0.18 | 0.88 ± 0.19 | 1.01 ± 0.19 | 1.11 ± 0.11 |
| Atpa1 (NKAα1) | ||||
| Vastus lateralis | 1.00 ± 0.15 | 1.23 ± 0.21* | 0.94 ± 0.32 | 0.18 ± 0.06*** |
| Tibialis anterior | 1.00 ± 0.21 | 1.22 ± 0.13* | 0.75 ± 0.39 | 0.23 ± 0.06*** |
| Adductor magnus | 1.00 ± 0.26 | 1.25 ± 0.17* | 0.93 ± 0.29 | 0.24 ± 0.07*** |
| Clc1 (CLC1) | ||||
| Vastus lateralis | 1.00 ± 0.09 | 1.05 ± 0.19 | 0.90 ± 0.21 | 0.84 ± 0.25 |
| Tibialis anterior | 1.00 ± 0.10 | 1.10 ± 0.16 | 0.93 ± 0.11 | 0.82 ± 0.27 |
| Adductor magnus | 1.00 ± 0.12 | 1.03 ± 0.21 | 0.89 ± 0.15 | 0.88 ± 0.17 |
| Kcnj2 (KIR2.1) | ||||
| Vastus lateralis | 1.00 ± 0.09 | 0.77 ± 0.12*** | 1.75 ± 0.17*** | 1.62 ± 0.13*** |
| Tibialis anterior | 1.00 ± 0.17 | 0.68 ± 0.17*** | 1.70 ± 0.26*** | 1.55 ± 0.15*** |
| Adductor magnus | 1.00 ± 0.18 | 0.59 ± 0.13*** | 1.67 ± 0.33** | 1.52 ± 0.18*** |
| Kcnj8 (KATP6.1) | ||||
| Vastus lateralis | 1.00 ± 0.20 | 0.56 ± 0.12*** | 0.97 ± 0.20 | 0.97 ± 0.23 |
| Tibialis anterior | 1.00 ± 0.13 | 0.74 ± 0.19*** | 0.87 ± 0.11 | 0.91 ± 0.12 |
| Adductor magnus | 1.00 ± 0.24 | 0.69 ± 0.16** | 1.16 ± 0.20 | 1.08 ± 0.17 |
| Kcnj11 (KATP6.2) | ||||
| Vastus lateralis | 1.00 ± 0.15 | 0.96 ± 0.17 | 1.10 ± 0.13 | 1.42 ± 0.14*** |
| Tibialis anterior | 1.00 ± 0.18 | 1.01 ± 0.16 | 1.05 ± 0.08 | 1.34 ± 0.09*** |
| Adductor magnus | 1.00 ± 0.17 | 0.94 ± 0.09 | 1.0 9± 0.06 | 1.38 ± 0.21*** |
| Prkaa1 (AMPK) | ||||
| Vastus lateralis | 1.00 ± 0.14 | 1.23 ± 0.15** | 1.11 ± 0.10 | 1.07 ± 0.14 |
| Tibialis anterior | 1.00 ± 0.04 | 1.11 ± 0.06** | 1.08 ± 0.05 | 1.07 ± 0.10 |
| Adductor magnus | 1.00 ± 0.11 | 1.20 ± 0.11*** | 1.01 ± 0.11 | 1.10 ± 0.06 |
-
Values normalized to GAPDH before normalization to Ryr1+/+ control on 0.6% diet. Asterisks indicates significant value * = 0.05, ** = 0.001, *** = 0.005.
Table 4
Relative variation of quantitative RT-PCR of control RNA and RNA from human muscle biopsies
| Patient | RYR1 Mutation | Congenital Myopathy | ABCC8 (SUR1) | ATPA1 (NKAα1) | KCNJ8 (KATP6.1) | KCNJ11 (KATP6.2) | PRKAA1 (AMPK) |
|---|---|---|---|---|---|---|---|
| 1 | No | No | 0.98 ± 0.02 | 1.35 ± 0.05 | 2.15 ± 0.19 | 1.59 ± 0.39 | |
| 2 | No | No | 0.94 ± 0.08 | 0.85 ± 01 | 1.06 ± 0.06 | 0.78 ± 0.16 | |
| 3 | Yes | Yes | |||||
| 4 | Yes | Yes | |||||
| 5 | Yes | Yes | |||||
| 6 | Yes | Yes | |||||
| 7 | Yes | Yes | |||||
| 8 | Yes | Yes | |||||
| 9 | Yes | Yes | |||||
| 10 | No | Yes | 1.09 ± 0.11 | ||||
| 11 | No | Yes | 1.09 ± 0.10 |
-
Values normalized to GAPDH before normalization to pooled control human muscle RNA. indicates significant value ; indicates significant value .
Download links
A two-part list of links to download the article, or parts of the article, in various formats.
Downloads (link to download the article as PDF)
Open citations (links to open the citations from this article in various online reference manager services)
Cite this article (links to download the citations from this article in formats compatible with various reference manager tools)
Potassium dependent rescue of a myopathy with core-like structures in mouse
eLife 4:e02923.
https://doi.org/10.7554/eLife.02923


