Nucleus reuniens of the thalamus contains head direction cells
- Trinity College Dublin, Ireland
- Cardiff University, United Kingdom
Figures
Figure 1
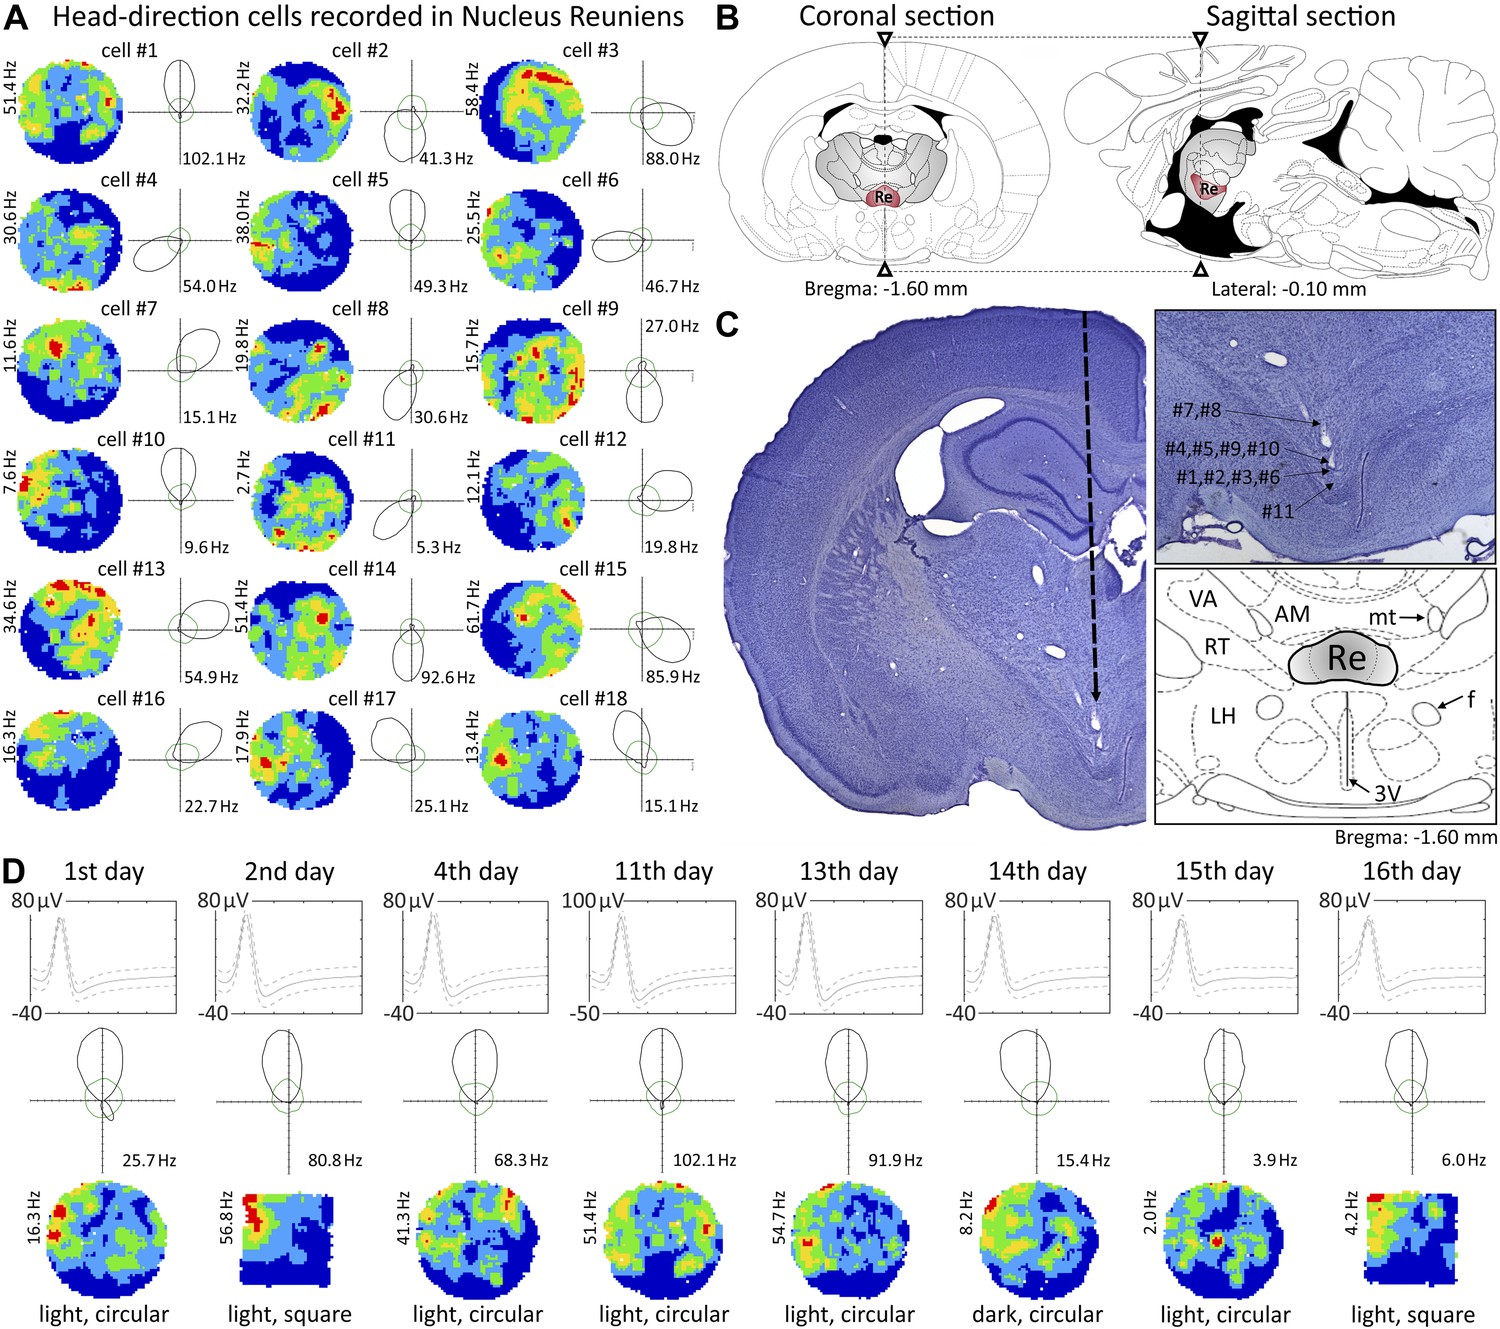
Head direction cells recorded in the nucleus reuniens.
(A) 18 representative head direction (HD) cells in nucleus reuniens (NRe); (B) NRe location on a coronal (left) and corresponding sagittal (right) rat brain section (adapted from Paxinos and Watson, 2005); (C) representative histological specimen showing electrode track (left); recording positions corresponding to cell locations presented in panel a (upper right inset) showing location of NRe and detailed atlas (lower right inset); (D) representative recordings showing multi-day stability of HD cells: a representative cell recorded on each day of 16 days (multiple transitions from light-dark-light, and environmental transformations from circle to square to circle). The solid line is the mean spike waveform and dashed lines are M ± SD of the spike waveform. The green outline shows predicted firing rates given the proportion of time the animal spent looking in each direction, calculated according to the distributive hypothesis.
Figure 2
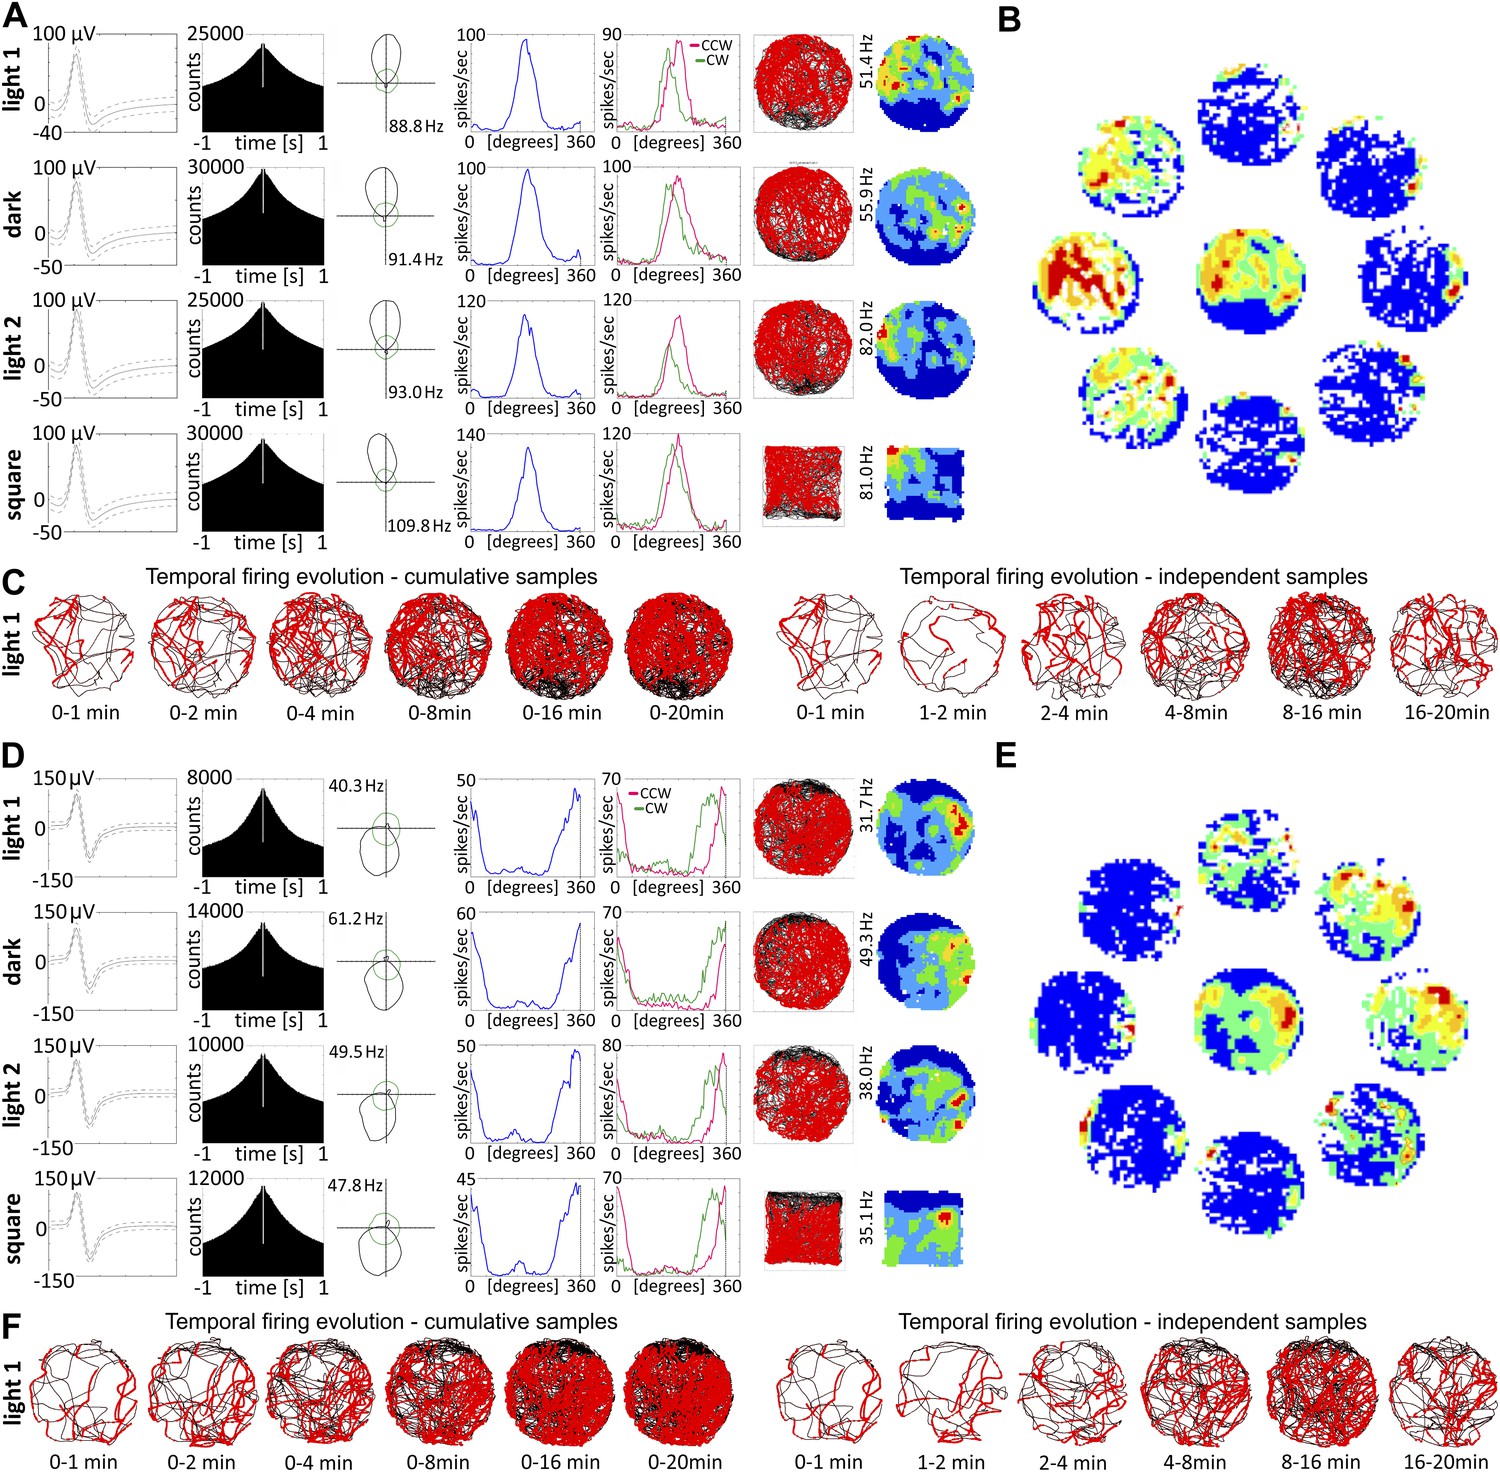
Nucleus reuniens head direction cells do not appear to be spatially modulated and are present from first exposure to the environment.
(A and D) Representative waveforms for two units showing, (top to bottom), light-dark-light and circle–square transitions; from left to right, autocorrelation histogram, polar plots, tuning curves for clockwise (CW) vs counter-clockwise (CCW) head movements; (B) spatial analysis for cardinal orientations showing no effect of spatial position on unit activity; (C) temporal evolution of HD firing for cumulative samples (time ranges: 0–1, 0–2, 0–4, 0–8, 0–16 and 0–20 min) and independent time-binned samples (0–1, 1–2, 2–4, 4–8, 8–16 and 16–20 min) demonstrating that HD activity is present in the first minute of exposure to the arena; (D, E, F) as (A, B, C). Red lines are formed by continuous firing activity when the rat walks with its head directed in the preferred HD. The firing map represents −22.5° to +22.5°; as the ring was formed by eight plots each representing a 45° extent of head direction.
Figure 3
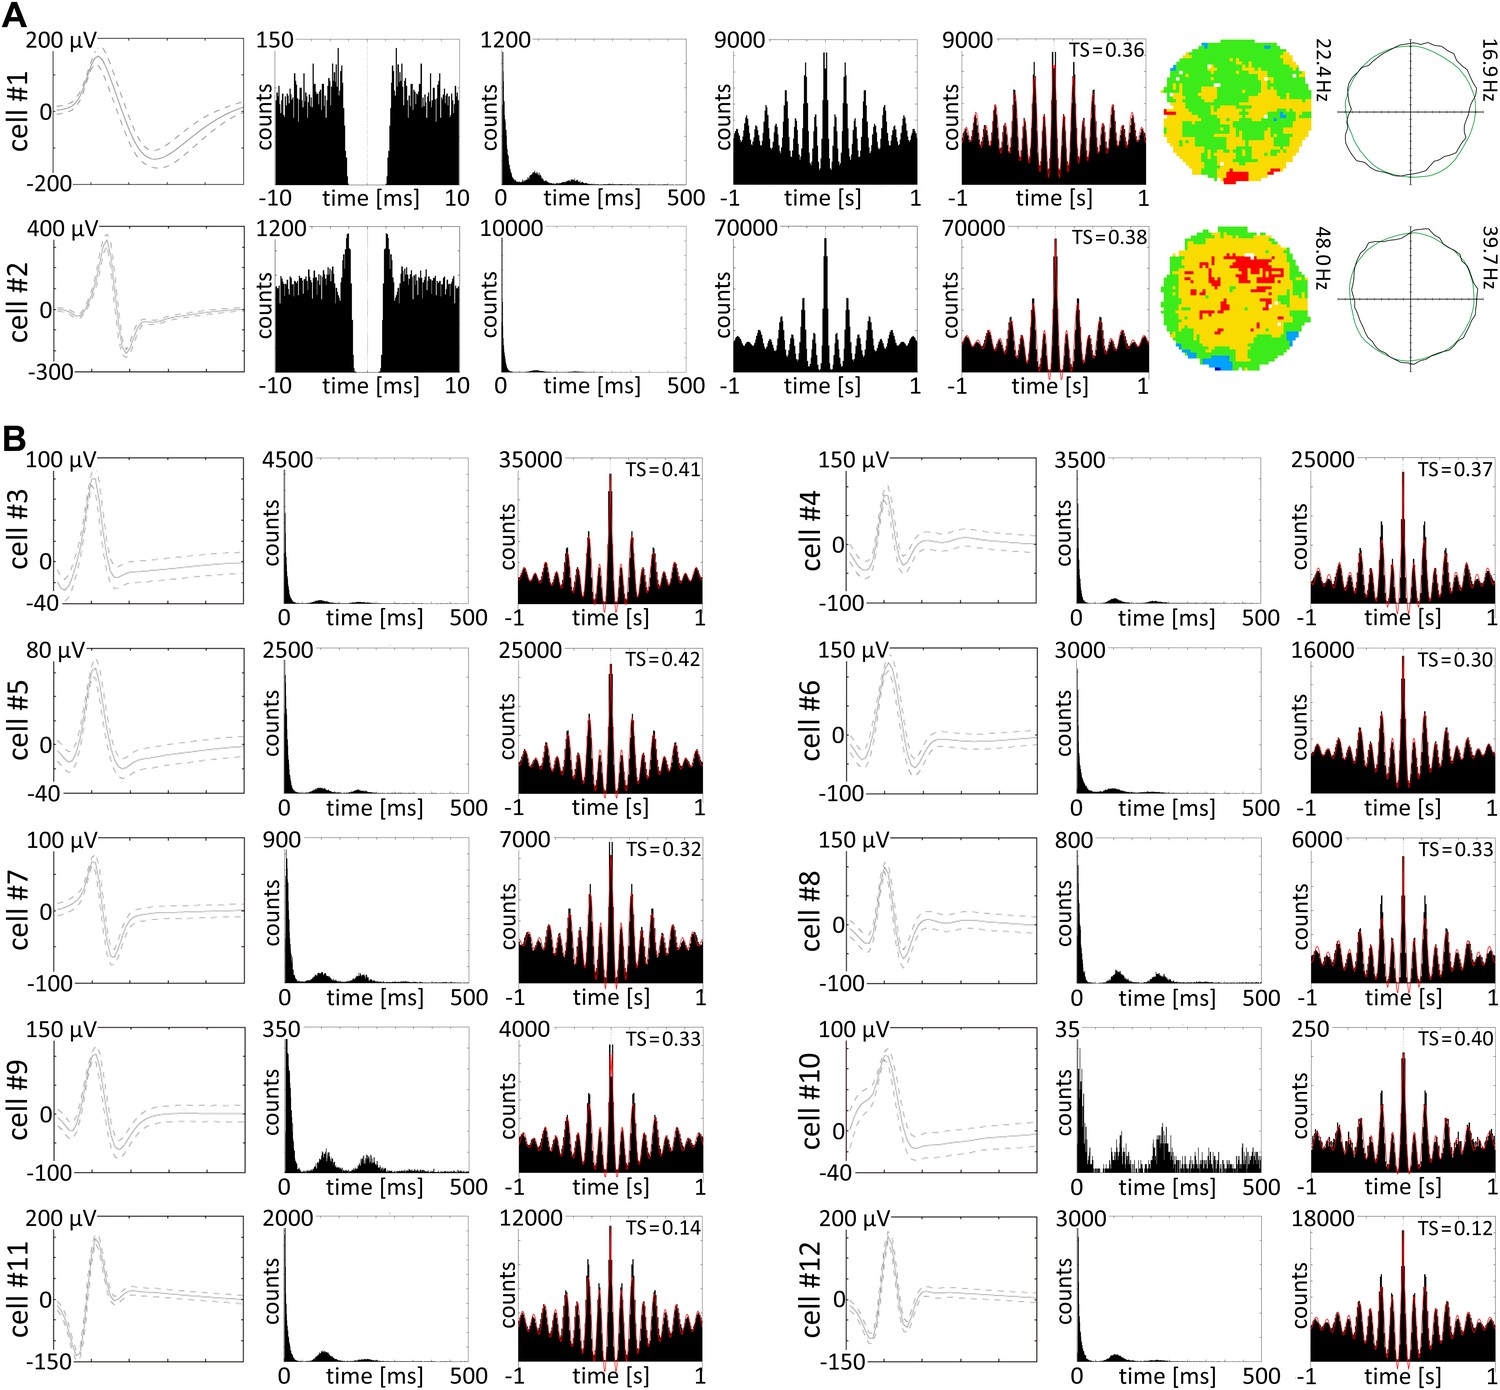
Theta skipping cells are present in nucleus reuniens.
(A and B) 12 representative theta cycle skipping cells which do not carry HD signal recorded in NRe; (A) from the left waveform, autocorrelation per 10 ms, interspike interval histogram (ISIH), autocorrelations per 1000 ms with and without fitting to the model, firing intensity map and polar plot are presented for two representative cells. Red line: envelope of the autocorrelation histogram obtained by fitting histogram data to the equation (see OM); (B) waveforms, ISIHs, and autocorrelation histograms with redline envelope of data fitting to the equation (OM) for 10 theta cycle skipping cells recorded in NRe.
Videos
Video 1
An example of a well-discriminated head direction unit recorded in NRe while the rat is engaged in pellet chasing in a circular arena.
The unit corresponds to unit 4 of Figure 1A.
Download links
A two-part list of links to download the article, or parts of the article, in various formats.
Downloads (link to download the article as PDF)
Open citations (links to open the citations from this article in various online reference manager services)
Cite this article (links to download the citations from this article in formats compatible with various reference manager tools)
Nucleus reuniens of the thalamus contains head direction cells
eLife 3:e03075.
https://doi.org/10.7554/eLife.03075


