The translation elongation factor eEF1A1 couples transcription to translation during heat shock response
- New York University School of Medicine, United States
- Institut Pasteur, CNRS URA2578, France
- Albert Einstein College of Medicine, United States
- Institute of Genetics and Molecular Medicine, Western General Hospital, University of Edinburgh, United Kingdom
- Howard Hughes Medical Institute, New York University School of Medicine, United States
Figures
Figure 1 with 6 supplements
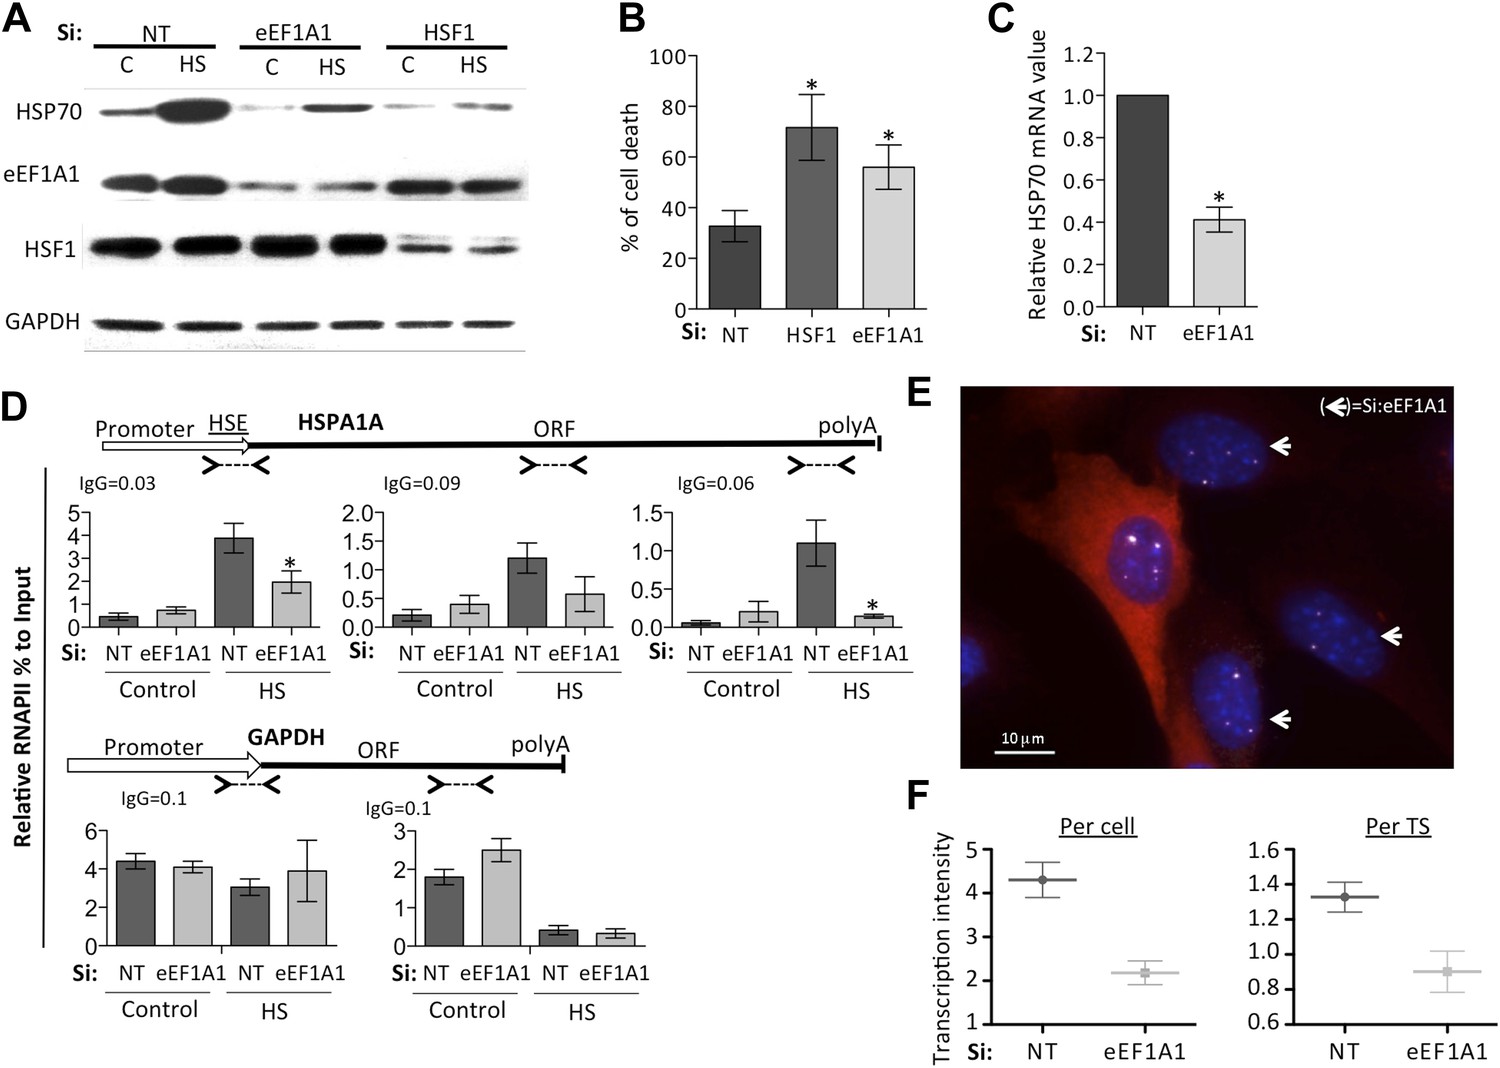
eEF1A1 regulates HSP70 expression and thermotolerance.
(A) Knock down of eEF1A1 decreases HSP70 protein expression upon heat shock. Western blots of HSP70, eEF1A1, HSF1, and GAPDH from total cell lysates of MDA-MB231 cells transfected with siRNA (pair A) against eEF1A1 or HSF1, or mock-transfected (Si:NT with no target). Control (C)—unstressed cells kept at 37°C. Heat shock (HS)—cells kept for 1 hr at 43°C followed by 6 hr of recovery at 37°C. (B) HSF1- or eEF1A1-knocked down cells are less thermo-tolerant. Cell death was quantified by FACS analysis after propidium iodide staining. Thermotolerance was induced in mock-transfected (Si:NT) or eEF1A1/HSF1-depleted cells by two heat treatments (1 hr at 43°C, 12 hr at 37°C, and 1 hr at 45°C), followed by 12 hr of recovery. Data from three independent experiments are presented as the mean ± SEM. *p < 0.05. (C) Knock down of eEF1A1 decreases HSP70 mRNA expression during heat shock. Total RNA from heat shocked MDA-MB231 cells was reverse-transcribed with random hexamer primers followed by quantification of GAPDH and HSP70 mRNAs by QPCR. HSP70 mRNA values were normalized to that of GAPDH. Bars represent the amount of HSP70 mRNA in cells depleted of eEF1A1 relative to that obtained for mock-transfected cells (Si:NT). 1 is the value of HSP70 mRNA in Si:NT cells at 1 hr of heat shock. Data from three independent experiments are presented as the mean ± SEM. *p < 0.05. (D) eEF1A1 controls RNAPII occupancy at the HSP70 gene after stress as determined by ChIP-QPCR. Schematic of the HSPA1A locus is shown at the top. Arrowheads indicate the regions amplified by QPCR. Panels show the effect of eEF1A1 knock down (si:eEF1A1) on RNAPII occupancy relative to input Ct value under non-heat shock conditions (control) and after 30 min of heat shock. The relative value for the IgG is indicated for each of the PCR fragments on top of the plot. Values below that of the IgG mean non-specific binding. Mock-transfected cells (Si:NT). By comparison, GAPDH showed no change with si;eEF1A1. Data from three independent experiments are presented as the mean ± SEM. (*p < 0.05). (E) eEF1A1 mediates HSP70 transcription upon HS. MEFs were infected with a lentivirus expressing Cherry-eEF1A1. eEF1A1 expression was knocked down by siRNA. At 30 min after HS, cells were fixed and HSP70 mRNA detected by FISH. Nuclei were stained with DAPI. Merged images show Cherry-eEF1A1 in red, HSP70 TS in gray and nucleus in blue. White arrows indicate cells knocked down of eEF1A1. Bar = 10 microns. (F) eEF1A1 mediates HSP70 transcription upon HS. Plots are the quantification of the intensity of HSP70 transcription, per cell or per TS, detected by FISH and quantified by airlocalize. A total of seventy cells per condition were analyzed from three independent experiments. NT = non-transfected cells. eEF1A1 = cells transfected with siRNA for eEF1A1.
Figure 1—figure supplement 1
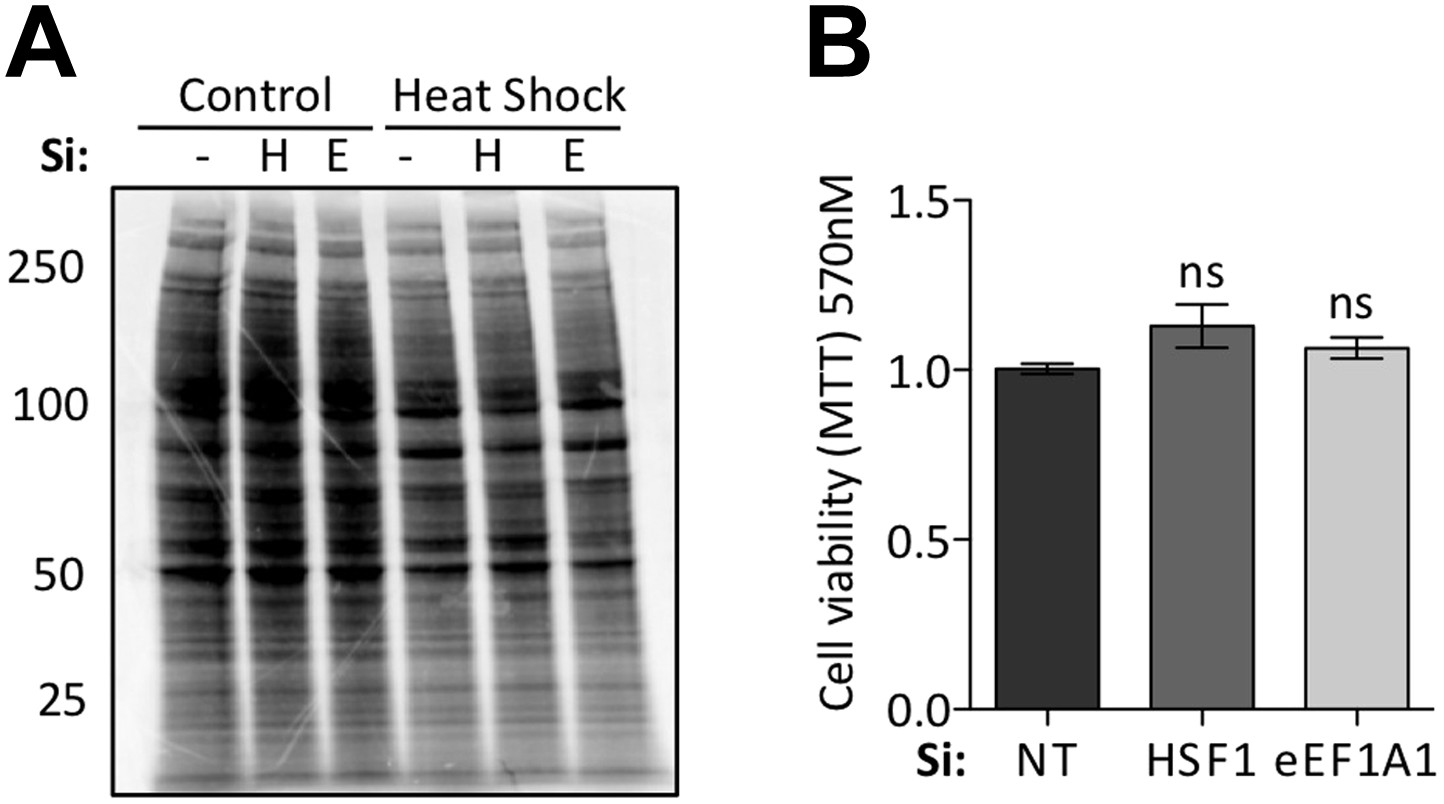
Knock down of eEF1A1 does not affect general translation or cell viability.
(A) Knock down of HSF1 or eEF1A1 by DsiRNA does not affect overall protein synthesis. Pulse-chase experiment with [35S]-methionine in mock transfected cells (−), or cells knocked down for HSF1 (H), or eEF1A1 (E). Cells were kept at 37°C (C) or heat-shocked for 45 min at 40°C followed by a 30 min incubation at 40°C with 50 μCi/ml of [35S] (HS). Numbers at the left indicate molecular weight in kDa. (B) Inhibition of HSF1 or eEF1A1 does not affect normal cell growth. Quantification of cell viability by the MTT assay was performed on mock-transfected cells (Si:NT) or cells depleted of eEF1A1 or HSF1 under normal cell growth conditions. ns = Non significant differences with Si:NT cells.
Figure 1—figure supplement 2
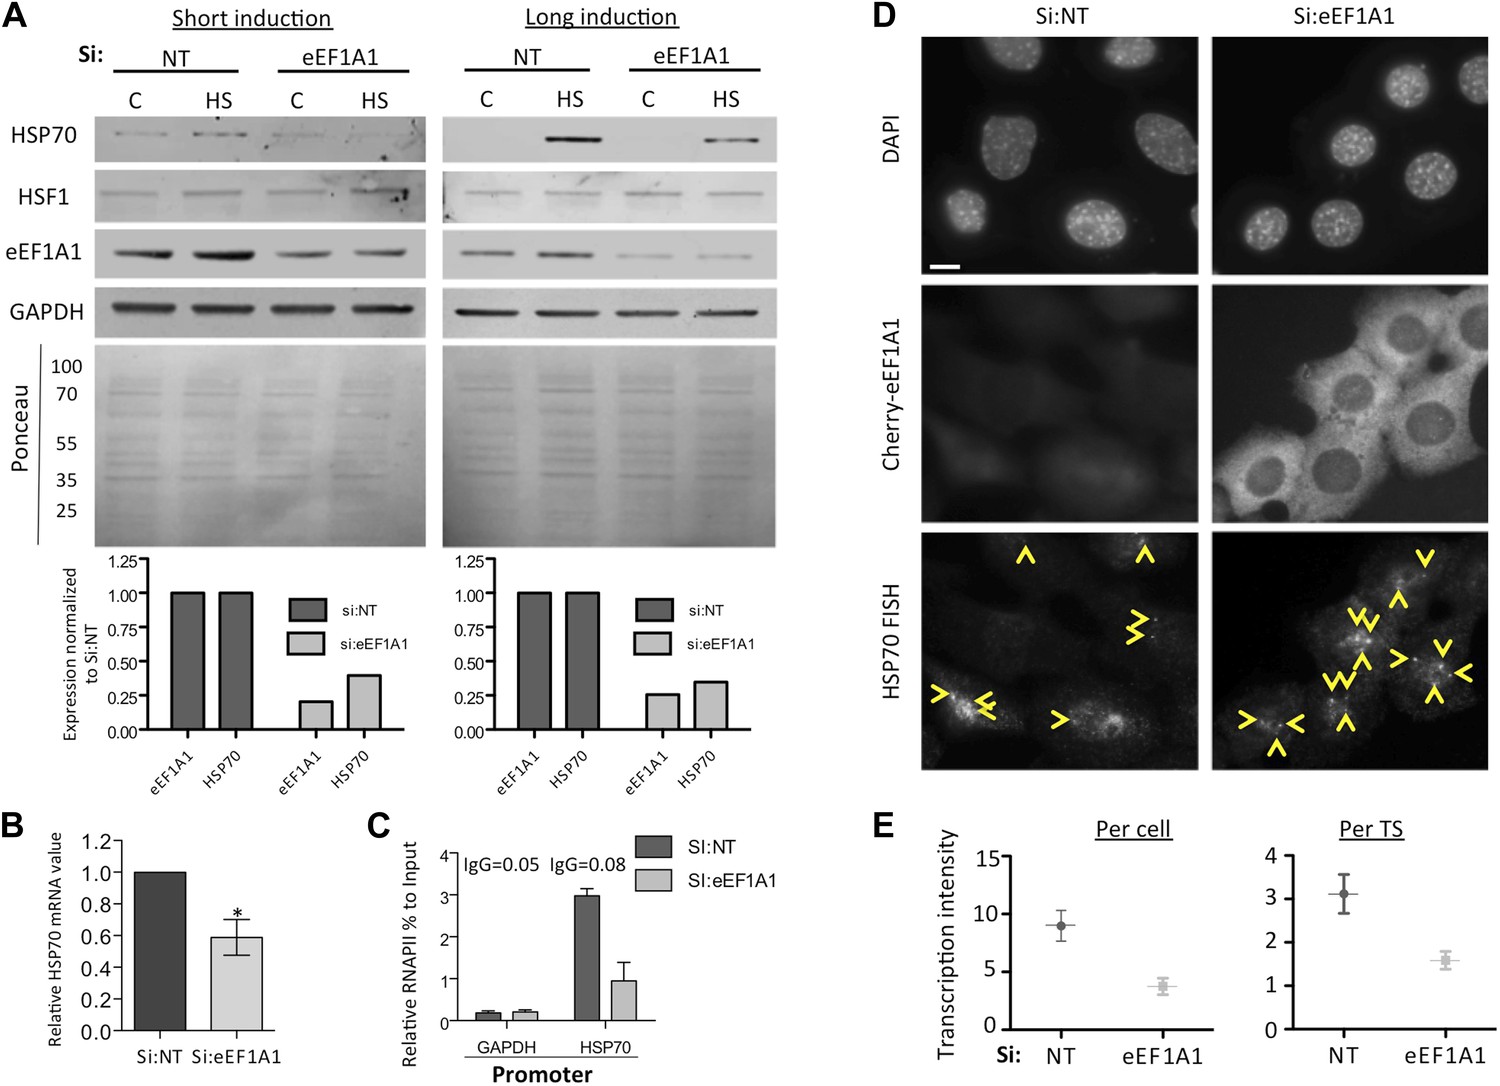
eEF1A1 regulates HSP70 expression (all experiments in this figure were done with an alternative pair of siRNAs [pair B] to rule out off-target effects).
(A) Knock down of eEF1A1 decreases HSP70 protein expression upon heat shock. Western blots of HSP70, eEF1A1, HSF1, and GAPDH from total cell lysates of MBS-MEF cells transfected with siRNA (pair B) against eEF1A1 or mock-transfected (Si:NT with no target). Control (C)—unstressed cells kept at 37°C. Heat shock (HS)—cells kept for 1 hr at 43°C followed by 2 hr of recovery (short induction) or 6 hr of recovery (long induction) at 37°C. Low panels—ponceau staining of the membranes. Numbers indicate molecular weight. Plots show the relative fluorescence intensity of bands as compared to mock-transfected non-stressed cells. (B) Knock down of eEF1A1 decreases HSP70 mRNA expression during HS. Total RNA from heat shocked MDA-MB231 cells was reverse-transcribed with random hexamer primers followed by quantification of GAPDH and HSP70 mRNAs by QPCR. HSP70 mRNA values were normalized to that of GAPDH. Bars represent the amount of HSP70 mRNA in cells depleted of eEF1A1 relative to that obtained for mock-transfected cells (Si:NT). 1 is the value of HSP70 mRNA in Si:NT cells at 1 hr of heat shock. Data from three independent experiments are presented as the mean ± SEM, *p < 0.05. (C) eEF1A1 controls RNAPII occupancy at the HSP70 promoter after stress as determined by ChIP-QPCR. Panels show the effect of eEF1A1 knock down (si:eEF1A1) on RNAPII occupancy relative to the input Ct value after 30 min of heat shock. The relative value for the IgG is indicated for each of the PCR fragments on top of the plot. Values below that of the IgG mean non-specific binding. Mock-transfected cells (Si:NT). Data from two independent experiments are presented as the mean ± SEM. (D) eEF1A1 mediates HSP70 transcription upon HS. MEFs were infected with a lentivirus expressing Cherry-eEF1A1. eEF1A1 expression was knocked down by siRNA. At 30 min after HS cells were fixed and HSP70 mRNA detected by FISH. Nucleus stained with DAPI. Yellow arrows indicate TS. Bar = 10 microns. (E) eEF1A1 mediates HSP70 transcription upon HS. Plots are the quantification of the intensity of HSP70 transcription, per cell or per TS, detected by FISH and quantified by airlocalize. A total of 25 cells per condition were analyzed from three independent experiments. NT = non-transfected cells. eEF1A1 = cells transfected with siRNA for eEF1A1.
Figure 1—figure supplement 3

Knock down of eEF1A1 reduces HSPs expression in mouse and human cells.
(A) Knock down of eEF1A1 decreases the production of HSP70 in NSC-34 cells (mouse neuroblastoma/spinal cord fusion cell line). The panel indicates expression of eEF1A1 and HSP70 normalized to GAPDH in heat-shocked samples transfected with eEF1A1 siRNAs and the scrambled non-targeting negative control. Two different RNAi were used to inhibit eEF1A1 isoform (pair C): 1A1-a UGACAAUCCAGAACAGGAGCGUAGC; 1A1-b AAGUGGAGGGUAGUCAGAGAAGCUC. Cells were transfected with separate siRNAs (Invitrogen) using siLentFect (Bio-Rad), allowed to recover for 24 hr, incubated at 43°C for 2 hr, and then recovered again for 16 hr. Control cells remained at 37°C for the duration of the experiment. Western-blots were analyzed separately for each siRNA and the values related to those of scrambled control. Data are the mean ± SEM is from three independent experiments. (B) Knock down of eEF1A1 suppresses HSP70 protein induction upon heat shock. The panels show western blots of HSP70, eEF1A1, HSF1, and GAPDH from total cell lysates of WI38 human fibroblast cells mock-transfected (Si:NT) or knocked down of eEF1A1. Cells were heat-shocked for 1 hr at 43°C followed by 6 hr of recovery at 37°C. (C) Knock down of eEF1A1 decreases HSP27 protein induction upon heat shock. The panels show SDS-PAGE and immunoblots of HSP27, eEF1A, and GAPDH from total cell lysates of mock-transfected (Si:NT) MDA-MB231 cells or cells depleted of eEF1A. Cells were heat-shocked for 1 hr at 43°C followed by 6 hr of recovery at 37°C. (D) Knock down of eEF1A1 diminishes HSP70 mRNA expression during heat shock. Total RNA from heat-shocked WI38 cells was reverse-transcribed with random primers followed by quantification of GAPDH and HSP70 mRNAs by QPCR. HSP70 mRNA values were normalized to that of GAPDH. Bars represent the mean ± SEM amount of HSP70 mRNA from three different experiments in cells depleted of eEF1A1 relative to that detected in mock-transfected cells (Si:NT = 1). *p < 0.05. (E) Knock down of eEF1A1 diminishes HSP27 mRNA expression during heat shock. Total RNA from heat-shocked MDA-MB-231 cells was reverse-transcribed with random primers followed by quantification of GAPDH and HSP27 mRNAs by QPCR. HSP70 mRNA values were normalized to that of GAPDH. Bars represent the mean ± SEM amount of HSP27 mRNA in cells depleted of eEF1A1 relative to that detected in mock-transfected cells (Si:NT = 1). *p < 0.05. (F) eEF1A1 controls transcription of various heat shock genes. Knock down of eEF1A1 compromises mRNA induction of several major heat-shock genes during heat shock. Total RNA from heat-shocked or unstressed MDA-MB231 cells was reverse-transcribed with random primers followed by quantification of GAPDH and the indicated mRNAs by QPCR. mRNA values were normalized to that of GAPDH. Bars represent the amount of HSP mRNAs in cells inhibited of eEF1A1 relative to that in mock-transfected cells (Si:NT = 1) at 2 hr of heat shock. Means ± SEM are from three independent experiments. *p < 0.05. (G) Role of eEF1A1 in HSR is independent of its role in translation elongation. Quantification of induction of HSP70 mRNA by RT-QPCR after 1 hr of heat shock or treatment with the translation inhibitors cycloheximide (CHX, 50 μg/ml) or doxycycline (DOX, 5 μg/ml) in mock transfected cells or cells knocked down of eEF1A. Data are the mean ± SEM comparing mock transfected with Si:eEF1A1. *p < 0.05 and **p < 0.01.
Figure 1—figure supplement 4
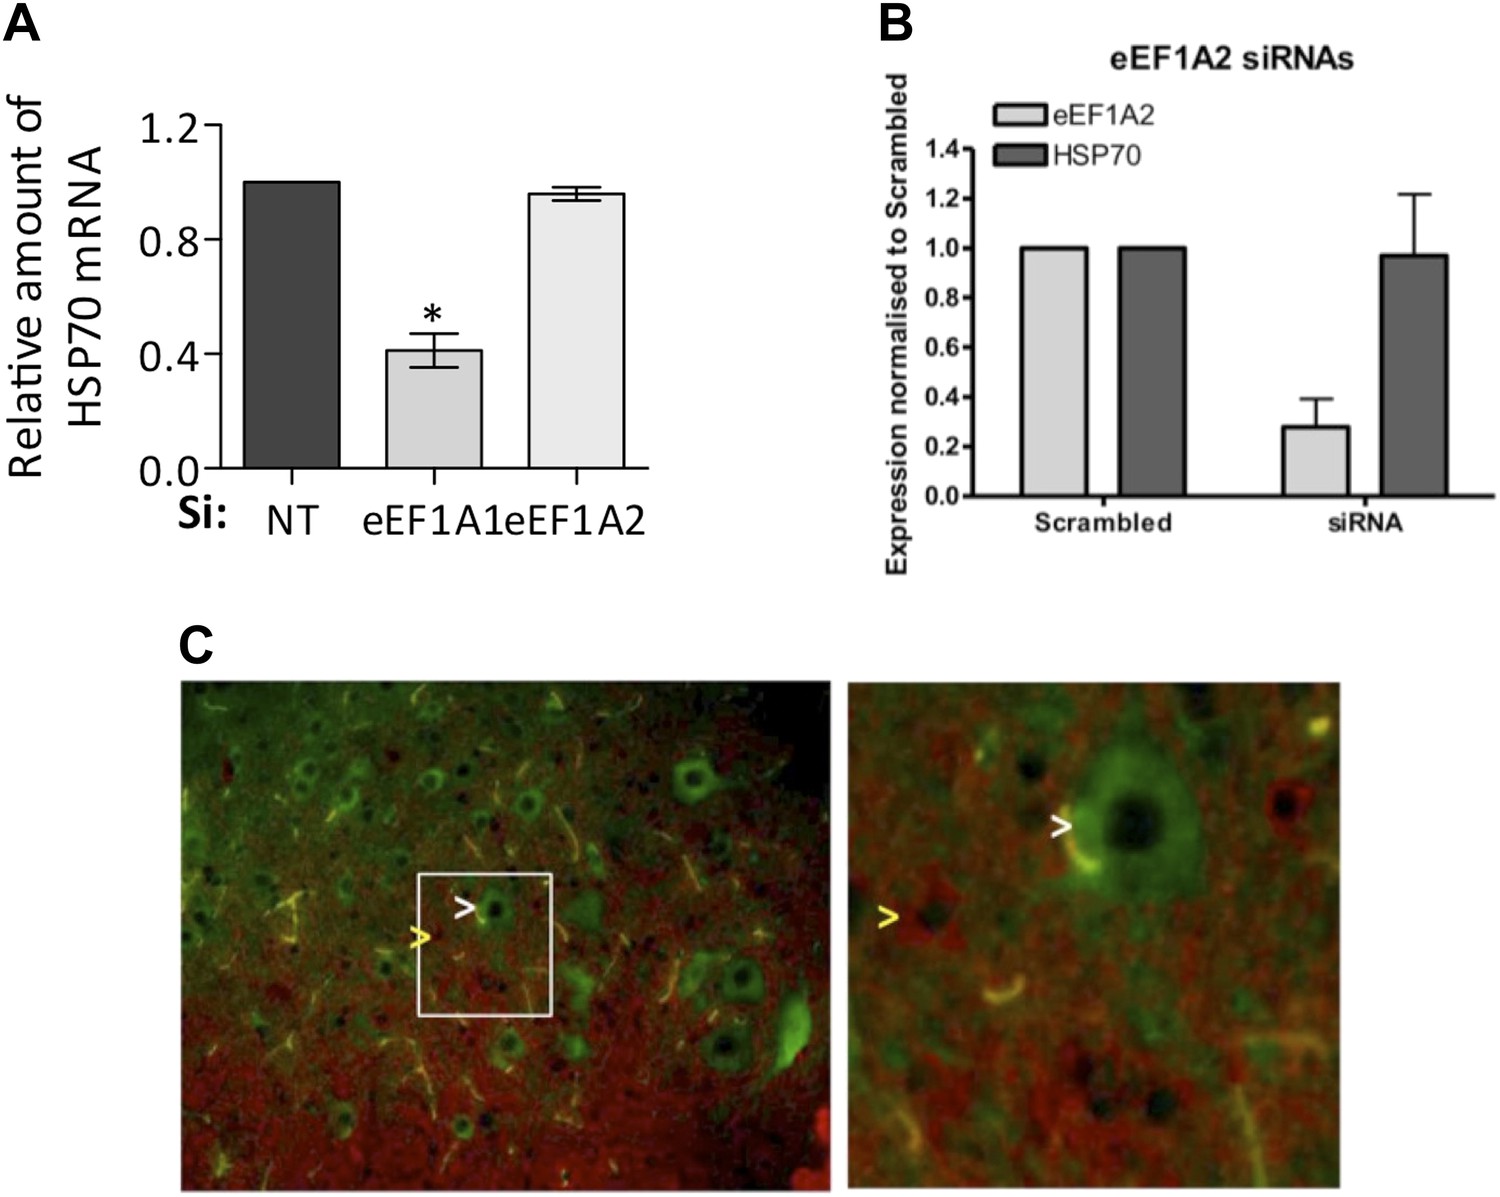
eEF1A2 does not support HSR.
(A) eEF1A1, but not eEF1A2, mediates HSP70 induction upon heat shock. The levels of HSP70 mRNA with respect to GAPDH were determined by RT-QPCR after 1 hr of heat shock in mock-transfected cells (si: nt) or cells knocked down of eEF1A1 or eEF1A2. The HSP70 mRNA level is taken as 100% in mock transfected cells. Data are the mean ± SEM from three experiments. *p < 0.05. (B) Knocking down eEF1A2, does not decrease HSP70 protein induction in NSC-34 cells (mouse neuroblastoma/spinal cord fusion cell line). Panel indicates expression of eEF1A2 and HSP70 normalized to GAPDH in heat-shocked samples transfected with eEF1A2 siRNAs and the scrambled non-targeting negative control. Two different RNAi were used to inhibit eEF1A2 isoform: 1A2-a UUAACGGACACAUUCUUCACAUUGA; 1A2-b CAAUCUUGUACACAUCCUGCAGAGG. Cells were transfected with separate siRNAs (Invitrogen) using siLentFect (Bio-Rad), allowed to recover for 24 hr, incubated at 43°C for 2 hr, and then recovered again for 16 hr. Control cells remained at 37°C for the duration of the experiment. Western-blots were analyzed separately for each siRNA and the values related to those of scrambled control. Data are the mean ± SEM is from three independent experiments. (C) Motor neurons express eEF1A2, but not eEF1A1. Immunofluorescence imaging of eEF1A1 (red) and eEF1A2 (green) in the mouse spinal cord shows non-overlapping cytoplasmic staining. eEF1A2 is present only in motor neurons (white arrow). eEF1A1 is present only in smaller interneurons and white matter (glia cells) (yellow arrow). Right panel shows the magnified area (white box in left image). Images were captured at 40x magnification.
Figure 1—figure supplement 5

Knock down of eEF1A1 decreases overall transcription of HSP70.
(A) Schematic of the HSPA1A locus is shown at the top. Plot shows the occupancy of RNAPII relative to input Ct value in eEF1A1 depleted (Si:eEF1A1) and mock-transfected human fibroblast WI38 cells (Si:NT) as determined by ChIP-QPCR. The values for the IgG control are indicated for each PCR fragment. Media ± SEM values lower than those numbers mean no occupancy. (B) Nuclear run-on analysis of HSPA1A and GAPDH transcription in heat shocked (43°C, 20 min) control fibroblasts (NT) or eEF1A1-knocked down cells (eEF1A1) with two unrelated siRNAs (pair A or pair B). Numbers on the left represent the hybridization probe position. Numbers on the right represent % of run-on transcripts in eEF1A1-knocked down cells as compared to mock-transfected cells. (C) eEF1A1 controls RNAPII occupancy at the HSP70 promoter after stress as determined by ChIP-QPCR. Panels show the effect of eEF1A1 knock down (si:eEF1A1 [pair B]) on RNAPII occupancy relative to the input Ct value under non-HS conditions (C) or after 30 min of heat shock (HS) on HSP70 and GAPDH promoters. Mock-transfected cells (Si:NT). Data from two independent experiments are presented as the mean ± SEM.
Figure 1—figure supplement 6
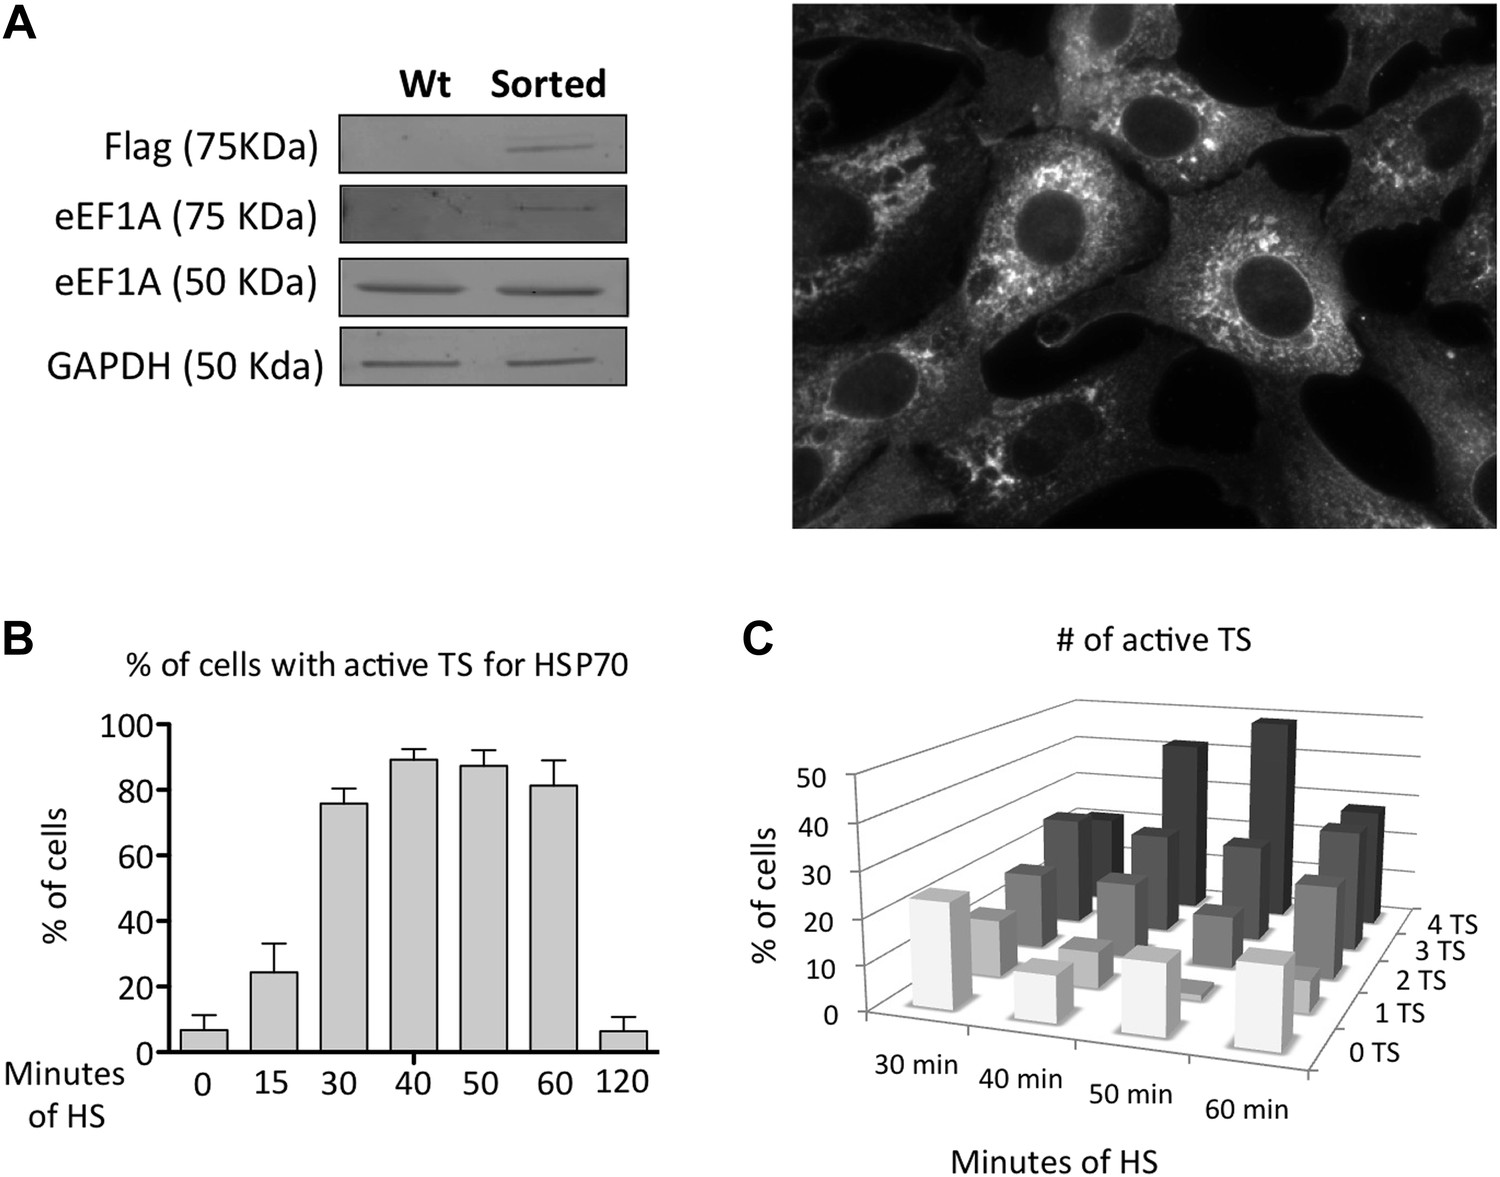
Characterization of MEFS expressing Cherry-Flag-eEF1A1.
(A) Panels show Western blots of eEF1A1, Flag and GAPDH from total cell lysates of immortalized MEFs (Lionnet et al., 2011) infected with a lentivirus expressing eEF1A1 fused to Cherry and Flag on its N terminus. Wt indicate non-infected cells, sorted are cells sorted to get a homogenous population expressing cherry-eEF1A. Image shows the expression of Cherry-eEF1A1 by fluorescence microscopy after fixation. (B) Percentage of cells with active TS for HSP70 detected by FISH. Data represent median ± SEM from four independent experiments. Time in minutes indicate the length MEF cells were at 43°C before fixation and FISH. TS were counted after microscopy. (C) Percentage of TS for HSP70 detected by FISH. Date represent media ± SEM from four independent experiments. Time in minutes indicate the length MEF cells were heated at 43°C before fixation and FISH.
Figure 2 with 1 supplement
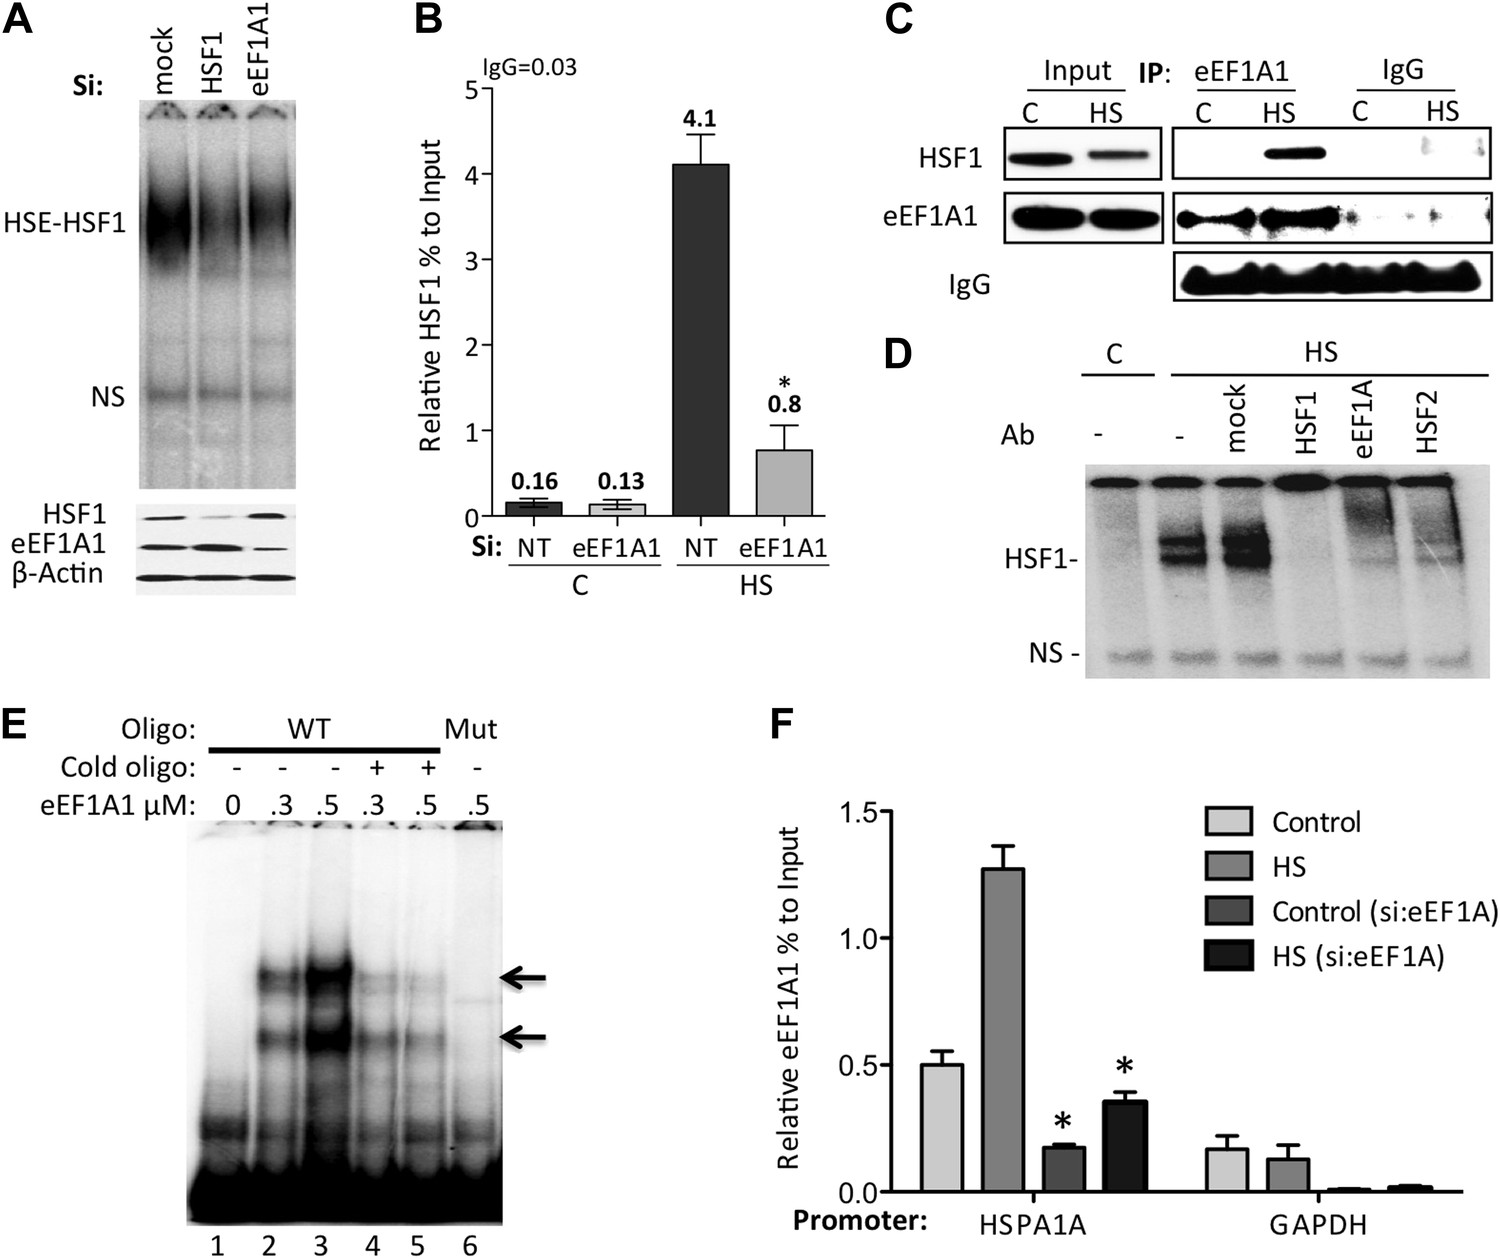
eEF1A1 mediates HSF1 recruitment to HSP70 promoter.
(A) eEF1A1 enhances HSF1 DNA binding upon heat shock. Mock-transfected, eEF1A1 or HSF1-knocked down MDA-MB231 cells were heat-shocked for 30 min at 43°C and analyzed by HSF1-HSE EMSA (top panel). 10 μg of total protein were loaded in the EMSA. HSF1, eEF1A1, and GAPDH levels were determined by immunoblotting (lower panel). (B) eEF1A1 is required for HSF1 promoter binding in vivo. ChIP-QPCR was performed on mock-transfected (Si:NT) or eEF1A1-knocked down (Si:eEF1A1) cells. Panel shows the effect of eEF1A1 depletion on HSF1 occupancy at the HSP70 promoter (relative to the input Ct value) under non-heat shock conditions (C) and after 30 min of heat shock (HS). The reference value for IgG control is indicated on top of the plot. Values below those numbers mean non-specific binding. Data from three independent experiments are represented as the mean ± SEM. (*p < 0.05). (C) Stress-induced formation of the eEF1A1-HSF1 complex in vivo. Extracts from unstressed (C) or heat-shocked (HS) MDA-MB231 cells IPed with eEF1A1 antibody or IgG. IP samples or total protein (Input) were subjected to SDS-PAGE and immunoblotting. (D) eEF1A1-HSF1 complex formation at HSE. Panels show the super-shift of HSF1-HSE EMSA caused by specified antibodies. MDA-MB231 cells were heat-shocked for 20 min at 43°C (HS). Extracts were incubated with antibodies to HSF1, HSF2 (positive control), or eEF1A1 antibodies, or IgG (mock). HSE-HSF1 indicates specific binding of HSF1 to labeled HSE; NS—a non-specific band. (E) Direct binding of eEF1A1 to HSP70 promoter DNA. Radiolabeled fragment of the region −141 to −91 of the human HSP70 promoter was incubated with purified eEF1A1 (lanes 1–3), chased with fivefold molar excess of cold oligonucleotide (lanes 4 and 5), or mutant fragment of the same region (lane 6). Arrows mark the specific eEF1A1 shift. (F) eEF1A1 binds the HSP70 promoter before and after stress. Mock transfected or eEF1A1-knocked down (Si:eEF1A) MDA-MB231 cells were kept at 37°C or heat-shocked (HS) for 20 min at 43°C. Chromatin IP with eEF1A1 or IgG antibodies and amplified by PCR for the HSP70 (HSPA1A) and GAPDH promoters. Relative value of the control IgG vs input for HSPA1A is 0.04 and for GAPDH is 0.05. Data from three independent experiments are presented as the mean ± SEM. *p < 0.05.
Figure 2—figure supplement 1
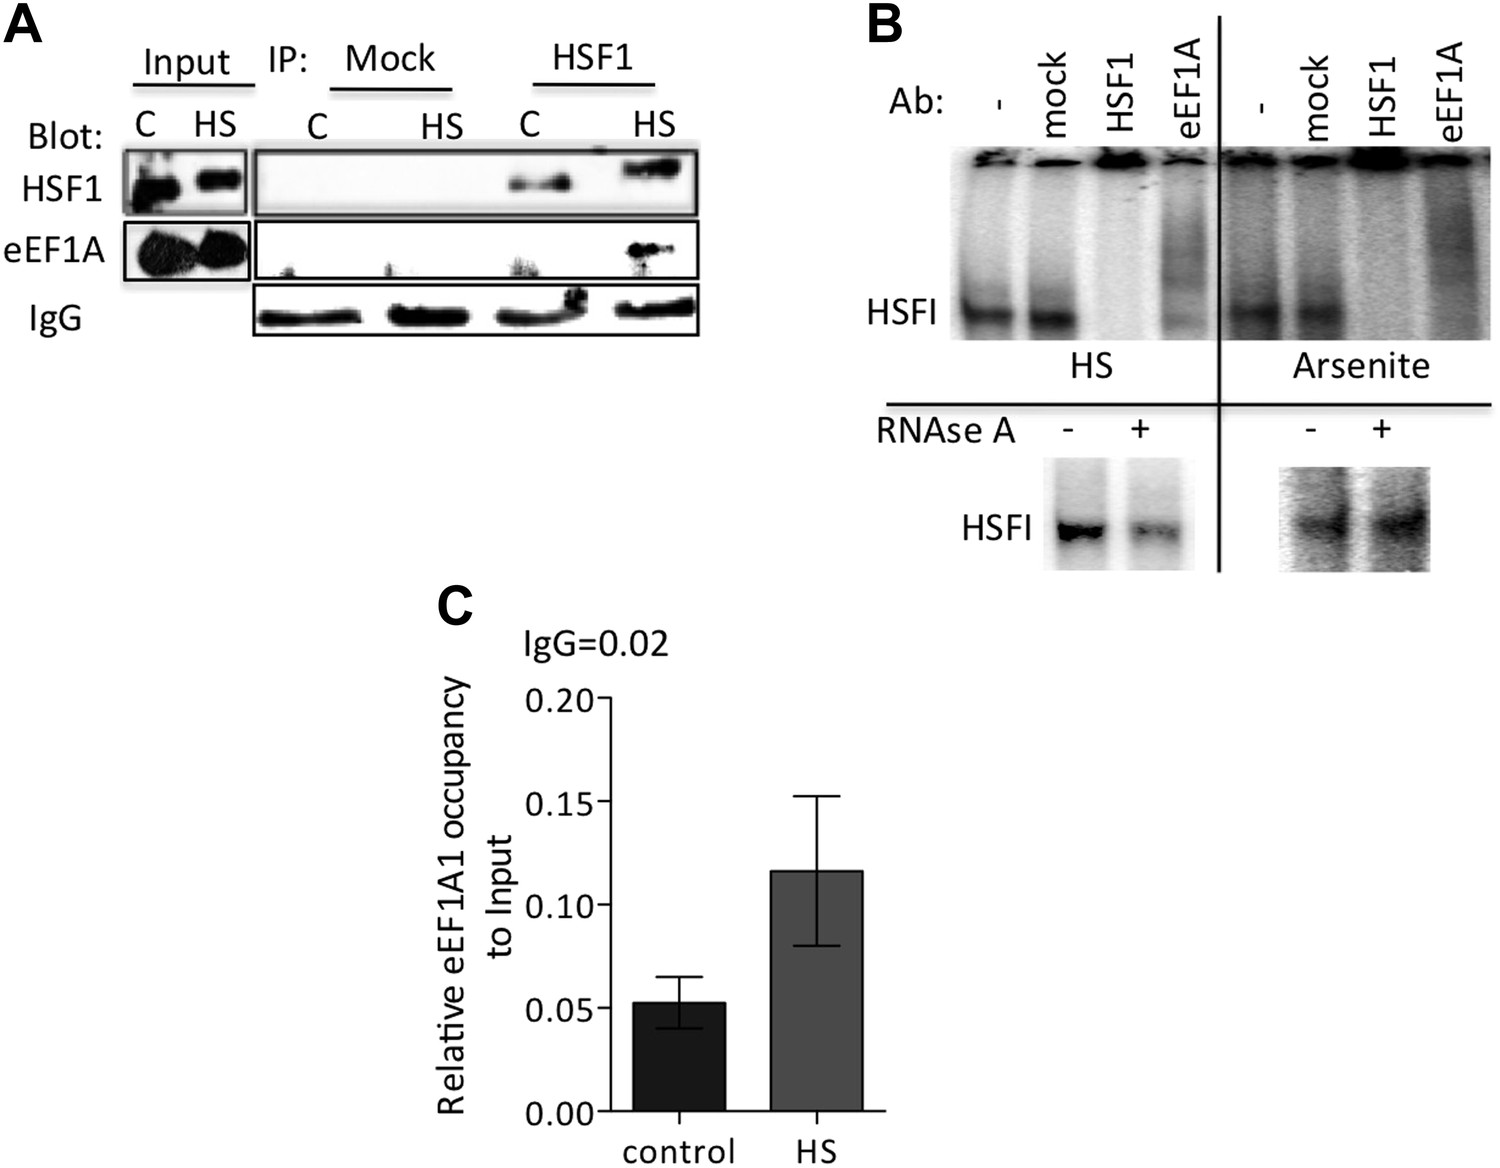
eEF1A1 interacts with HSF1 at HSE upon stress and binds HSP27 promoter.
(A) Stress-induced formation of the eEF1A1-HSF1 complex in vivo. Extracts from unstressed (C) or heat-shocked (HS) MDA-MB231 cells IP with HSF1 antibody or IgG. IP samples or total protein (Input) were subjected to SDS-PAGE and immunoblotting. (B) RNA-dependent formation of the eEF1A-HSF1-HSE complex is specific to heat shock. Top panel shows the super-shift of HSF1-HSE EMSA caused by specified antibodies. MDA-MB-231 cells were heat shocked for 20 min at 43°C (HS) or treated with 80 μM arsenite for 2 hr (right panel). Cell extracts were incubated with HSF1 or eEF1A1 antibodies or IgG (mock). In parallel, cells were also treated with RNAse A prior to EMSA (lower panel). (C) Chromatin from MDA-MB231 cells was IP with eEF1A1 and IgG antibodies and amplified by PCR targeting the HSP27 promoter region. Control—cells kept at 37°C, HS—cells heat shocked at 43°C for 30 min. Values below IgG number mean no occupancy.
Figure 3 with 4 supplements

eEF1A1 localizes at HSP70 TS and interacts with RNAPII upon HS.
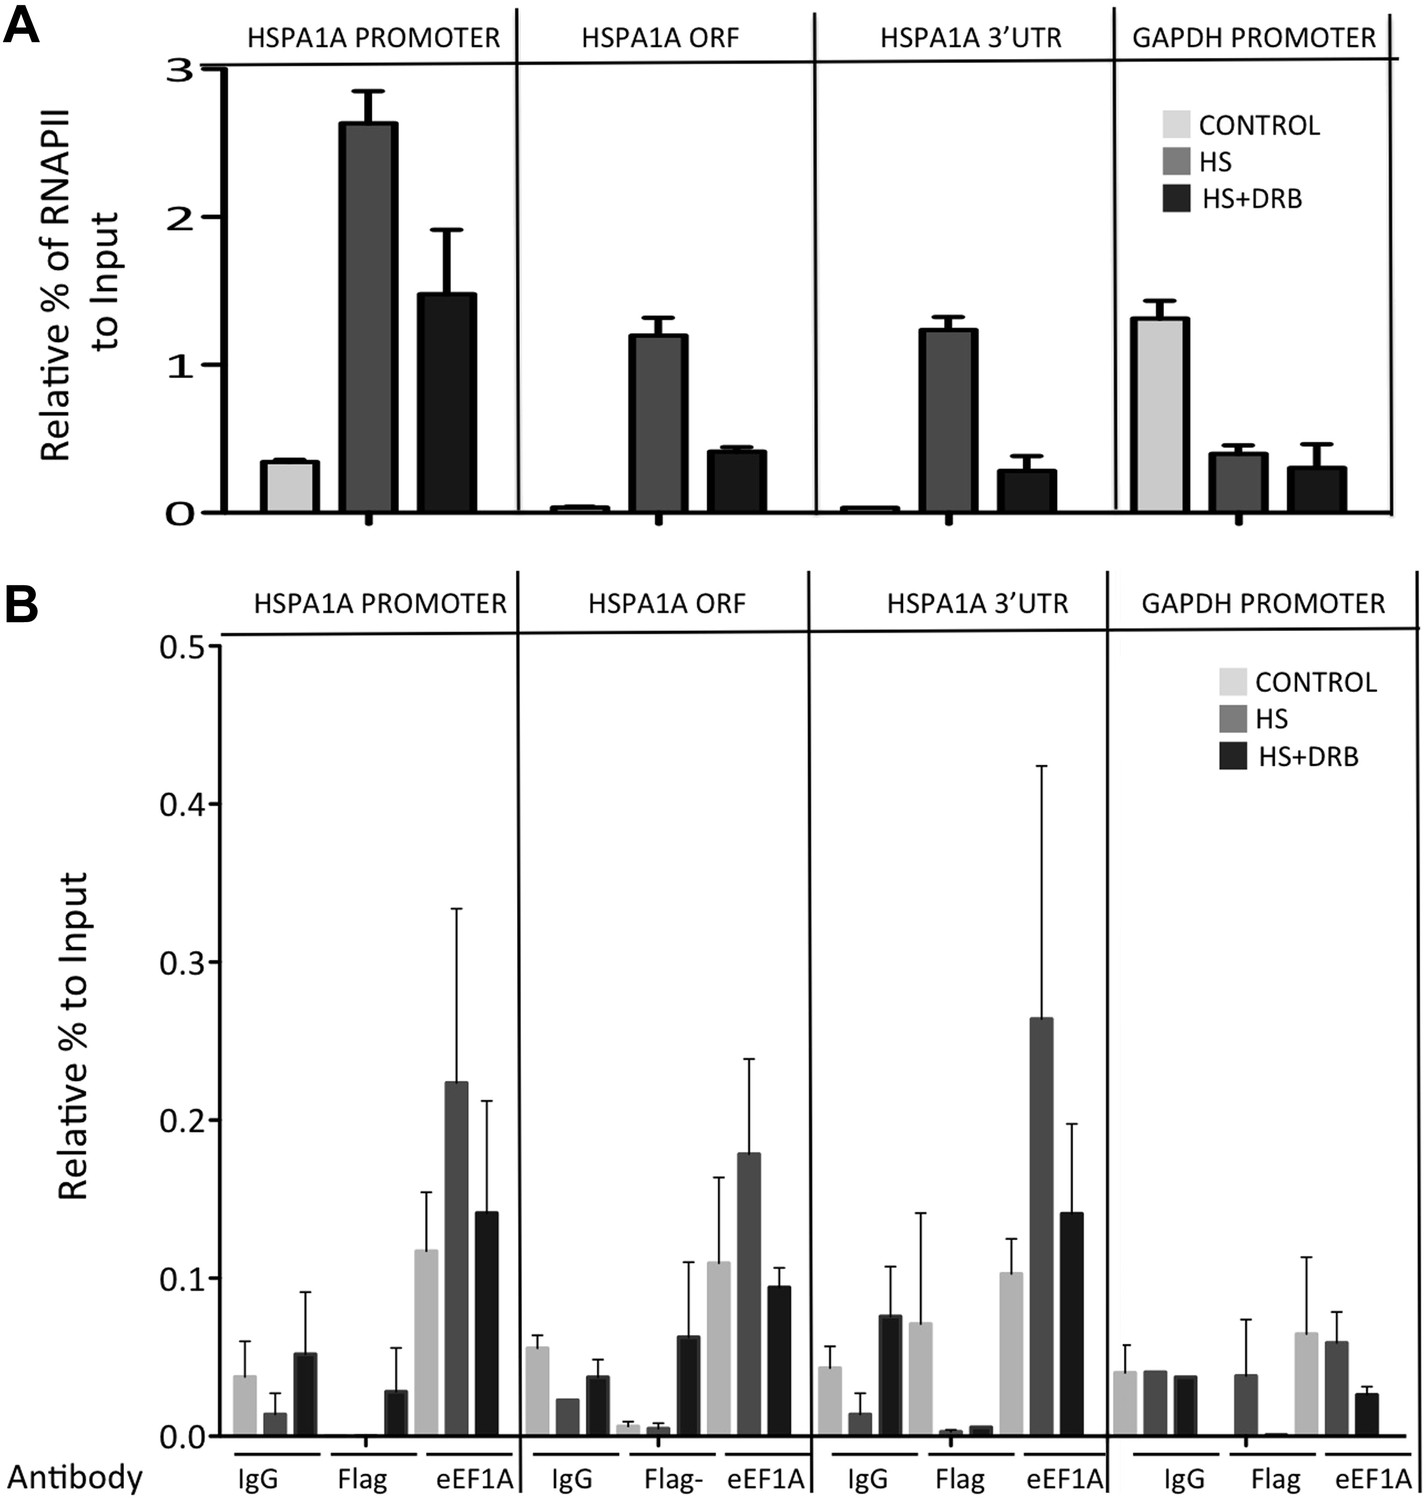
(A) eEF1A1 localizes to HSP70 TS upon HS. MEFs were infected with a lentivirus expressing Cherry-eEF1A1. At the indicated times after HS, cells were fixed and HSP70 mRNA detected by FISH. Nucleus stained with DAPI. Merged images show HSP70 FISH in green and cherry-eEF1A1 in red. The nascent mRNA signal is much brighter than the Cherry-eEF1A1 because there were many nascent chains each detected with 48 probes (48 fluors), compared to a single fluorescent protein for eEF1A1, further diminished by fixation. Yellow arrows indicate TS for HSP70 where Cherry-eEF1A1 was also detected. Inset location indicated by white arrowheads. n = total number of cells analyzed from three independent experiments. (%) = percentage of TS with co-localization for eEF1A1. Bar = 10 microns. (B) eEF1A1 localizes in nuclear dots. MEFs were infected with a lentivirus expressing Cherry-eEF1A1. At 1 hr of HS cells were fixed and FISH was carried out to detect β-actin mRNA. Nucleus DAPI stained. Merged images show HSP70 FISH in green and Cherry-eEF1A1 in red. Arrowhead = inset location. Note that nuclear localization of Cherry-eEF1A1 does not coincide with the β-actin mRNA TS. (C) Quantification of co-localization between eEF1A1 and HSP70 TS. Percentages of co-localization were quantified by airlocalize software at the indicated HS times. Average of three different experiments. Total n = (80–90) cells per time point. (D) DRB decreases RNAPIIS2 and eEF1A1 occupancy within the HSP70 gene in HS cells. Data are the mean ± SEM from three independent experiments. MEF cells expressing eEF1A1 tagged with Cherry and Flag were kept under normal growth conditions (control) or heat-shocked for 40 min at 43°C (HS) or treated with 100 µM DRB for 15 min followed by HS (HS+DRB). ChIP was performed using antibodies for RNAPII phosphorylated at Ser2 (RNAPS2) and Flag eEF1A1 followed by QPCR with the indicated primers. (E) eEF1A1 binds RNAPII during heat shock. Extracts from unstressed (C) or heat-shocked (HS) MDA-MB231 cells were IP with an eEF1A1 antibody or IgG (mock). IP samples or total protein (Input) were subjected to SDS-PAGE and immunoblotting with RNAPII and eEF1A1 antibodies. (*) Indicates the hyperphosphorylated form of RNAPII.
Figure 3—figure supplement 1
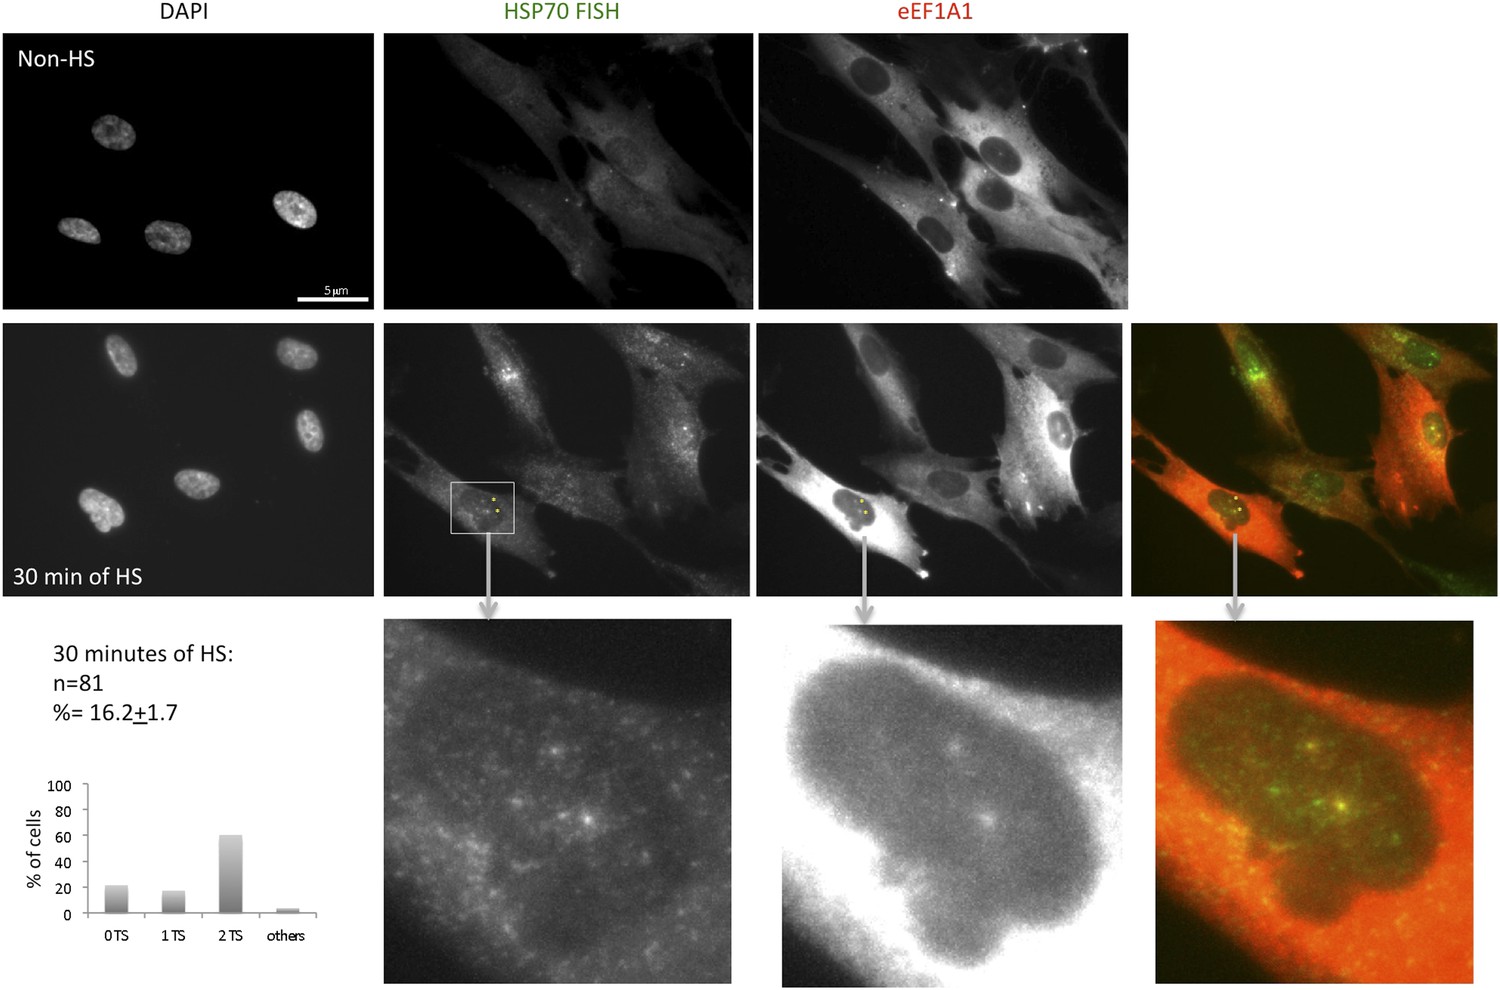
eEF1A1 localizes to HSP70 TS in the human fibroblast cell line TIG.
eEF1A1 localizes to HSP70 TS upon HS. TIGs (human fibroblast cell line) cells were infected with a lentivirus that expresses Cherry-eEF1A1. After 30 min of HS cells were fixed and subjected to FISH to the HSP70 mRNA. Nucleus stained with DAPI. Merged images show HSP70 FISH in green and cherry-eEF1A1 in red. Yellow arrows indicate TS for HSP70 where cherry-eEF1A1 was also detected. Inset location indicated by white arrowheads. n = total number of cells analyzed from three independent experiments. (%) = percentage of TS with colocalization for eEF1A1. Bar = 10 microns.
Figure 3—figure supplement 2

eEF1A1 localizes to HSP70 TS upon HS.
MEFs were infected with a lentivirus expressing Cherry-eEF1A1. At the indicated times after HS cells were fixed and HSP70 mRNA detected by FISH. Nucleus stained with DAPI. Merged images show HSP70 FISH in green and cherry-eEF1A1 in red. Yellow arrows indicate TS for HSP70 where cherry-eEF1A1 was also detected. Inset location indicated by white arrowheads. n = total number of cells analyzed from three independent experiments. (%) = percentage of TS with colocalization for eEF1A1. Bar = 10 microns.
Figure 3—figure supplement 3
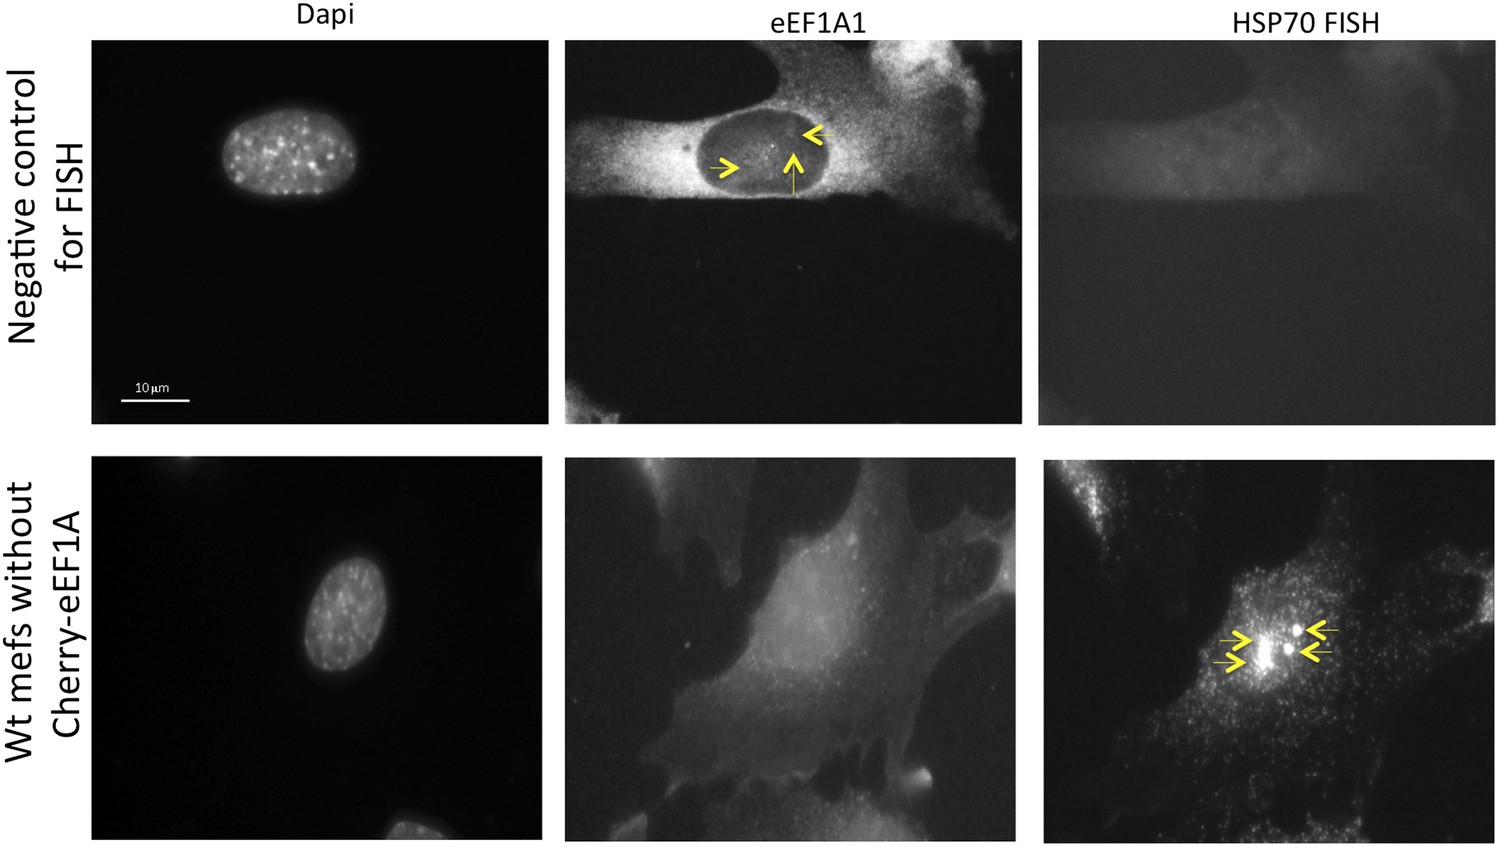
eEF1A1 localizes to HSP70 TS upon HS-negative controls.
The upper panels show immortalized MEFs expressing Cherry-eEF1A1 treated for FISH without adding any probe. Cells were heated for 40 min at 43°C before fixation. Nucleus stained with DAPI. Yellow arrows indicate dots of cherry-eEF1A accumulation in the nucleus. The lower panels show FISH for HSP70 mRNA in inmortalized MEFs non-expressing Cherry-eEF1A1. Cells were heated for 40 min at 43°C before fixation and FISH. Yellow arrows indicate HSP70 TS.
Figure 3—figure supplement 4
DRB decreases RNAPII and eEF1A1 occupancy within the HSP70 gene upon HS.
(A). Data are the mean ± SEM from three independent experiments. MEF cells expressing eEF1A1 tagged with Cherry and Flag were kept under normal growth conditions (control) or heat-shocked for 40 min at 43°C (HS) or treated with 100 μM DRB for 15 min followed by HS (HS+DRB). ChIP was performed using antibodies for total RNAPII followed by QPCR with primers for the indicated regions. (B) DRB decreases eEF1A1 occupancy within the HSP70 gene upon HS. Data are the mean ± SEM from three independent experiments. Transformed MEFs were mock treated and kept under normal growth conditions (control) or heat-shocked for 40 min at 43°C (HS) or treated with 100 μM DRB for 15 min followed by HS (HS+DRB). ChIP was performed using antibodies for eEF1A1 and Flag (in Flag–cells) or IgG followed by QPCR with the indicated primers.
Figure 4 with 1 supplement
eEF1A1 binds the 3′UTR of HSP70 mRNA and stabilizes it.
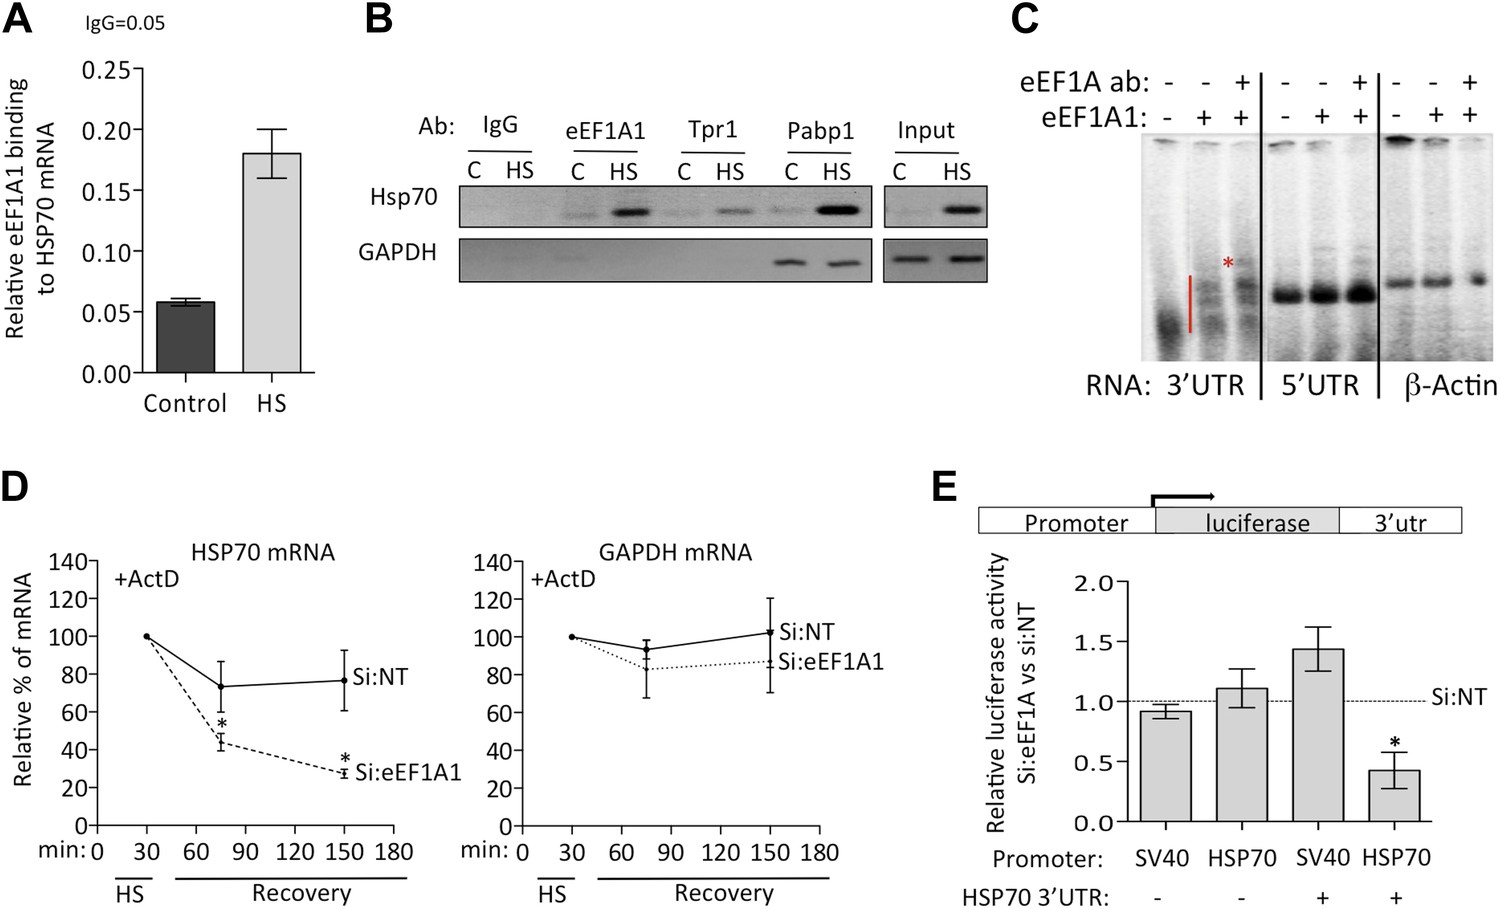
(A) eEF1A1 binds chromatin-associated HSP70 mRNA. Native ChIP samples were IPed using anti-eEF1A1 antibodies and reverse transcribed followed by HSP70 mRNA quantification. Data are represented as mean ± SEM from three independent experiments. (B) eEF1A1 interacts with the HSP70 mRNA in vivo as detected by RNA-IP. The panel shows the RT-PCR products of HSP70 and GAPDH mRNA from control (C) and heat-shocked (HS) cells after IP with indicated antibodies. IgG indicates the mock control. Input is total RNA. (C) Interaction between the HSP70 mRNA 3′UTR and eEF1A1 as detected by RNA-EMSA. 4 μg of purified eEF1A1 were incubated with 105 cpm of the 3′UTR or 5′UTR of HSP70 mRNA or a 200 nt fragment of the β-actin ORF radiolabeled by in vitro transcription. Only the 3′UTR of HSP70 mRNA was shifted by eEF1A1 (red line) and further super-shifted by 4 μg of antibody against eEF1A1 (red star). (D) Knock down of eEF1A1 diminishes HSP70 mRNA stability. Actinomycin D (Ac) was added 30 min after the onset of heat shock. The level of HSP70 and GAPDH mRNA at this time was taken as 100%. Data are represented as mean ± SEM from three experiments. *p < 0.05. (E) eEF1A1-mediates luciferase expression cloned in a HSP70 backbone plasmid. Mock transfected (si:NT) or eEF1A1-knocked down (si:EF) MDA-MB231 cells were transfected with plasmids expressing the SV40- or HSP70-driven luciferase gene fused to the HSP70 3′UTR, and a SV40-renilla luciferase plasmid used as a control. Luciferase activity was measured in cells heat-shocked for 1 hr at 43°C followed by 4 hr of recovery at 37°C. The values were normalized to those of renilla in the same cellular extracts. Bars represent luciferase activity in eEF1A1-deficient cells relative to that obtained for mock-transfected cells. Data are represented as mean ± SEM from three experiments. *p < 0.05.
Figure 4—figure supplement 1
eEF1A1 binds the 3′UTR of HSP70 mRNA and stabilizes it.
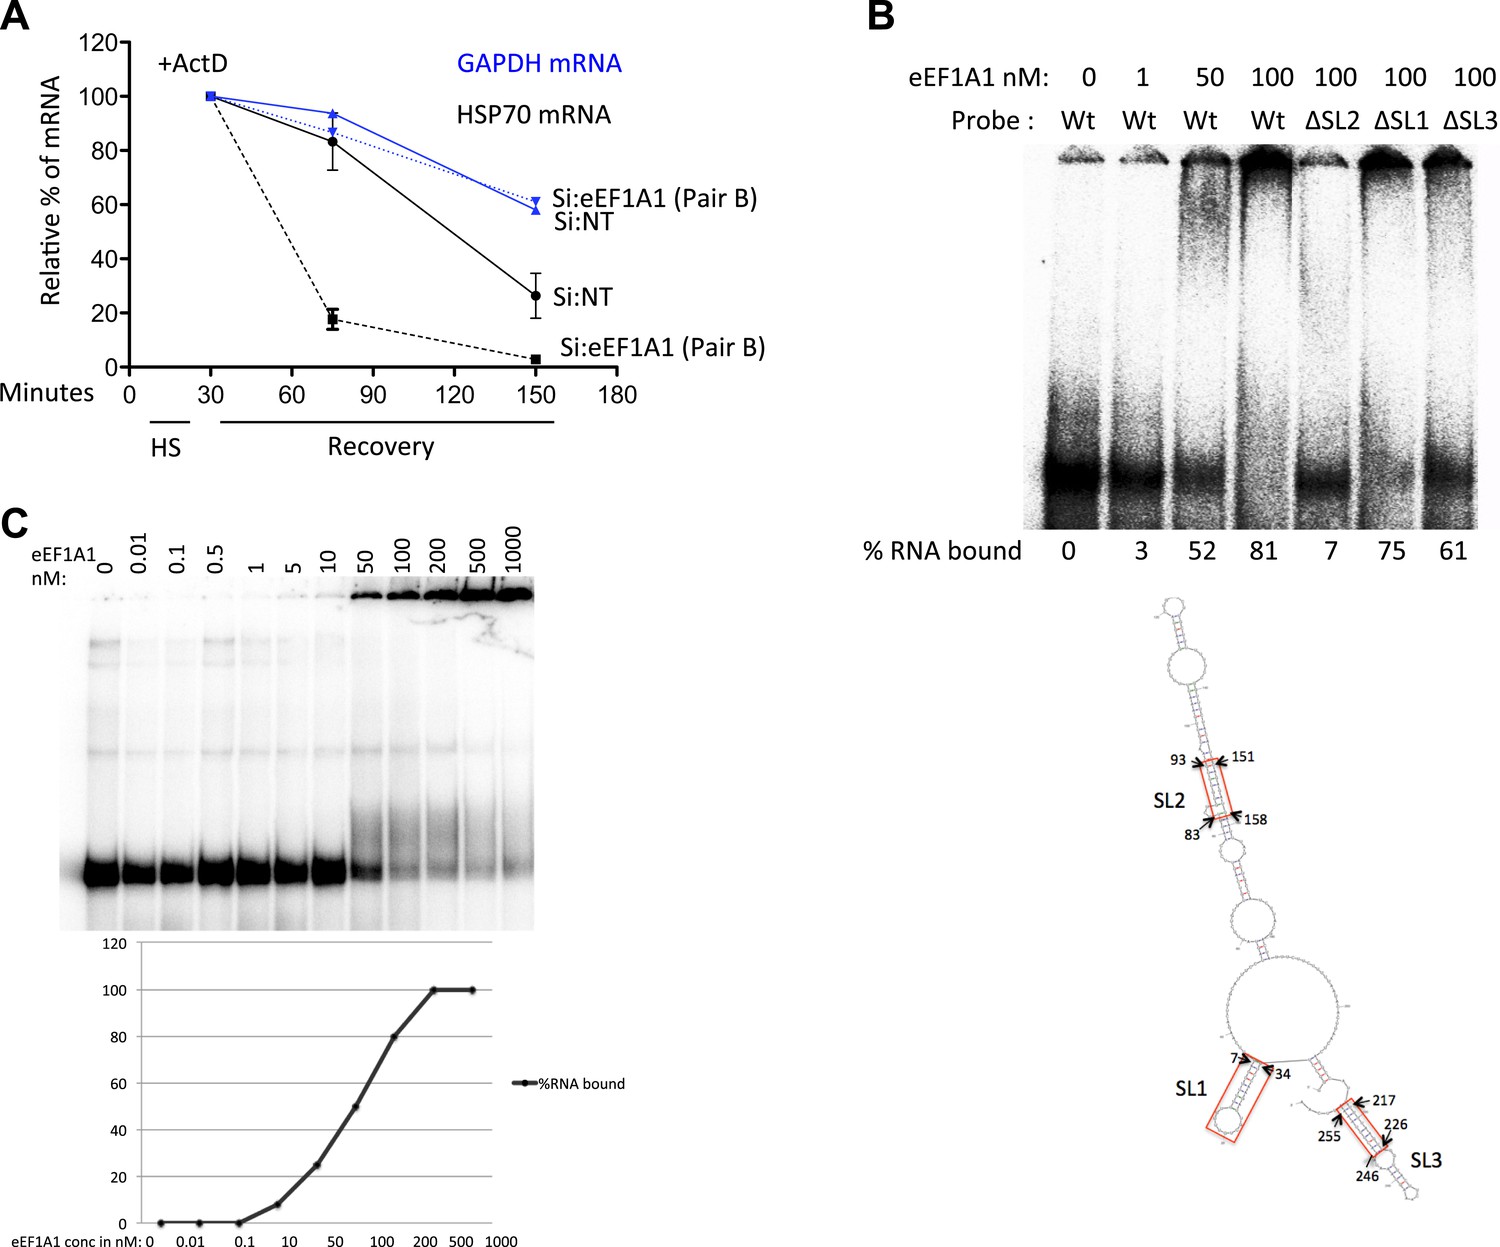
(A) Knock down of eEF1A1 diminishes HSP70 mRNA stability. Actinomycin D (Ac) was added 30 min after the onset of heat shock. The level of HSP70 and GAPDH mRNA at this time point was taken as 100%. Data are represented as mean ± SEM from two experiments. (B) eEF1A1 binds to stem-loop 2 of the HSP70 3′UTR as determined by EMSA. Indicated concentrations of purified eEF1A1 were incubated with 20 kcpm of in vitro transcribed, end labeled HSPA1A 3′UTR RNA (∼0.1 pmol/µl) for 30 min at room temperature. Probe Wt refers to HSPA1A 3′UTR sequence, ΔSL1 is the deletion of nt 7–34, ΔSL2 is the deletion of nt 83–93, 151–158, ΔSL3 is the deletion of nt 217–226, 246–255. M-fold predicted structure for HSPA1A 3′UTR is shown. The stem-loops are marked SL1, SL2, and SL3. The deletion regions are indicated by red rectangles. (C) Determination of the dissociation constant for eEF1A1-HSP70 3′UTR. Experiment was performed as in B.
Figure 5 with 1 supplement
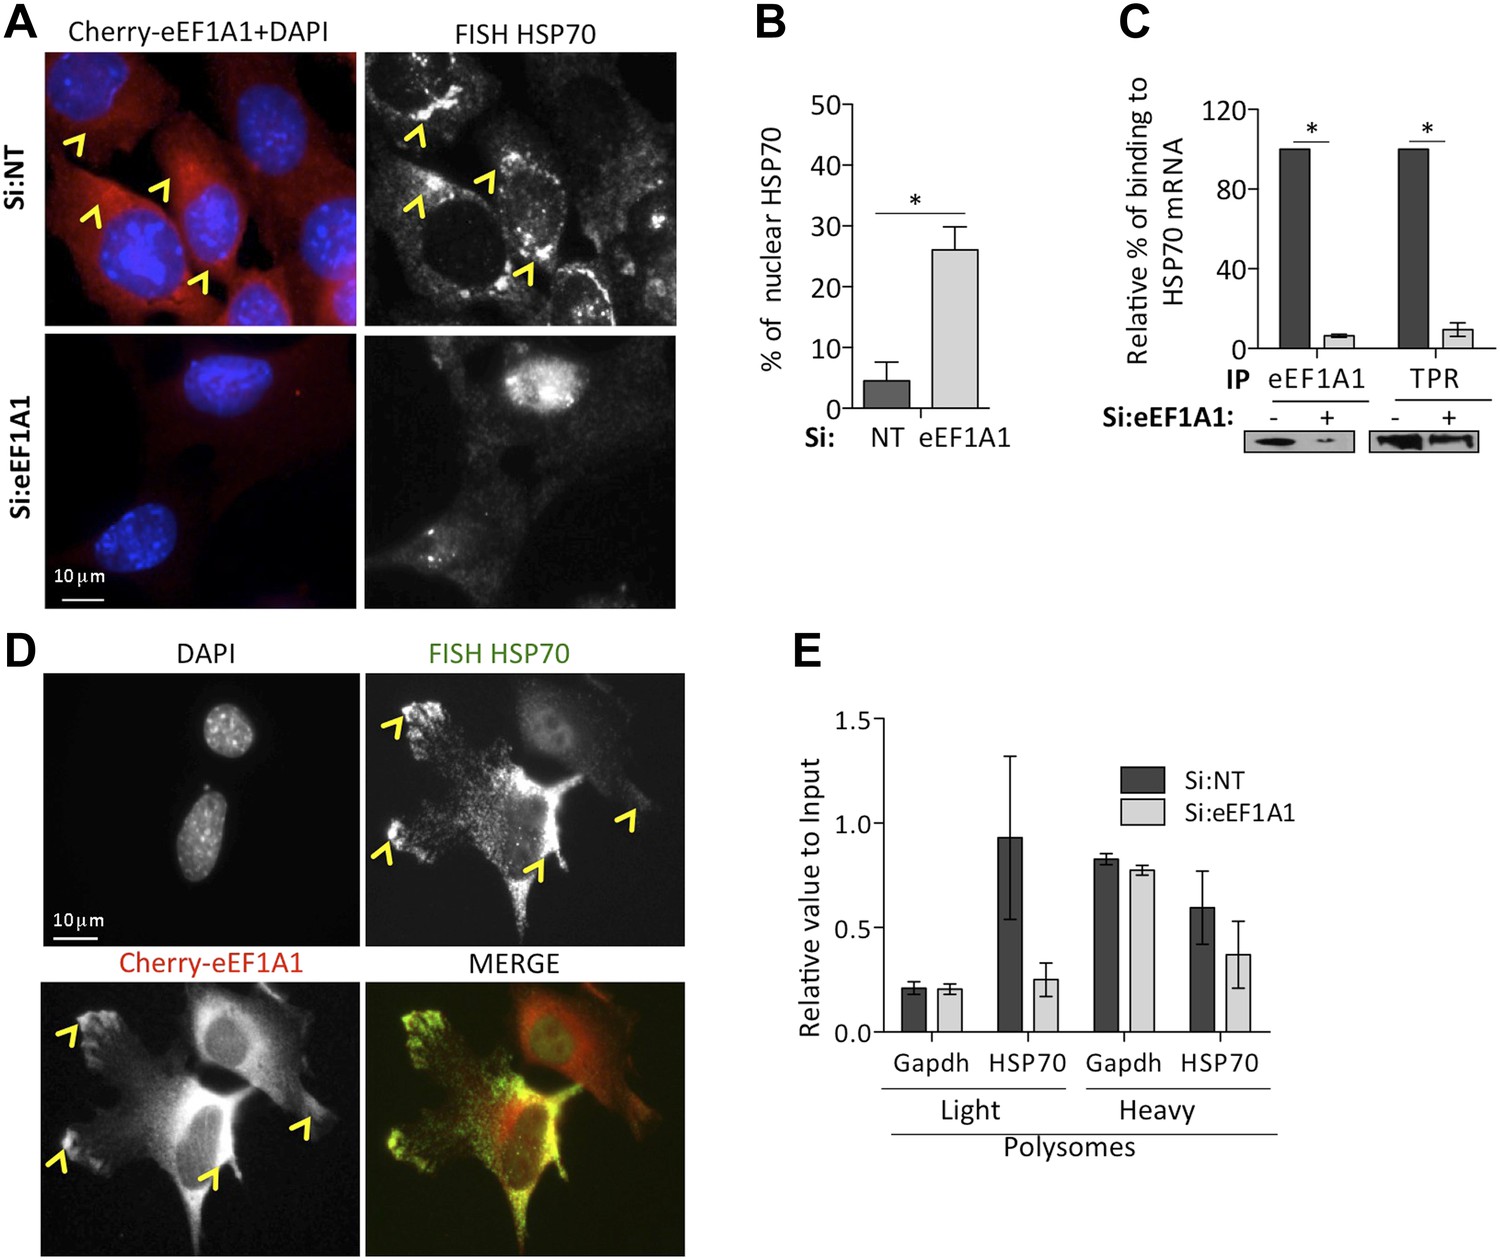
eEF1A1 is required for HSP70 mRNA export from the nucleus.
(A) eEF1A1 mediates HSP70 mRNA export upon HS. MEFs were infected with a lentivirus expressing Cherry-eEF1A1. eEF1A1 expression was knocked down by siRNA. At 120 min after HS cells were fixed and HSP70 mRNA detected by FISH. Nucleus stained with DAPI. Merged images show cherry-eEF1A1 in red and nucleus in blue. Gray image shows HSP70 mRNA FISH. Bar = 10 microns. (B) HSP70 mRNA retention in the nucleus of eEF1A1-knocked down cells. The plot shows total (T) and nuclear (N) HSP70 mRNA in control (Si:NT) or eEF1A1-knocked down cells after heat shock. RNA from HeLa cells was RT with random primers followed by quantification of GAPDH and HSP70 mRNAs by QPCR. Total or nuclear HSP70 mRNA was normalized to that of total GAPDH. Data are represented as the mean ± SEM from three independent experiments. *p < 0.05. (C) Knock down of eEF1A1 suppresses binding of TPR1 to HSP70 mRNA. HSP70 mRNA was co-IPed with antibodies against eEF1A1 or TPR1 from heat-shocked HeLa cells knocked down of eEF1A1 or mock transfected. Total and IP RNA was RT with random primers and GAPDH and HSP70 mRNAs were quantified by QPCR. Total and IP HSP70 mRNA was normalized against total GAPDH mRNA. Data are represented as the mean ± SEM from three experiments. (D) MEFs were infected with a lentivirus expressing Cherry-eEF1A1. At 120 min of HS, cells were fixed and HSP70 mRNA detected by FISH. Nucleus stained with DAPI. Merged images show HSP70 FISH in green and cherry-eEF1A1 in red. Yellow arrowheads indicate areas with high density of HSP70 mRNA and brighter signal for cherry-eEF1A1. (E) eEF1A1 contributes to loading of HSP70 mRNA into polysomes. RNA collected from light and heavy polysome fractions was reverse-transcribed with random primers followed by quantification of GAPDH and HSP70 mRNAs by QPCR. Values relate to those obtained from total RNA (Input). Data are presented as the mean ± SEM from three independent experiments.
Figure 5—figure supplement 1
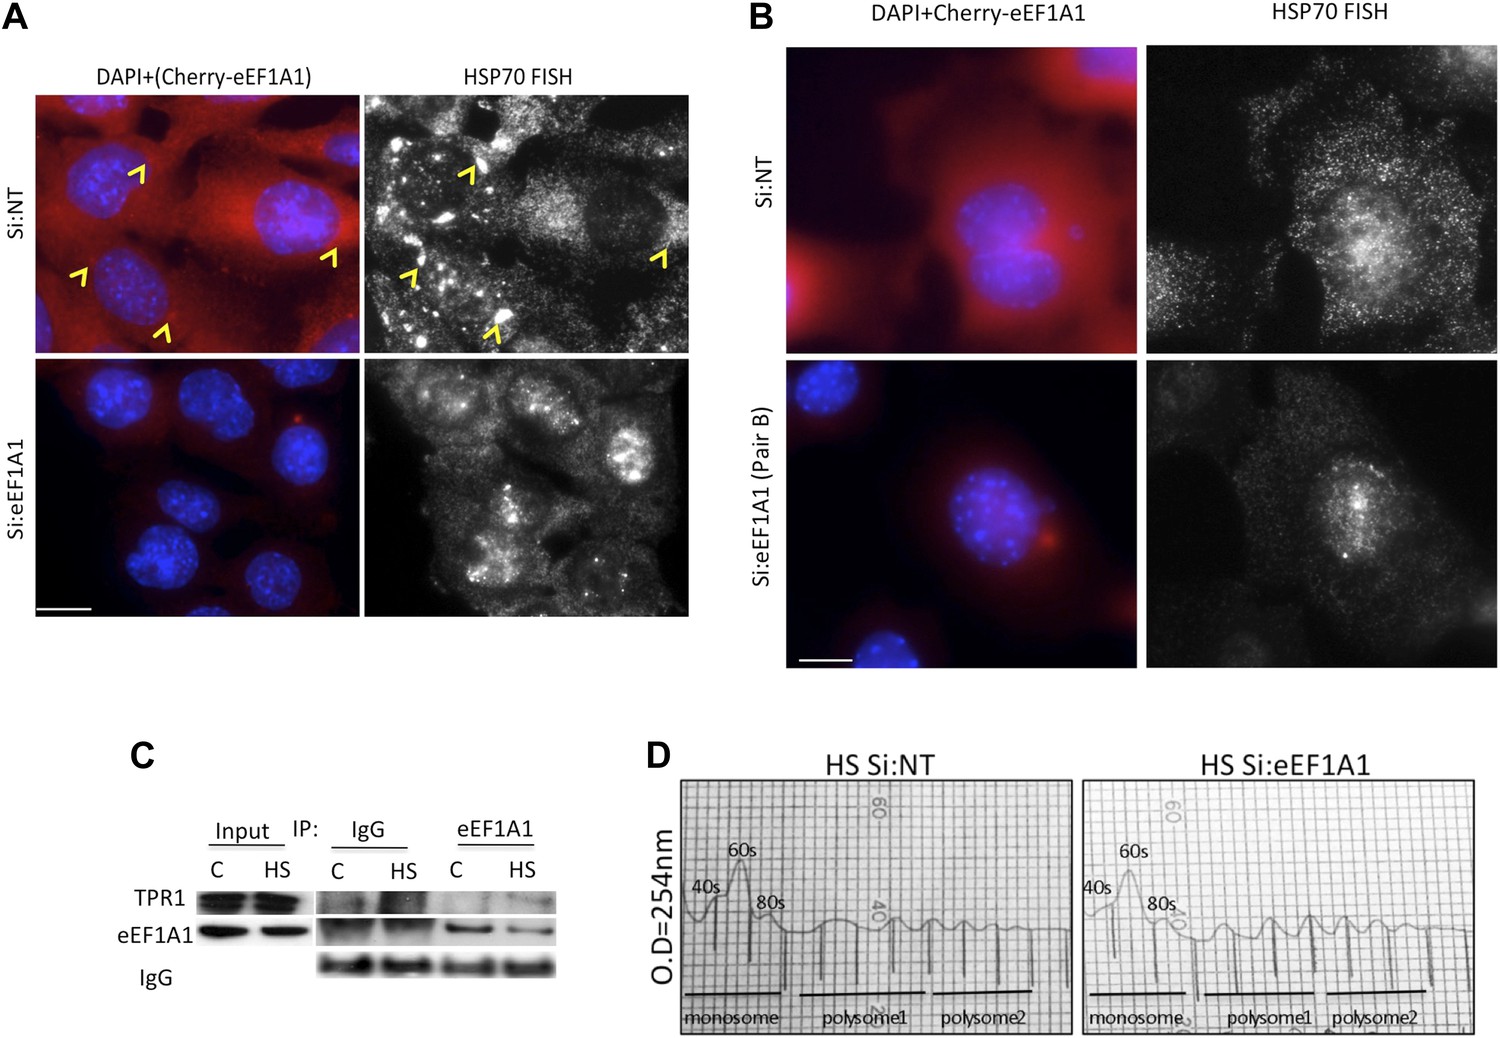
eEF1A1 facilitates the export of HSP70 mRNA.
(A and B) eEF1A1 mediates HSP70 mRNA export upon HS. MEFs were infected with a lentivirus expressing Cherry-eEF1A1. eEF1A1 expression was knocked down by siRNA (pair A for A and pair B for B). At 120 min after HS cells were fixed and HSP70 mRNA detected by FISH. Nucleus stained with DAPI. Merged images show cherry-eEF1A1 in red and nucleus in blue. Gray image shows HSP70 mRNA FISH. Bar = 10 microns. Yellow arrowheads indicate areas with high density of HSP70 mRNA and brighter signal for cherry-eEF1A1. (C) Extracts from unstressed (C) or heat-shocked (HS) MDA-MB231 cells (60 min at 43°C) were IPed with eEF1A1 antibody or IgG. IP samples or total protein (Input) were subjected to SDS-PAGE and immunoblotting with the indicated antibodies. (D) MDA-MB-231 cells were mock-transfected (Si:NT) or knocked-down eEF1A1 (Si:eEF1A1). 48 hr after transfection cells were heat-shocked at 43°C for 30 min and left for recovery at 37°C for 30 min. Cell lysates were laid on 10–55% sucrose gradients and sedimented for 2 hr at 30,000 rpm (43). This allows the separation of larger ribosome-associated mRNAs from translationally inactive sub-polysomal mRNAs. Gradients were collected in 750 μl fractions (the vertical lines in the figure indicate each fraction). Collection was done in an ISCO fraction collector while monitoring the absorbance at 254 nm (y axis). The positions of absorbance peaks corresponding to monosome (40S, 60S, and 80S), and polysomes 1 (2-, 3-, 4-ribosomes per mRNA molecule) and polysomes 2 (5-, 6-, 7-ribosomes per RNA molecule) are indicated. Cells knocked-down for eEF1A1 showed the same polysome profile as Si:NT cells.
Figure 6
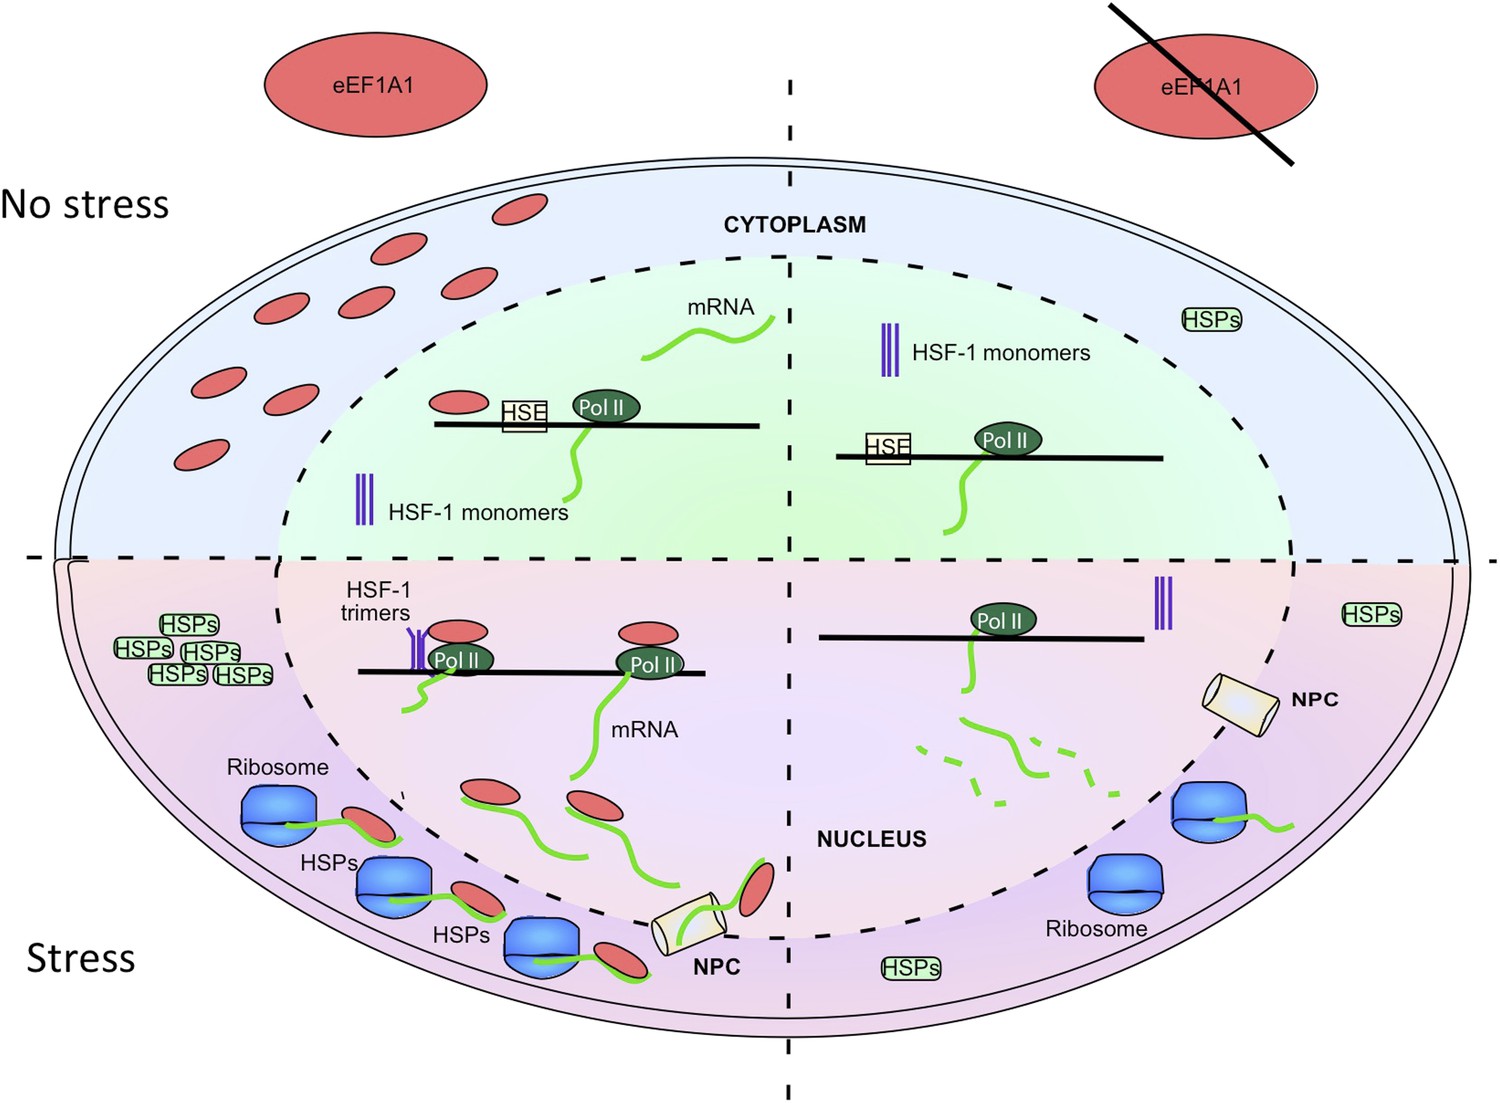
eEF1A1 synchronizes the expression of HSP70 mRNA from transcription to translation.
The cartoon summarizes the results of this study, implicating eEF1A1 at each stage of HSPs induction. Prior to stress, eEF1A1 resides mostly in the cytoplasm where it is an essential component of the translation machinery (top left quadrant). Upon heat shock (bottom left quadrant), a fraction of eEF1A1 is detected in the HSP70 locus where it recruits HSF1 to an HSP70 promoter, thus activating transcription. eEF1A1 interacts with elongating RNAP II and binds the 3′UTR of HSP70 mRNA to stabilize the transcript and to export it to cytoplasm for efficient translation. By synchronizing all the major steps of HSP70 gene expression, eEF1A1 renders the process of HSR exceptionally robust and coordinated. In cells knocked down for eEF1A1 HSP70 remain at low levels even when cells are stressed (right hand quadrants).
Author response image 1
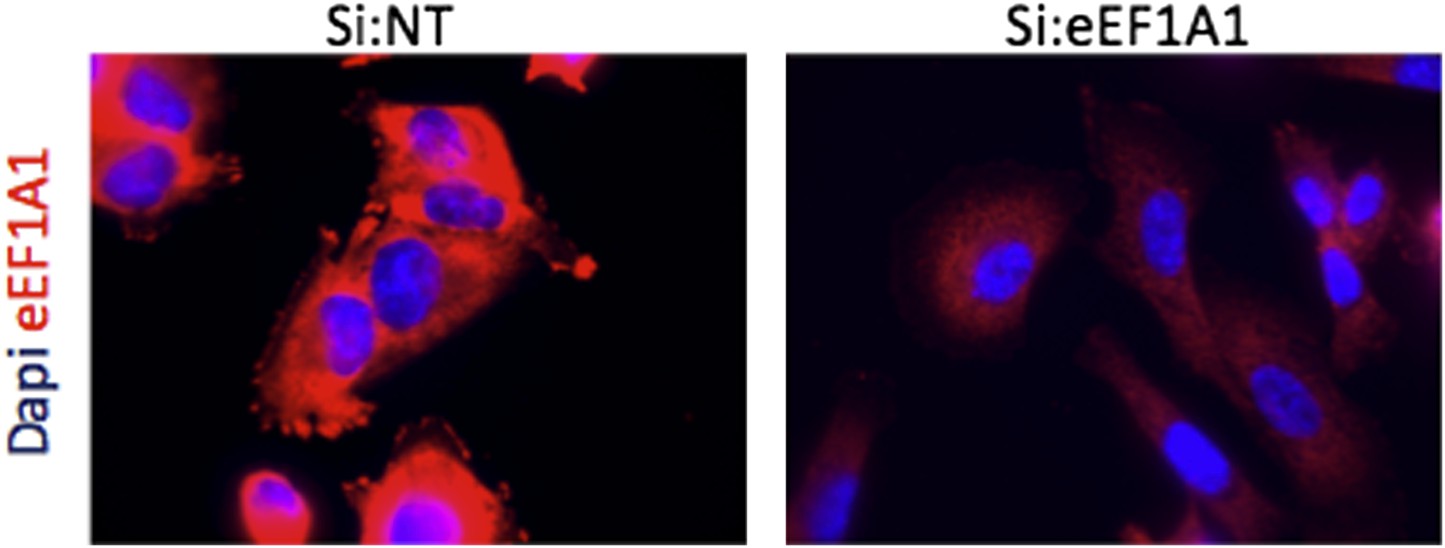
Immofluorescence of cells expressing Cherry-flag-eEF1A1 growing at 37°C. Mock transfected cells (Si:NT and cells knocked down for eEF1A1 (si:eEF1A1) were immunostained with an antibody specific for eEF1A1 (Millipore, # 05-235) and a secondary antibody (Invitrogen, goat anti mouse (alexa 647)) (red). Nucleus was stained with dapi (blue).
Additional files
-
Supplementary file 1
(A) Primers used in this work. (B) Fish probes used in this work.
- https://doi.org/10.7554/eLife.03164.022
Download links
A two-part list of links to download the article, or parts of the article, in various formats.
Downloads (link to download the article as PDF)
Open citations (links to open the citations from this article in various online reference manager services)
Cite this article (links to download the citations from this article in formats compatible with various reference manager tools)
The translation elongation factor eEF1A1 couples transcription to translation during heat shock response
eLife 3:e03164.
https://doi.org/10.7554/eLife.03164


