Common intermediates and kinetics, but different energetics, in the assembly of SNARE proteins
- Yale University School of Medicine, United States
- Yale University, United States
- UMR CNRS 8550 Associée aux Universités Paris 6 et Paris 7, Ecole Normale Supérieure, France
Figures
Figure 1 with 4 supplements
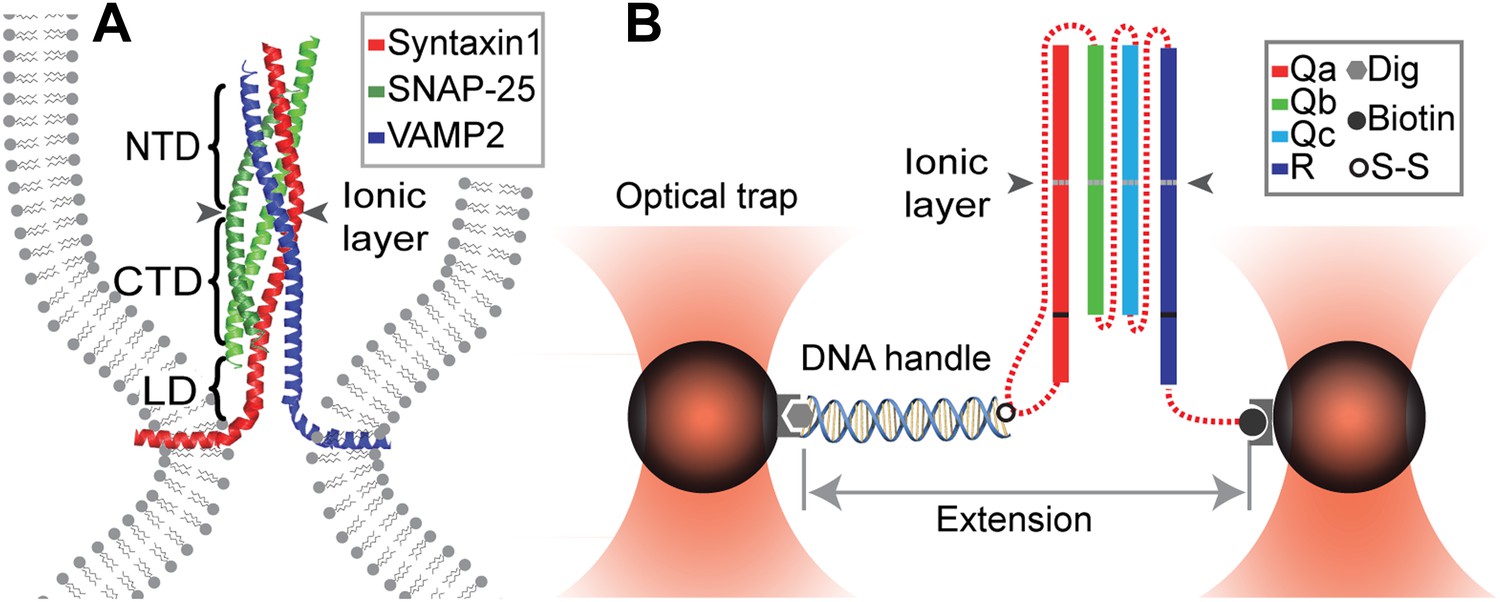
Chimeric SNARE construct and experimental setup used to study functional assembly of single SNARE complexes using dual-trap high-resolution optical tweezers.
(A) Modular parallel four-helix bundle structure of an assembled neuronal SNARE complex mediating membrane fusion. The SNARE complex contains different functional domains: an N-terminal domain (NTD), an ionic layer, a C-terminal domain (CTD), a linker domain (LD), two transmembrane domains, and other domains not shown here. (B) Diagram showing the chimeric SNARE construct and the experimental setup. Each SNARE complex contains one SNARE motif from the four highly conserved Qa, Qb, Qc, and R SNARE families. These motifs are joined into one protein through spacer sequences (dashed lines) to facilitate the single-molecule manipulation experiment. The same color coding for different SNARE proteins is used throughout this work. See Figure 1—figure supplement 1 for complete sequences of the chimeric SNAREs and Figure 1—figure supplements 2–4 for minimal effects of the spacer sequences on the folding energy and kinetics of the SNARE complexes.
Figure 1—figure supplement 1
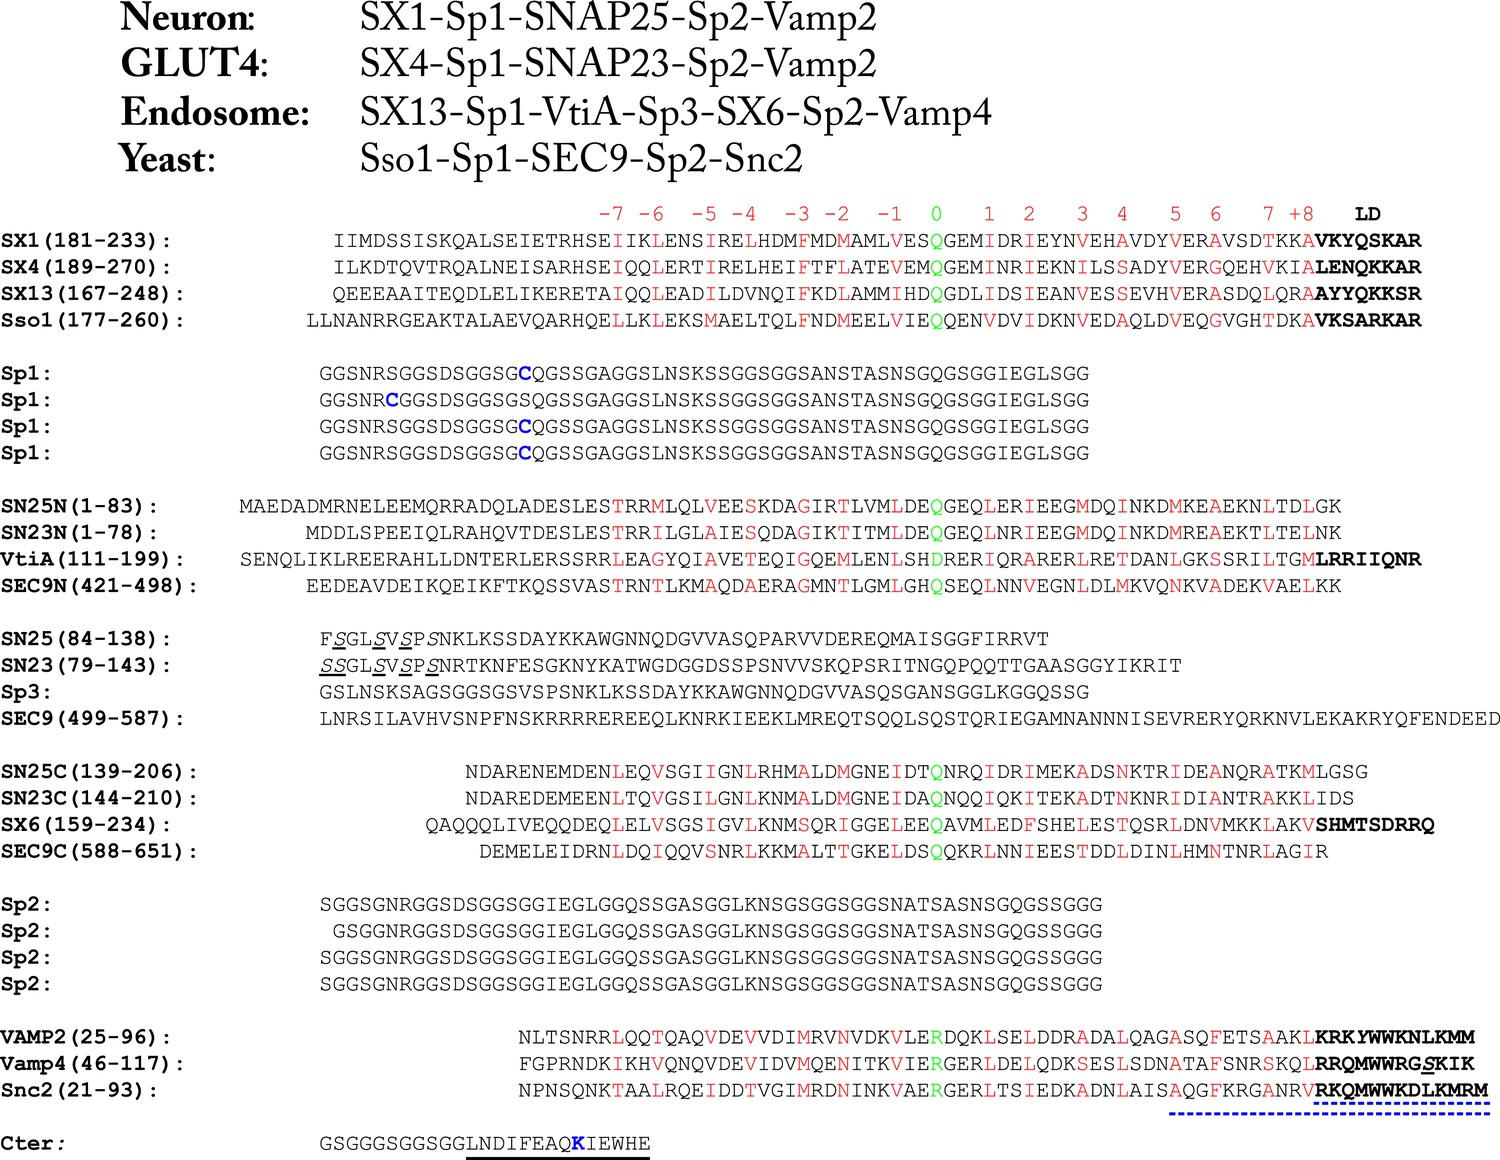
Amino acid sequences of the chimeric SNARE protein constructs used for the single-molecule manipulation study of SNARE assembly.
The four sets of SNARE proteins are neuronal SNAREs of rat syntaxin (SX) 1A, rat VAMP2, and mouse SNAP-25B, GLUT4 SNAREs of rat syntaxin 4A, rat SNAP-23, and rat VAMP2, endosomal SNAREs of rat syntaxin 13, mouse Vti1a, human Stx6, and mouse VAMP4, and yeast SNAREs of Sso1, Sec9, and Snc2. SNARE sequences within and between different rows are aligned in their SNARE motifs, in which amino acids in the 15 hydrophobic layers and the ionic layer are shown in red and green, respectively, with layer numbers (from −7 to +8) indicated above the sequences. The amino acids in the SNARE linker domains (LDs) are shown in bold. In yeast R SNARE Snc2, the amino acids deleted in the LD- and C-terminal domain (CTD)-truncated constructs (Figure 2—figure supplement 1) are underlined by blue dashed lines. All natural cysteine residues were mutated to serine (underlined and in italic). The pulling sites (cysteine and lysine) are indicated in blue. The spacer sequences (Sp1–Sp3) are derived from an unstructured sequence found in a POU transcription factor. The Avi-tag as a substrate for biotinylation (on lysine) is underlined by a black line.
Figure 1—figure supplement 2
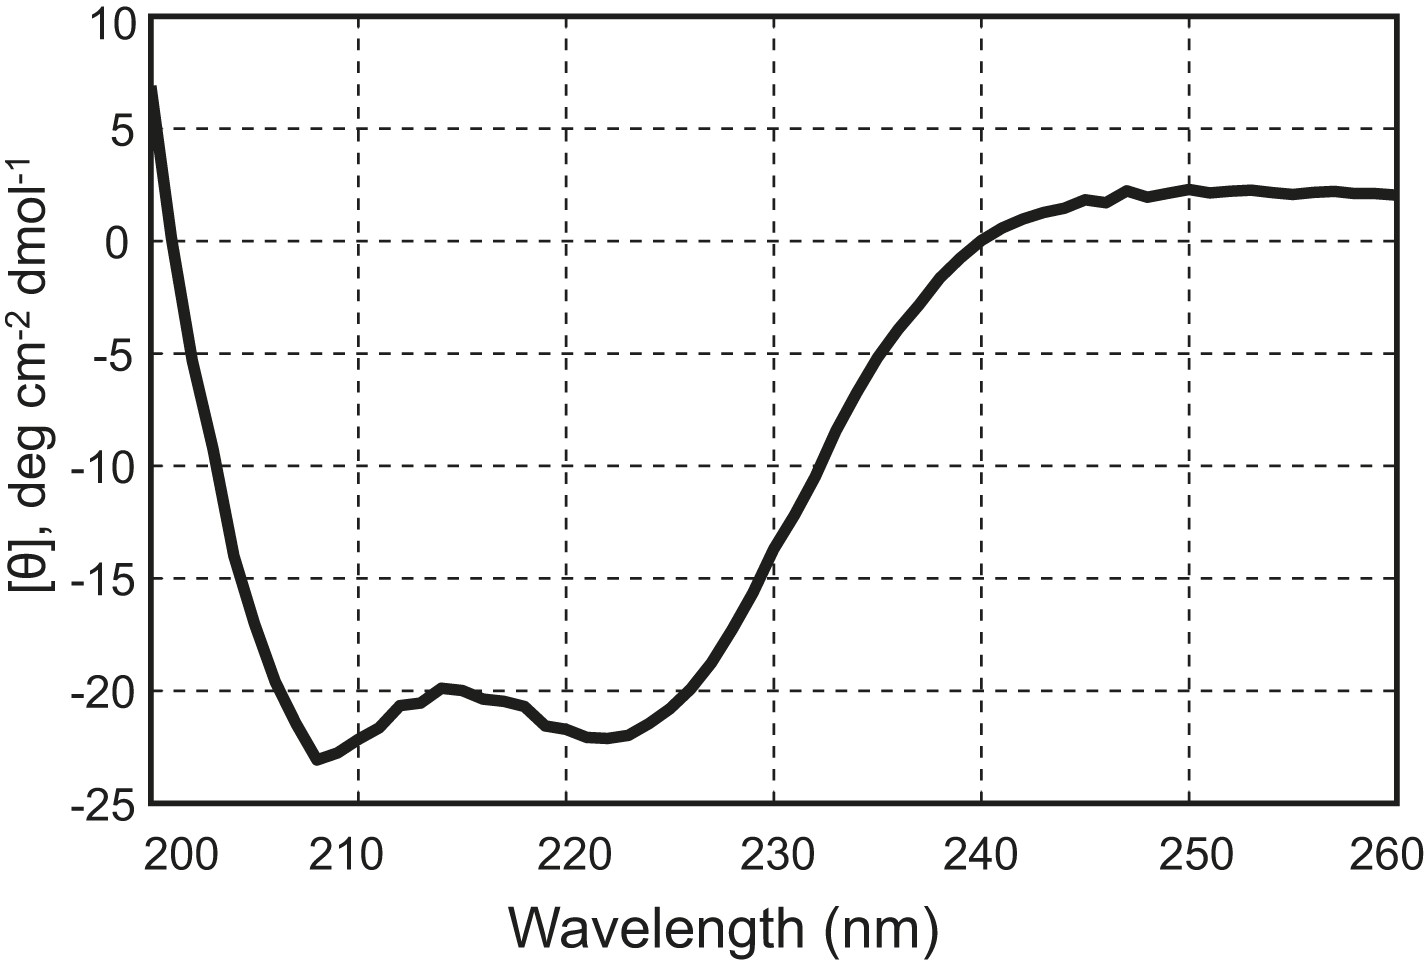
The chimeric neuronal SNARE protein correctly folds into an expected four-helix SNARE bundle.
Circular dichroism spectrum of the chimeric SNARE protein. The presence of two local minima at 208 nm and 222 nm indicates a high content of alpha-helical structure in the protein. Based on the CD spectrum, we estimated that about 50% of the amino acids in the protein are in an alpha-helical configuration, consistent with a fully folded SNARE four-helix bundle in the chimeric protein.
Figure 1—figure supplement 3
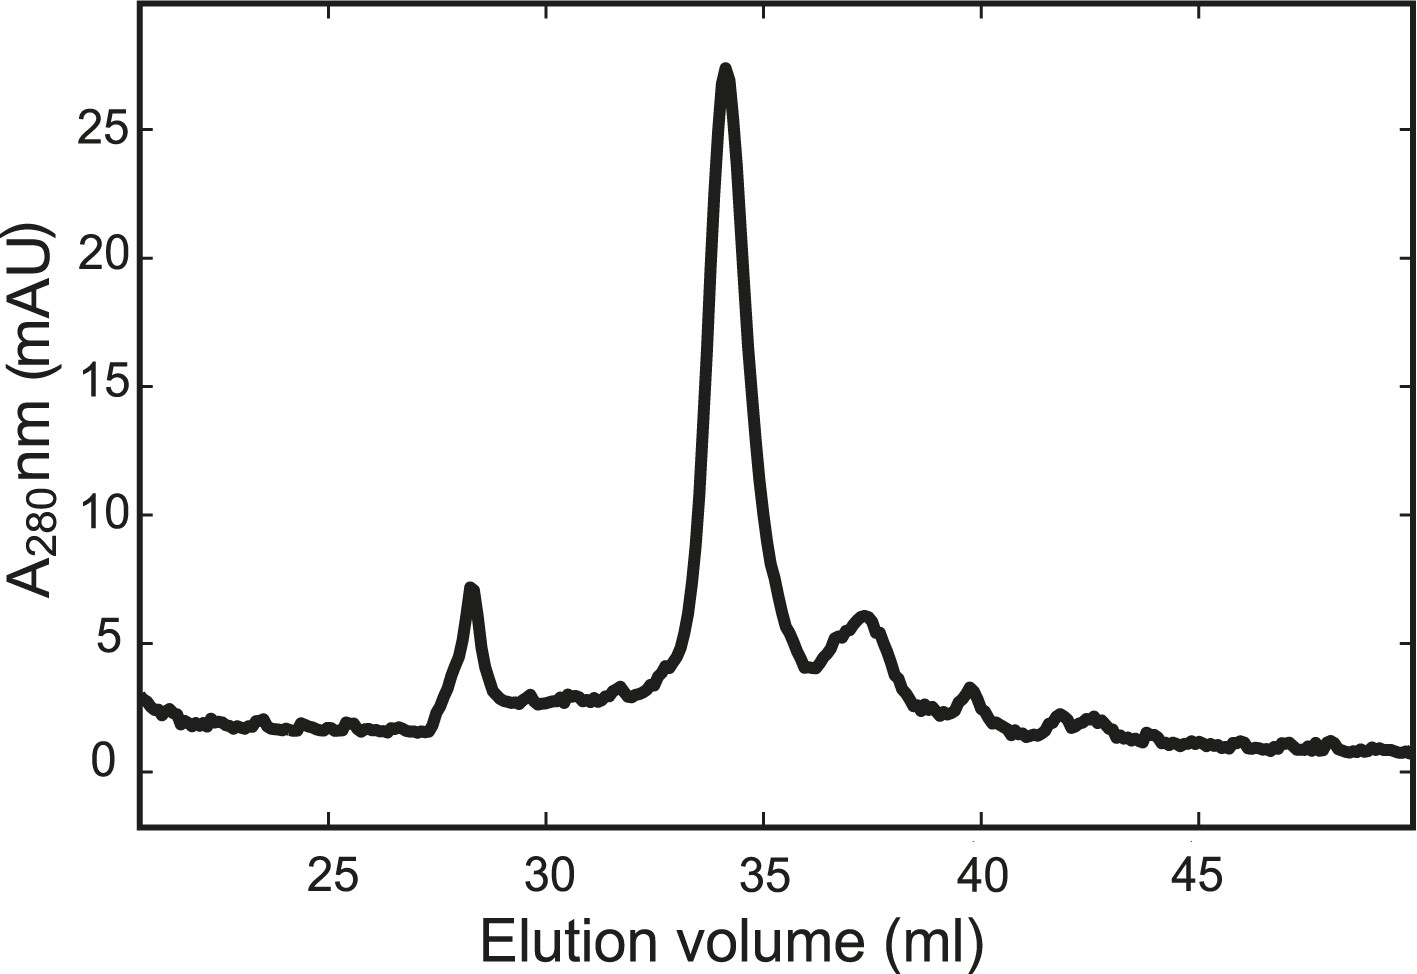
The chimeric neuronal SNARE protein folds into a homogenous SNARE four-helix bundle with an expected molecular weight.
Gel filtration profile of the chimeric protein. The purified chimeric SNARE protein was eluted from the column (Superdex 200 10/300 GL) in one major peak corresponding to a molecular weight of 57 kDa, consistent with a folded SNARE four-helix bundle.
Figure 1—figure supplement 4
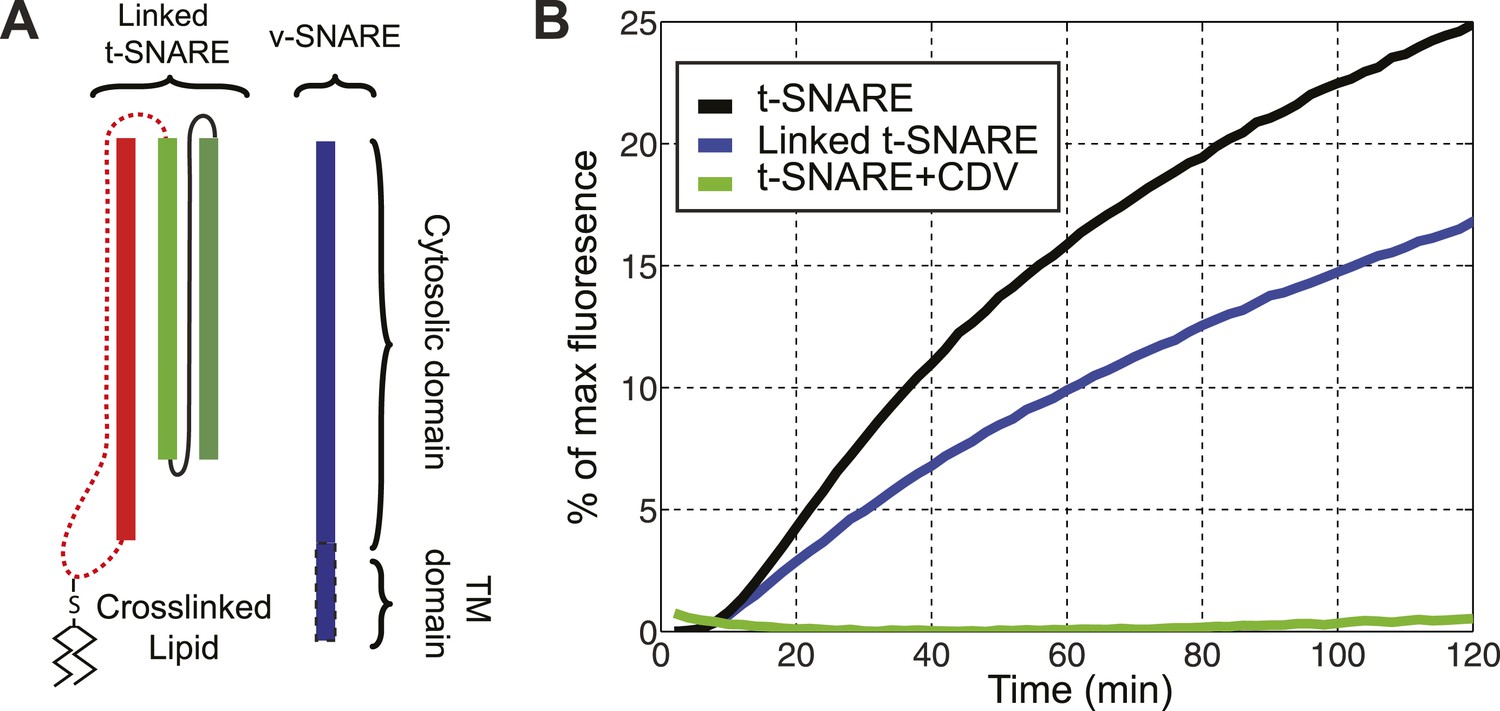
The chimeric t-SNARE protein supports lipid mixing between liposomes.
(A) Schematic representation of the chimeric t-SNARE and the v-SNARE used for the lipid-mixing assay. The chimeric t-SNARE protein is lipidated through a cysteine introduced to the C-terminus of syntaxin. (B) Comparison of membrane fusion activity mediated by the chimeric t-SNARE (blue) and the transmembrane domain truncated wild-type t-SNARE complex (black) in the fluorescence de-quenching assay. Both t-SNAREs were anchored to membrane through a unique cysteine at the C-termini of syntaxin. The fusion depends on formation of trans-SNARE complexes, as pre-incubation of t-SNARE proteoliposomes with the cytoplasmic domain of VAMP2 (CDV) inhibits membrane fusion (green). The reduced fusion activity of the chimeric t-SNARE compared to the wild-type t-SNARE was caused by the spacer sequence between the C-terminus of syntaxin and the cysteine residue (McNew et al., 2000; Figure 1—figure supplement 1).
Figure 2 with 4 supplements

Four representative SNARE complexes assemble or disassemble via common intermediates and pathways.
(A) Force-extension curves (FECs) of the neuronal, GLUT4, endosomal, and yeast SNARE complexes. FECs were obtained by pulling the complexes (black) or relaxing them (gray). The reversible C-terminal domain (CTD) and linker domain (LD) folding/unfolding transitions are marked by blue solid and dashed ovals, respectively, whereas irreversible unfolding of the partially zippered SNARE complex is indicated by a red arrow. Continuous FEC regions can be fit by the worm-like chain model and represent different SNARE states numbered as in (C). Below ∼6 pN, deviation of some fits from the measured FECs corresponding to the unfolded complex (state 5) may be caused by intramolecular interactions or partial refolding of the complex. The t-SNARE state can be identified from some FECs, with a transient one (∼20 ms) marked by a cyan rectangle. (B) Time-dependent extension, force, and trap separation corresponding to the CTD and N-terminal domain (NTD) transition region in the FEC of the GLUT4 SNARE complex in A (marked by two magenta dots). In the upper and middle panels, the positions of different SNARE folding states are indicated by red dashed lines. About 90 CTD transitions occurred before NTD unzipping and reaching ∼18.6 pN equilibrium force (indicated by a red arrow in the middle panel). Here the equilibrium force for a two-state protein folding/unfolding process is defined as the average state forces (marked by dashed lines) under which the folded and the unfolded states are equally populated. Note that most NTD unzipping took place in the CTD-unfolded state (state 3). In the middle panel, the first CTD and the first NTD unzipping events during the pulling process are indicated by green dots and their time and force differences indicated. The time and force distributions are shown in Figure 3B,C. In the bottom panel, the separation between two optical traps was increasing at a speed of 10 nm/s to slowly pull the single SNARE complex. (C) Different SNARE assembly states partly derived from model-fitting of FECs shown in (A). Gray arrows indicate the pulling direction. Data associated with all FECs shown in this work were mean-filtered using 5 ms time window. See more FECs and their associated features in Figure 2—figure supplements 1–4.
Figure 2—figure supplement 1
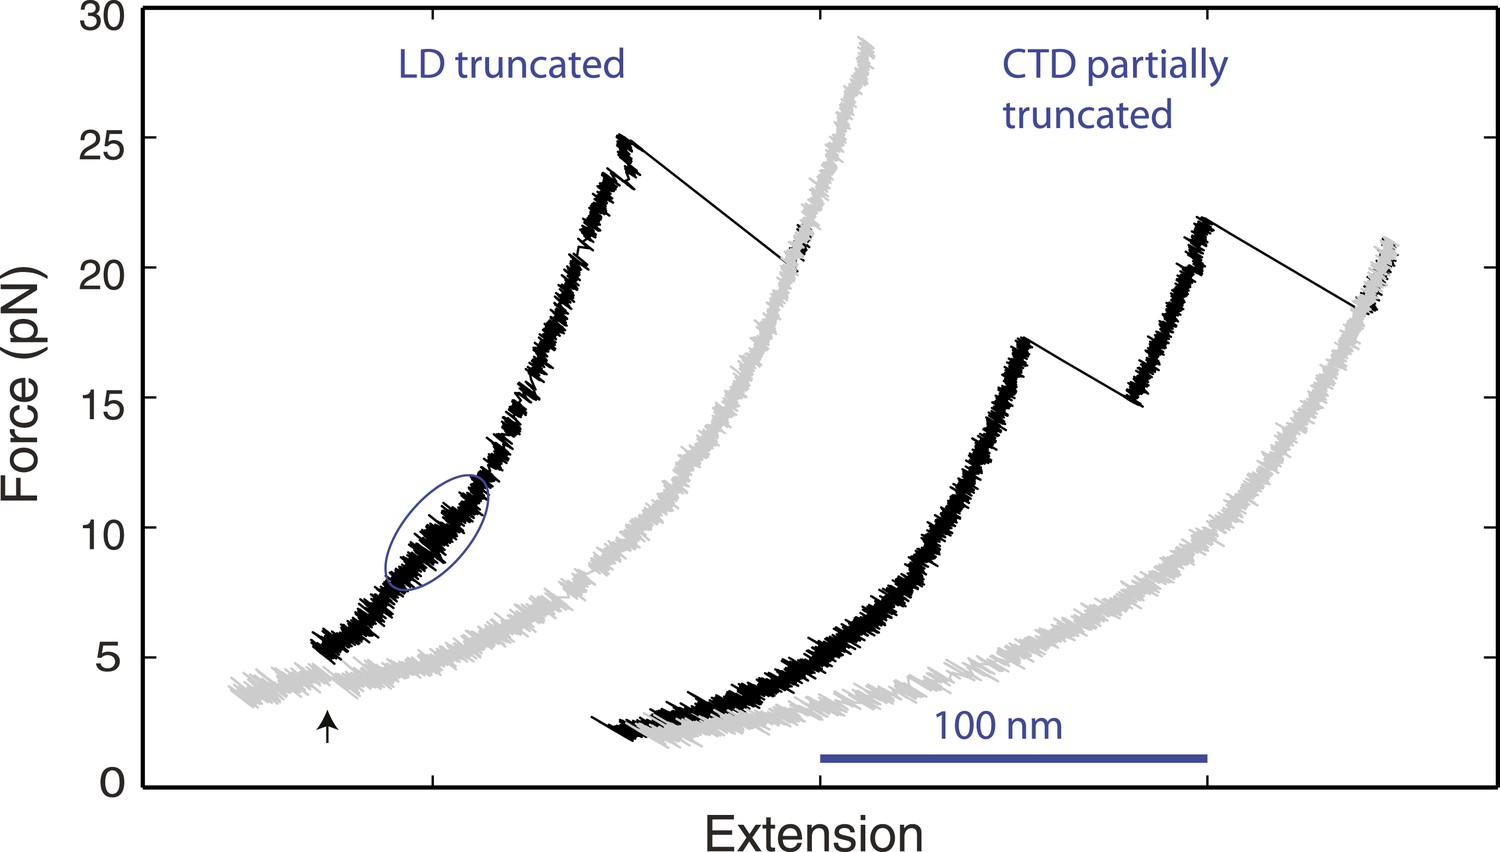
Distinct linker domain and C-terminal domain transitions.
Force-extension curves (FECs) of yeast SNARE complexes containing the v-SNARE Snc2 truncated in the linker domain (LD) region or in both the LD region and part of the C-terminal domain (CTD) region (Figure 1—figure supplement 1). The CTD transition in the LD-truncated complex is marked by a solid blue oval. The cooperative SNARE reassembly is indicated by a black arrow.
Figure 2—figure supplement 2
The neuronal t-SNARE complex as a transient unfolding intermediate of the half-zippered SNARE complex.
Force-extension curves (FECs) of a single neuronal SNARE complex corresponding to three pulling cycles. The inset shows close-up views of the unfolding process of the half-zippered SNARE complex in extension-time trajectories. The transient t-SNARE complex appeared in the second pulling cycle (indicated by a cyan rectangle), but was not discernible in the other two pulling cycles. Note that the C-terminal domain (CTD) transition seen in the second pulling cycle was significantly slower than those in the other cycles.
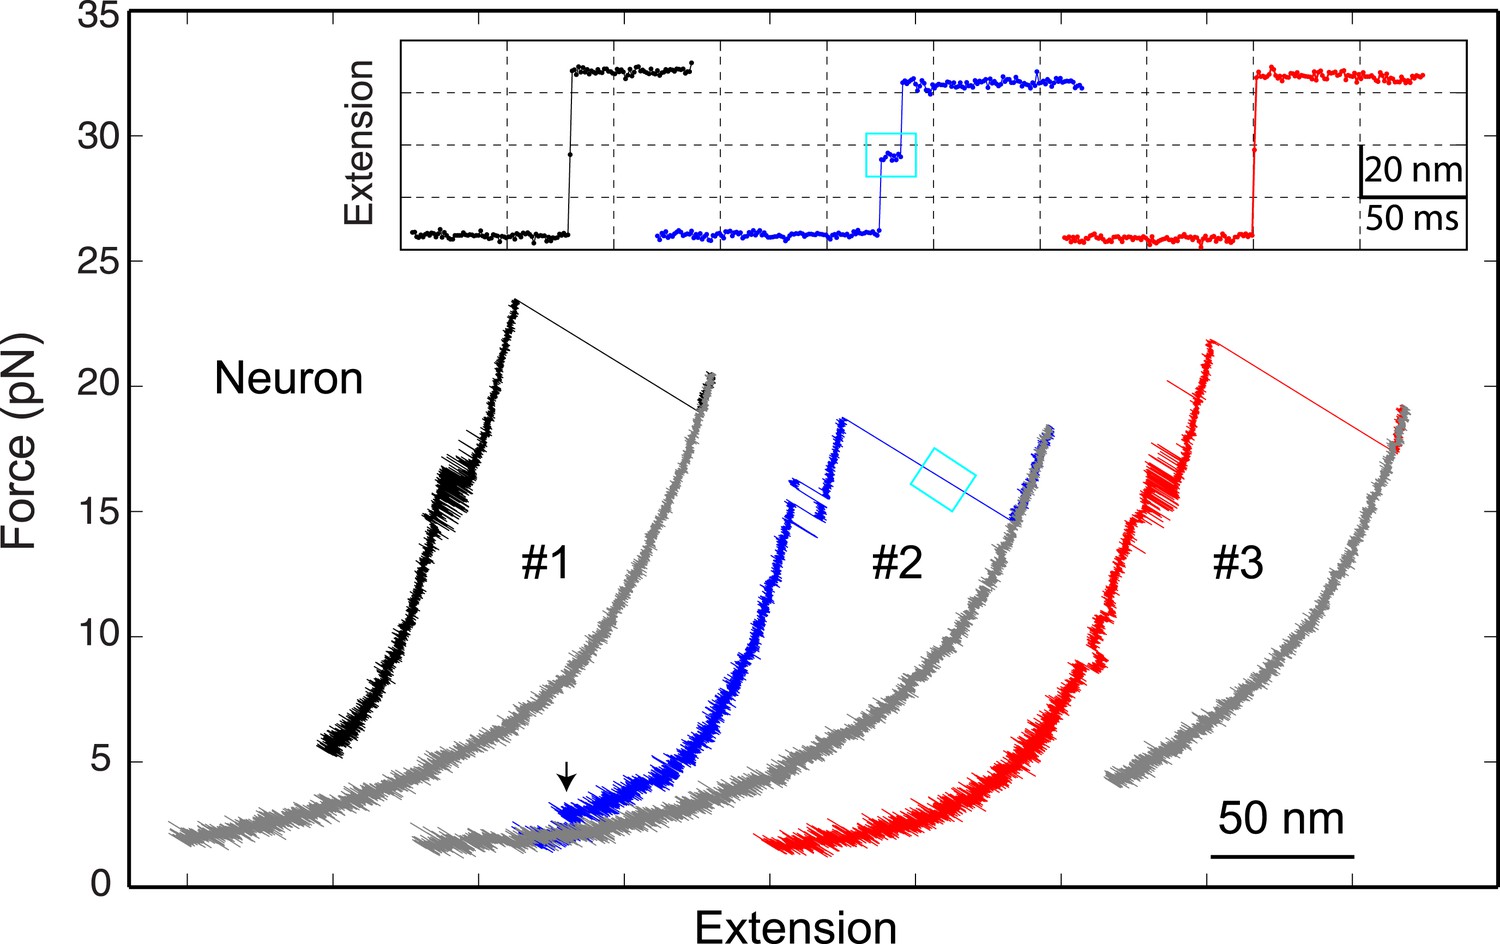
Figure 2—figure supplement 3
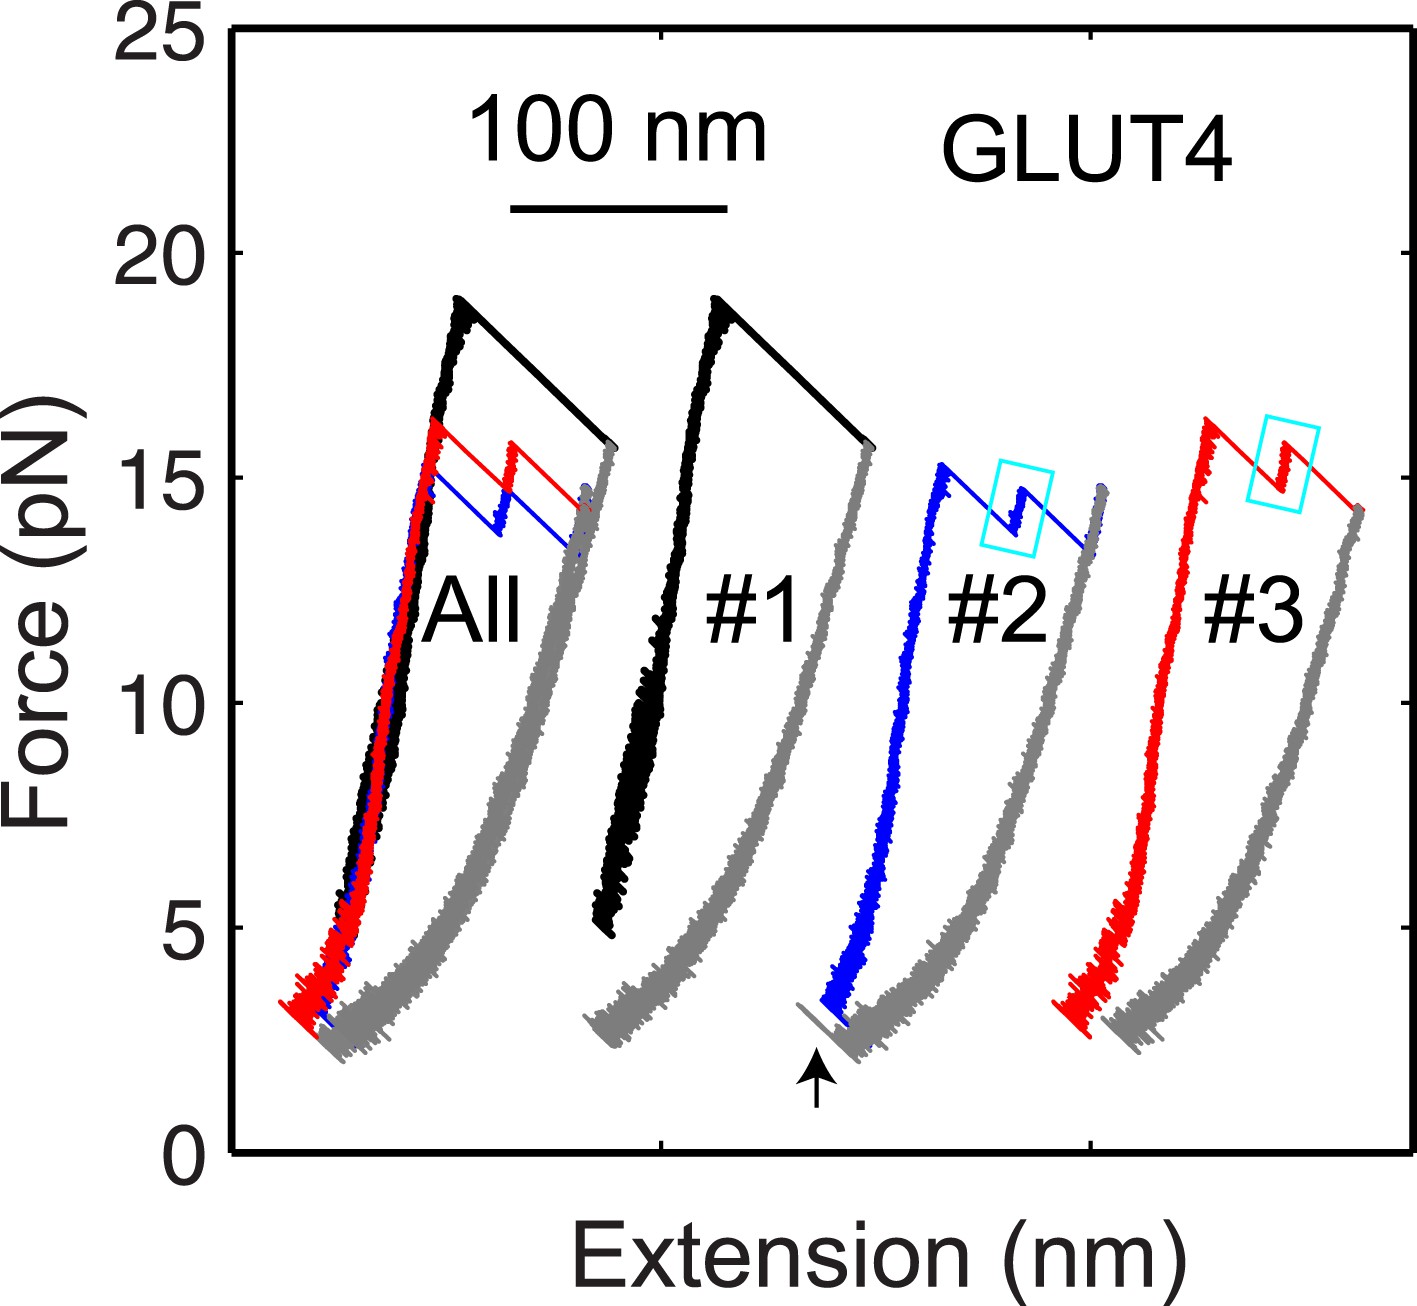
The GLUT4 t-SNARE complex as a transient unfolding intermediate of the half-zippered SNARE complex.
Force-extension curves (FECs) of the same GLUT4 SNARE complex corresponding to three pulling cycles. The overlapping FECs (‘All’) and individual FECs from successive pulling cycles (#1–#3) were shifted along the x-axis for better comparison. The cooperative SNARE reassembly is indicated by a black arrow.
Figure 2—figure supplement 4
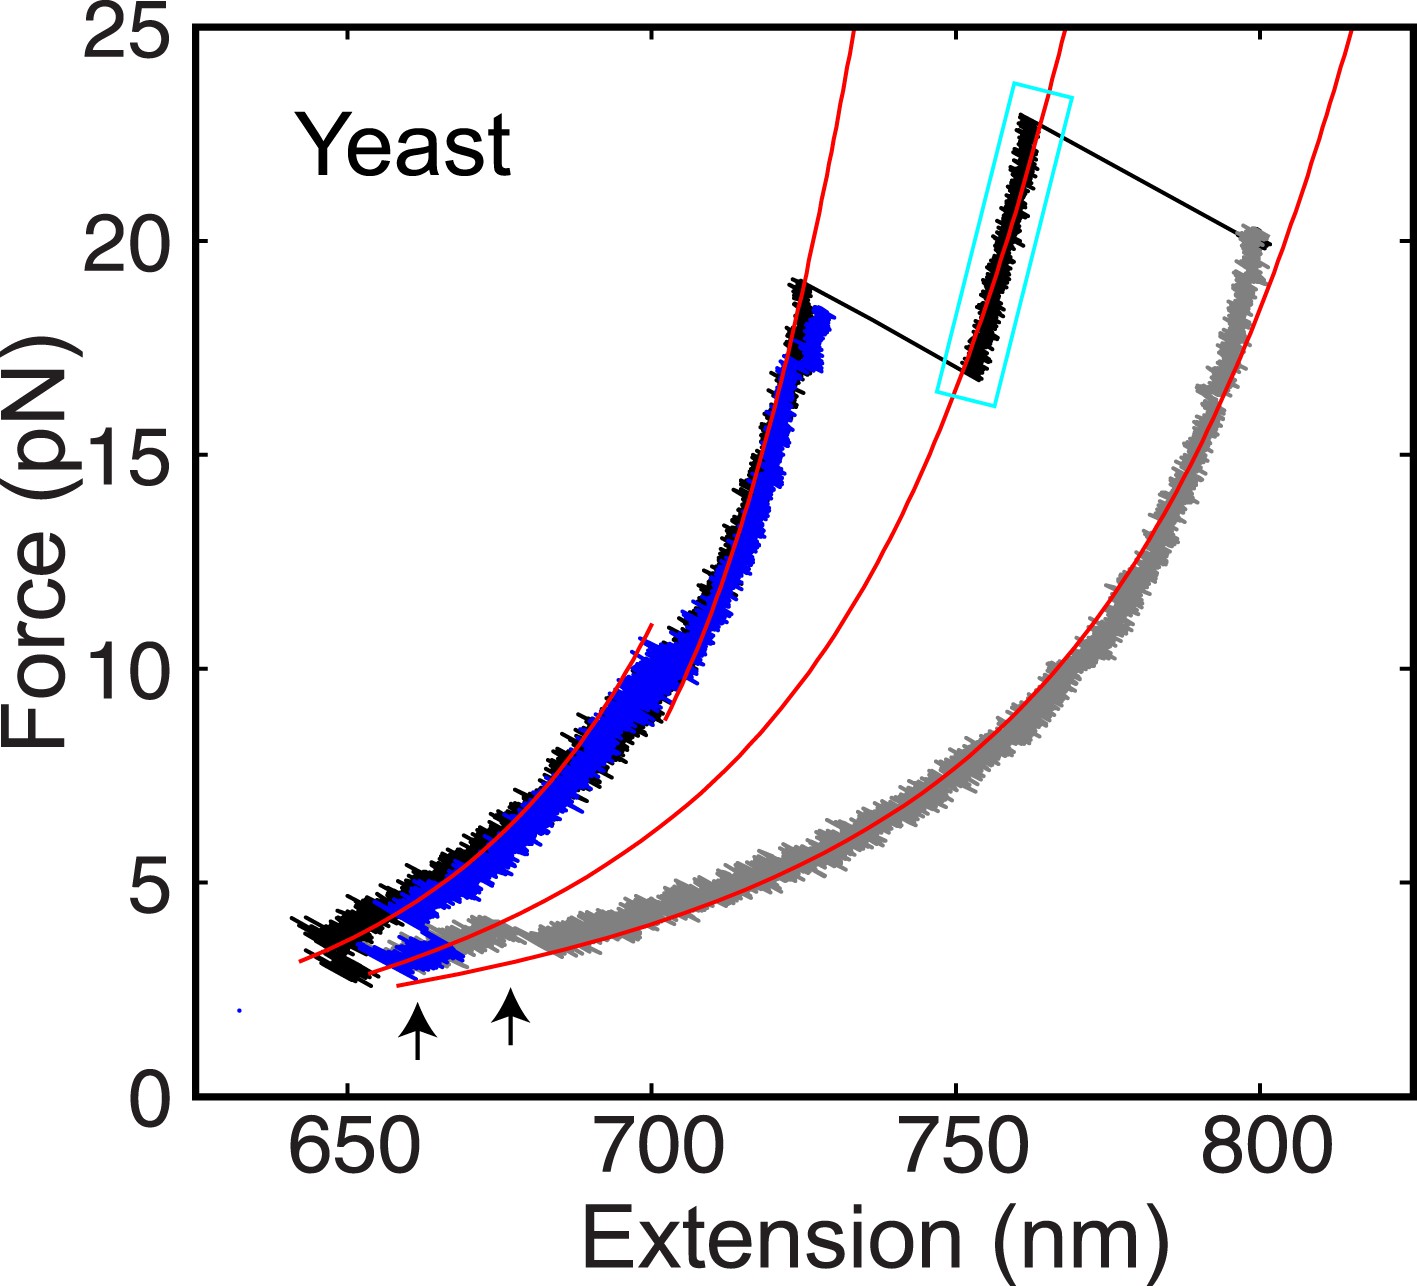
The yeast t-SNARE complex is a stable unfolding intermediate of the half-zippered SNARE complex.
Force-extension curves (FECs) of a single yeast SNARE complex corresponding to two successive pulling cycles and their best fits by the worm-like chain model in the continuous phases. The cooperative SNARE reassembly is indicated by black arrows. The FECs corresponding to the completely unfolded SNARE complex are shown in gray.
Figure 3
Distinct transition kinetics and stabilities of SNARE C-terminal domain and N-terminal domain.
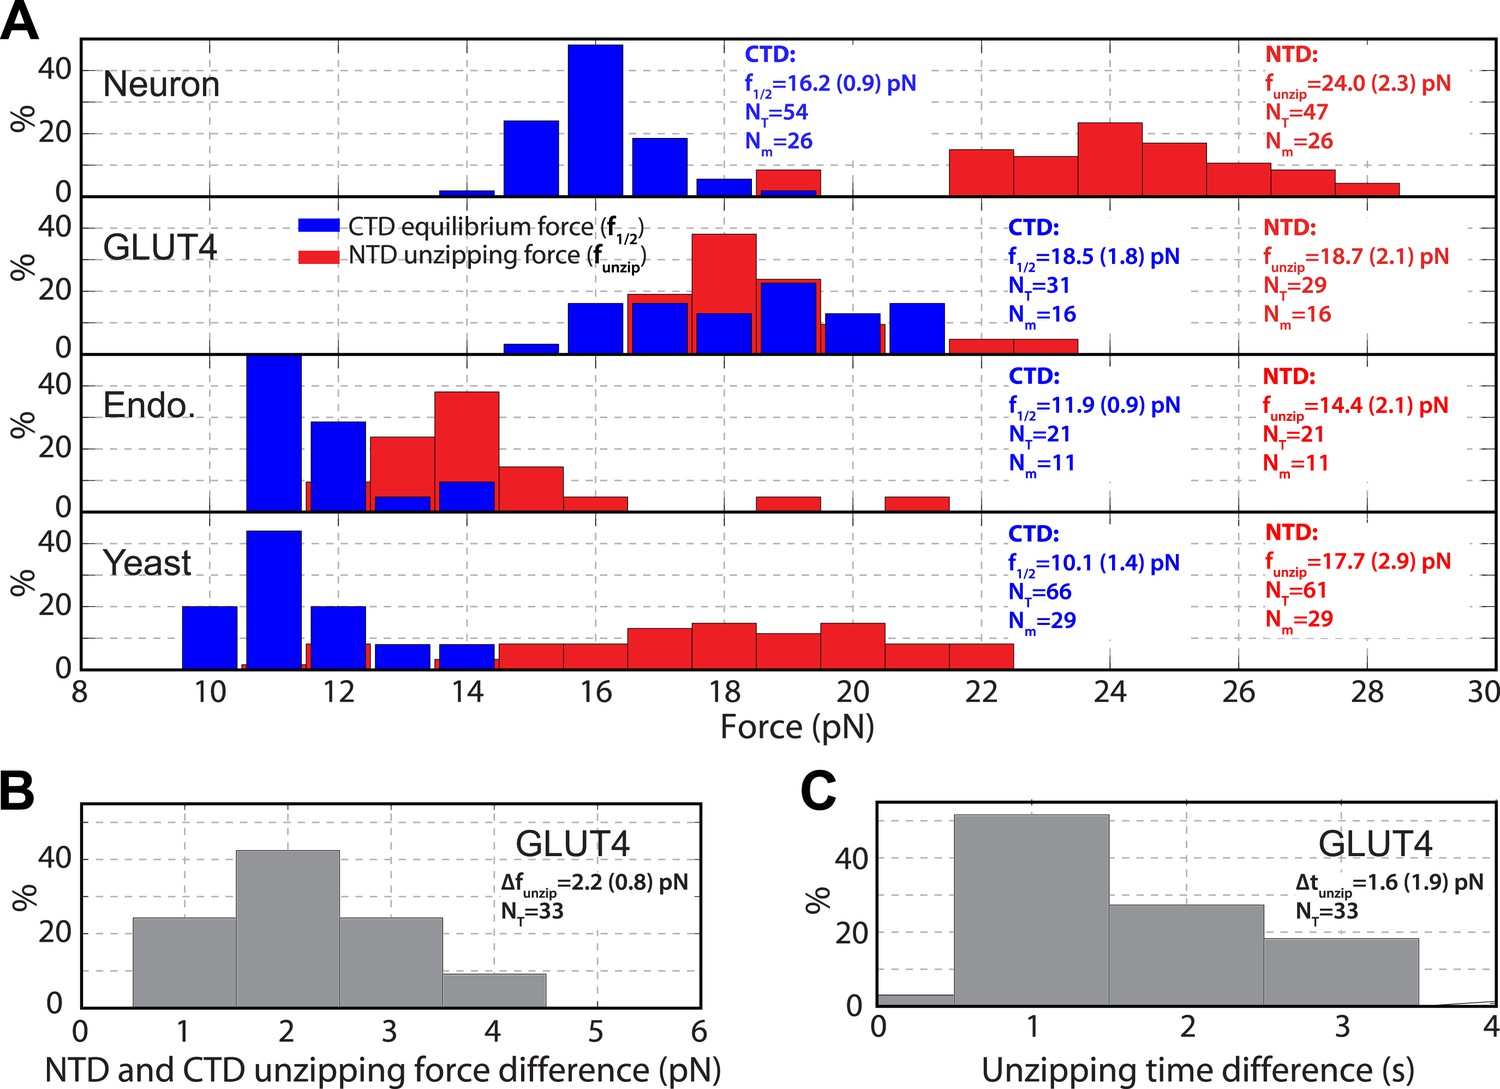
(A) Histogram distributions of the C-terminal domain (CTD) equilibrium force and the N-terminal domain (NTD) unzipping force for different SNARE complexes. The vertical axis shows the percentage of the event number in each bin. The average CTD equilibrium force (f1/2) or NTD unzipping force (funzip) scored on the total numbers of transition events (NT) and single SNARE complexes (Nm) are indicated, with the number in parenthesis designating the standard deviation of the mean. (B, C) Histogram distributions of the force and time differences of the first NTD and CTD unzipping events (Figure 2B). The average force difference (Δfunzip) or time difference (Δtunzip) is indicated. The distinct CTD and NTD transition kinetics are revealed by non-overlapping force distributions for neuronal, endosomal, and yeast SNARE complexes or significant force and time differences associated with the first unzipping events of CTD and NTD of the GLUT4 SNARE complex. Note that optical tweezers have a force measurement accuracy of 10% absolute forces between different single molecules and of <0.1 pN relative forces within same single molecules (Moffitt et al., 2006).
Figure 4
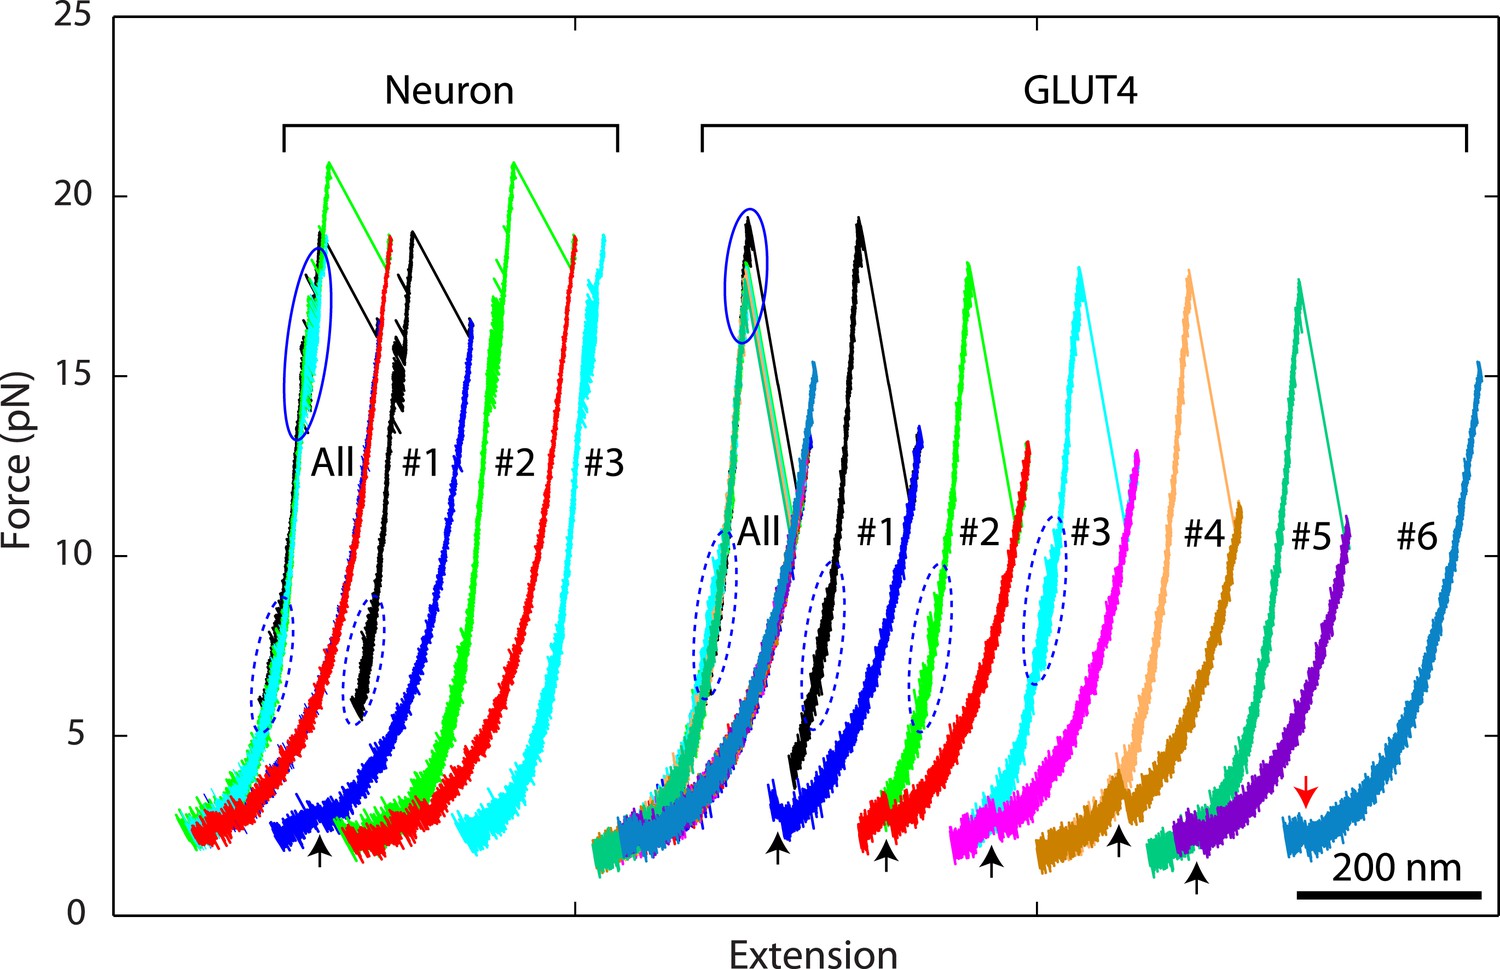
Overlapping force-extension curves obtained by repeatedly pulling a single neuronal or GLUT4 SNARE complex, revealing robust and common step-wise SNARE assembly and disassembly.
The overlapping force-extension curves (FECs) (designated by ‘All’) are shifted along the x-axis to reveal individual FECs corresponding to different pulling cycles (numbered). The cooperative reassembly events are indicated by black arrows. The neuronal SNARE-DNA tether broke in the third pulling cycle of the neuronal SNARE complex at the maximum pulling force. The GLUT4 SNARE complex unfolded at 2.5 pN force (red arrow) in the last pulling cycle, indicating that the complex was not properly assembled at the end of the fifth pulling cycle. Note that heterogeneity in SNARE zippering was observed, a phenomenon also seen in many single-molecule experiments (Lu et al., 1998; Sirinakis et al., 2011). The heterogeneity is manifested by changes in the rate and/or the equilibrium force of the C-terminal domain (CTD) transition detected in different pulling cycles of the same chimeric SNARE protein. For the single neuronal SNARE protein shown here, both equilibrium force and rate of the CTD transition are slightly lower in the first pulling cycle than in the following two cycles. More heterogeneity can be seen in Figure 2—figure supplements 2 and 3.
Figure 5
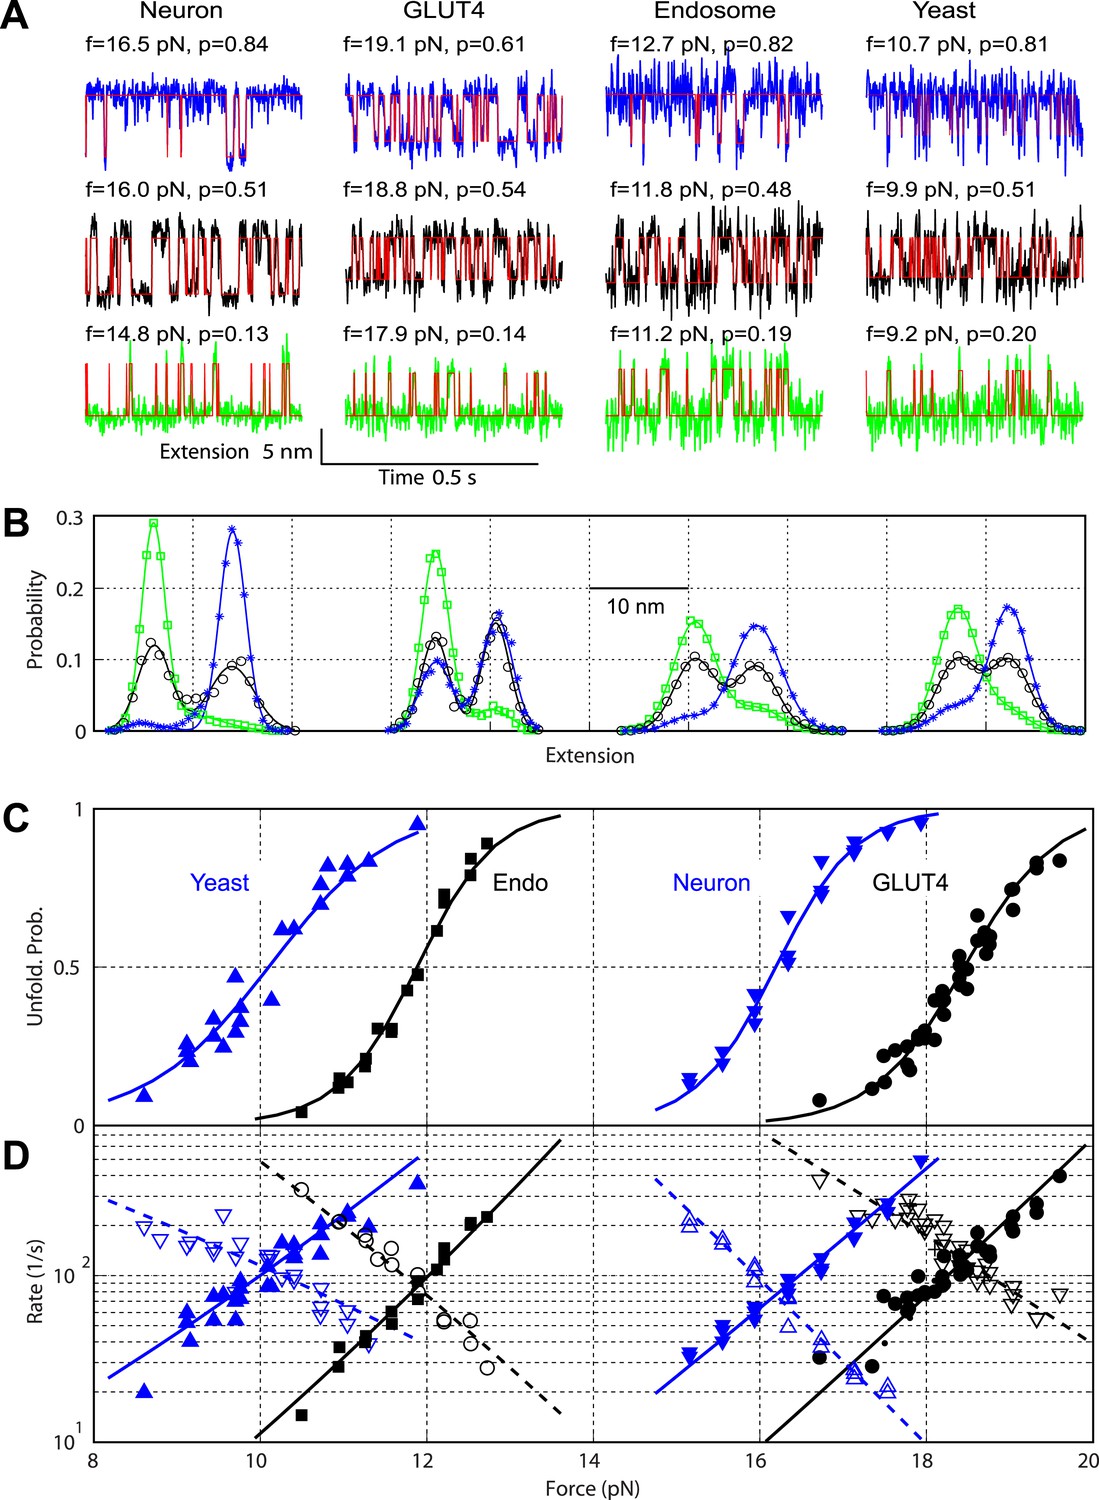
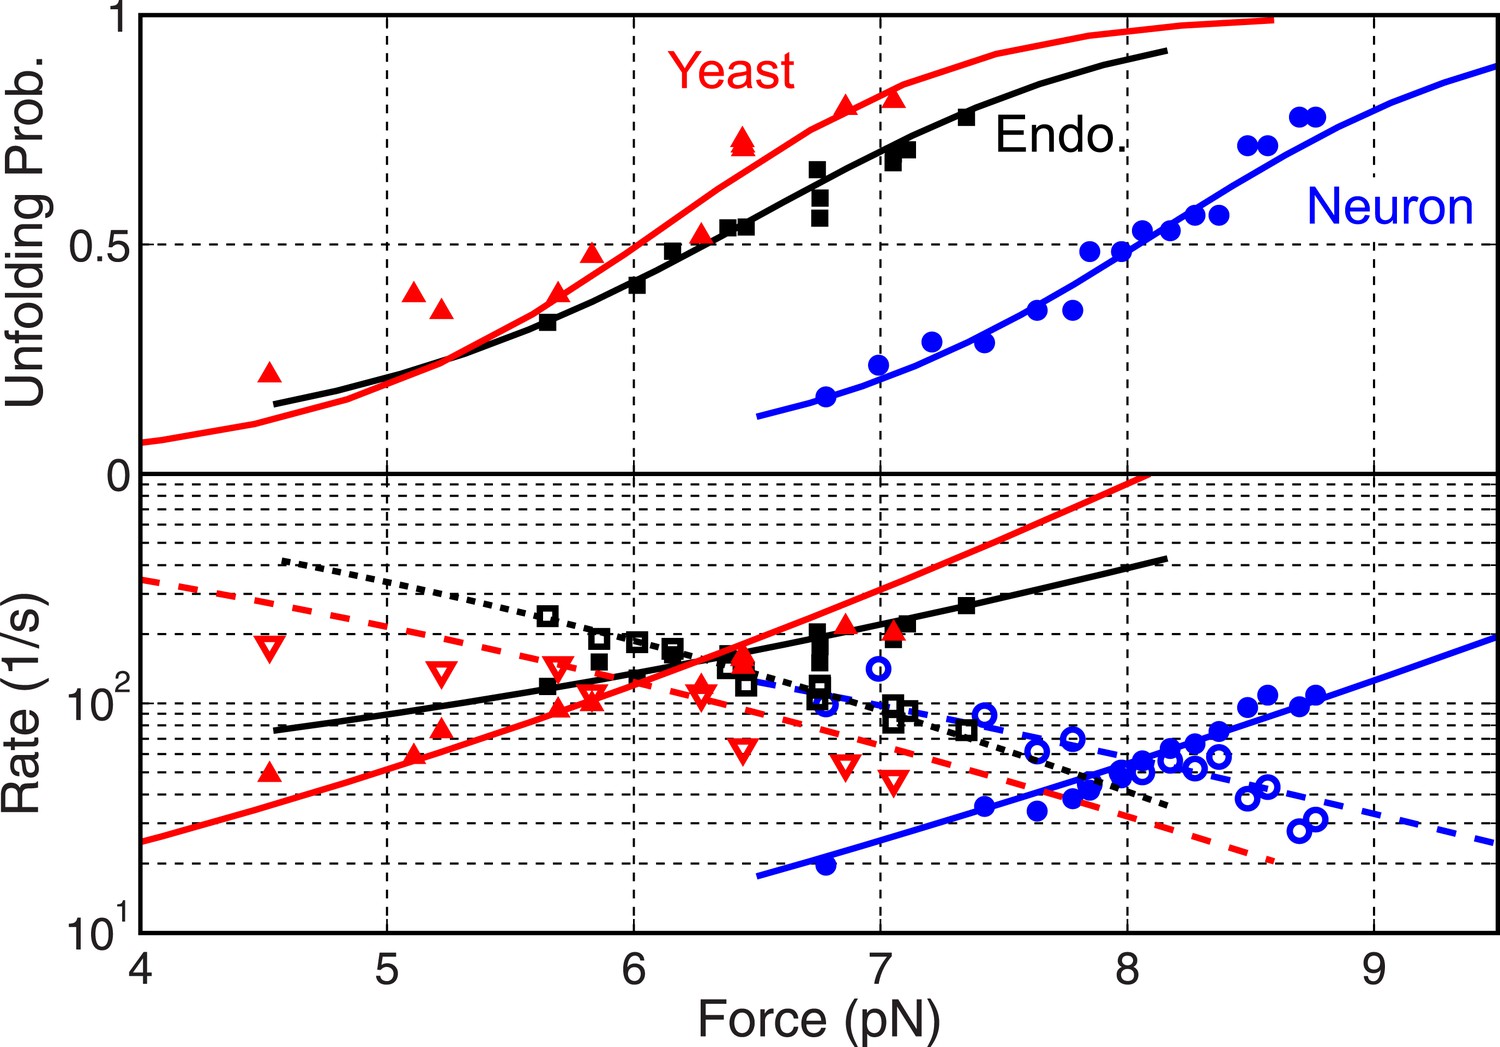
Comparison of the two-state C-terminal domain transitions of four SNARE complexes.
(A) Force-dependent extension-time trajectories under approximately constant forces (f) revealing the unfolding probability (p) of C-terminal domain (CTD) as indicated. The idealized two-state transitions (red lines) were calculated based on a hidden Markov model (HMM). (B) Histogram distributions of the extensions shown in A (symbols) and their best fits with double-Gaussian functions (lines). For best comparison, the distributions for each SNARE complex were shifted along the x-axis to align them at the same average position of the unfolded CTD state. Distributions at different forces are color-coded as the corresponding extension traces in A. All the extension-time trajectories shown in this work were mean-filtered using a 1 ms time window. (C) CTD unfolding probabilities of four SNARE complexes. (D) The corresponding folding rates (hollow symbols) and unfolding rates (solid symbols) of CTD transitions. The best-fit unfolding probability (solid line), folding rate (dashed line), and unfolding rate (solid line) were obtained by non-linear least-squares fitting using a simplified energy-landscape model of SNARE assembly (‘Materials and methods’).
Figure 6 with 2 supplements

Comparison of the two-state linker domain transitions of four SNARE complexes.
(A) Extension-time trajectories (black lines) and their best hidden Markov model (HMM) fits (red lines) showing fast binary transitions of linker domains (LDs) under constant forces. The force (f) and unfolding probability (p) are indicated. (B) Extension histogram distributions corresponding to the trajectories in A (symbols) and their best fits with double-Gaussian functions (red lines). (C) Force-dependent unfolding probability and transition rates (symbols) and their best fits (solid or dashed lines) of GLUT LD. Similar data corresponding to other SNARE complexes are shown in Figure 6—figure supplement 1.
Figure 6—figure supplement 1
Folding energy and kinetics of SNARE linker domains.
Unfolding probabilities (top panel) and folding rates (open symbols in bottom panel) or unfolding rates (solid symbols) of linker domains (LDs) in the yeast, endosomal, and neuronal SNARE complexes. The corresponding best fits based on the energy landscape model (‘Materials and methods’) are shown as solid or dashed lines.
Figure 6—figure supplement 2
Minor effect of the spacer sequences in the chimeric SNARE proteins on the folding energy of SNARE complexes.
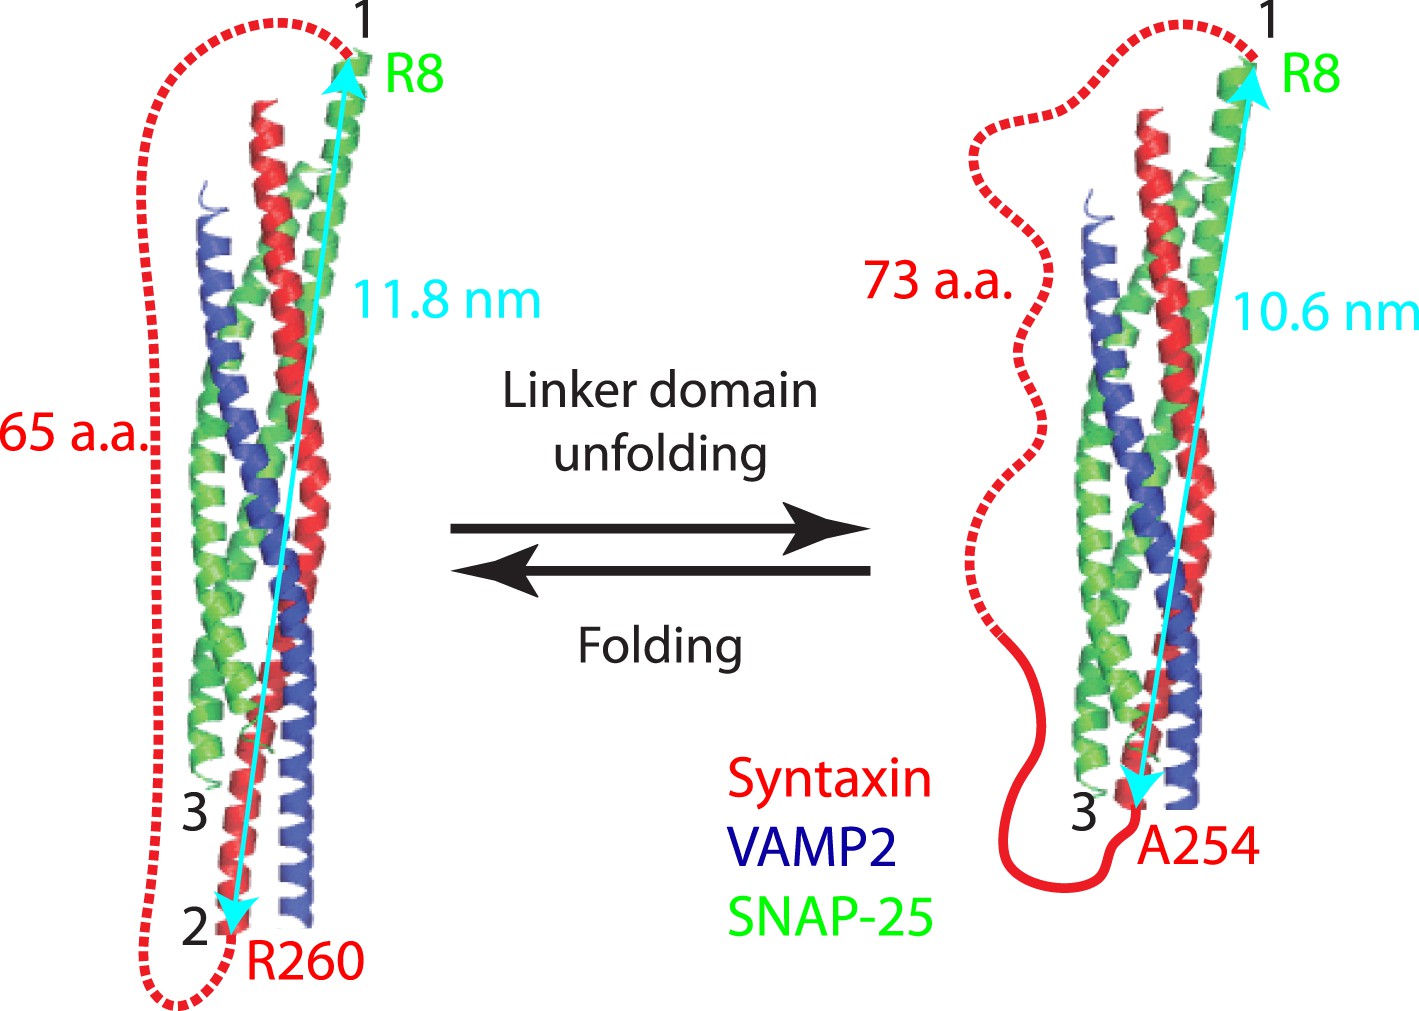
Predicted structures of the folded and unfolded states in linker domain (LD) transition and the accompanying extension change of the spacer sequence connecting syntaxin and SNAP-25 (red dashed line). The apparent LD folding energy measured by optical tweezers (ΔGapp) contains true LD folding energy (ΔGLD) and the free energy change of the spacer sequence due to its extension change (ΔGsp), that is,
(6)
To correct for the true LD folding energy, we estimated the spacer energy change using a worm-like chain model. In the LD folded state, the spacer sequence is 65 a.a. long or 23.7 nm in contour length and has an extension of 11.8 nm, or the distance between point 1 (SNAP-25 R8) and point 2 (syntaxin R260). Thus, the ratio (r) of the extension to the contour length (l) is 0.5. Using Equation 3, we calculated the free energy of the spacer sequence in the folded LD state to be 9 kBT. In the unfolded LD state, the spacer sequence (including the unfolded LD sequence in syntaxin) becomes 73 a.a. long or 26.6 nm in contour length, with an extension of 10.6 nm (the distance between point 1 and point 3 at syntaxin A254). The free energy of the spacer in the unfolded LD state was similarly calculated to be 5.9 kBT. Thus, the energy change of the spacer sequence upon LD folding is ΔGsp = 3.1 kBT. The apparent energy change derived from the singe-molecule measurement is ΔGapp = −6.6 kBT. Thus the LD folding energy ΔGLD = ΔGapp − ΔGsp = −9.7 kBT.
The two spacer sequences in the chimeric neuronal SNARE protein have no effect on the C-terminal domain (CTD) transition, because their extensions do not change in this process. The spacer sequence connecting SNAP-25 and VAMP2 (not shown) slightly decreases N-terminal domain (NTD) association energy by 4.3 kBT. However, this reduced NTD stability does not alter its much greater lifetime than the CTD.
Figure 7 with 1 supplement
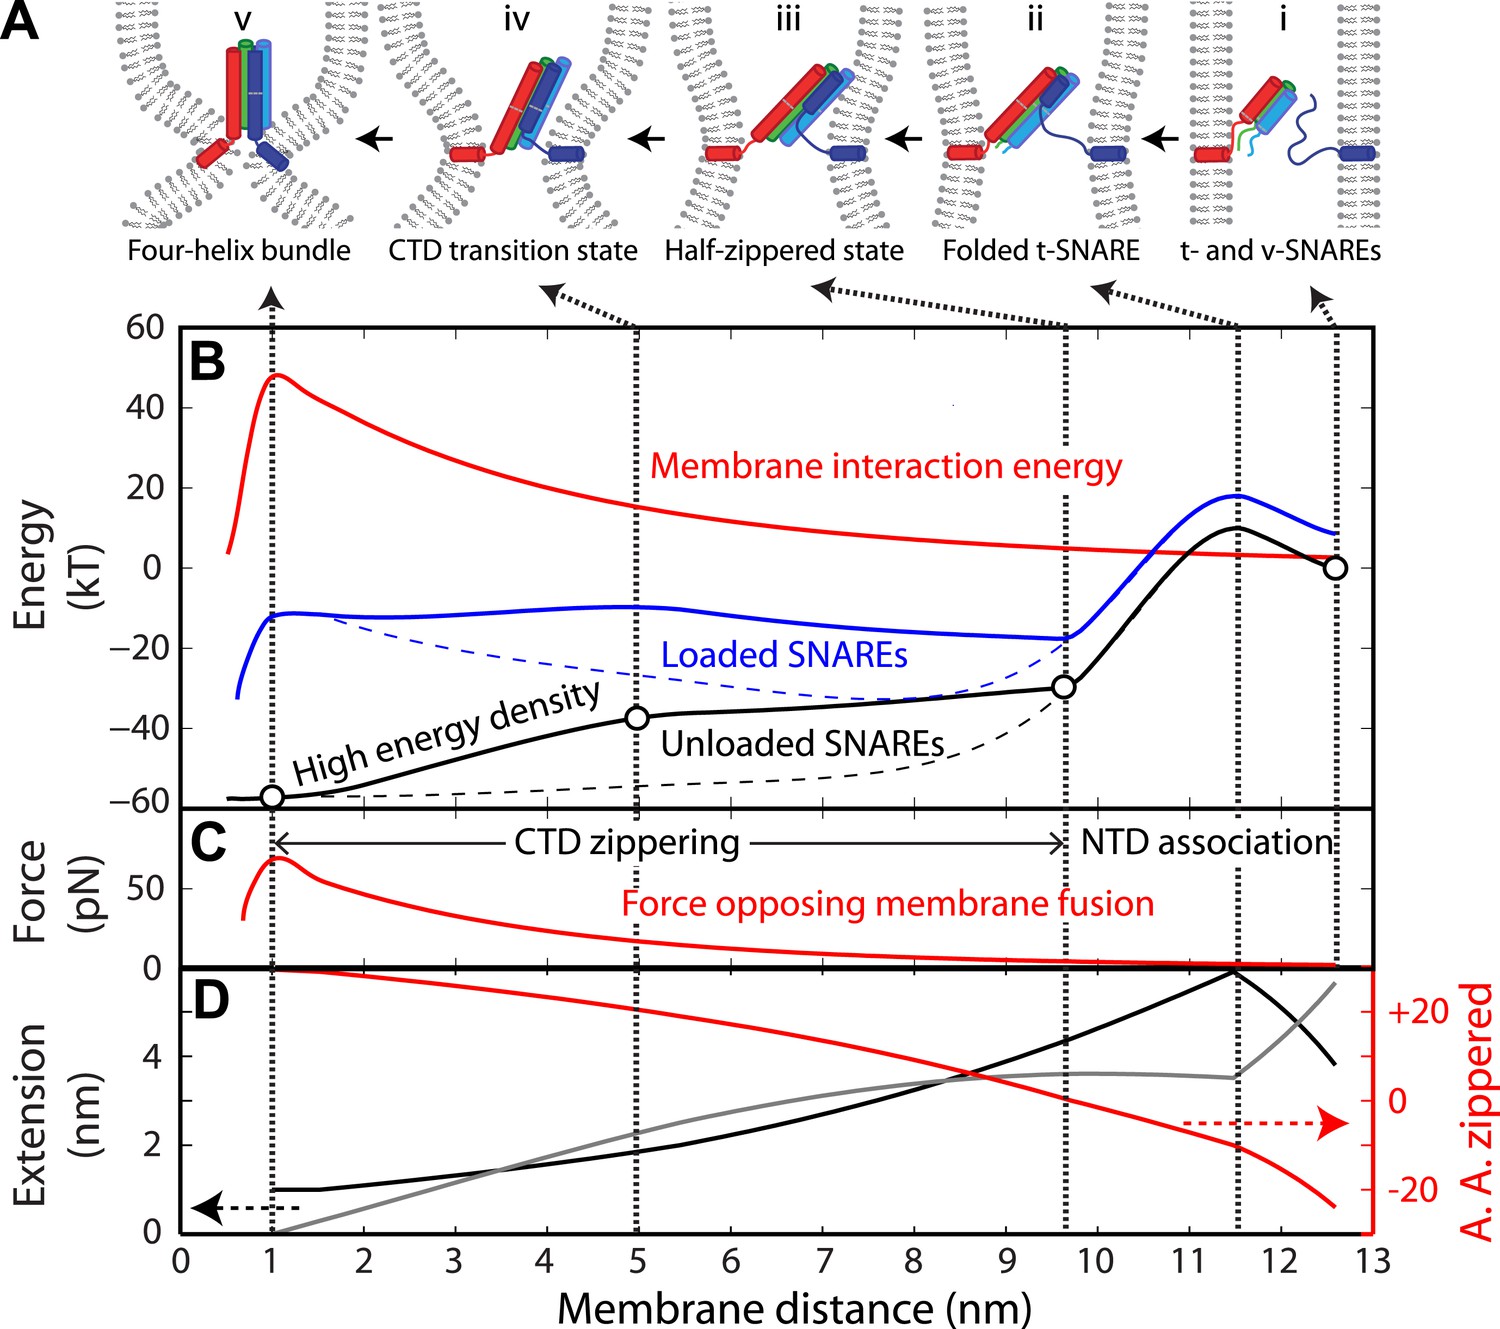
Energy landscape of SNARE zippering perfectly meets the needs of membrane fusion.
(A) Cartoons of different assembly states of the trans-SNARE complex corresponding to the points indicated in B. (B) Free energy of membrane fusion per SNARE complex (red line), a single loaded trans-SNARE complex (blue), or a single unloaded SNARE complex (black) as a function of the distance between two membrane surfaces. The experimental and alternative energy landscapes are plotted in solid and dashed lines, respectively. For the unloaded SNARE complex, the free energy at each membrane distance represents the energy of the SNARE complex in the same zippering state as the trans-SNARE complex at that distance. The experimental energy landscape of the unloaded SNARE complex was derived from the measured energy at characteristic points (marked by circles) through interpolation. (C) Repulsive force between two membranes opposing their fusion. (D) Extension of all the unfolded amino acids in Qa and R SNAREs under membrane tension (gray in the left axis) or the folded portion of the SNARE complex (black) and zippering stage of the amino acids (A.A.) in R SNARE (red line in the right red axis). The amino acid number indicates the position of the amino acid relative to the ionic layer (0). The amino acids with negative numbers are in N-terminal domain (NTD) and those with positive numbers in C-terminal domain (CTD). At each amino acid number in the right axis, the R SNARE motif has assembled from its N-terminus (A.A. at −24) to the amino acid with this number. Note that NTD association is accompanied by a relatively small change in membrane distance compared to CTD zippering, because the extension decrease due to NTD folding is largely canceled by the extension increase of the folded t-SNARE.
Figure 7—figure supplement 1
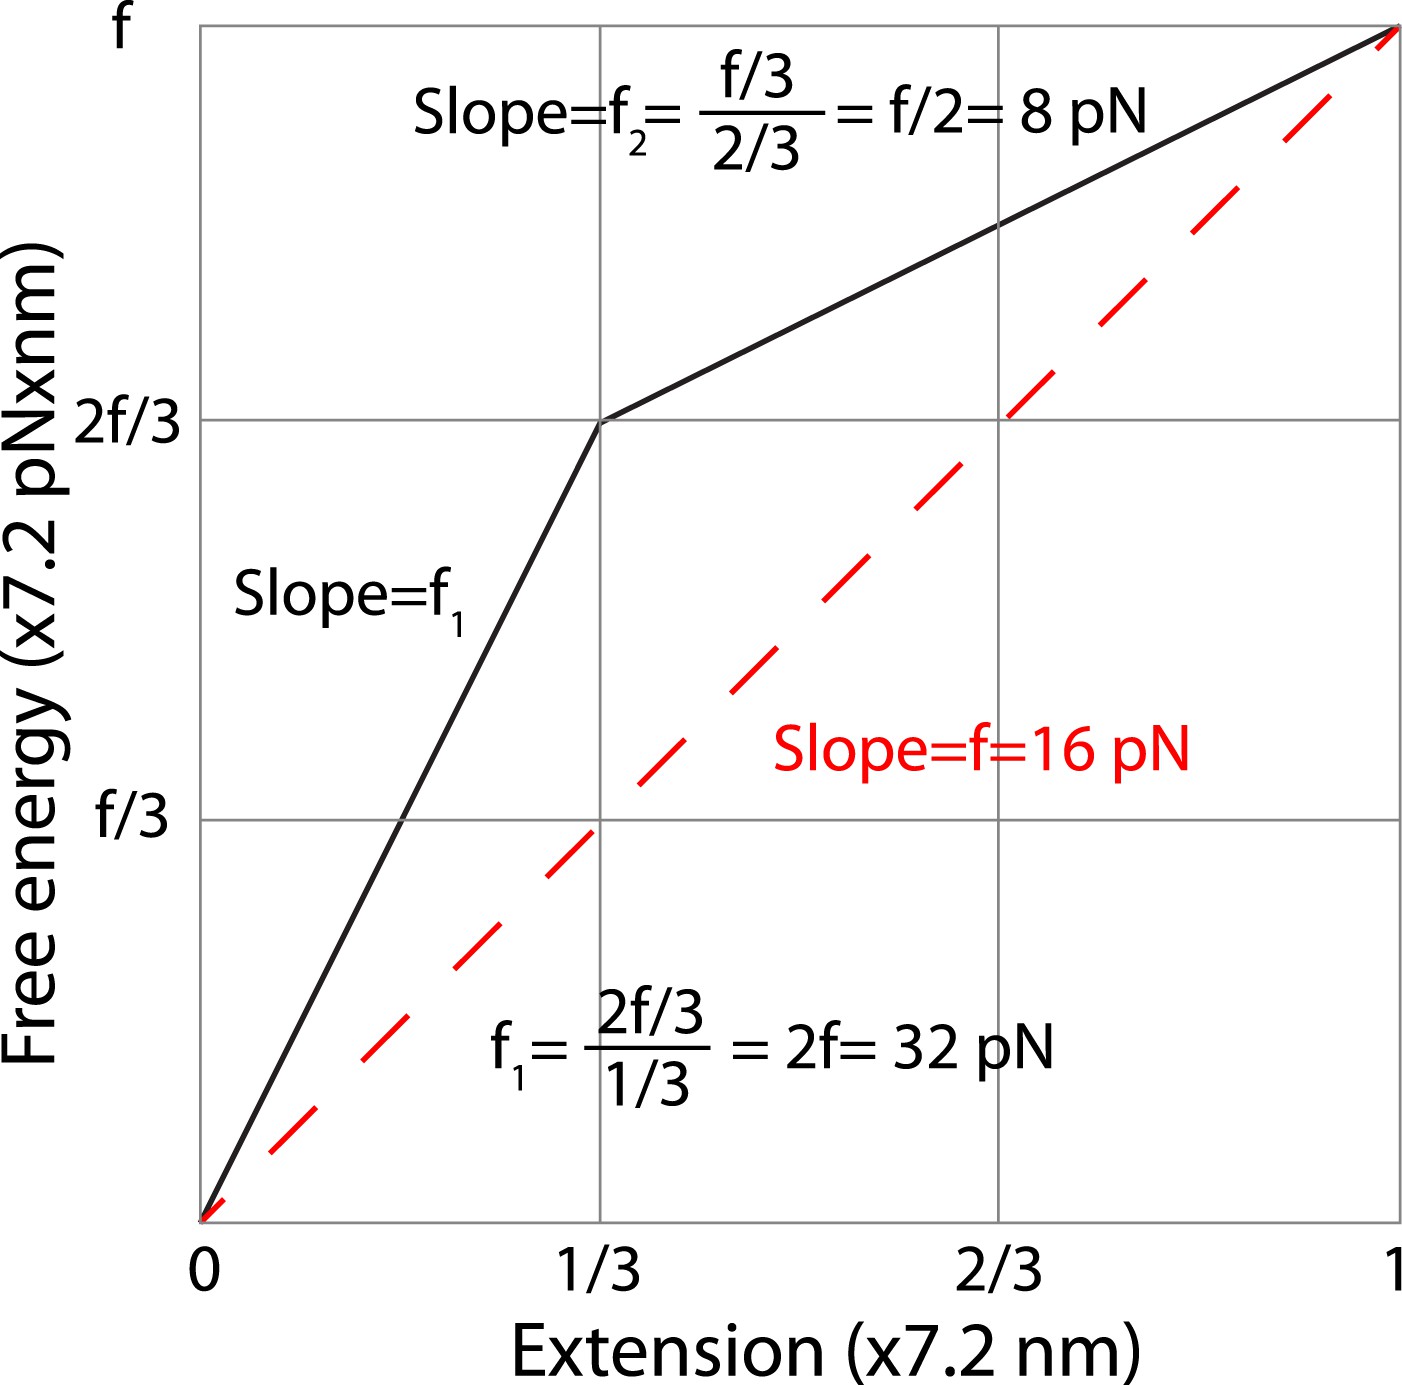
Estimation of the average forces generated by zippering of the N-terminal and C-terminal CTD of neuronal SNARE complex.
We estimated the C-terminal domain (CTD) zippering forces based on a simplified energy landscape model for a two-state process. The energy landscape is characterized by the experimentally measured energy of the unfolded state and the transition state and their associated positions in terms of extension. The folded state is chosen as a reference 0 here for energy and extension. We chose the average extension change upon CTD unzipping (7.2 nm, Table 1) as the length unit. Thus, the x-axis is the normalized extension and the energy shown in y-axis has a unit of 7.2 pN × nm. Based on our measurement, two-thirds of the folding energy is released upon zippering of the C-terminal one-third of the CTD, which leads to the energy landscape shown by the solid black line. The folded state, the transition state, and the unfolded state are located at positions of 0, 1/3, and 1 in the unit of total extension change of CTD transition. In this unit, the energy of the unfolded state is equal to the equilibrium force measured for CTD transition (∼16 pN). The average forces of the C-terminal one-third and the N-terminal two-thirds of CTD can be calculated based on the slopes of the corresponding energy changes, yielding 32 pN and 8 pN, respectively. The average force does not depend on the detailed energy landscape between the transition state and the folded or the unfolded state. Assuming an energy profile of between extension position 0 and a, the average force in this region is defined as
where is the local force at position x and , . Thus the average force in a region can be simply determined by the slope of the line going through the energy points at the two ends of the region, regardless of the detailed energy profile in the region.
Tables
Table 1
Average equilibrium force, extension change, folding energy, and folding energy barrier and position associated with C-terminal domain and linker domain transitions of the four different SNARE complexes
| SNARE complex | C-terminal domain | Linker domain | ||||||||
|---|---|---|---|---|---|---|---|---|---|---|
| Force (pN) | Extension change (nm) | Folding energy (kBT) | Transition state energy* (kBT) | Transition state position† (a.a.) | Force (pN) | Extension change (nm) | Folding energy (kBT) | Transition state energy* (kBT) | Transition state position† (a.a.) | |
| Neuron | 16.2 (0.9) | 7.2 (1.2) | −27 (4.7) | −5.5 (1.5) | 17 (3) | 8 (1) | 4.7 (0.5) | −9.7 (1.6) | 5.5 (1.5) | 31 (1) |
| GLUT4 | 18.5 (1.8) | 6.0 (0.9) | −23 (4.1) | −0.8 (1.0) | 11 (2) | 8.6 (0.9) | 5.6 (1.1) | −12 (2.7) | 2 (1.0) | 30 (1) |
| Endosome | 11.9 (0.9) | 6.9 (0.4) | −16 (1.5) | 2.1 (1.4) | 12 (2) | 6.3 (1.2) | 5.1 (1.8) | −6.1 (2.4) | 4.9 (1.5) | 32 (2) |
| Yeast | 10.1 (1.4) | 5.8 (0.8) | −13 (2.5) | 3.2 (1.5) | 13 (2) | 6.0 (1.6) | 5.1 (1.2) | −5.7 (2.0) | 3.6 (2.0) | 32 (2) |
-
*
Here, negative energy indicates downhill protein folding (Yang and Gruebele, 2003).
-
†
The number of the amino acids in the R SNARE C-terminal to the ionic layer (chosen as 0).
-
The equilibrium force and extension change were determined at an unfolding probability of 0.5 for the two-state processes. The standard deviations of the averages are shown in parenthesis. The equilibrium force distribution, the number of transitions, and the number of single molecules scored for C-terminal domain (CTD) transitions are shown in Figure 3. For parameters related to linker domain (LD) transitions, a total of 18, 35, 11, and 24 LD transitions in single neuronal, GLUT4, endosomal, and yeast SNARE complexes were scored, respectively.
Download links
A two-part list of links to download the article, or parts of the article, in various formats.
Downloads (link to download the article as PDF)
Open citations (links to open the citations from this article in various online reference manager services)
Cite this article (links to download the citations from this article in formats compatible with various reference manager tools)
Common intermediates and kinetics, but different energetics, in the assembly of SNARE proteins
eLife 3:e03348.
https://doi.org/10.7554/eLife.03348


