Differential TAM receptor–ligand–phospholipid interactions delimit differential TAM bioactivities
- The Salk Institute for Biological Studies, United States
- Yale University School of Medicine, United States
Figures
Figure 1 with 2 supplements
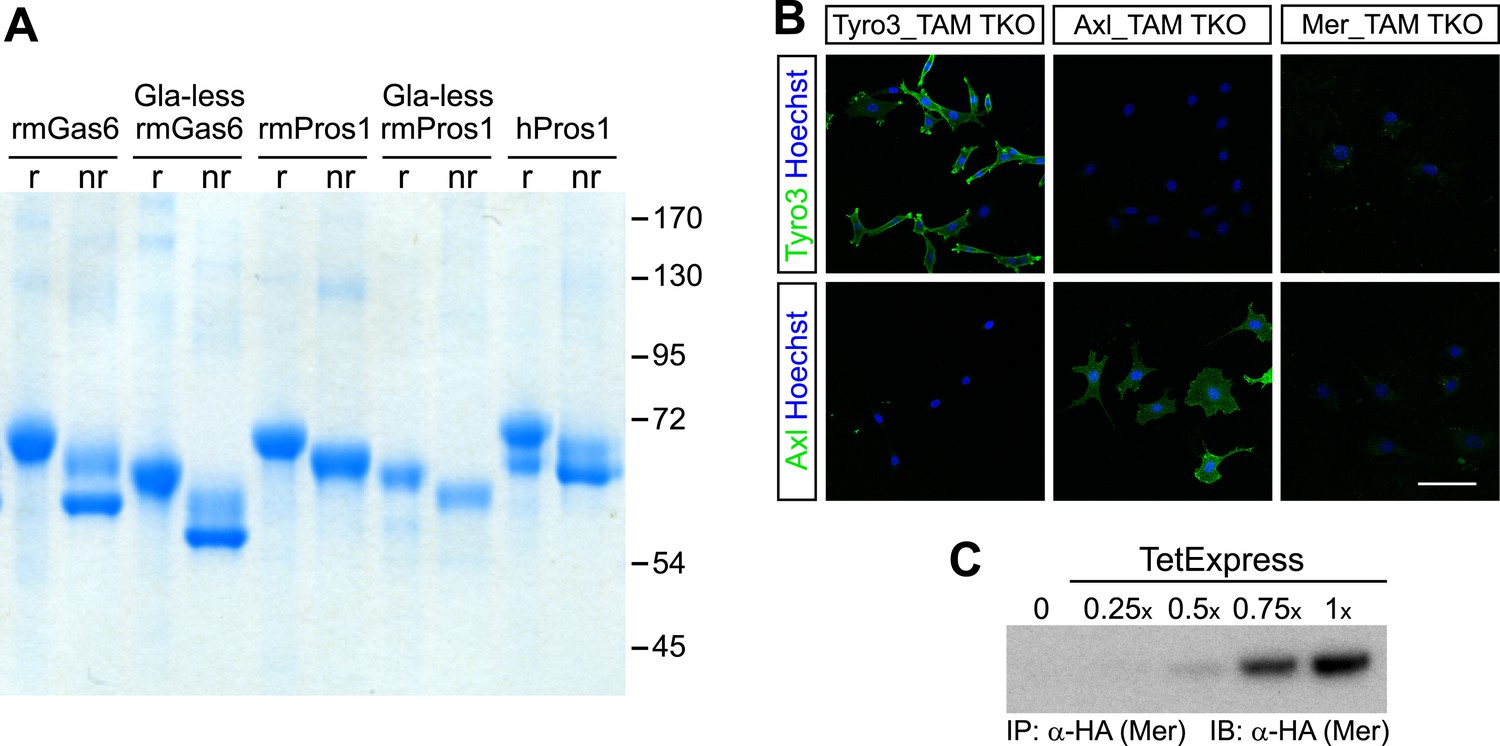
Recombinant TAM ligands and surface expression of TAM receptors.
(A) Purified recombinant full-length and Gla-less mouse Gas6 (rmGas6 and Gla-less rmGas6, respectively) and full-length and Gla-less Pros1 (rmPros1 and Gla-less rmPros1, respectively) were run under both reducing (r) and non-reducing (nr) conditions in SDS-PAGE. In parallel, purified human Pros1 (hPros1) was also run under reducing and non-reducing conditions. Gel was stained with Gel Code Blue (Pierce). (B) Live cell labeling of Tyro3 (top panels) and Axl (bottom panels) on the surface of clonal populations of TAM TKO MEF lines expressing HA-tagged recombinant mouse Tyro3 (left), recombinant mouse Axl (middle), or recombinant mouse Mer (right). Bar: 100 μm. (C) Induction of HA-tagged Mer expression in a Mer_TAM TKO MEF line in the presence of increasing concentrations of TetExpress transactivator protein (Clontech). In this and all the subsequent blots in which the HA tag was used for both immunoprecipitation (IP) and immunoblotting (IB), two different anti-HA antibodies were used: an anti-HA high affinity for IP and an anti-HA.11 for IB.
Figure 1—figure supplement 1

Size exclusion chromatography of full-length and Gla-less Gas6.
Purified full-length recombinant mouse Gas6 (rmGas6, black trace) and Gla-less rmGas6 (red trace) were loaded onto and eluted from a Superdex 200 HR 10/30 gel filtration column.
Figure 1—figure supplement 2

TAM receptor expression in immortalized cell lines.
Lysates from the indicated cell lines were subjected to SDS-PAGE and subsequent immunoblotting with antibodies against Tyro3 (top), Axl (middle), and Mer (bottom). Anti-Gapdh serves as a loading control. All established cell lines we have analyzed express at least one TAM receptor.
Figure 2 with 1 supplement
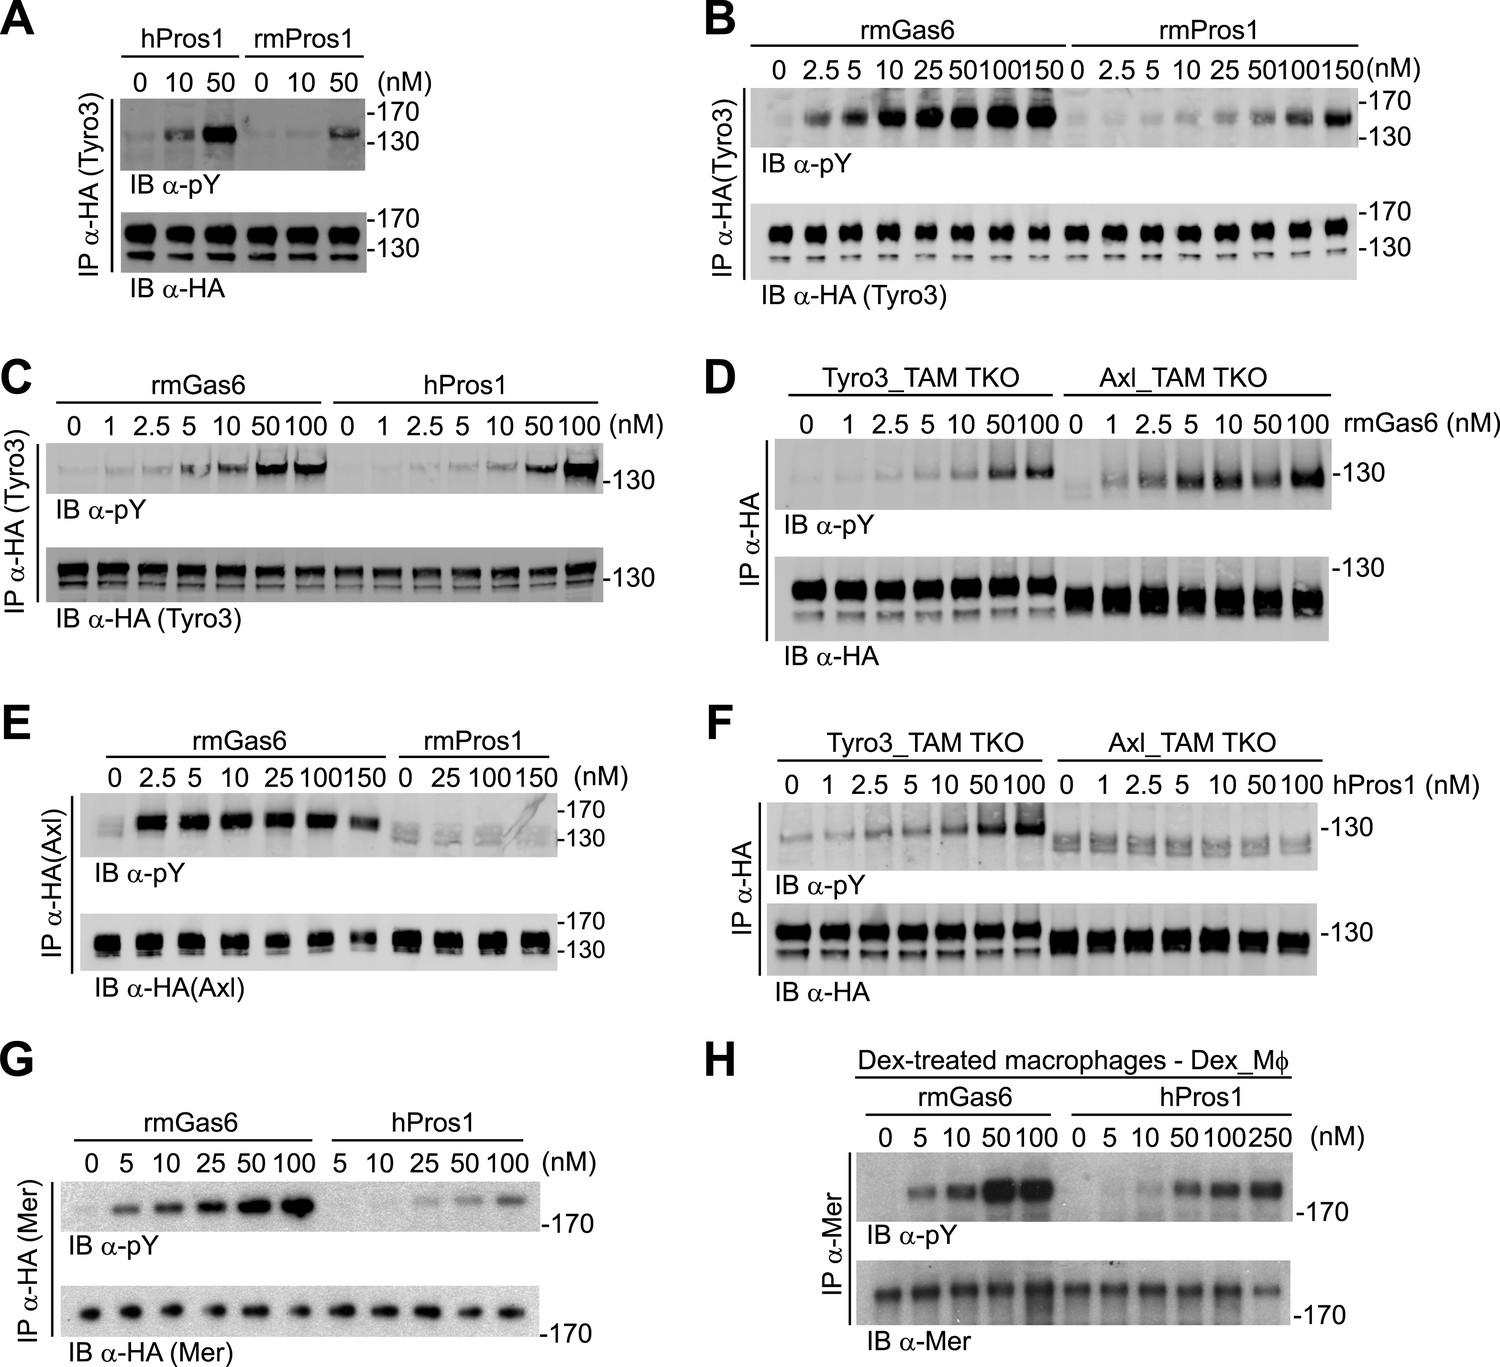
Gas6 and Pros1 exhibit TAM receptor selectivity.
(A) Tyro3-expressing MEFs were stimulated with either human Pros1 (hPros1) or recombinant mouse Pros1 (rmPros1). (B and C) Tyro3-expressing MEFs were stimulated with increasing concentrations of full-length recombinant mouse Gas6 (rmGas6), recombinant mouse Pros1 (rmPros1, B), or purified human Pros1 (hPros1, C). (D) Tyro3- and Axl-expressing MEFs were stimulated with increasing concentrations of rmGas6. (E) Axl-expressing MEFs were stimulated with increasing concentrations of rmGas6 or rmPros1. (F) Tyro3- and Axl-expressing MEFs were stimulated with increasing concentrations of hPros1. (The lower molecular weight doublet in lanes 8–14 of the anti-pY blot of this panel, in lanes 1 and 8–11 of the anti-pY blot of panel E, and in lane 8 of the anti-pY blot of panel D is seen only in Axl-expressing MEFs in which Axl is not activated by exogenous ligand and its intensity does not increase with increasing concentration of hPros1 or rmPros1. It may represent basal Axl phosphorylation caused by low levels of MEF-produced (endogenous) Gas6. See also lanes 1 and 7–12 of the anti-pY blot of Figure 3B) (G) Mer-expressing MEFs were stimulated with increasing concentrations of rmGas6 or hPros1. (H) Dexamethasone-treated bone marrow-derived macrophages (Dex_Mϕ) were stimulated with increasing concentrations of rmGas6 or hPros1. Following stimulation with ligand for 10 min at 37°C, HA-tagged Tyro3 (A–D and F), Axl (D–F), Mer (G), or endogenous Mer (H, figure supplement 1) were immunoprecipitated from total cell lysates and subjected to SDS-PAGE and quantitative Licor western blotting (panels G, H, ECL western blotting system) with the indicated antibodies. In this and subsequent figures, receptor activation was assessed by blotting immunoprecipitates with an anti-phosphotyrosine antibody (pY).
Figure 2—figure supplement 1
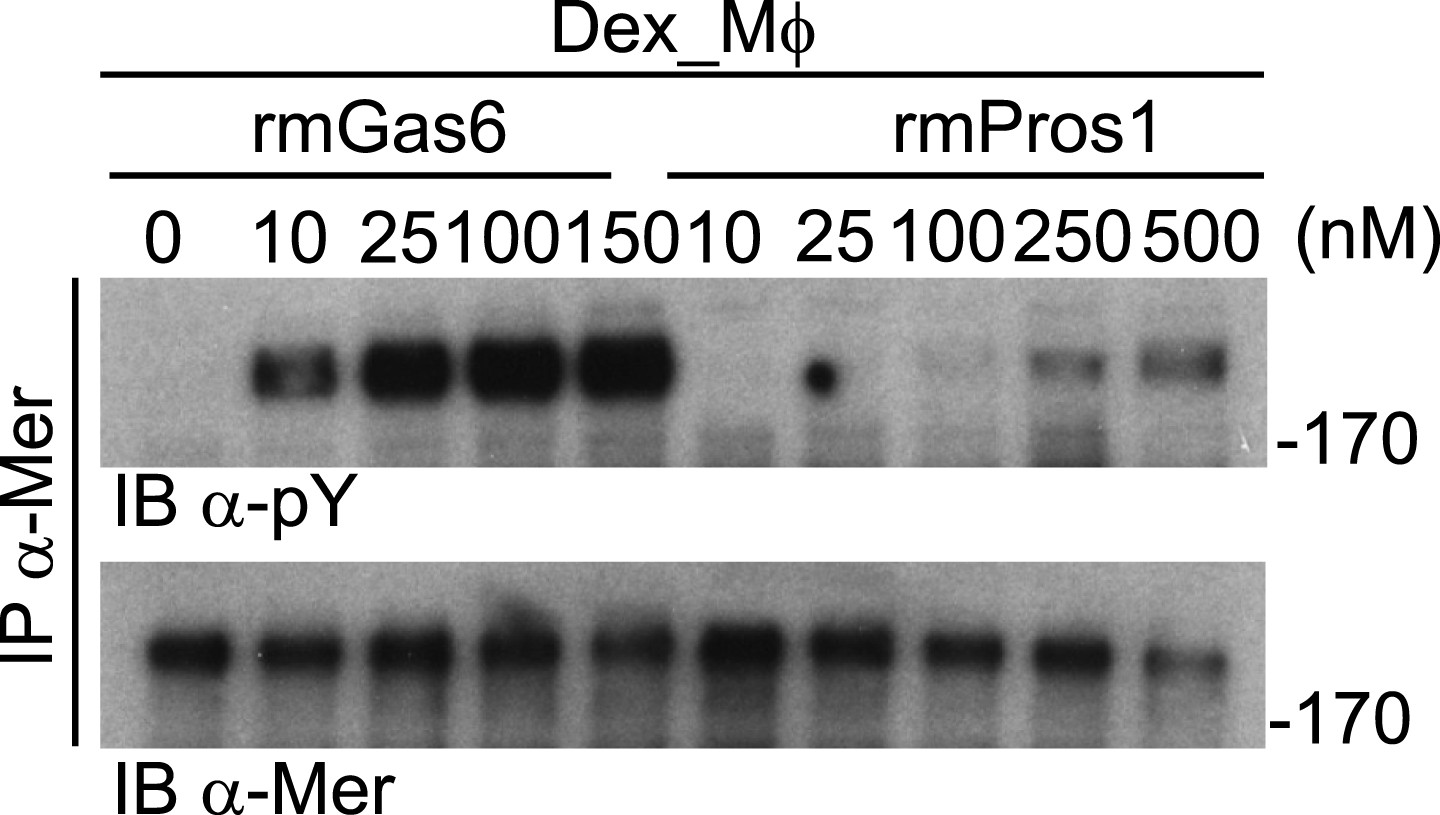
Mer activation by rmGas6 and rmPros1.
Dex_Mφ were stimulated with increasing concentrations of rmGas6 or rmPros1.
Figure 3
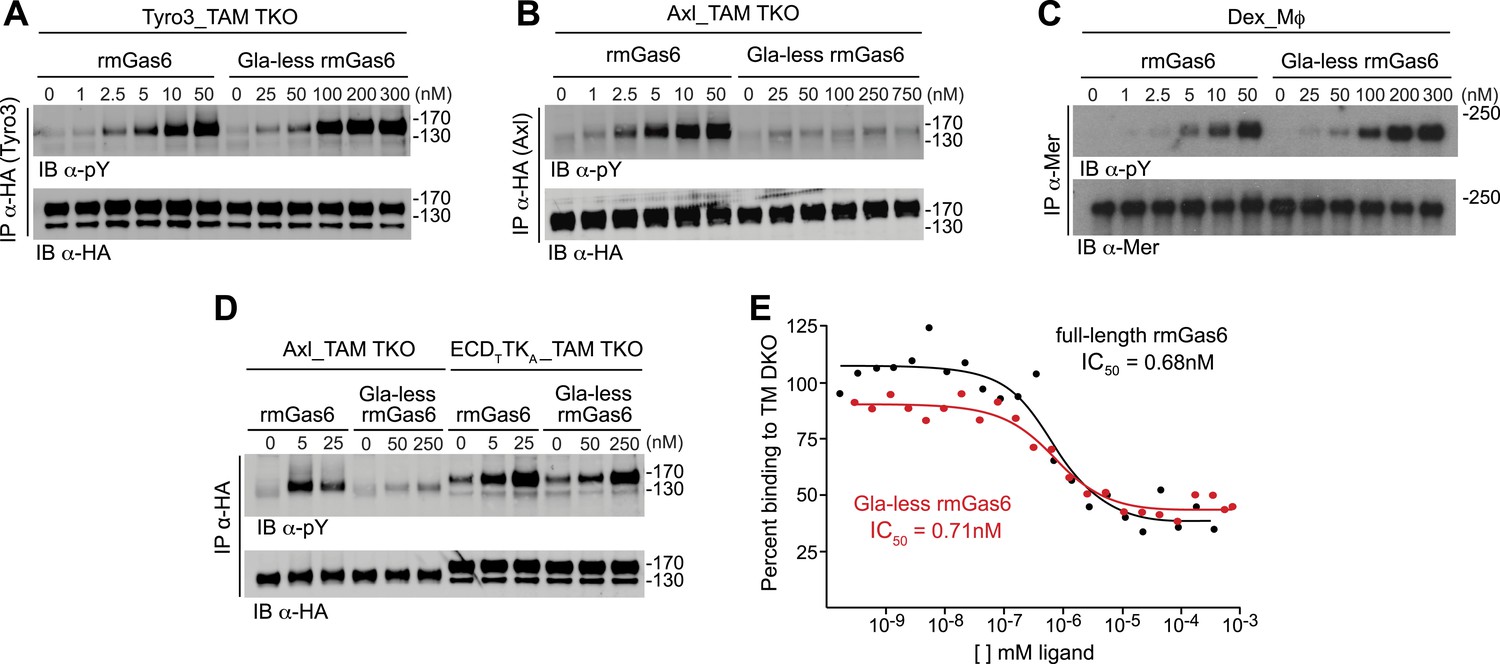
The role of the Gla domain in TAM receptor activation.
(A, B, C) Tyro3-expressing MEFs, Axl-expressing MEFs, or dexamethasone-treated BM-derived macrophages expressing Mer, respectively, were stimulated with the indicated increasing concentrations of full-length rmGas6 or Gla-less rmGas6, respectively. Total cell lysates were immunoprecipitated with either HA antibodies (A and B) or Mer-specific antibodies (C) and subsequently subjected to SDS-PAGE and quantitative Licor western blotting (panel C, ECL western blotting) with the indicated antibodies. (D) MEFs expressing Axl or a chimeric receptor composed of the Tyro3 extracellular domain linked to the Axl tyrosine kinase domain (ECDTTKA) were stimulated with either full-length rmGas6 or Gla-less Gas6. Receptors were immunoprecipitated from cell lysates using an HA antibody, and immunoprecipitates were subjected to SDS-PAGE and Licor western blotting with anti-phosphotyrosine and HA antibodies. The higher basal activation of the ECDTTKA construct may reflect its higher level of expression. (E) Binding assays were performed on Axl-expressing MEFs using a single concentration of 125I-labeled full-length rmGas6 in the presence of increasing concentrations of either unlabeled full-length rmGas6 (black) or Gla-less rmGas6 (red). Measured concentrations of unlabeled ligand required for 50% inhibition of displaceable binding (IC50) are indicated.
Figure 4
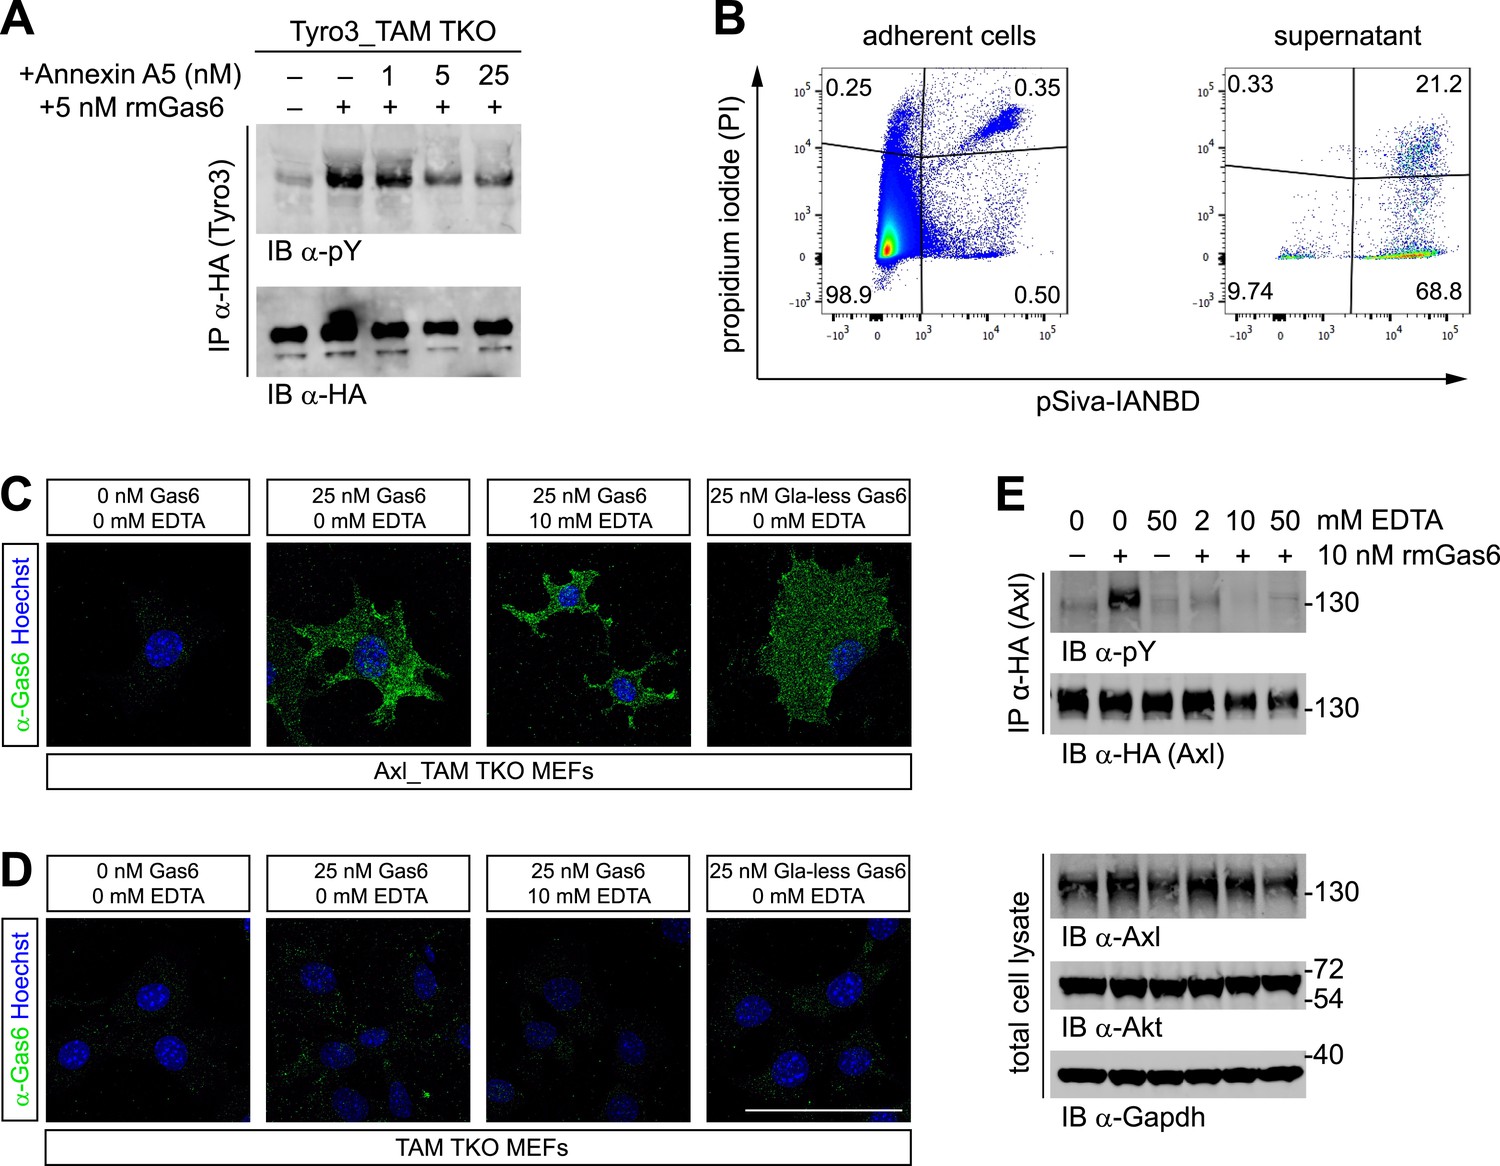
Phosphatidylserine and TAM activation.
(A) Tyro3-expressing MEFs were treated with the indicated concentrations of Annexin A5 for 10 min and then stimulated with 5 nM full-length rmGas6 for 10 min. Total cell lysates were immunoprecipitated with HA antibodies and subsequently subjected to SDS-PAGE and western blotting with the indicated antibodies. (B) FACS analysis. Adherent cells (left) and cells from culture medium (‘supernatant’, right) from Axl_TAM TKO MEF cultures were analyzed by staining with propidium iodide, which is only taken up by dead cells, and pSIVA, which only fluoresces when bound to PtdSer (right panels). Numbers in the four quadrants of the panels indicate percent of signal in that quadrant. 21.2% of the gated material in the MEF culture supernatant (upper right quadrant in the right panel) represents PtdSer-expressing apoptotic cells. (C and D) Axl_TAM TKO MEFs (C) and control TAM TKO MEFs (D) were incubated +/− rmGas6 or Gla-less rmGas6 (as indicated) and +/− 10 mM EDTA for 90 min at 4°C and then live-stained with an anti-Gas6 antibody (green) and Hoechst to visualize nuclei. (E) Axl-expressing Axl_TAM TKO MEFs were stimulated +/− 10 nM rmGas6 in the presence of the indicated concentrations of EDTA for 10 min. Total cell lysates were either: (top two blots) immunoprecipitated with HA antibodies and subsequently subjected to SDS-PAGE and western blotting with the indicated antibodies; or (bottom three loading control blots) western blotted with the indicated antibodies. Scale bar (for C and D) 50 µm.
Figure 5
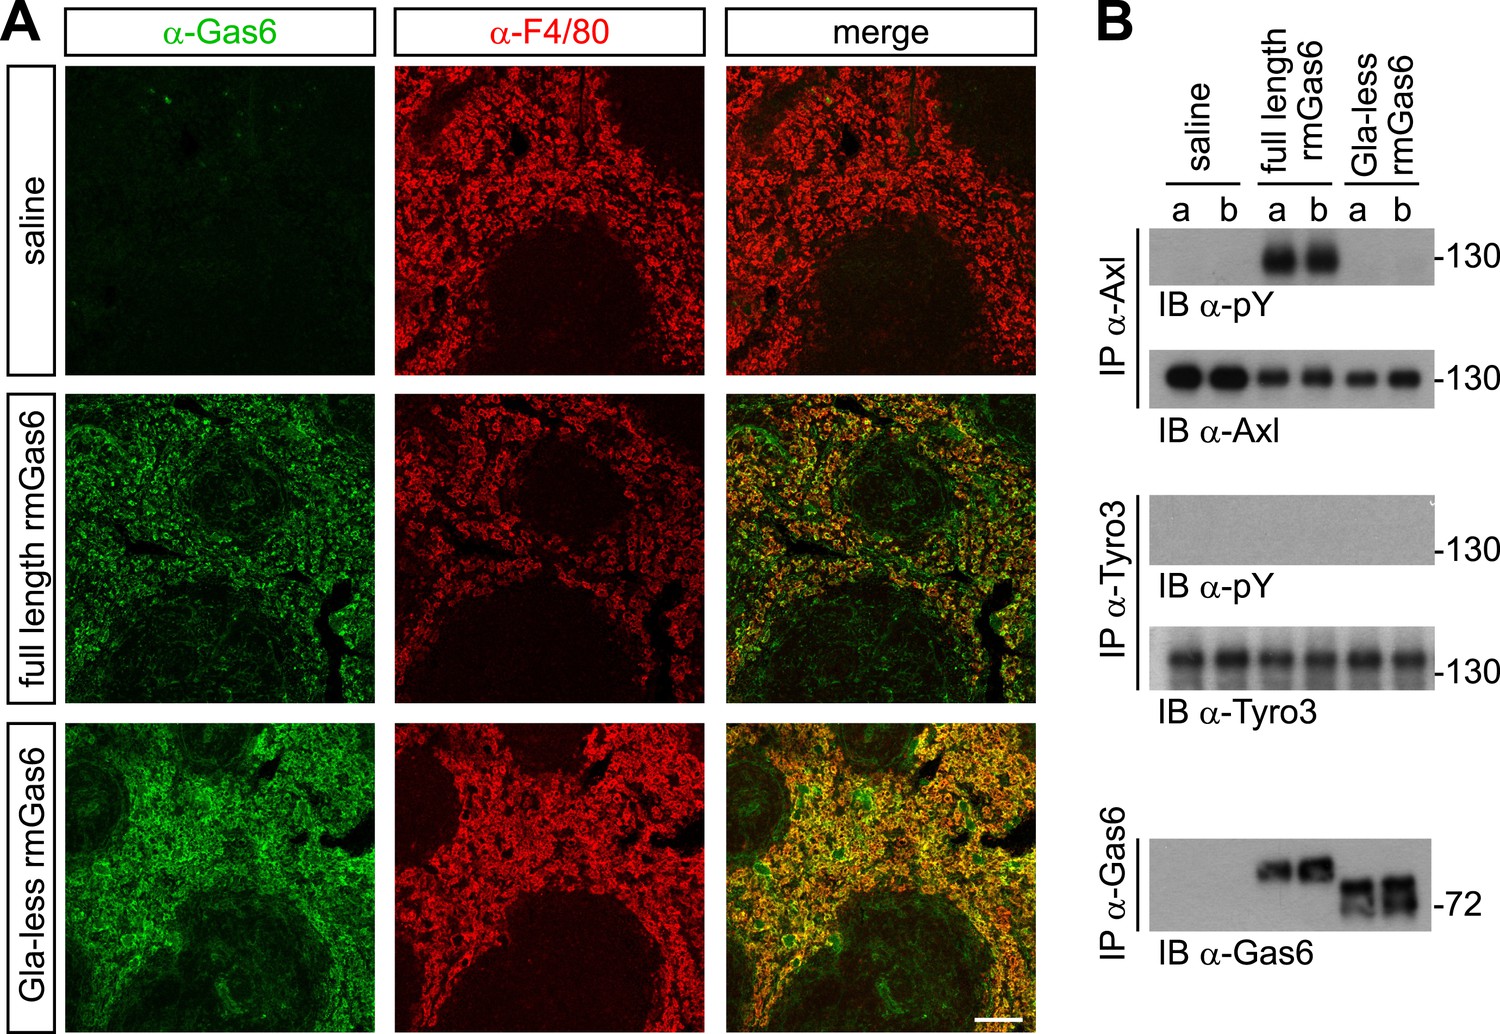
Gla-less Gas6 binds but does not activate Axl in vivo.
(A) Sections of spleens from Gas6−/− mice 30 min after IV injection of saline (top row), 30 μg full-length rmGas6 (middle row), or 30 μg Gla-less rmGas6 (bottom row), and stained with an anti-Gas6 antibody (first column, green) and an anti-F4/80 antibody to identify splenic red pulp macrophages (second column, red). Merged images from the first and second columns are displayed in the third column. (B) Splenic lysates from Gas6−/− mice injected IV as in (A) were immunoprecipitated with the indicated antibodies 30 min after injection, and the immunoprecipitates then immunoblotted for pY and Axl (top two panels), pY and Tyro3 (middle two panels), or Gas6 (bottom panel).
Figure 6 with 1 supplement
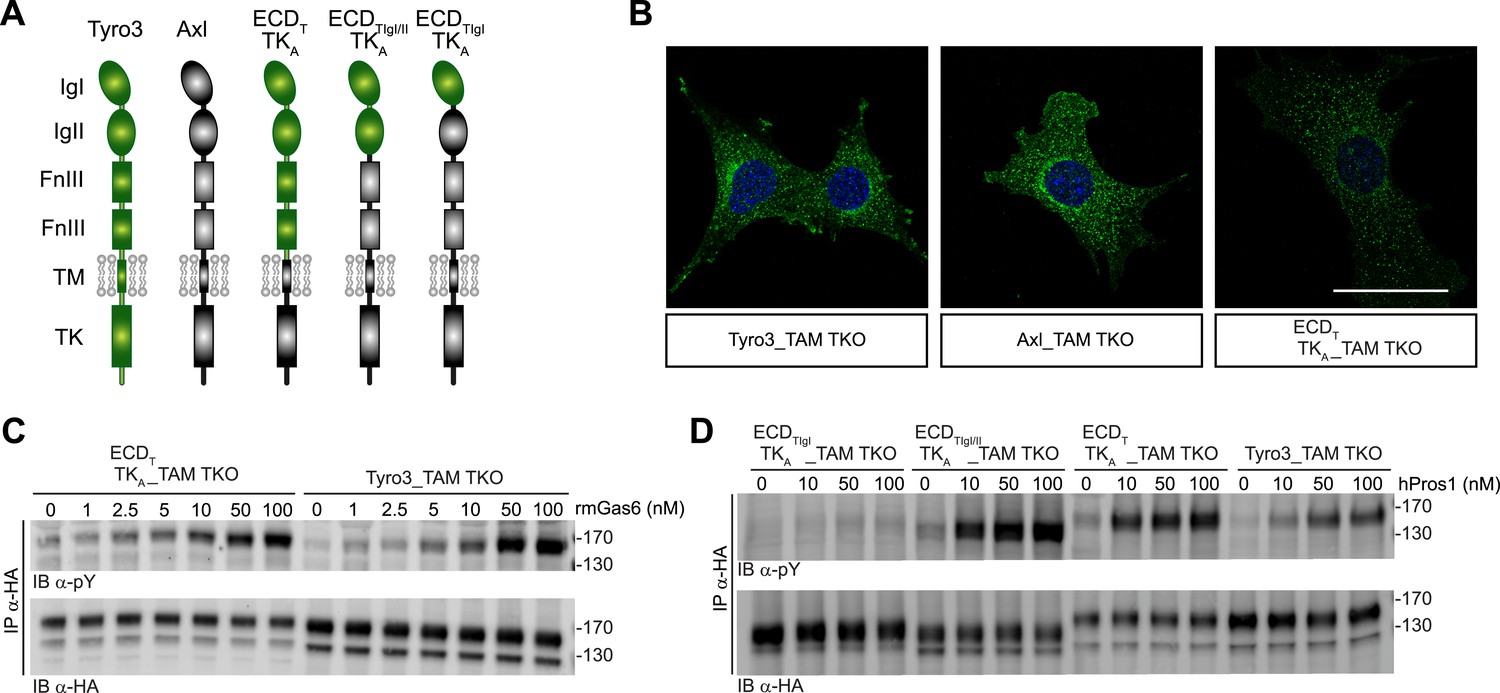
Differences in TAM receptor activation are not due to differences in TAM kinase activity.
(A) Schematic of wild-type Tyro3 and Axl, a Tyro3/Axl chimeric receptor carrying the complete Tyro3 ectodomain linked to the Axl transmembrane (TM) and tyrosine kinase (TK) domains (ECDTTKA), and chimeric receptors carrying both Tyro3 Ig domains (ECDTIgI/IITKA) or only the first Tyro3 Ig domain (ECDTIgITKA). FnIII: fibronectin type III repeat. (B) Immunostaining of Tyro3-, Axl-, and Tyro3/Axl chimera expressing TAM TKO MEFs, using an anti-HA antibody (green). Bar: 50 μm. (C and D) MEFs expressing Tyro3 or the indicated Tyro3/Axl chimeric receptors were stimulated with increasing concentrations of either rmGas6 or hPros1, respectively. Cell lysates were immunoprecipitated with anti-HA antibodies and subjected to SDS-PAGE electrophoresis followed by quantitative Licor western blotting with the indicated antibodies.
Figure 6—figure supplement 1
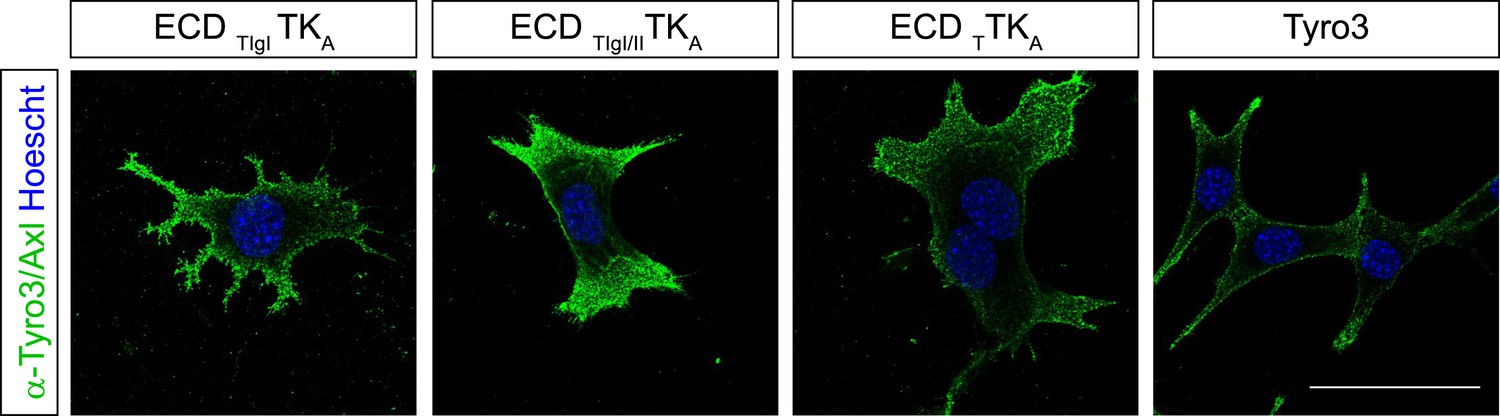
Surface expression of Tyro3/Axl chimeric receptors.
Live cell labeling of surface expression of Tyro3 or Tyro3/Axl chimeric receptors, respectively. Cells were incubated with Tyro3 and Axl antibodies in combination on ice for 1.5 hr. Scale bar: 50 µm.
Figure 7
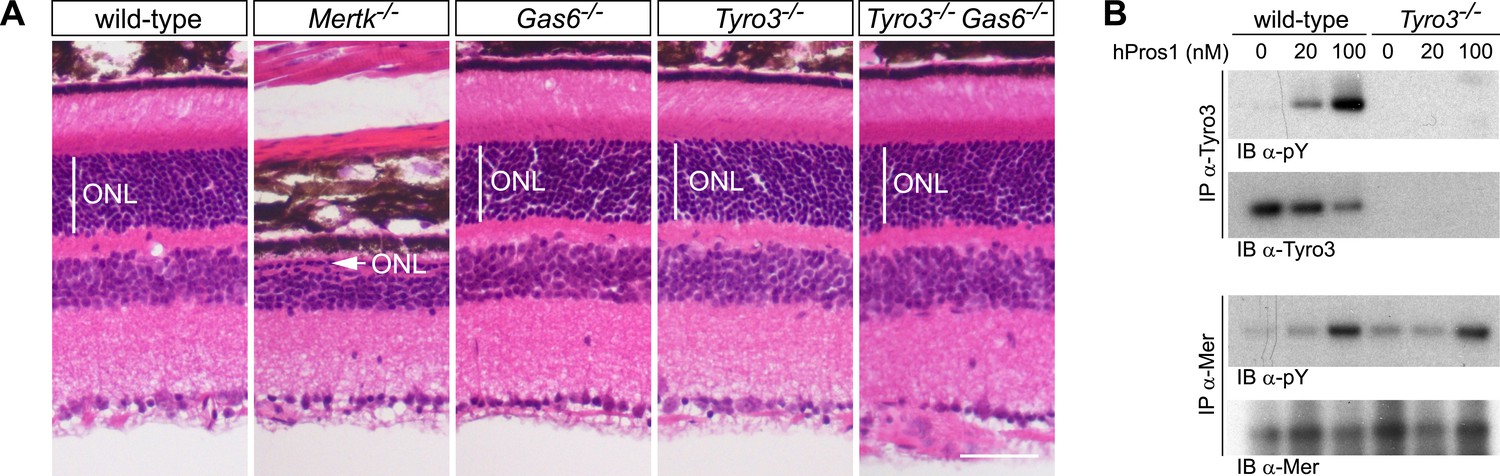
The Pros1–Mer signaling axis is sufficient for RPE phagocytosis in the retina.
(A) Dorsal–ventral H&E stained sections from 12–14 week mouse retinae. The outer nuclear layer (ONL), composed exclusively of PR nuclei, is delimited by the vertical white line. The ONL in the Mertk−/− mutant (second panel) is reduced to a thickness of a single nucleus (arrow) and the outer segment (OS) layer above is absent. In contrast, the ONL in the Gas6−/−, Tyro3−/−, and the Tyro3−/−Gas6−/− retinae is of a thickness that is indistinguishable from wild-type control. Bar: 50 μm. (B) Pros1-mediated activation of Mer in the RPE cell layer is independent of Tyro3 expression. Eye cups were acutely isolated from wild-type and Tyro3−/− mice. Cornea, iris, and lens were removed, leaving the RPE cell layer exposed. The eyecup was cultured under starvation conditions for 3 hr, and subsequently stimulated with increasing concentrations of hPros1. Cell lysates were immunoprecipitated with anti-Tyro3 or anti-Mer antibodies and receptor activation monitored by immunoblotting with anti-phosphotyrosine antibody (pY).
Figure 8 with 1 supplement
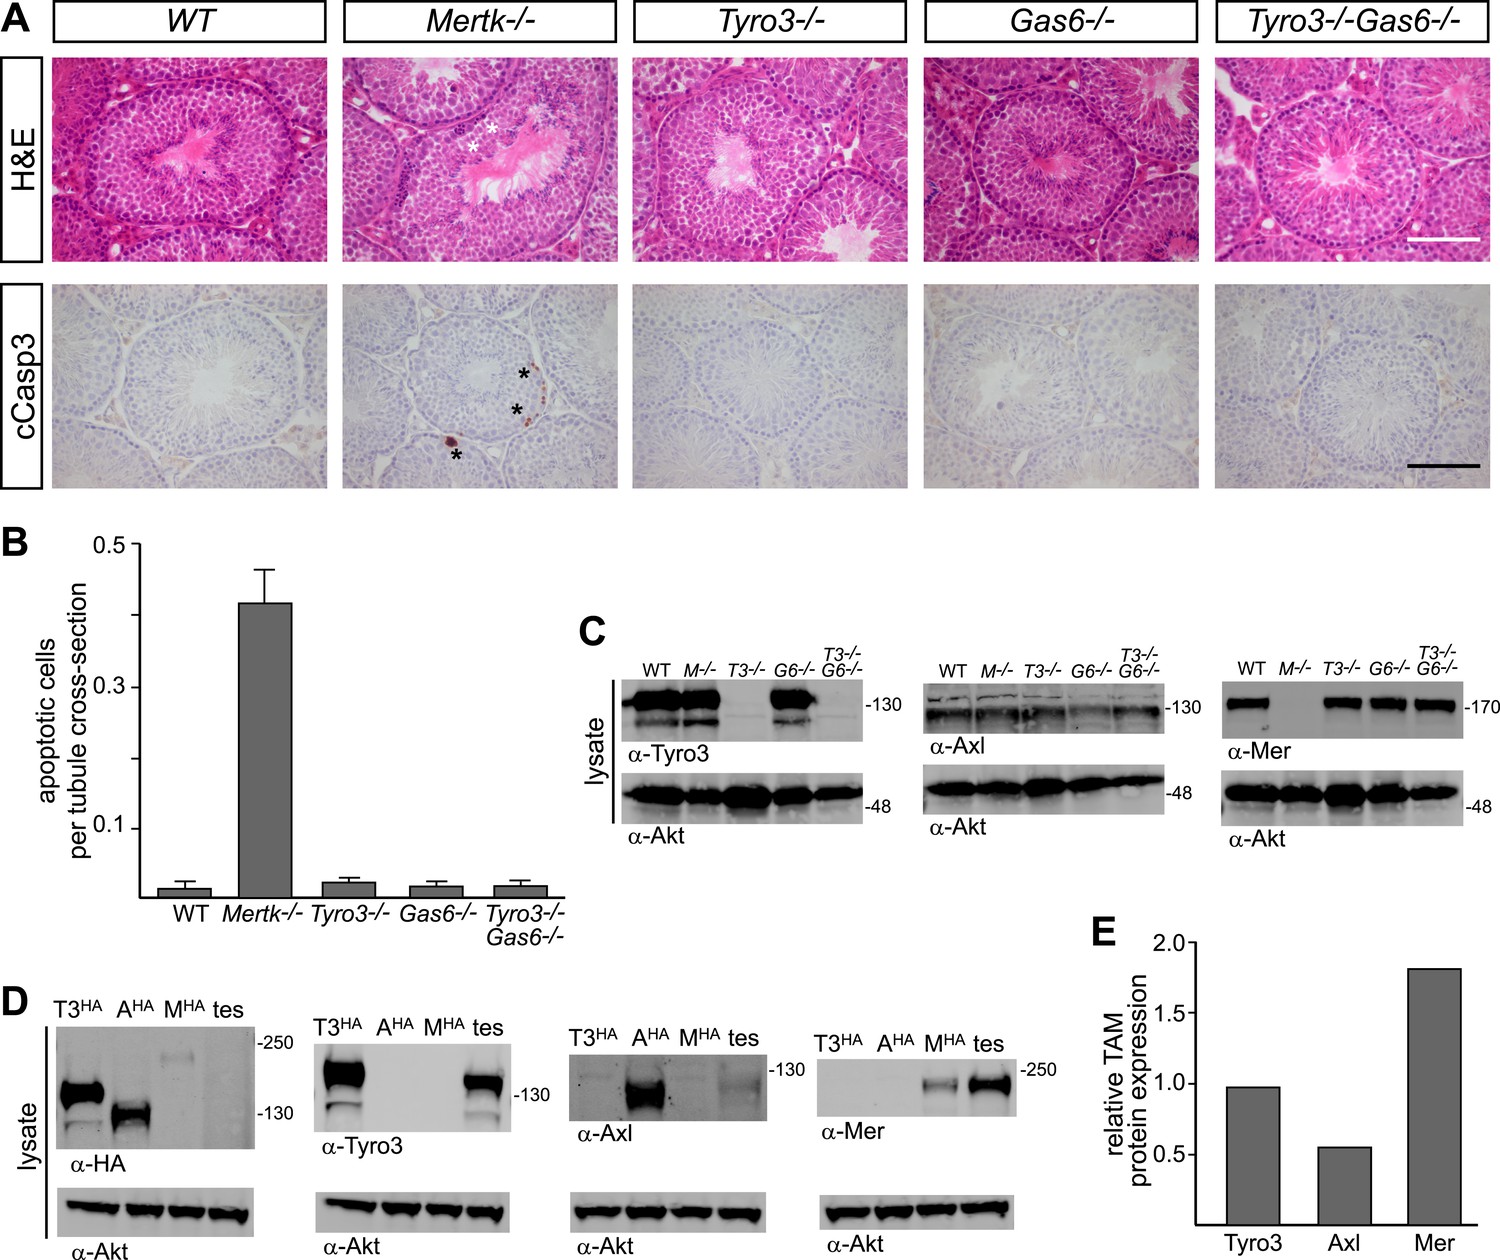
Pros1–Mer signaling is sufficient for TAM-dependent homeostatic clearance of apoptotic cells in the testis.
(A) Representative H&E images (top row) or immunostaining for cleaved caspase 3 (cCasp3) (bottom row) in testis sections from 12–14 week old wild-type and TAM ligand and/or TAM receptor mutants. For the Mertk−/− sections (second column), apoptotic cells are highlighted with white asterisks in the H&E-stained section, and cCasp3+ cells are highlighted with black asterisks. Bar: 100 μm. (B) Quantitative analysis of the number of apoptotic cells in wild-type and various TAM receptor/ligand mutants. Cleaved caspase 3+ cells and tubule cross-sections were counted in four testis cross-sections per mouse. Data are expressed as average number of ACs per number of total tubule cross-sections in each testis section. Error bars represent standard error of the mean for three independent animals. (C) TAM receptor expression in TAM receptor and TAM ligand mouse mutants. Testes were collected from 12- to 14-week old mice of the indicated genotypes and lysed. Lysates were subjected to SDS-PAGE and immunoblotting with anti-Tyro3, Axl, and Mer antibodies, with anti-Akt serving as a loading control. (D) Comparative analysis of TAM expression in the testis. Lysates from either wild-type testis or TAM TKO MEFs expressing HA-tagged Tyro3, Axl, or Mer were subjected to SDS-PAGE and subsequent quantitative Licor immunoblotting with the indicated antibodies. (E) Band intensity of the HA-tagged TAM receptors relative to each other and to wild-type testis was calculated using Licor Odyssey software and utilized to calculate the TAM protein expression relative to Tyro3 in the wild-type testis.
Figure 8—figure supplement 1
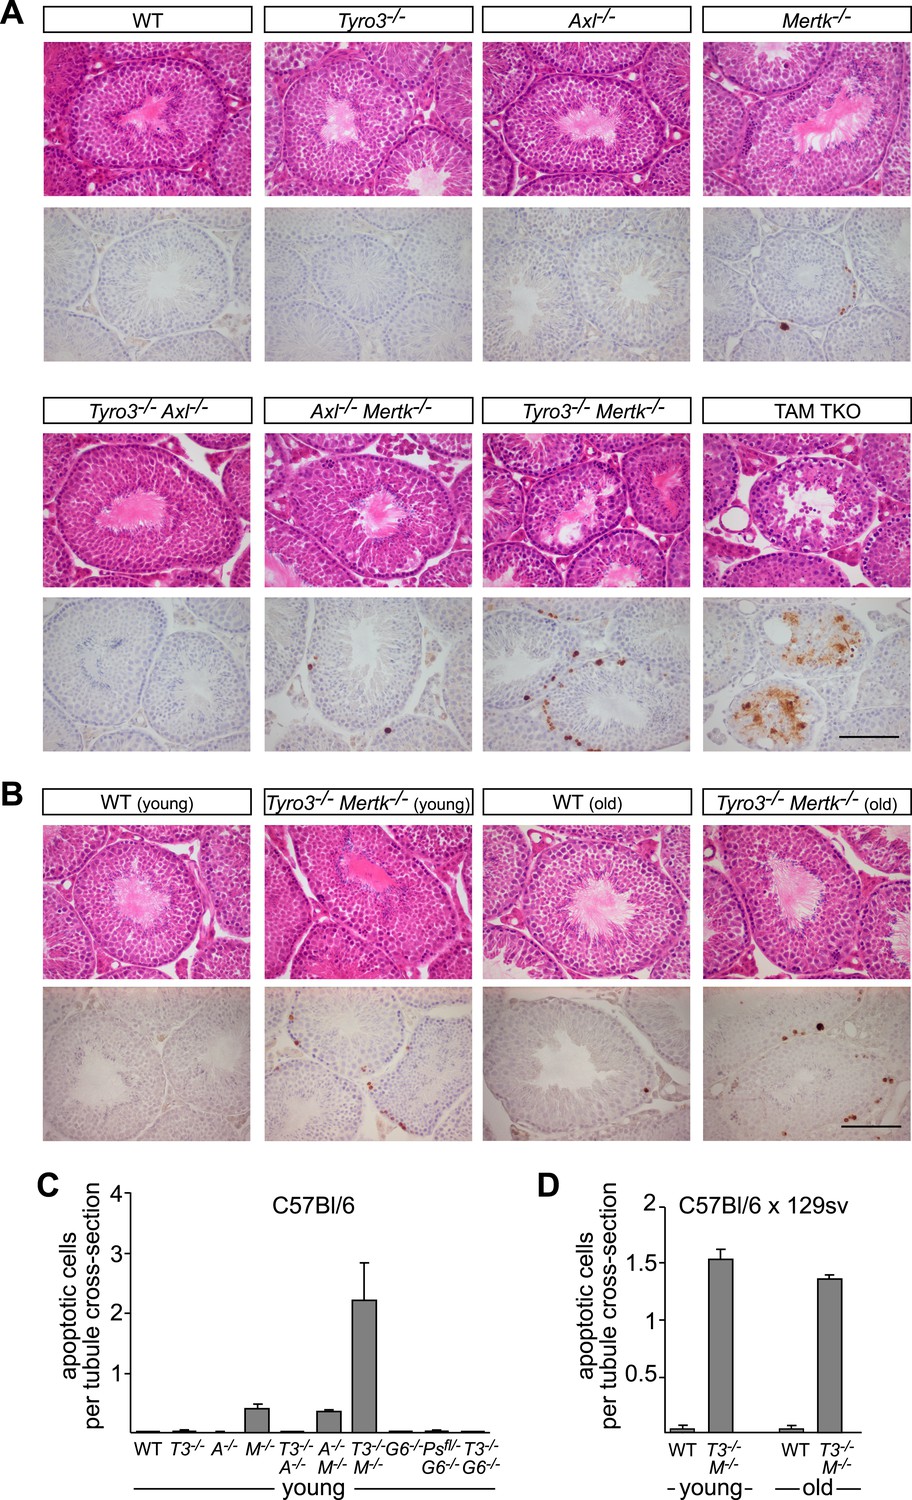
Tyro3 and Mer are key regulators of homeostatic apoptotic cell clearance in the testis.
(A) Representative H&E images (top rows) and immunostaining for cCasp3 (bottom rows) in 10- to 12-week old wild-type and TAM-deficient animals of the indicated genotypes. All mice except for TAM TKOs were on a pure C57Bl/6 background. Bar is 100 μm. (B) Comparison of the number of apoptotic cells identified by cCasp3 immunostaining in wild-type (WT) and Tyro3−/−Mer−/− double mutant testis at 10–12 weeks (young) vs the same genotypes at 9–12 months (old). Bar is 100 μm. (C) Quantitative analysis of apoptotic (cleaved Casp3+) cells in wild-type and various TAM ligand and/or TAM receptor mutants. Apoptotic cells as determined by cCasp3 staining and tubule cross-sections were counted in four testis sections per animal and averaged per number of total tubule cross-sections. All mice except for TAM TKOs were on a pure C57Bl/6 background. Error bars represent standard error of the mean for three independent animals (Pros1f/−Gas6−/−, n = 2). (D) Quantitative analysis as in (C) for the young/old testis comparison illustrated in (B). These mice were on a hybrid C57Bl/6 × 129sv background.
Figure 9
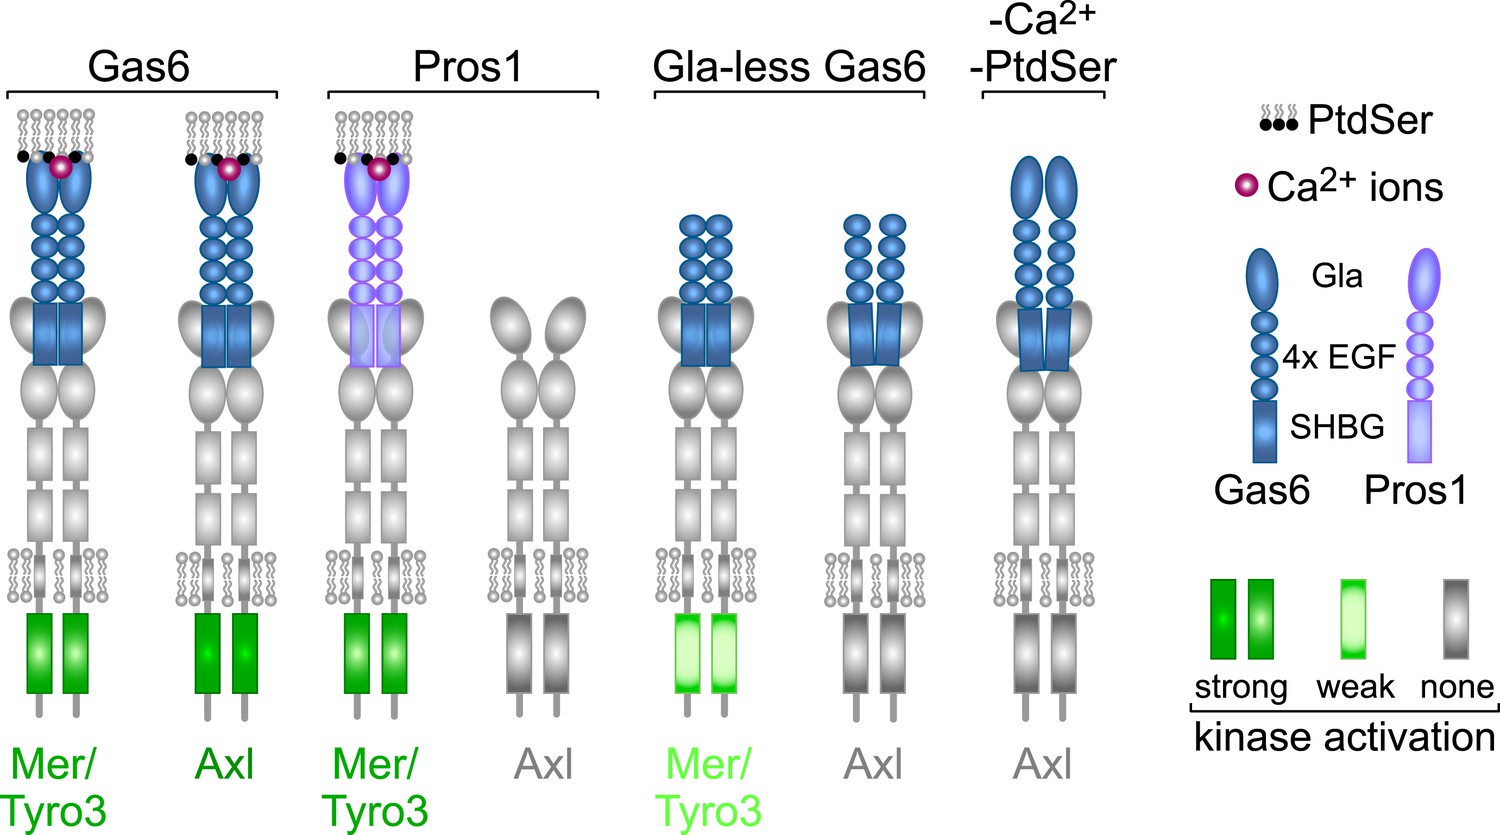
Rules of engagement for TAM receptor ligand interaction and signaling.
Gas6 activates all three TAM receptors independently, but Axl is uniquely dependent on Gas6: Pros1 activates Tyro3 and Mer but not Axl. Optimal activation of any receptor by any ligand requires the simultaneous presence of PtdSer, which binds to the Gla domain of the ligands, and calcium ions (Ca2+). Gla-less Gas6 is dead as a ligand when assayed against Axl in isolation. Its Axl-bound orientation is schematized differently from Tyro3- and Mer-bound Gla-less Gas6, since the latter two result in partial kinase activation, although there are no structural data for these complexes. The right-most signaling configuration, in which full-length Gas6 is also inactive as an Axl ligand in the absence of PtdSer and Ca2+, is speculation based on the results of this paper and data in (Zagórska et al., 2014). See text for details.
Download links
A two-part list of links to download the article, or parts of the article, in various formats.
Downloads (link to download the article as PDF)
Open citations (links to open the citations from this article in various online reference manager services)
Cite this article (links to download the citations from this article in formats compatible with various reference manager tools)
Differential TAM receptor–ligand–phospholipid interactions delimit differential TAM bioactivities
eLife 3:e03385.
https://doi.org/10.7554/eLife.03385


