Extensive translation of small Open Reading Frames revealed by Poly-Ribo-Seq
- University of Sussex, United Kingdom
Figures
Figure 1 with 2 supplements
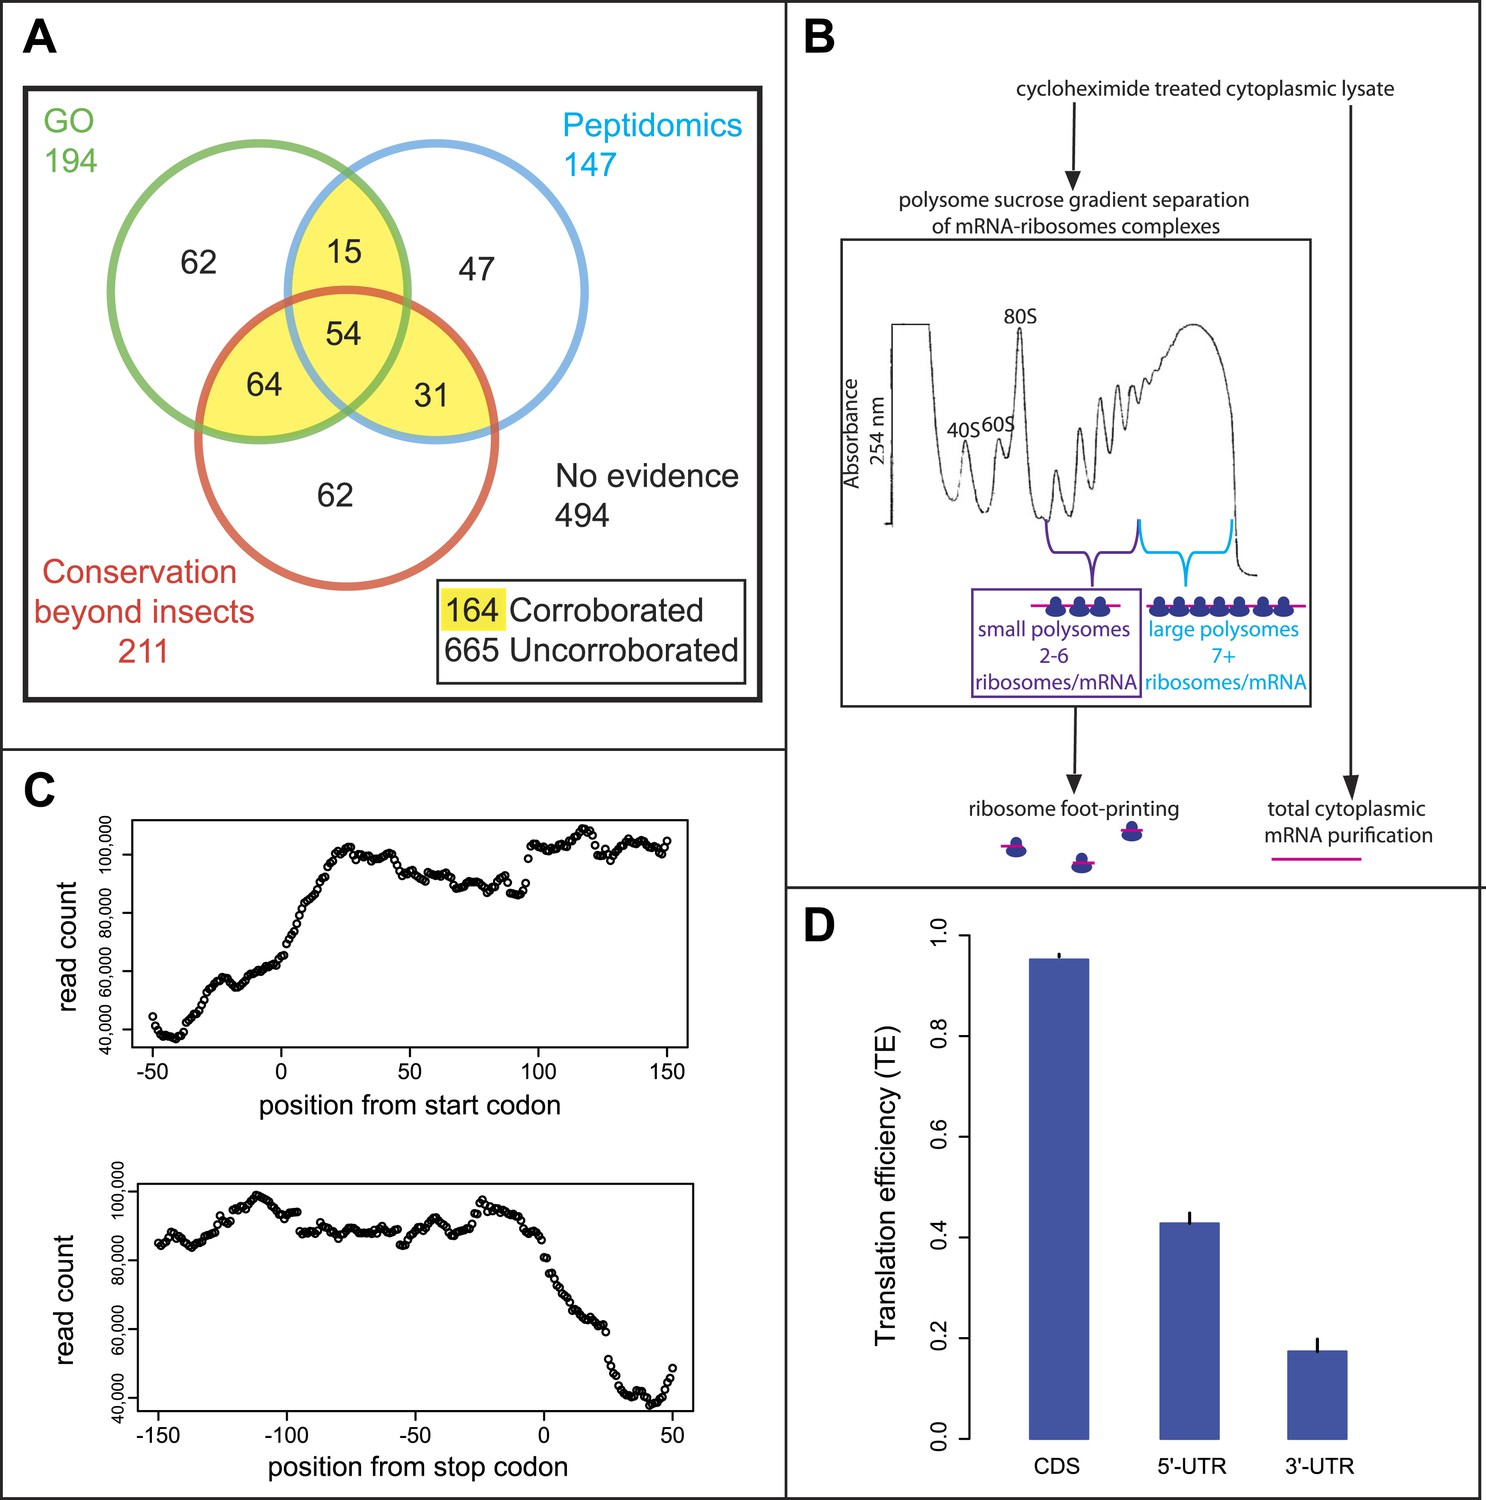
Poly-Ribo-Seq of small and large polysomes.
(A) Venn diagram categorising annotated Drosophila smORFs as corroborated or uncorroborated based on evidence (FlyBase) from two out of three of: GO molecular function term assignment (green), peptidomic evidence (blue), and conservation outside of insects (red). Based on this, out of the total of 829 annotated smORFs, 665 are uncorroborated, and 494 have no evidence of translation. (B) Schematic of Poly-Ribo-Seq with representative UV absorbance profile for sucrose density gradient. Small (purple) and large (blue) polysomes are separated and subject to ribosome footprinting. (C) Composite plot from all FlyBase protein-coding genes of Poly-Ribo-Seq read counts across mRNAs in the vicinity of start (upper) and stop codons (lower) in small polysomes. (D) Median translational efficiencies of CDS, 5′ and 3′-UTR regions for all protein-coding genes, error bars represent SE.
Figure 1—figure supplement 1
Poly-Ribo-Seq of small and large polysomes.
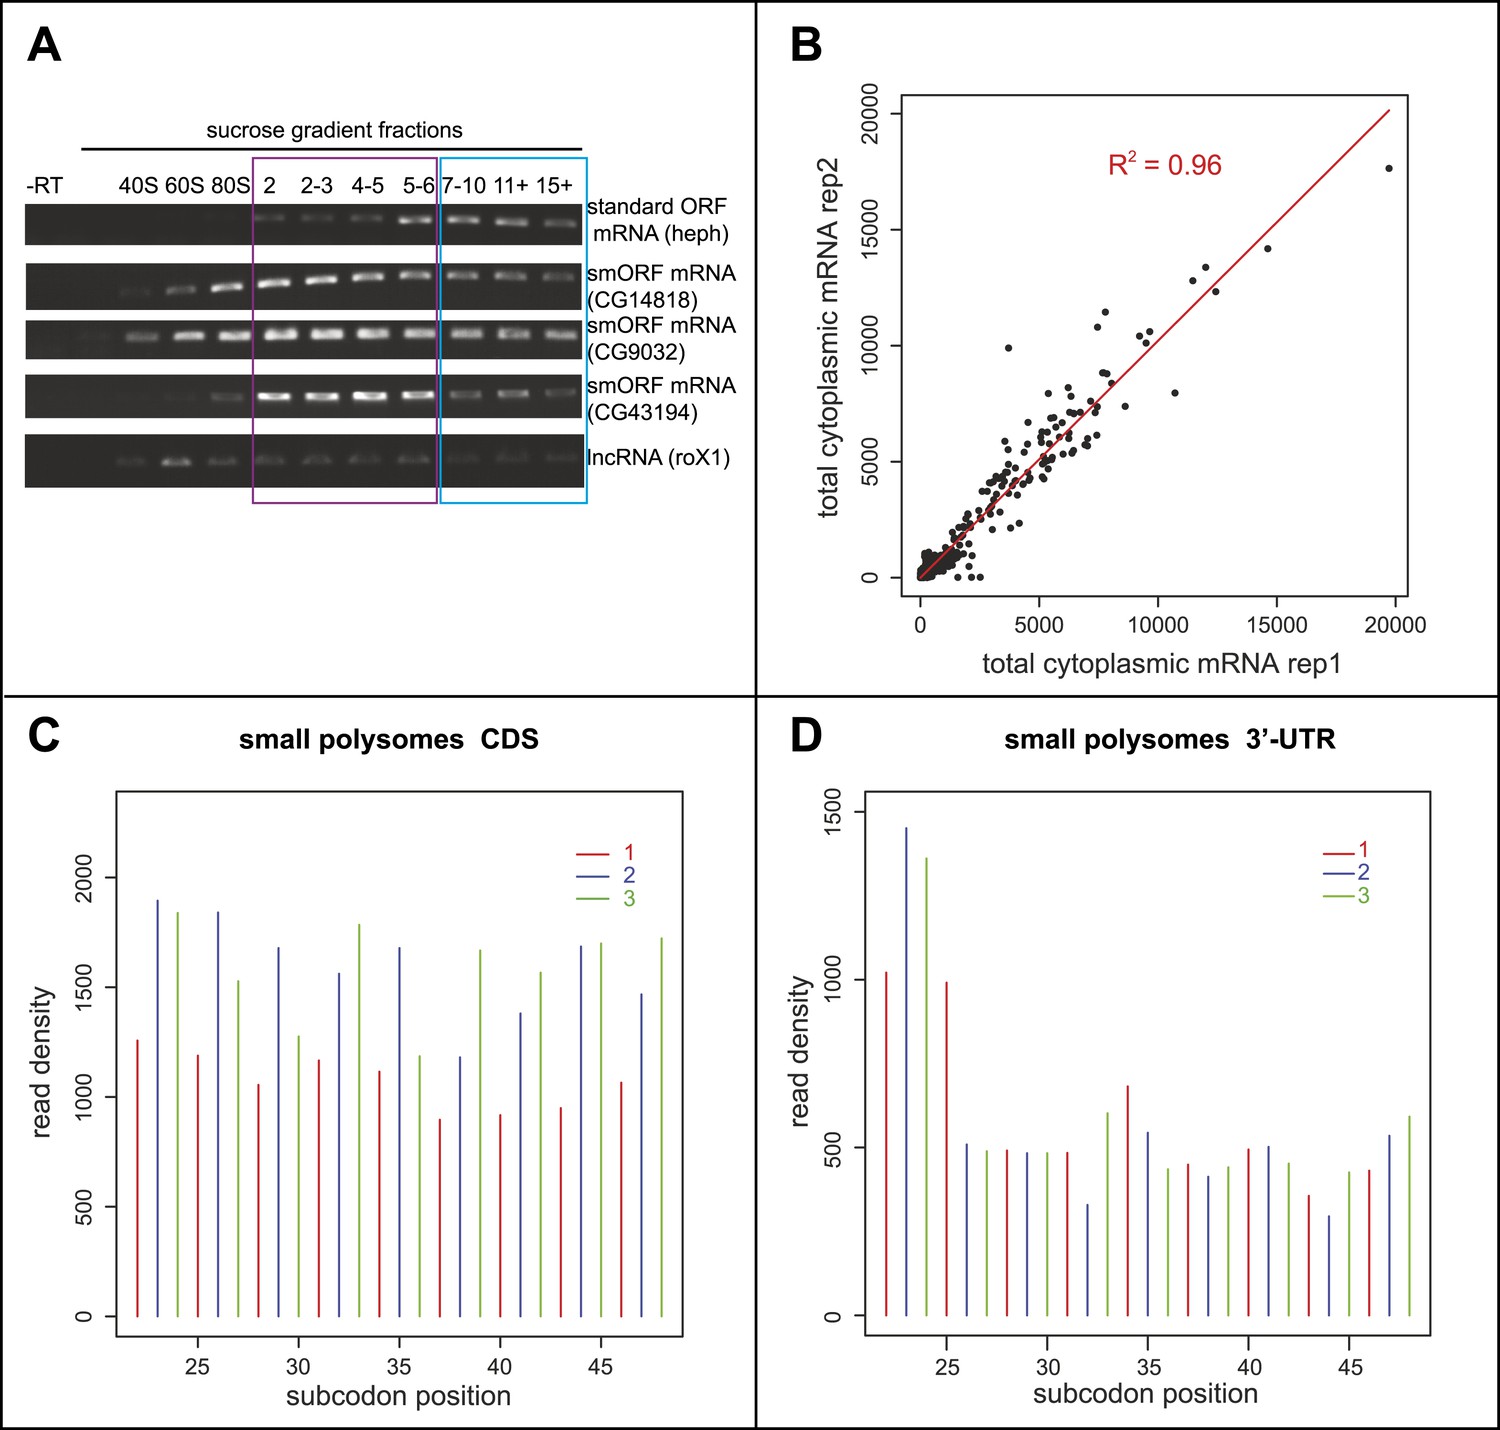
(A) RT-PCR of RNA recovered from sucrose gradient fractions for one standard ORF mRNA (heph), three annotated smORF mRNAs (CG14818, CG9032, and CG43194) and one long non-coding RNA (roX1), with -RT control. Fractions corresponding to small (purple, 2-6 ribosomes) and large (blue, 7 or more ribosomes) polysomes are indicated. (B) Read densities (RPKM) from two biological replicates of the total cytoplasmic mRNA control exhibit very high correlation (R2 = 0.96). (C and D) Read density plots showing phasing of ribosome footprinting reads in triplets corresponding to codons in CDS (C) and an absence of triplet phasing in 3′-UTRs (D) (small polysome data).
Figure 1—figure supplement 2
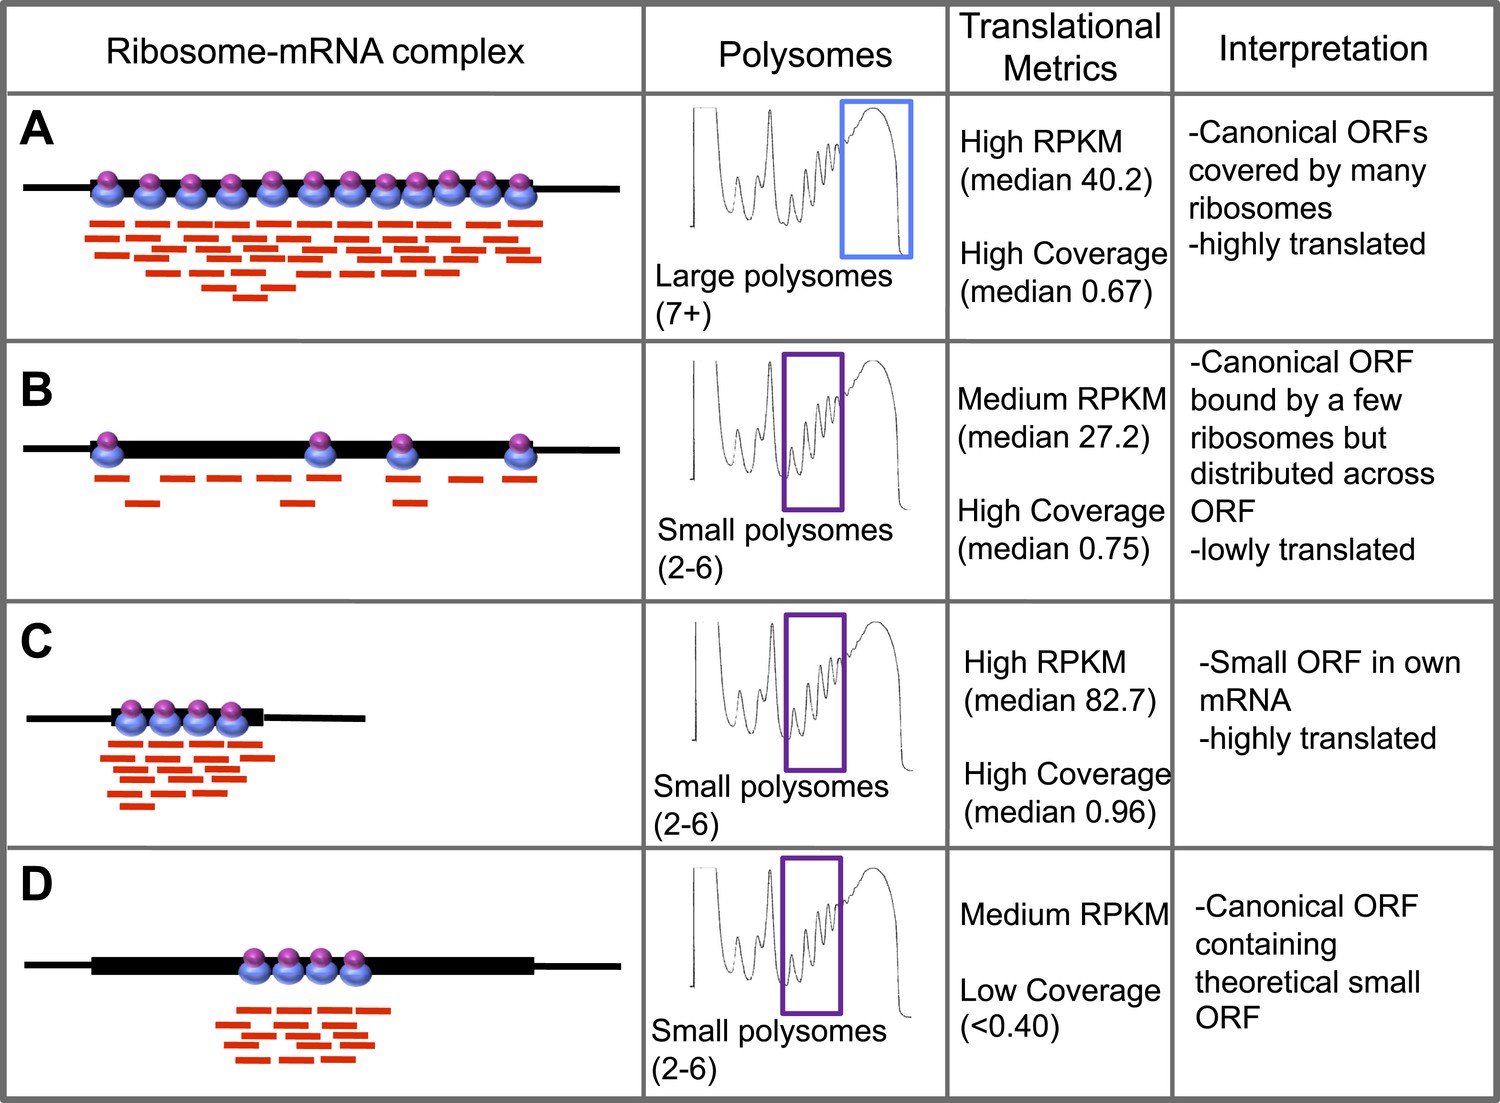
Schematic interpretation of Poly-Ribo-Seq.
Schematic summary of characterised (A–C) and theoretical (D) translation scenarios. Diagrams of ribosome–mRNA complexes are shown along with the polysome fraction in which it is detected, translational metrics and interpretation of this information, for (A–C) long canonical ORFs, (C) smORFs, and (D) canonical ORF containing a theoretical small ORF.
Figure 2 with 1 supplement
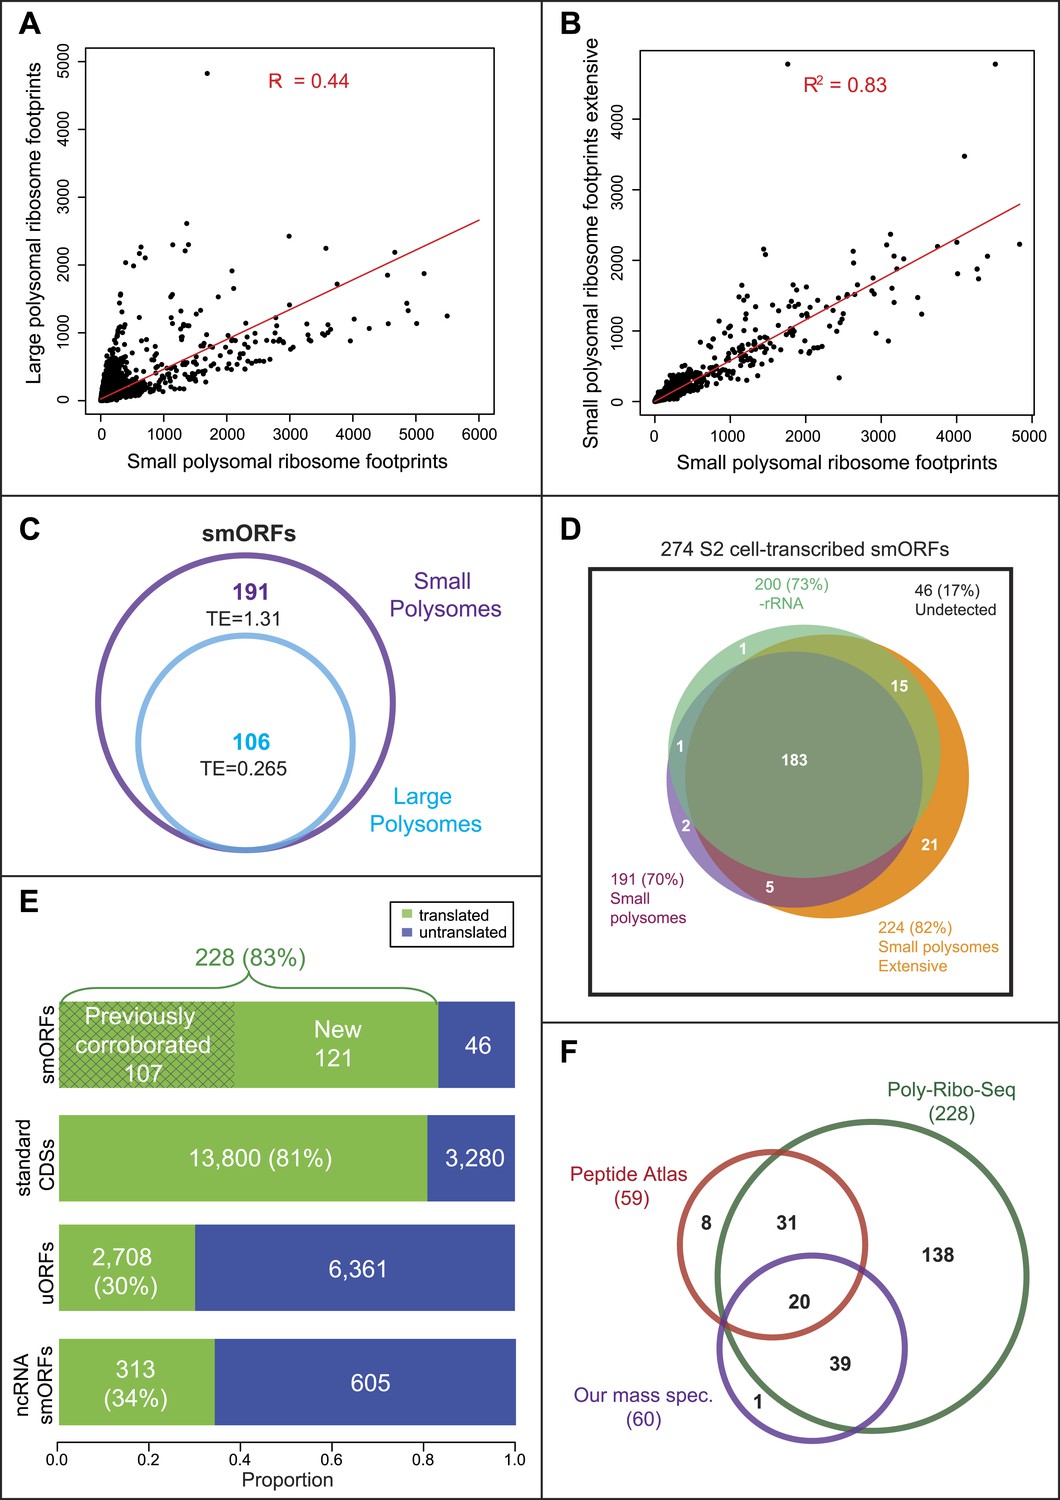
Poly-Ribo-Seq reveals translation of smORFs.
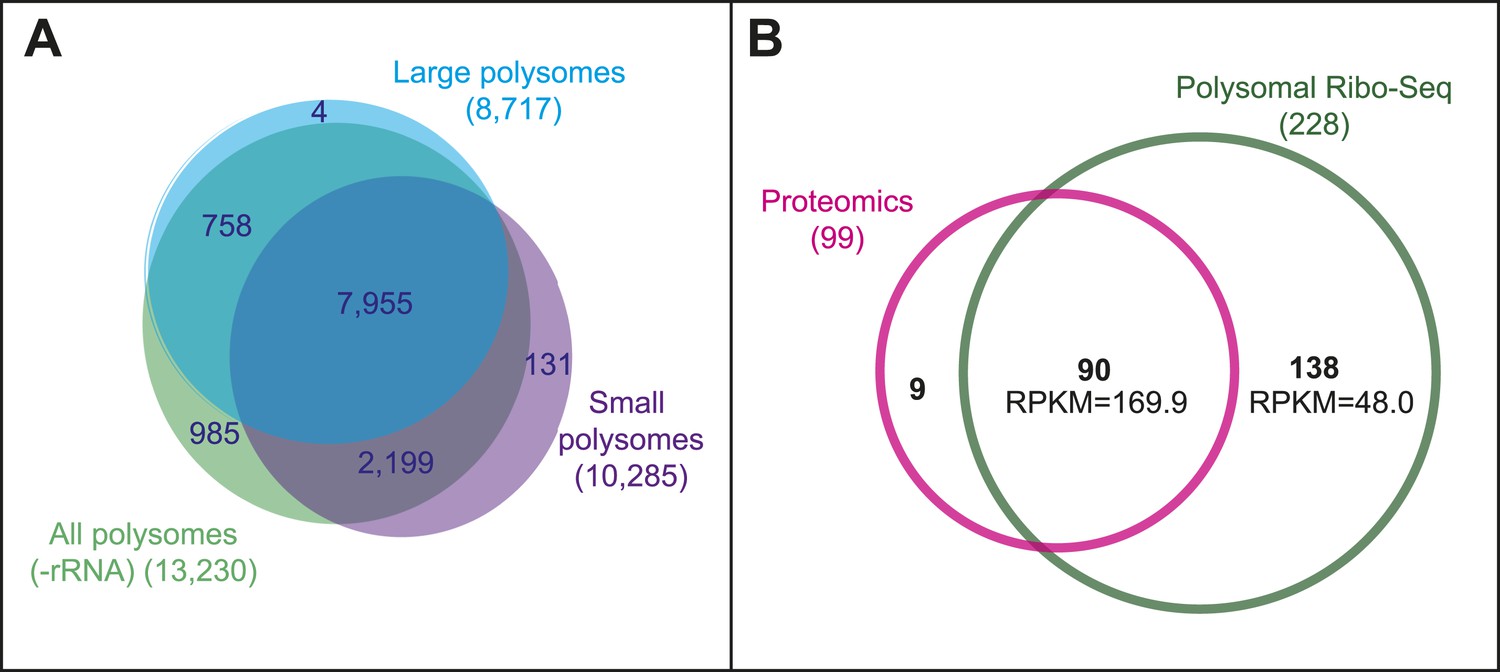
(A) Ribosome footprinting densities (RPKM) from small polysomes correlate poorly with large polysomes (whereas two replicates of total cytoplasmic mRNA controls do, see Figure 1—figure supplement 1B). (B) Ribosome footprinting densities (RPKM) from small polysomes correlate highly between two biological replicates (R2 = 0.83). (C) All 106 smORFs detected in large polysomes (blue) were also present in the 191 detected in small polysomes (purple). smORF footprints are much more abundant in small polysomes, as indicated by a higher TE value. (D) High coincidence of annotated smORFs detected as translated in three different Poly-Ribo-Seq experiments. Small polysome extensive experiment probes most deeply with 224 smORFs detected as translated (small polysomes: purple, small polysomes extensive: yellow, -rRNA: turquoise). (E) Numbers and proportions of transcribed ORFs, which are translated, according to Poly-Ribo-Seq data (translated: green, untranslated: blue). The proportion of annotated smORFs translated is similar to that of standard CDSs. 121 annotated smORFs are newly detected as translated, plus 2708 uORFs and 313 smORFs from ncRNAs. (F) Venn diagram showing overlap between Poly-Ribo-Seq (dark green), our mass spectrometry experiments (purple) and Peptide Atlas proteomic data (red).
Figure 2—figure supplement 1
Poly-Ribo-Seq reveals translation of smORFs.
(A) Results of Poly-Ribo-Seq experiments with all (-rRNA: turquoise), large (blue), and small (purple) polysomes showing the number of canonical protein-coding ORFs (longer than 100 aa) translated and the overlap between experiments. (B) Venn diagram showing the overlap in the detection of translation between Poly-Ribo-Seq (dark green) and proteomic experiments (pink). Median RPKMs from Poly-Ribo-Seq are indicated.
Figure 3 with 2 supplements

Validation of smORF translation by tagging assay.
(A–D) Ribosome footprints from small polysomes (pink) and mRNA reads (grey) mapped to smORFs, along with transcript and ORF models of (A) CG7630, (B) CG33774, (C) CR30055 (ncRNA), and (D) FBtr0072084_1 (uORF). Corresponding transfection assays in S2 cells are shown (FLAG antibody: green, F-actin stained with phalloidin: red, scale bars = 5 μm) together with Poly-Ribo-Seq metrics (RPKM, coverage and TE). Distribution of each peptide (reticular, other cytoplasmic or limited) is indicated.
Figure 3—figure supplement 1
Validation of smORF translation by tagging assay.
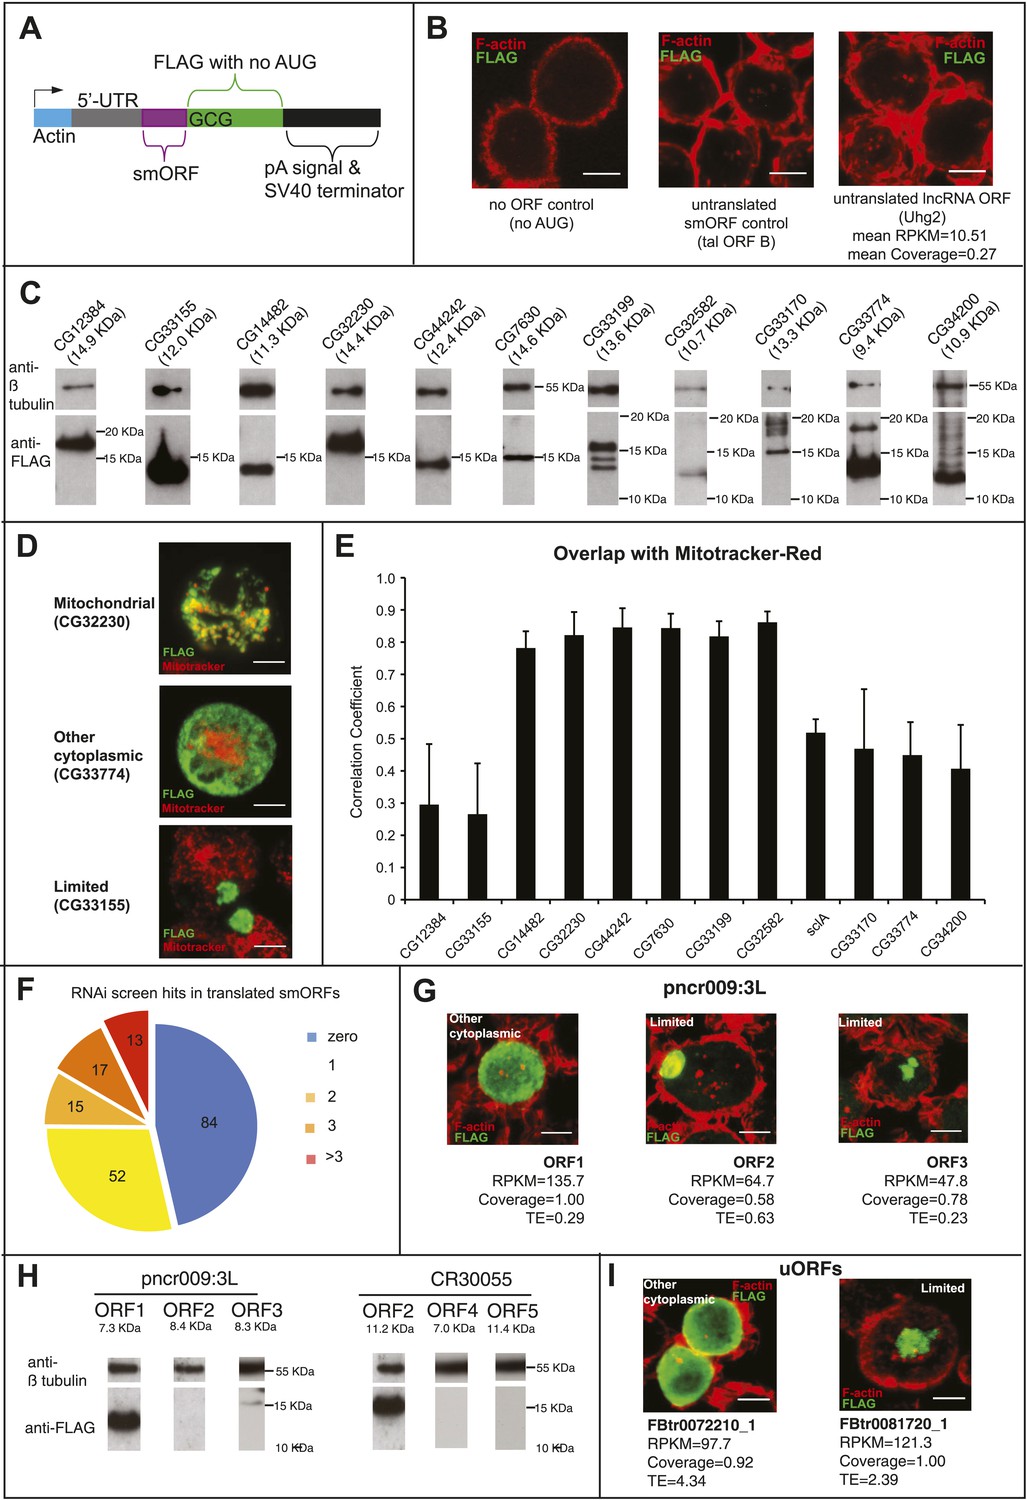
(A) Schematic of the transfection construct into which smORF 5′-UTRs and ORFs (no stop codon) were cloned under the Actin promoter, such as to be fused in frame to a C-terminal FLAG tag, with its own AUG start codon mutated to GCG. (B) Transfection negative controls, plasmid with no ORF (nor AUG), plasmid with the full-length tal transcript (minus 3′-UTR) with ORF-B tagged with FLAG, which has previously been shown not to be translated (Galindo et al., 2007), and a plasmid containing a putative smORF that is transcribed but not translated according to our Poly-Ribo-Seq (Uhg2-ORF1). (C) Immunoblot showing translation of FLAG-tagged smORFs (Table 3) corresponding to predicted sizes, along with β- tubulin loading control. (D) Different subcellular localisations of FLAG-tagged smORFs (green) corroborated by double staining with Mitotracker Red (red): “mitochondrial”, “other cytoplasmic” and “limited” (scale bar = 5 μm). (E) Correlation analysis of colocalisation between FLAG-tagged smORF peptides and Mitotracker Red, error bars represent SD from three experiments. (F) 50% of S2-cell translated smORFs show function in previous RNAi screens (Flymine). (G) Translation of FLAG-tagged pncr009:3L (ncRNA) ORFs 1, 2, and 3 in transfection assay with translational metric values shown (FLAG antibody: green, F-actin stained with phalloidin: red, scale bars = 5 μm). (H) Immunoblot showing detection of FLAG-tagged ORFs from pncr009:3L and CR30055 with predicted sizes (Table 4), along with β-tubulin loading control. (I) Translation of FLAG-tagged uORFs FBtr0072210_1 and FBtr0081720_1 in transfection assays with translational metric values shown (FLAG antibody: green, F-actin stained with phalloidin: red, scale bars = 5 μm).
Figure 3—figure supplement 2
Poly-Ribo-Seq reveals translation of ORFs in ncRNAs.
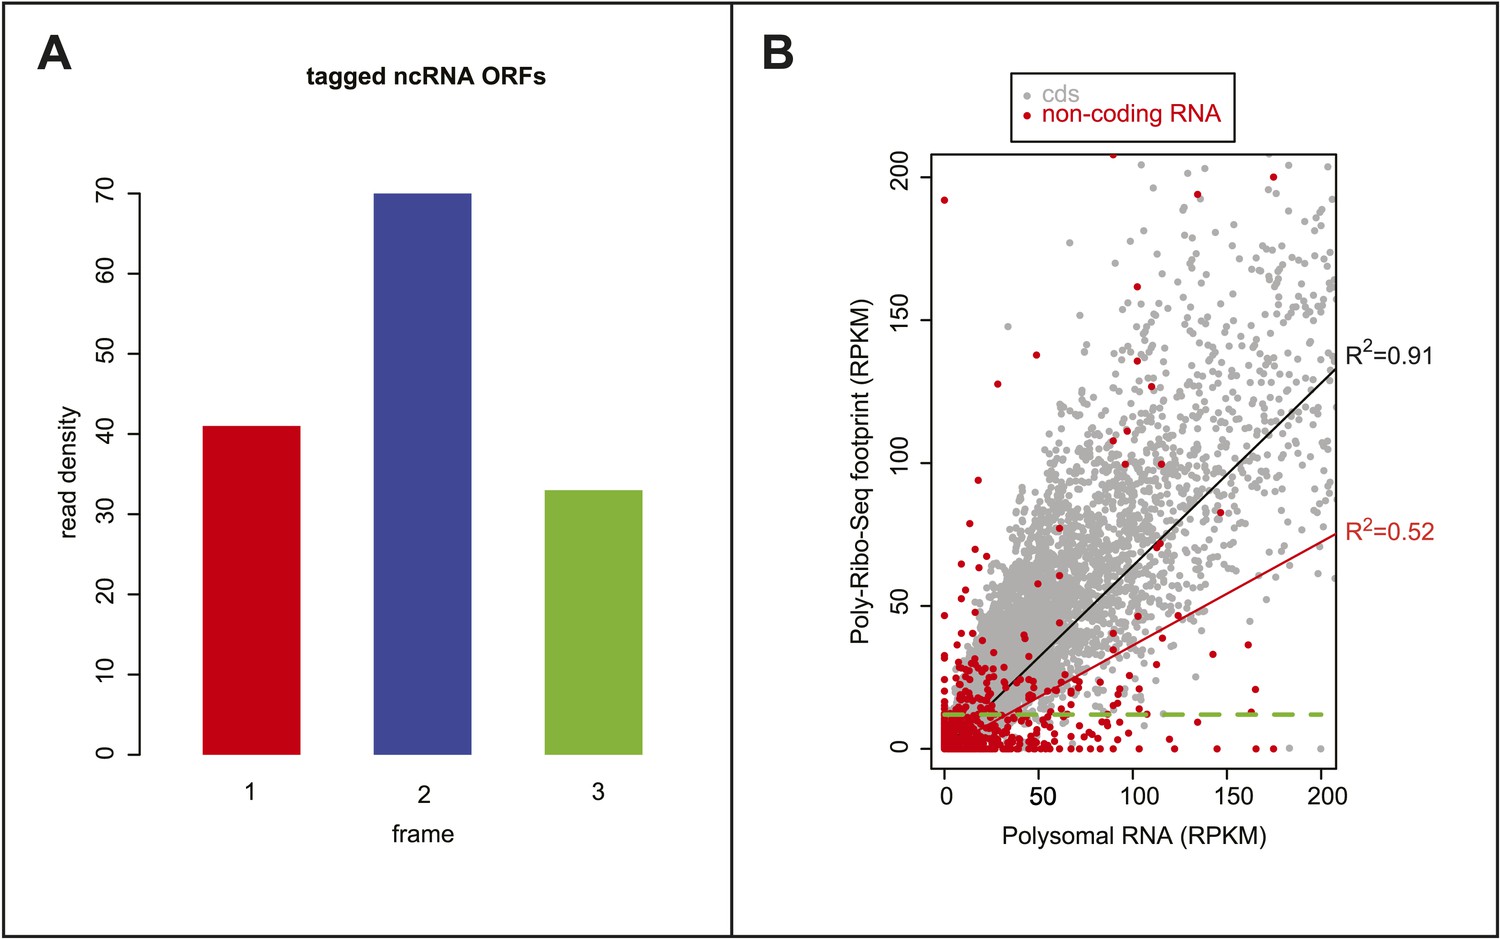
(A) Read density plot showing phasing of ribosome footprinting reads in the frame of smORFs within CR30055 and pncr009:3L detected as translated and confirmed by FLAG immunofluorescence translation assay. (B) Correlation of reads obtained by ORFs after Poly-Ribo-Seq (y axis) with reads obtained by sequencing of polysomal fractions before ribosome footprinting (x axis). The correlation is much stronger for canonical long ORFs and putative smORFs (grey) than for ncRNA ORFs (red). Many ncRNA ORFs below the 11.8 RPKM cut-off used to ascertain translation (green dotted line) can show association with polysomes (high Polysomal RNA RPKM), thus translation of ORFs in ncRNAs does not simply stem from non-coding association with polysomes.
Figure 4 with 1 supplement
Bioinformatic indicators of smORFs.
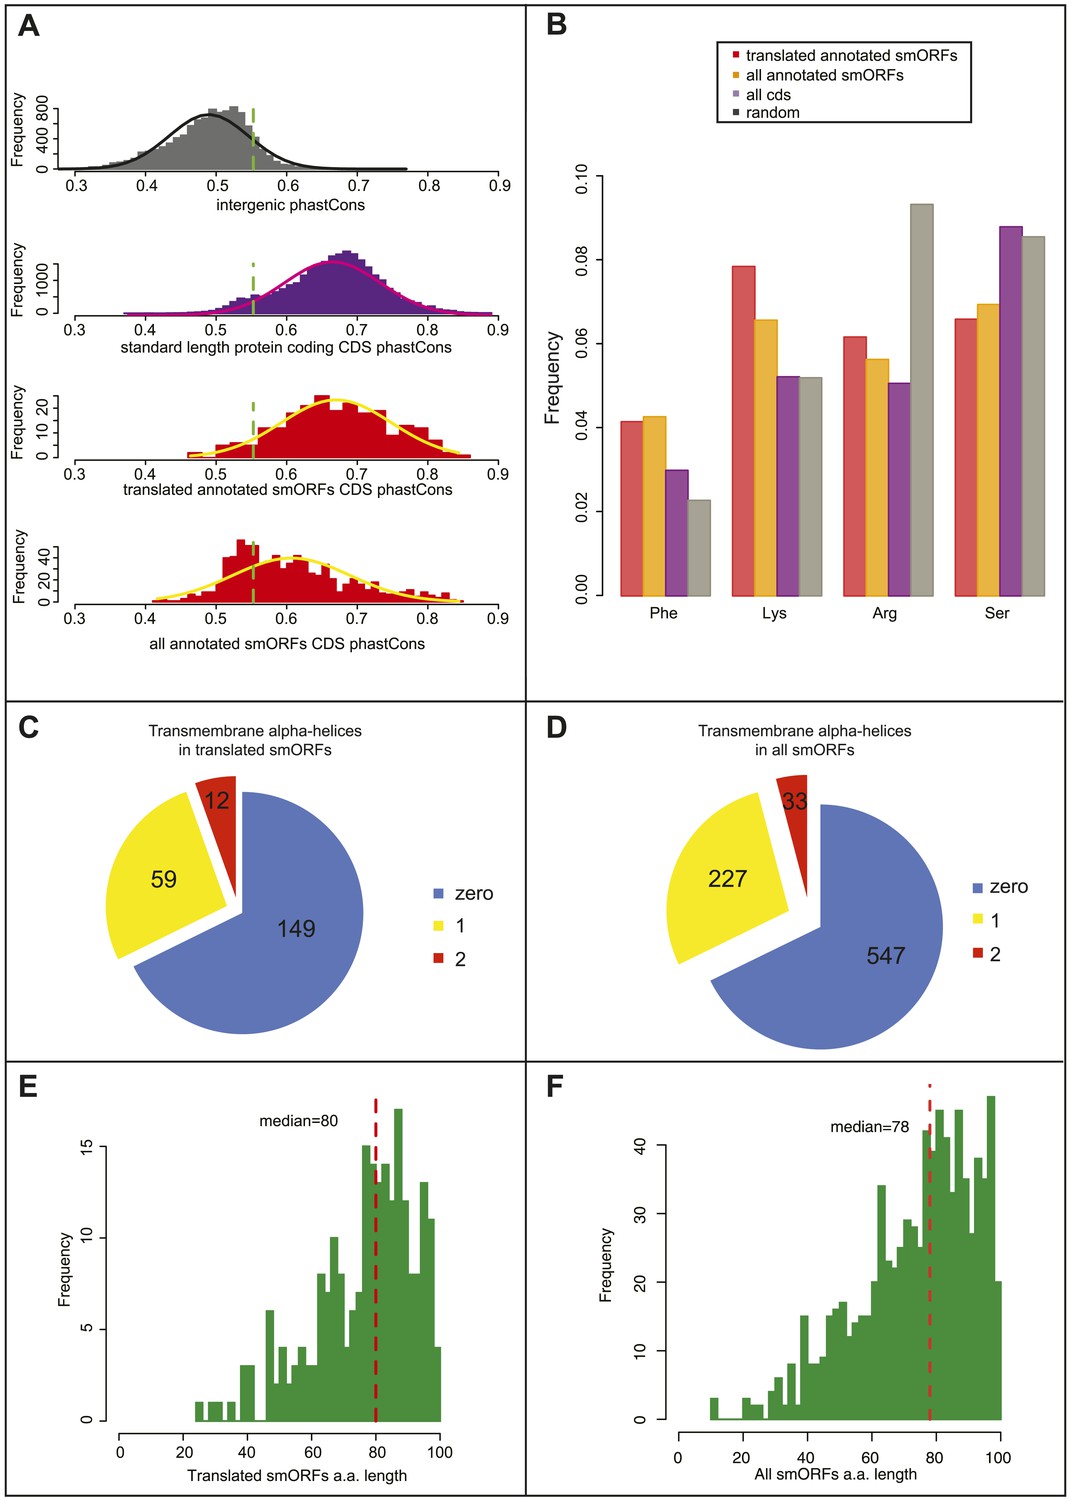
(A) Distribution of phastCons scores for intergenic regions, standard length protein-coding CDSs (longer than 100 aa), S2 cell-translated annotated smORFs, and all annotated smORFs, with fitted normal curves. Green dotted lines indicate the 90th percentile of intergenic phastCons scores (0.55). (B) Relative abundance of particular amino acids in proteins (random expected: black, all CDSs: purple, all annotated smORFs: yellow, and translated smORFs: red). (C and D) Proportion of (C) S2-cell translated (32%) and (D) all smORFs (32%) predicted to contain transmembrane α helices (TMHMM). (E and F) Frequency distribution of smORF peptide lengths for (E) translated and (F) all annotated smORFs with medians shown by red dotted line.
Figure 4—figure supplement 1
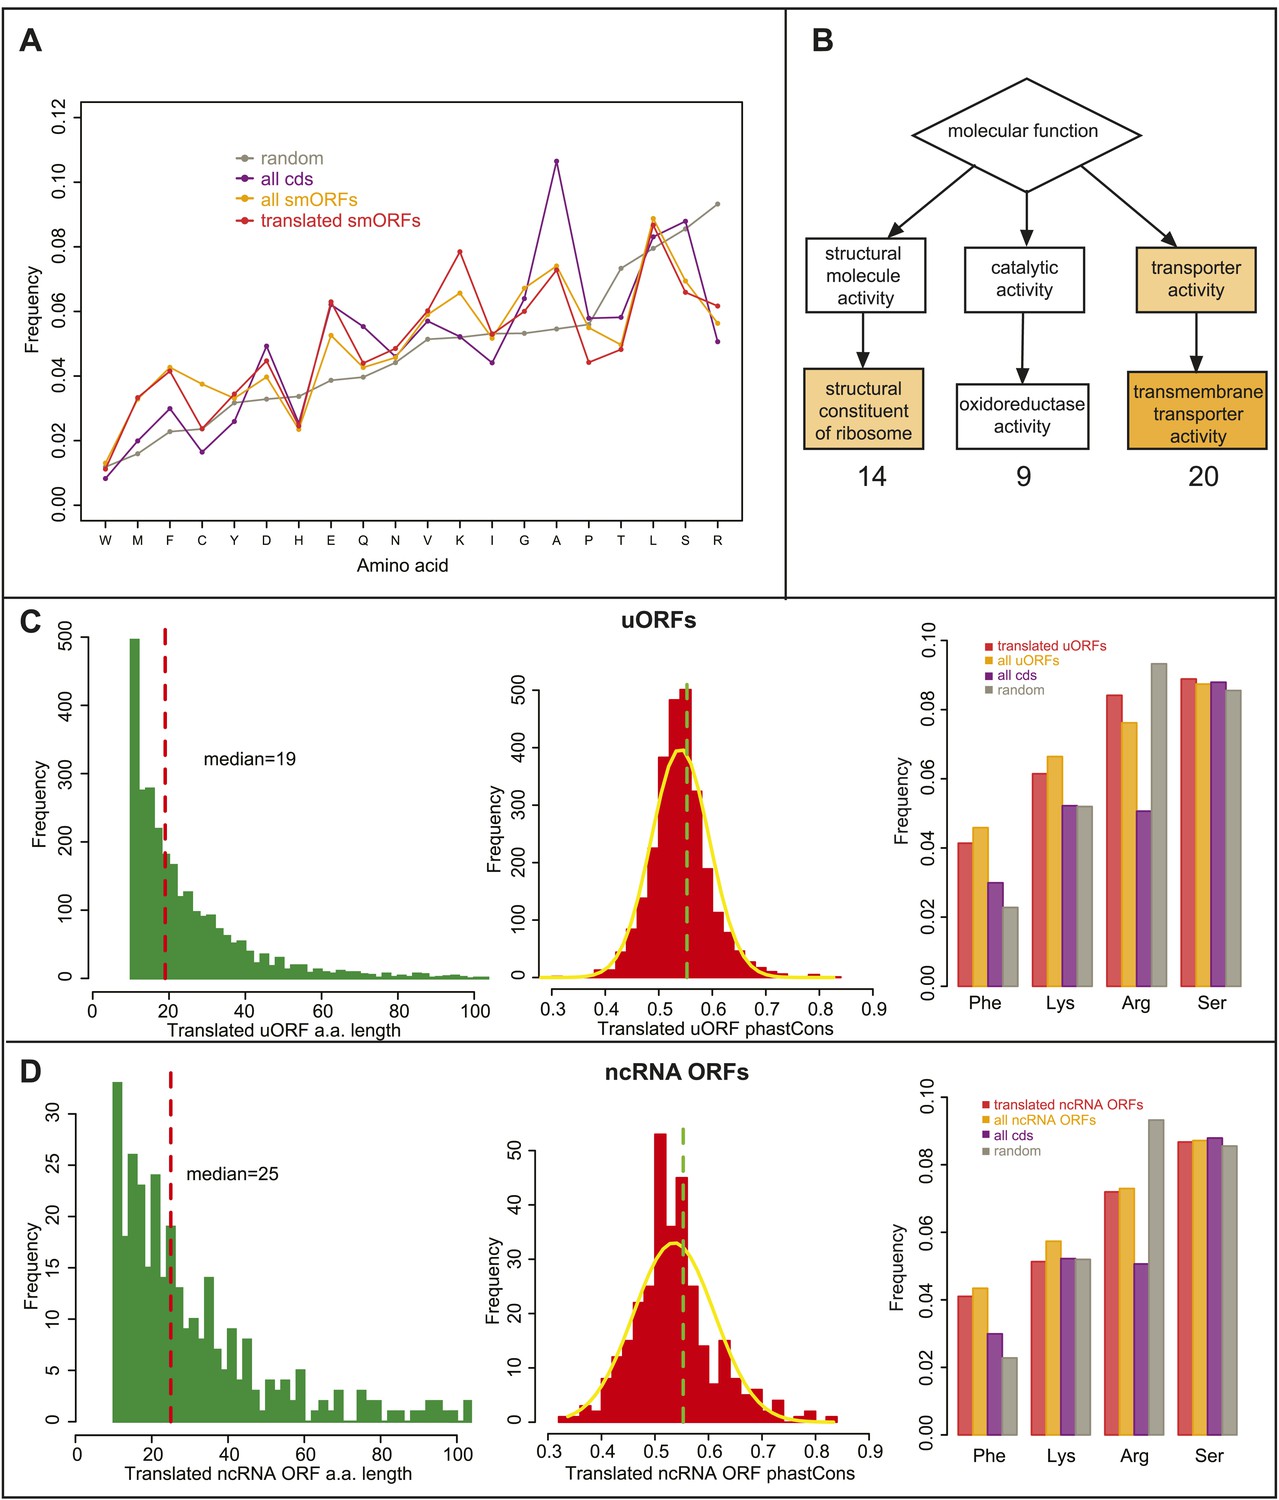
Bioinformatic indicators of smORFs.
(A) Relative abundance of all amino acids in ORFs, (random: grey, all CDS: purple, all annotated smORFs: yellow, and translated annotated smORFs: red). (B) Enrichment of GO molecular function terms (GOrilla) within translated annotated smORFs in S2 cells when compared to translated standard protein-coding ORFs. Main overrepresented terms are structural consitituents of ribosome (p = 3.28E-4), oxidoreductase activity and transmembrane transporter activity (p = 2.77E-5). (C–D) Frequency distribution of peptide lengths, phastCons, and relative abundance of particular amino acids of translated (C) uORFs and (D) ncRNA ORFs. Red dotted lines indicate the median amino acid lengths and green dotted lines indicate the 90th percentile cut-off from phastCons of intergenic regions, 0.55 (Figure 4A).
Tables
Table 1
Annotated smORFs in different organisms
| smORFs | ORFs | % smORFs | |
|---|---|---|---|
| Drosophila | 829 | 21,870 | 3.8 |
| Zebrafish | 854 | 43,148 | 2.0 |
| Mouse | 1131 | 51,745 | 2.2 |
| Human | 1938 | 104,109 | 1.9 |
Table 2
Summary of median TEs
| Median TE | Small polysomes | Large polysomes |
|---|---|---|
| Annotated smORFs | 1.131 | 0.265 |
| standard ORFs | 0.829 | 1.110 |
| 5′-UTR | 0.355 | 0.566 |
| 3′-UTR | 0.162 | 0.196 |
| uORFs | 0.276 | 0.347 |
| ncRNA smORFs | 0.384 | 0.000 |
-
Median translational efficiency for ORFs in small and large polysomal fractions.
Table 3
Summary of tagged annotated smORFs
| Localization | Peptidomic evidence | # aa | RPKM | Coverage | TE | Phast Cons | |
|---|---|---|---|---|---|---|---|
| CG32230 | Mitochondrial | Yes | 83 | 539.2 | 1.00 | 3.05 | 0.54 |
| CG14482 | Mitochondrial | Yes | 57 | 600.0 | 1.00 | 1.09 | 0.72 |
| CG44242 | Mitochondrial | Yes | 70 | 152.9 | 0.97 | 1.75 | 0.66 |
| CG7630 | Mitochondrial | Yes | 90 | 702.2 | 1.00 | 1.05 | 0.64 |
| CG33199 | Mitochondrial | No | 79 | 95.5 | 1.00 | 1.17 | 0.59 |
| CG32582 | Mitochondrial | No | 52 | 16.5 | 0.57 | 2.82 | 0.51 |
| sclA | Other cytoplasmic | NA | 28 | NA | NA | NA | NA |
| CG12384 | Other cytoplasmic | Yes | 96 | 205.6 | 1.00 | 1.37 | 0.71 |
| CG33774 | Other cytoplasmic | No | 40 | 115.3 | 1.00 | 1.13 | 0.73 |
| CG33170 | Other cytoplasmic | No | 71 | 84.2 | 0.84 | 0.75 | 0.60 |
| CG34200 | Limited | Yes | 52 | 331.7 | 1.00 | 1.66 | 0.54 |
| CG32267 | Limited | Yes | 49 | 82.5 | 0.97 | 1.13 | 0.70 |
| CG33155 | Limited | No | 60 | 33.8 | 0.64 | 0.88 | 0.67 |
| tal-B | None | NA | 49 | NA | NA | NA | NA |
-
Details of the Poly-Ribo-Seq and transfection translation assay results for the FLAG-tagged smORFs, with RPKM, coverage and TE values. Previously corroborated smORFs (according to Figure 1A) are in bold. Scl is a positive control and tal-B is a negative control, but both are not endogenously transcribed in S2 cells, hence ‘NA’ Polysomal Ribo-Seq metrics and Peptidomic evidence.
Table 4
Summary of tagged smORFs from non-coding RNAs and uORFs
| smORF | Localization | Peptidomic evidence | # aa | RPKM | Coverage | TE | PhastCons |
|---|---|---|---|---|---|---|---|
| pncr009:3L ORF1 | Other cytoplasmic | No | 21 | 135.7 | 1.00 | 0.29 | 0.44 |
| pncr009:3L ORF2 | Limited | No | 30 | 64.7 | 0.58 | 0.63 | 0.49 |
| pncr009:3L ORF3 | Limited | No | 33 | 47.8 | 0.78 | 0.23 | 0.59 |
| CR30055 ORF1 | Not tested | No | 12 | 15.2 | 0.71 | 1.24 | 0.49 |
| CR30055 ORF2 | Mitochondrial | No | 53 | 26.1 | 0.66 | 0.83 | 0.52 |
| CR30055 ORF3 | Not tested | No | 36 | 54.6 | 0.85 | 2.90 | 0.55 |
| CR30055 ORF4 | Limited | No | 17 | 30.0 | 0.64 | NA | 0.54 |
| CR30055 ORF5 | Limited | No | 56 | 28.0 | 0.85 | 3.7 | 0.55 |
| Uhg2-ORF 1 | None | No | 36 | 10.5 | 0.27 | 0.83 | 0.54 |
| FBtr 0072084_1 | Reticular | No | 14 | 46.8 | 0.76 | 4.35 | 0.52 |
| FBtr 0072210_1 | Other cytoplasmic | No | 13 | 97.7 | 0.92 | 4.34 | 0.48 |
| FBtr 0081720_1 | Limited | No | 11 | 121.3 | 1.00 | 2.39 | 0.55 |
-
Details of the Poly-Ribo-Seq and transfection translation assay results for the FLAG-tagged smORFs translated from non-coding RNAs and uORFs, with RPKM, coverage and TE values.
Additional files
-
Supplementary file 1
(A) Summary of sequencing experiments. Number of reads; from each experiment, that are left after removal of rRNA and tRNA contaminants, that are unique matches and that map to CDS regions of the genome. (B) Summary of smORF embryo RNA-seq data. Number of translated smORFs expressed throughout embryonic stages of Drosophila melanogaster, according to RNAseq data (modENCODE).
- https://doi.org/10.7554/eLife.03528.017
-
Supplementary file 2
Primers used for rRNA depletion.
- https://doi.org/10.7554/eLife.03528.018
-
Supplementary file 3
In house Perl scripts.
- https://doi.org/10.7554/eLife.03528.019
Download links
A two-part list of links to download the article, or parts of the article, in various formats.
Downloads (link to download the article as PDF)
Open citations (links to open the citations from this article in various online reference manager services)
Cite this article (links to download the citations from this article in formats compatible with various reference manager tools)
Extensive translation of small Open Reading Frames revealed by Poly-Ribo-Seq
eLife 3:e03528.
https://doi.org/10.7554/eLife.03528


