Zinc finger protein Zfp335 is required for the formation of the naïve T cell compartment
- Howard Hughes Medical Institute, University of California, San Francisco, United States
- Stanford University, United States
- John Curtin School of Medical Research, Australian National University, Australia
Figures
Figure 1 with 3 supplements

Identification of an ENU mouse mutant with a cell-intrinsic deficiency in peripheral T cells.
(A) Frequency of CD4+ and CD8+ T cells in peripheral blood of 8-week-old heterozygous (blt/+) or homozygous (blt/blt) mice as detected by flow cytometry. Numbers in quadrants indicate mean frequencies ± s.d. (n = 3 mice per genotype). (B) Frequency of total splenic CD4+ and CD8+ T cells (left); percentage of CD4+ T cells with a naïve (CD62LhiCD44lo) or effector (CD62LloCD44hi) phenotype (right). (C) Frequency of major thymocyte subsets (left); proportion of semi-mature (CD62LloCD24hi) and mature (CD62LhiCD24lo) subsets within the CD4SP thymocyte population (right). (D) Absolute number of DN, DP, CD4SP, and CD8SP thymocytes in blt/+ vs blt/blt mice. Semi-mature and mature CD4SP thymocytes were gated as in (C). CD8SP thymocytes were gated as follows: semi-mature (TCRβhiCD62LloCD24int), mature (TCRβhiCD62LhiCD24lo). Mature CD4SP and CD8SP thymocytes are reduced in numbers by approximately 1.8- and 2.3-fold, respectively. (E) Quantification of CD4+ and CD8+ naïve T cells in the spleen, gated as in (B), showing a 4.6-fold and 7.8-fold decrease in CD4+ and CD8+ naïve T cells, respectively. (F) Ratio of blt/blt (CD45.2+) vs wild-type (CD45.1+CD45.2+) cells for splenic NK cells (NK1.1+TCRβ−), DP, semi-mature (semi) and mature (mat) SP thymocytes and naïve splenic T cells from lethally irradiated WT CD45.1+ hosts reconstituted with a 1:1 mix of blt/blt and WT bone marrow cells. Data in (B) and (C) are representative of seven to eight independent experiments with matched blt/+ and blt/blt littermates and are summarized in (D) and (E). Mice were analyzed at 8 to 10 weeks of age (A–E) or 8 to 12 weeks post-reconstitution (F). Each symbol represents an individual mouse; small horizontal lines indicate the mean; n.s, not significant; *p < 0.05 and **p < 0.01 (two-tailed Mann–Whitney test).
Figure 1—figure supplement 1
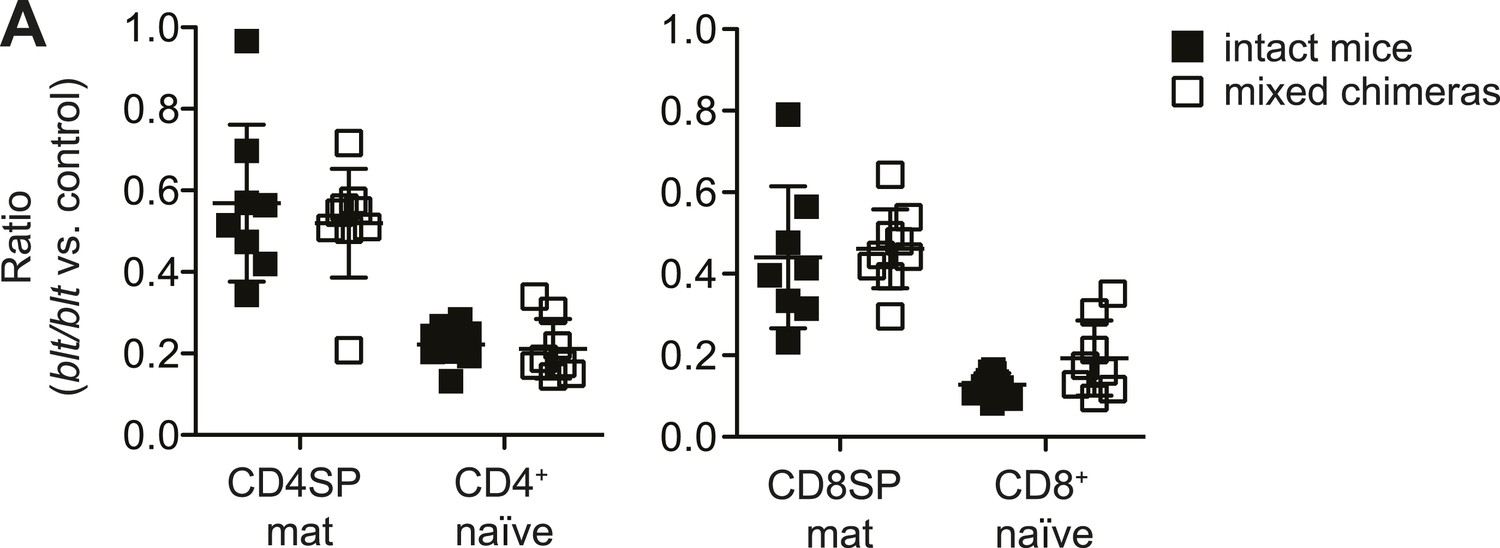
Similar relative decrease in blt/blt T cells in mixed chimeras vs intact mice, indicating the lack of a competitive or rescue effect by WT cells.
(A) Ratio of blt/blt to WT mature SP thymocytes and naïve T cells normalized to the ratio in DP thymocytes from mixed chimeras (open symbols), compared to the ratio of the same subsets between matched pairs of intact mice (filled symbols), based on data reported in Figure 1. (mean ± s.d., n = 9).
Figure 1—figure supplement 2
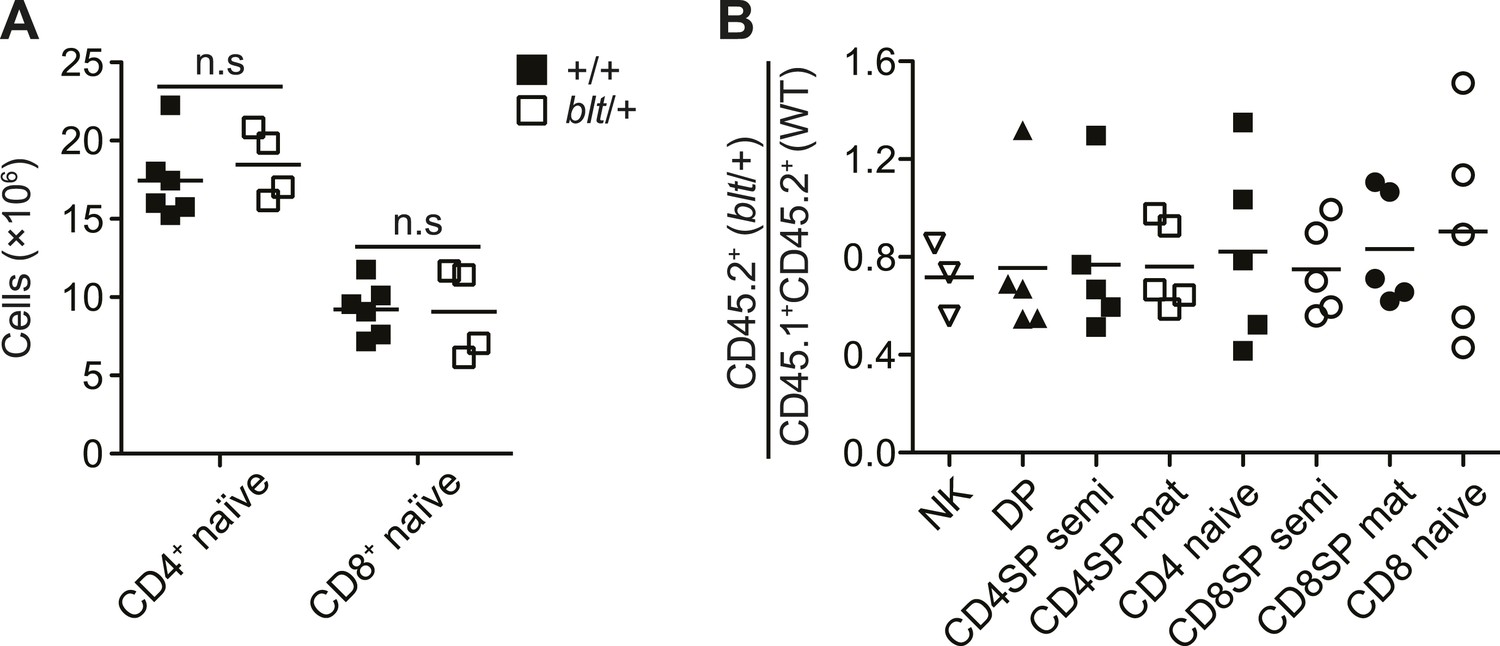
Mice heterozygous for the bloto mutation do not exhibit a T cell phenotype.
(A) Number of CD4+ and CD8+ naïve T cells from spleens of WT (n = 6) and blt/+ (n = 4) mice. (B) Ratio of blt/+ (CD45.2+) vs WT (CD45.1+CD45.2+) cells in splenic NK cells and indicated thymocyte and T cell populations from irradiation chimeras reconstituted with a mix of blt/+ and WT bone marrow as in Figure 1F.
Figure 1—figure supplement 3
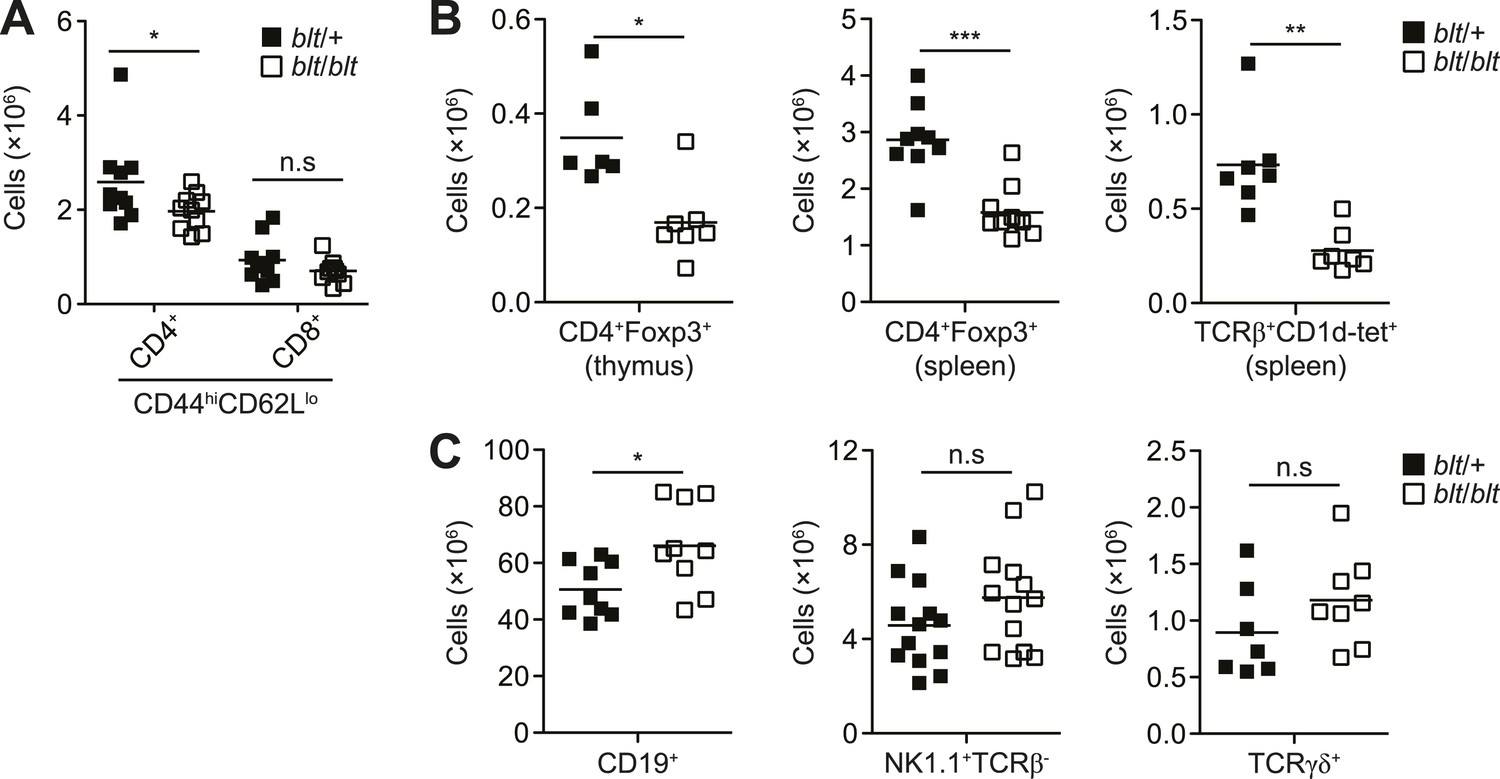
blt/blt mice exhibit a selective defect in αβ T cells.
(A) Number of effector/memory phenotype (CD44hiCD62Llo) CD4+ and CD8+ T cells in the spleen. (B) Number of Foxp3+ CD4SP thymocytes (left), splenic Foxp3+CD4+ Tregs (center), and splenic iNKTs identified by positive CD1d tetramer staining (right). (C) Number of splenic B cells (CD19+; left), NK cells (NK1.1+TCRβ+; center), and γδ T cells (TCRγδ+; right). n.s, not significant; *p < 0.05, **p < 0.01, ***p < 0.001 (two-tailed Mann-Whitney test).
Figure 2 with 2 supplements
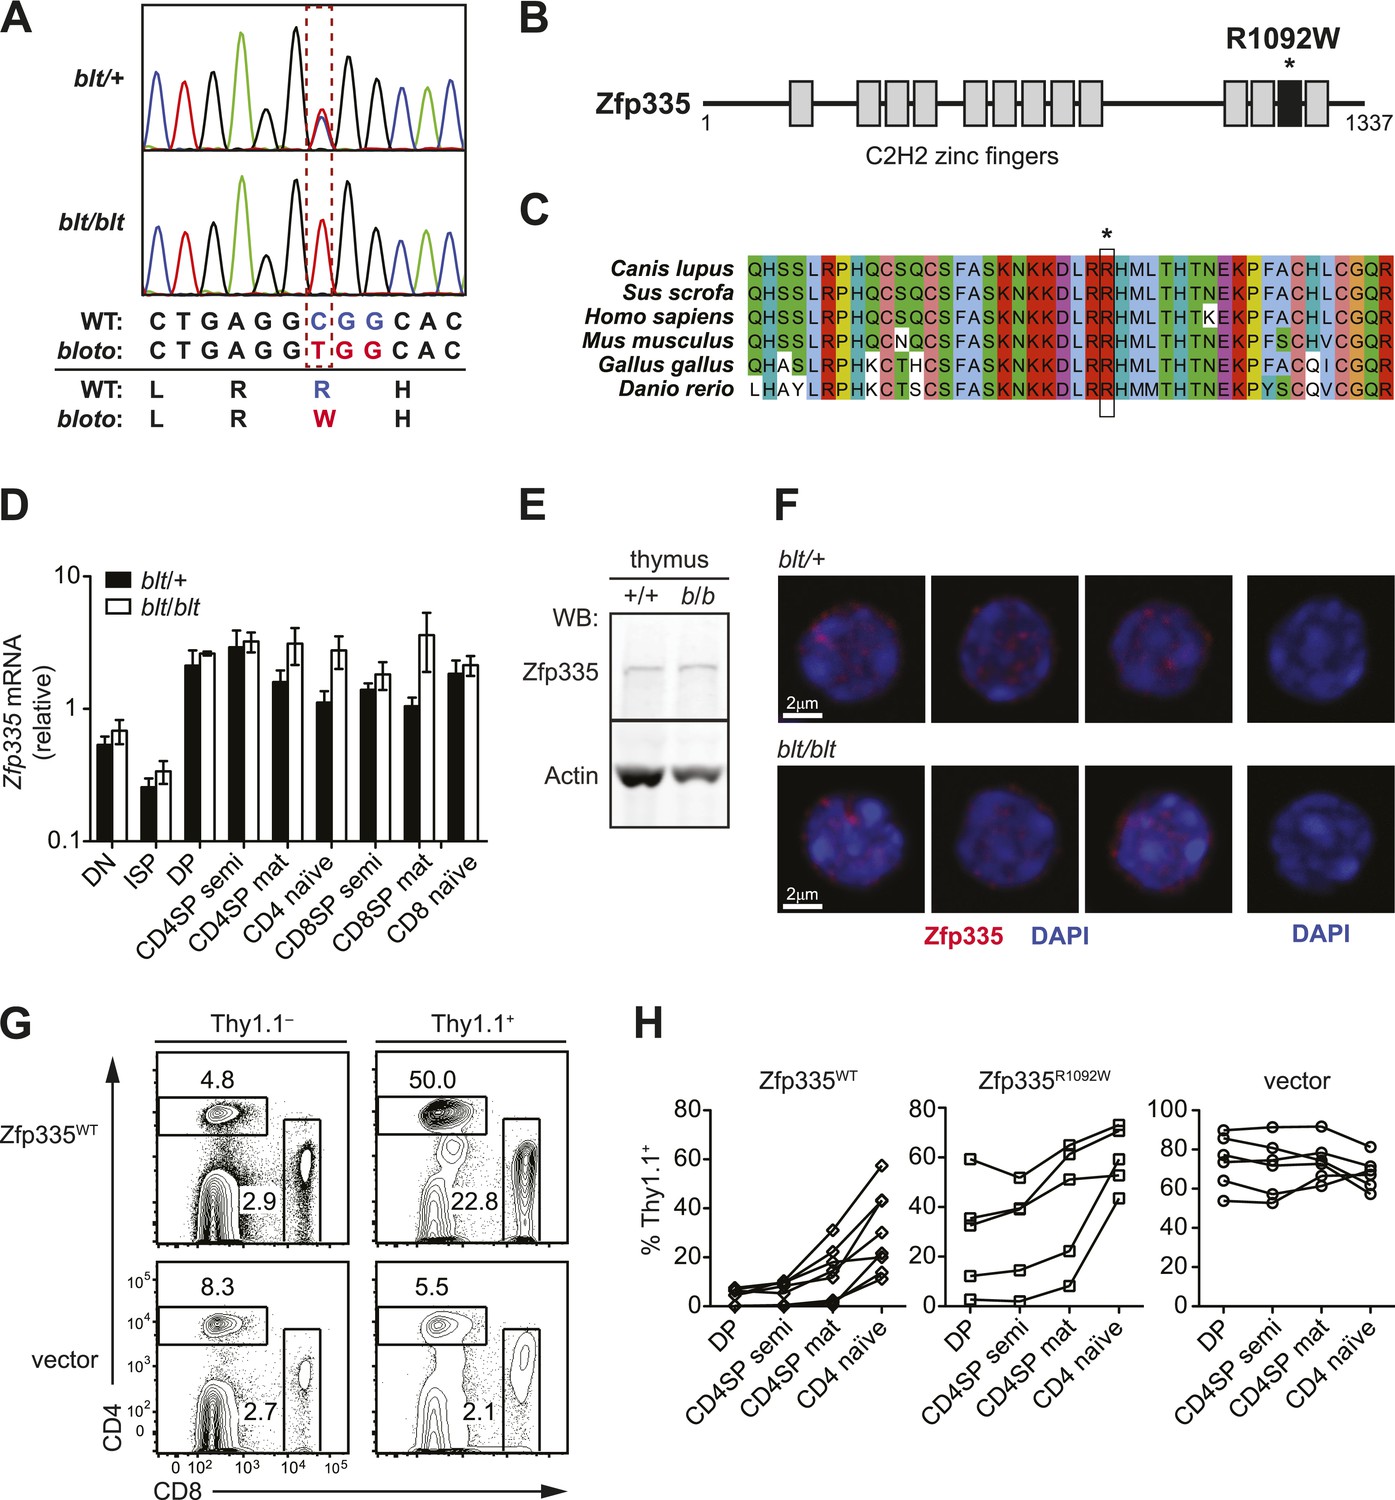
Identification of causative missense mutation within a C2H2 zinc finger of Zfp335.
(A) Sequence trace analysis of the mutated codon in homozygous (blt/blt) compared to heterogygous (blt/+) mice, showing an Arg-to-Trp substitution at position 1092. (B) Linear schematic of the 13 C2H2 zinc finger (ZF) domains (shaded boxes) in Zfp335. Asterisk indicates the R1092W bloto mutation in ZF12 (black box). Diagram drawn to approximate scale. (C) Multiple sequence alignment of predicted Zfp335 orthologs from dog (Canis lupus), pig (Sus scrofa), human (Homo sapiens), mouse (Mus musculus), chicken (Gallus gallus), and zebrafish (Danio rerio). Asterisk indicates Arg residue affected by bloto mutation. Amino acids are colored according to their physicochemical properties. (D) Quantitative RT-PCR analysis of Zfp335 mRNA from indicated FACS-purified thymocyte subsets and naïve T cells (n = 3–4 mice, mean ± s.d. for biological replicates); ISP, immature CD8+ thymocytes identified by tlack of TCRβ expression; results are presented relative to expression of Hprt. (E) Western blot for Zfp335 protein in the thymocytes from wild-type (+/+) and homozygous mutant (b/b) mice, with actin as loading control. (F) Immunofluorescence analysis of Zfp335 nuclear localization in mature CD4SP thymocytes; nucleus counterstained with DAPI. (right) Secondary antibody-only negative staining control. Scale bar: 2 μm. (G) Frequency of CD4+ and CD8+ T cells differentiating from blt/blt hematopoietic stem cells transduced (Thy1.1+) with either wild-type Zfp335 (Zfp335WT) or control MSCV-IRES-Thy1.1 vector, compared to non-transduced (Thy1.1−) cells from the same mouse, 8 to 10 weeks after reconstitution of irradiated hosts. (H) Transduced (Thy1.1+) cells as a percentage of indicated thymocyte and T cell subsets from irradiation chimeras that had received bone marrow retrovirally transduced with WT Zfp335, bloto Zfp335 or control vector. Data points are connected by a separate line for individual mice. Data are representative of three independent experiments.
Figure 2—figure supplement 1
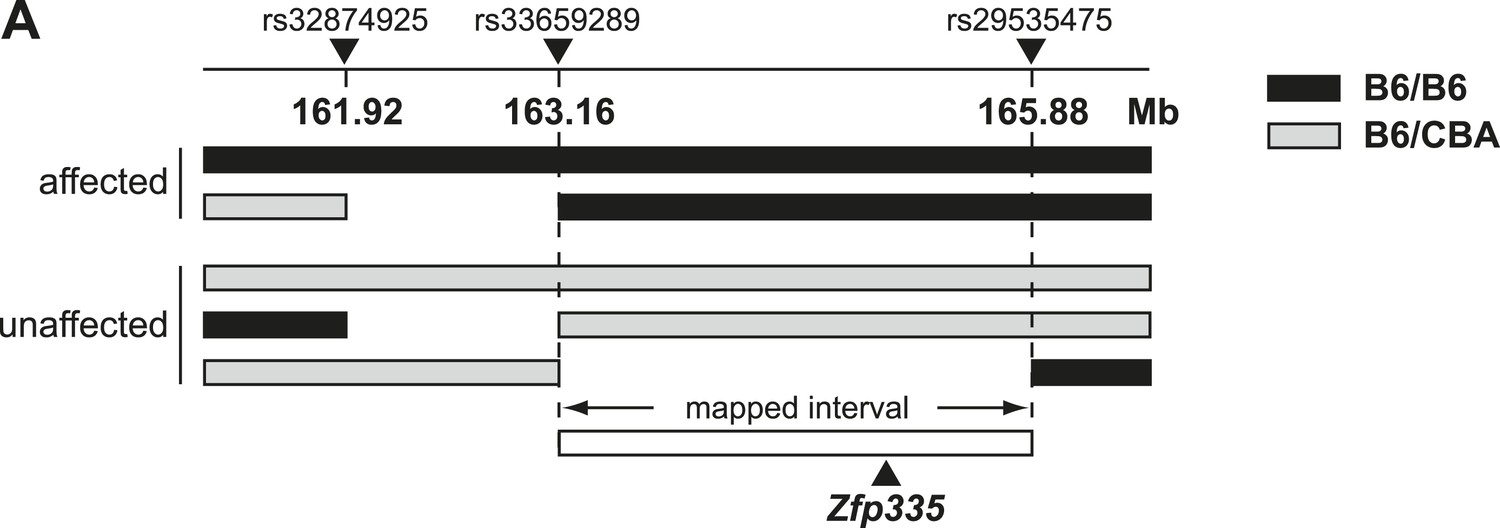
Linkage mapping of bloto mutation to a 2.72 Mb region on chromosome 2 containing Zfp335.
(A) Black bars represent B6 homozygosity and gray bars represent B6/CBA heterozygosity as determined by SNP analysis. Data from two affected and three unaffected F2 progeny shown.
Figure 2—figure supplement 2
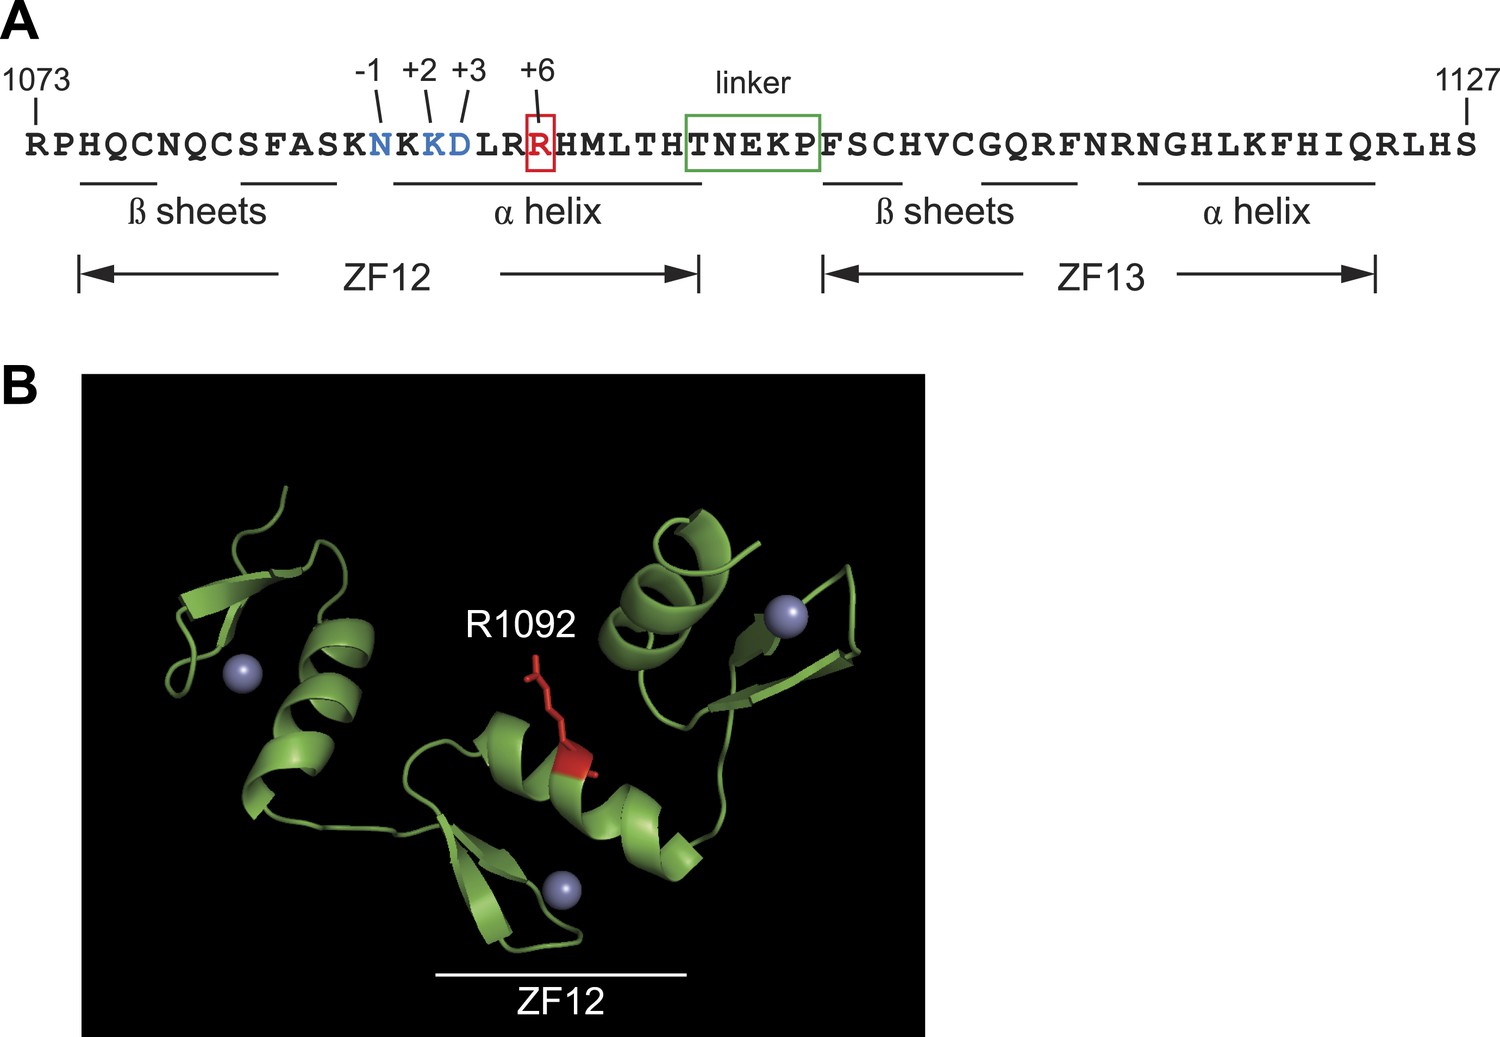
Protein sequence analysis and structural modeling of mutated C2H2 zinc finger in Zfp335.
(A) Amino acid sequence of ZF12 and ZF13 (1073–1127 a.a). Positions −1, +2, +3, and +6, which are thought to mediate base recognition in DNA-binding C2H2 zinc fingers, are indicated for ZF12. R1092 (red); canonical C2H2 linker (green box). (B) Structural model of three zinc fingers near the C-terminus of Zfp335 (1044–1126 a.a). The mutated Arg residue is highlighted in red; gray spheres represent zinc ions coordinated within the zinc finger fold.
Figure 3 with 1 supplement
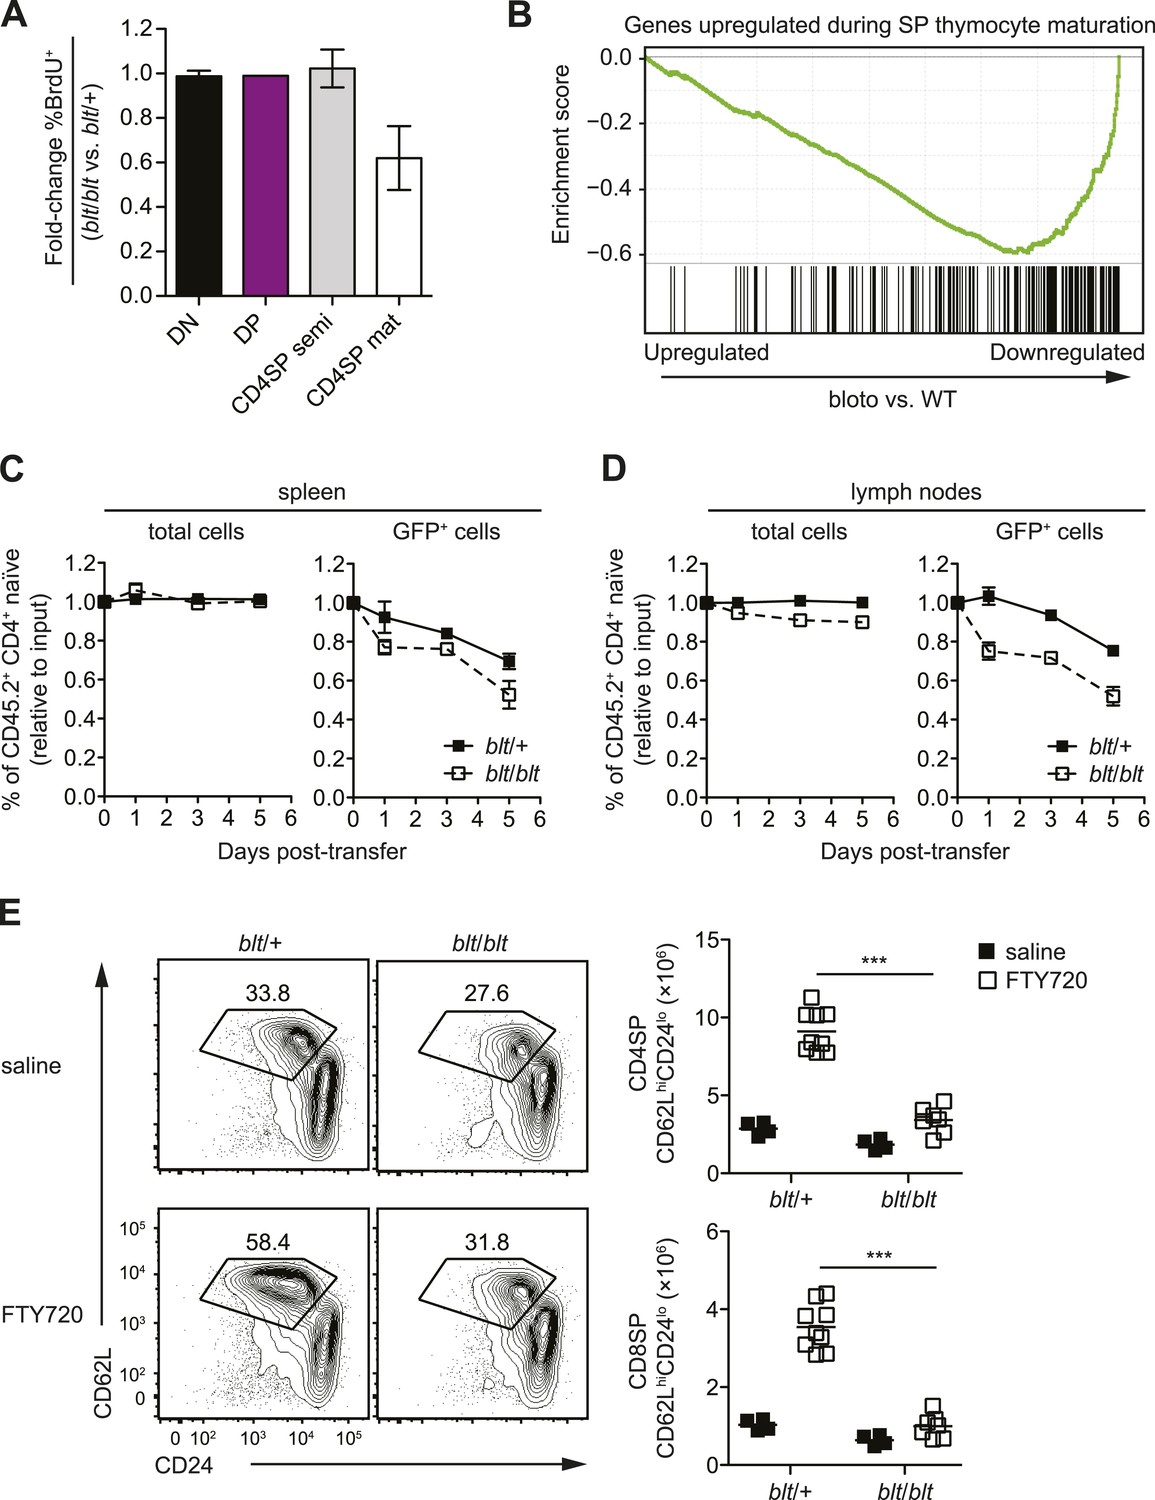
Zfp335R1092W-induced T cell dysregulation affects mainly mature SP thymocytes and recent thymic emigrants.
(A) Percentage of BrdU+ cells in indicated thymocyte populations from blt/blt mice relative to blt/+ controls after 4 days of continuous BrdU labeling (mean ± s.d., n = 4). (B) Gene set enrichment analysis (GSEA) analysis of gene expression data from blt/blt vs WT mature CD4SP thymocytes showing significant negative correlation with genes known to be upregulated during SP thymocyte maturation (MSigDB gene set: GSE30083). (C and D) Input-normalized fraction of total (left panel) or GFP+ (right panel) Rag1-GFP blt/+ and Rag1-GFP blt/blt cells within the total CD45.2+ CD4+ naïve donor population recovered from recipient spleens (C) and peripheral lymph nodes (D) at indicated time points after co–transfer with control CD45.2+ blt/+ cells. (E) Flow cytometry analysis of CD4SP cells in the thymus of blt/blt mice and blt/+ controls after 4 days of FTY720 or saline treatment. Percentage of cells in mature SP (CD62LhiCD24lo) gate shown. Results are quantified (right) for CD4SP and CD8SP thymocytes. ***p < 0.001 (two-tailed Mann–Whitney test), data pooled from four independent experiments.
Figure 3—figure supplement 1
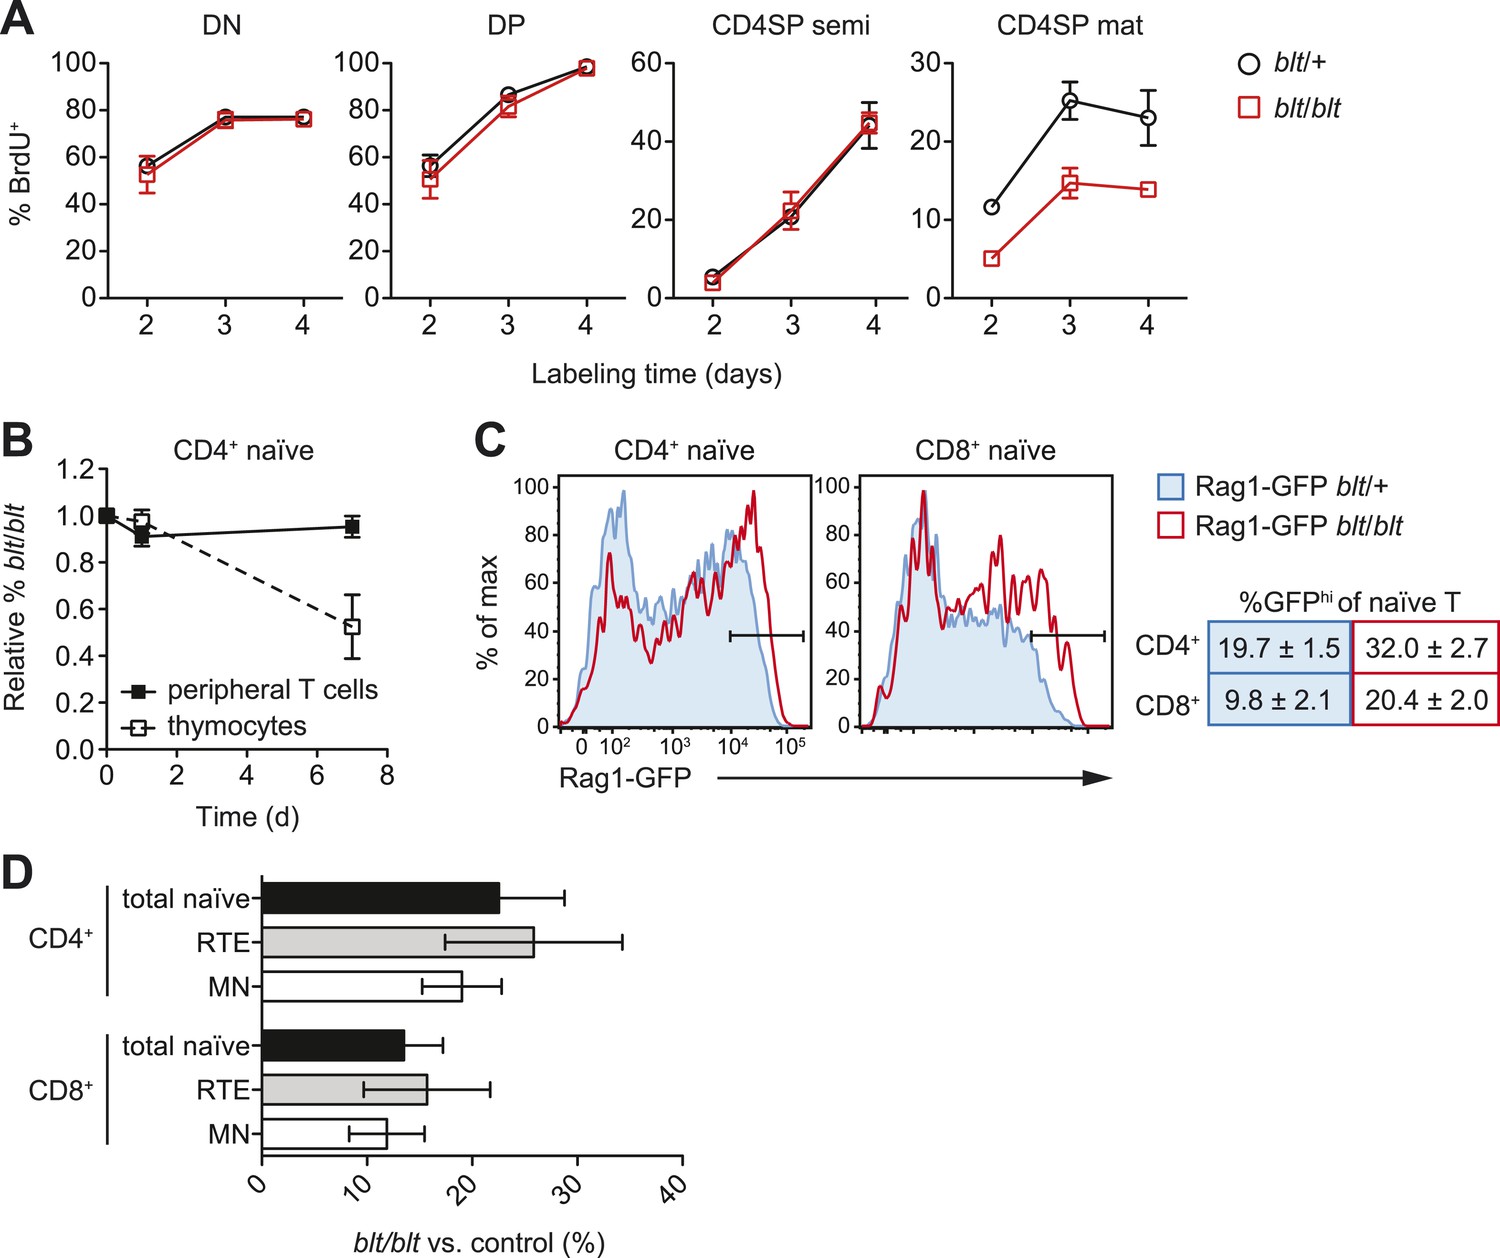
Impaired late-stage SP thymocyte development and early post-thymic peripheral T cell maturation in blt/blt mice.
(A) Turnover of DN, DP, semi-mature, and mature CD4SP thymocytes assessed after 2–4 days of continuous in vivo BrdU labeling (mean ± s.d., n = 4). (B) Input-normalized fraction of donor CD45.2+ CD4+CD62LhiCD44lo naïve T cells (closed symbols) or CD4SP thymocytes (open symbols) that were blt/blt, recovered from spleen at indicated time points after transfer of blt/blt and control peripheral lymphocytes or thymocytes to lymphoreplete CD45.1+ hosts (mean ± s.d., n = 2–4). (C) (left) GFP signal in CD62LhiCD44lo CD4+ and CD8+ T cells from spleen of Rag1-GFP transgenic blt/+ vs. blt/blt mice. (right) Percentage of GFPhi naïve T cells, gated as shown in histograms (mean ± s.d., n = 6–8). (D) Percentage of total naïve T cells, GFPhi RTEs and GFPlo mature naïve (MN) T cells from spleens of blt/blt mice relative to matched blt/+ littermate controls. Data obtained from mice analyzed between 7 to 10 weeks of age (mean ± s.d., n = 10).
Figure 4 with 3 supplements
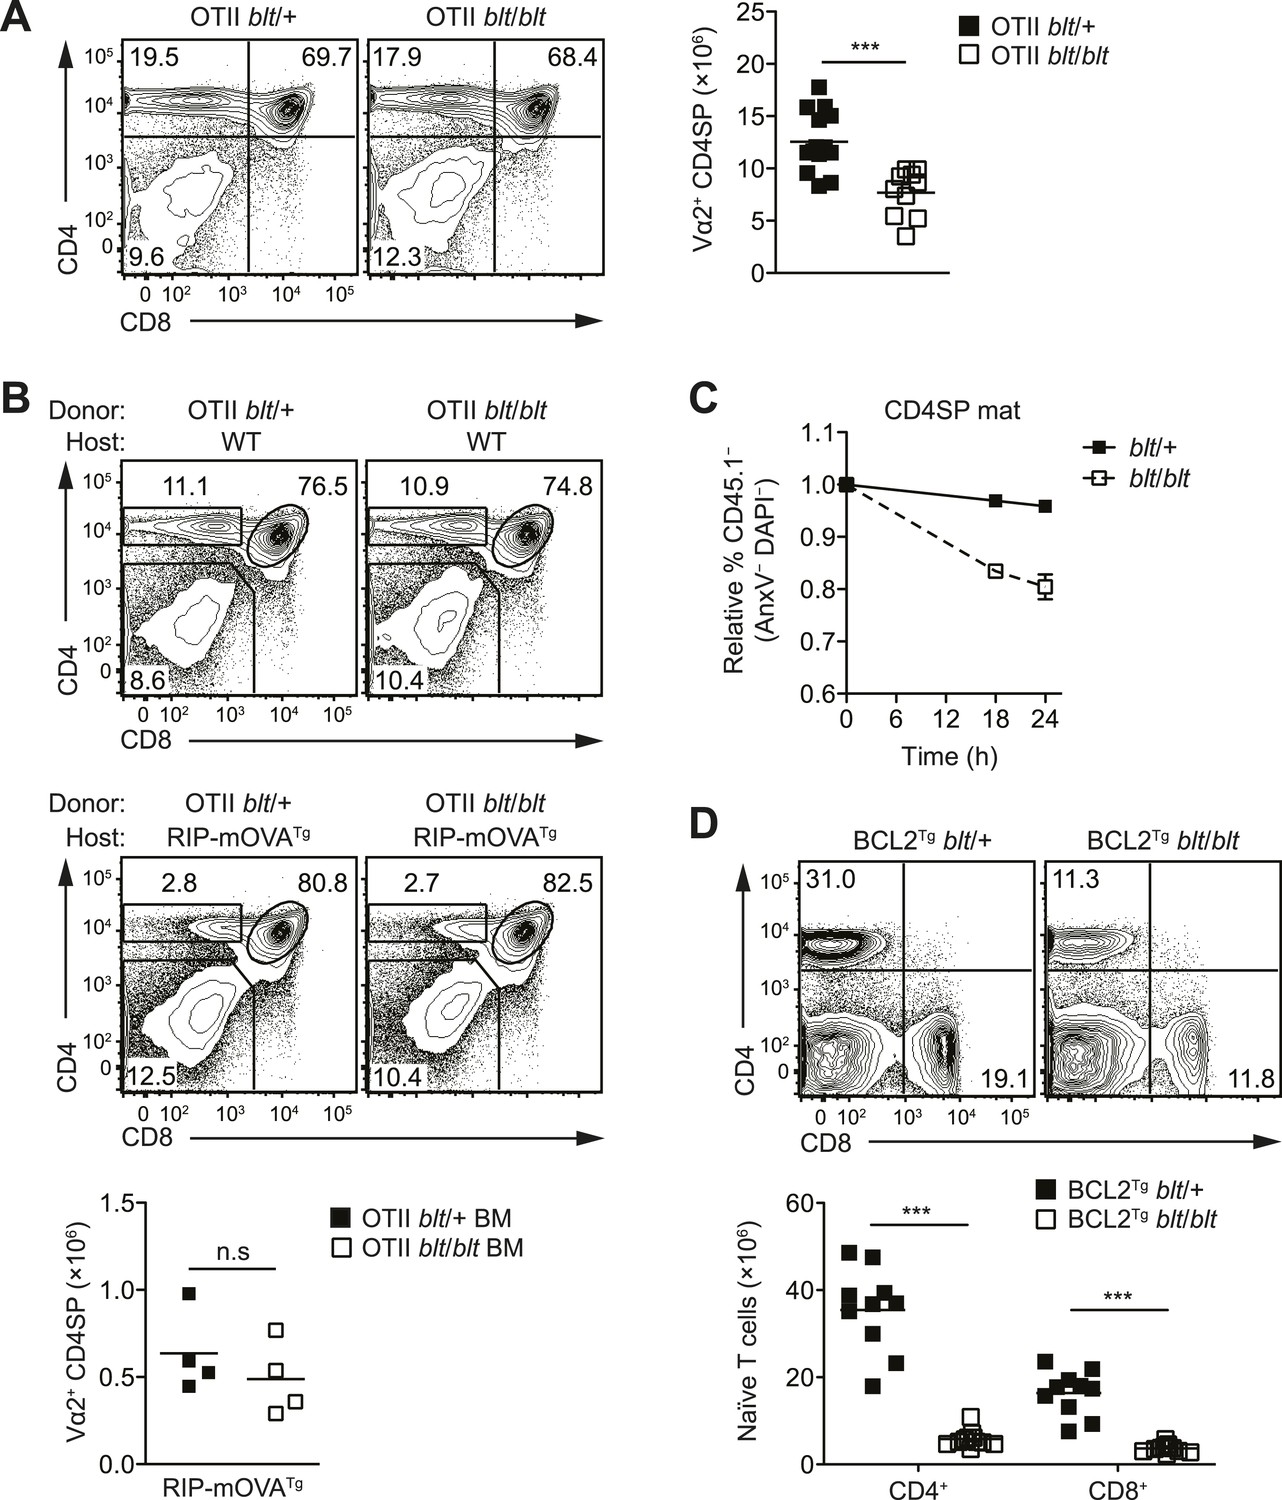
The T cell maturation defect in blt/blt mice is not caused by altered thymic selection or Bcl2-dependent survival.
(A) Flow cytometry analysis of major thymocyte populations from OTII TCR transgenic blt/+ and blt/blt mice, gated on total live thymocytes (left); quantification of OTII TCR-expressing Vα2+ CD4SP thymocytes from OTII blt/+ (n = 14) and OTII blt/blt (n = 14) mice (right). (B) Frequency of thymocyte subsets in lethally irradiated WT B6 (top left) or RIP-mOVATg (bottom left) recipients reconstituted with T cell-depleted bone marrow from OTII blt/+ and OTII blt/blt mice; quantification of Vα2+ CD4SP thymocytes from indicated RIP-mOVATg chimeric mice (right). (C) In vitro viability of sorted CD45.1− blt/+ vs blt/blt semi-mature (left) and mature (right) CD4SP thymocytes co-cultured with CD45.1+ WT CD4SP thymocytes. Live cells were pre-gated as annexin V− DAPI− and percentage of CD45.1− cells was normalized to input. (D) Frequency of CD4+ and CD8+ T cells in the spleen of blt/+ vs blt/blt mice expressing a human BCL2 transgene (BCL2Tg) under the control of the proximal Lck promoter (left); quantification of naïve T cells from BCL2Tg blt/+ (n = 10), and BCL2Tg blt/blt (n = 10) mice (right). Data representative of eight (A), three (B), two (C), and six (D) independent experiments; n.s, not significant, ***p < 0.001 (two-tailed Mann–Whitney test).
Figure 4—figure supplement 1
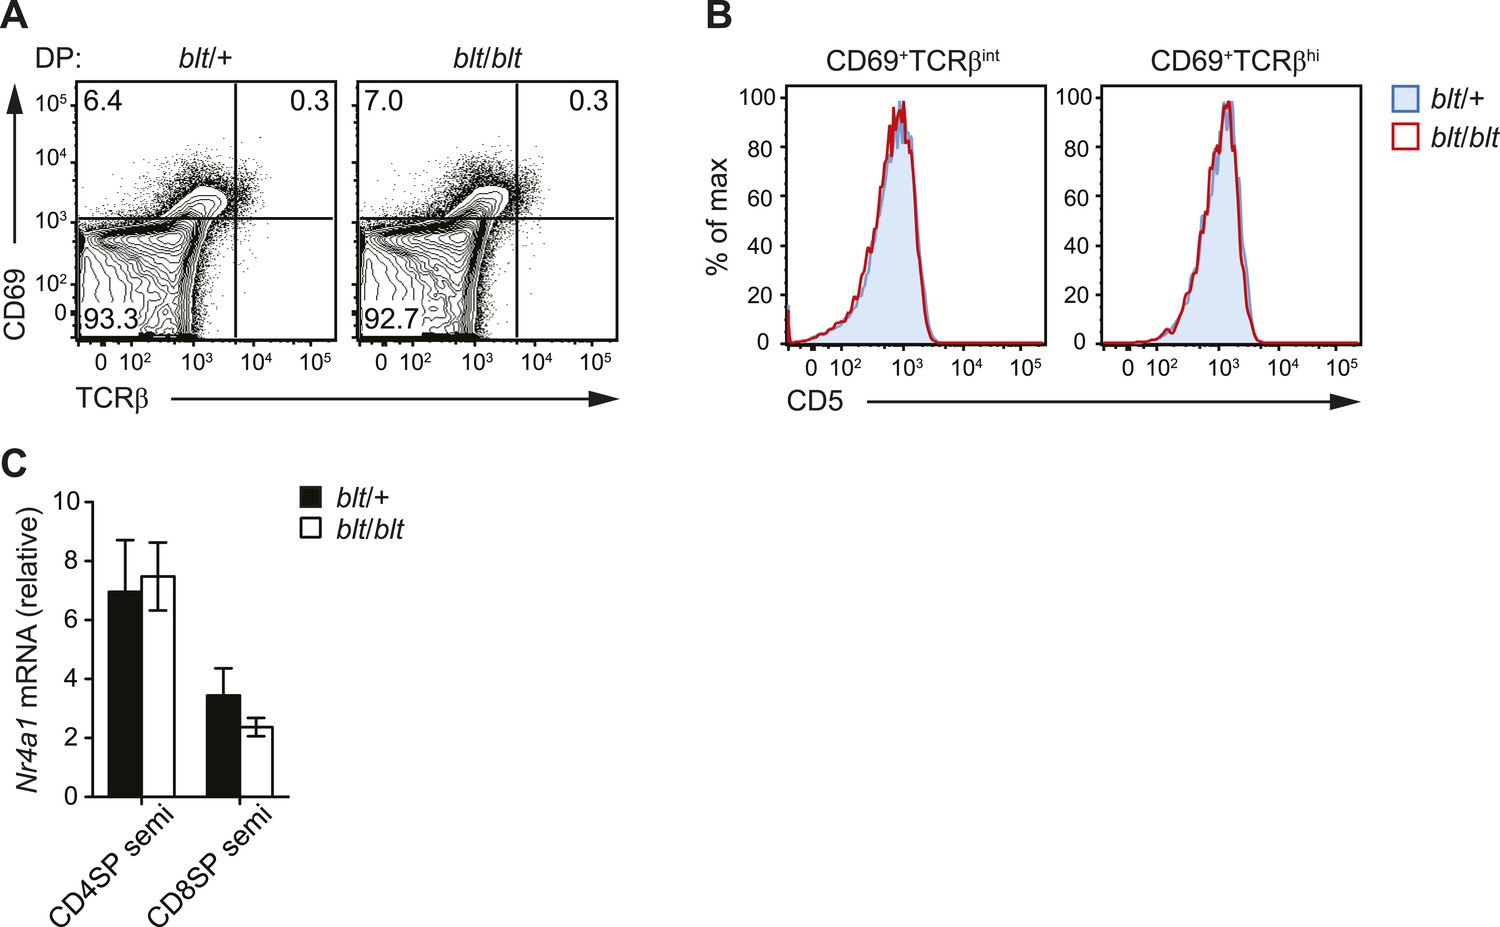
blt/blt mice exhibit intact positive and negative selection in the thymus.
(A) Surface expression of CD69 and TCRβ on DP thymocytes from blt/+ and blt/blt mice with a polyclonal TCR repertoire. Positively selected DP thymocytes are CD69hiTCRβint. (B) CD5 surface expression on CD69hiTCRβint and CD69hiTCRβint post-positive selection populations, gated on total live thymocytes. (C) Quantitative RT-PCR analysis of Nr4a1 (Nur77) mRNA in FACS-purified CD4 and CD8 semi-mature SP thymocytes (mean ± s.d., n = 3).
Figure 4—figure supplement 2
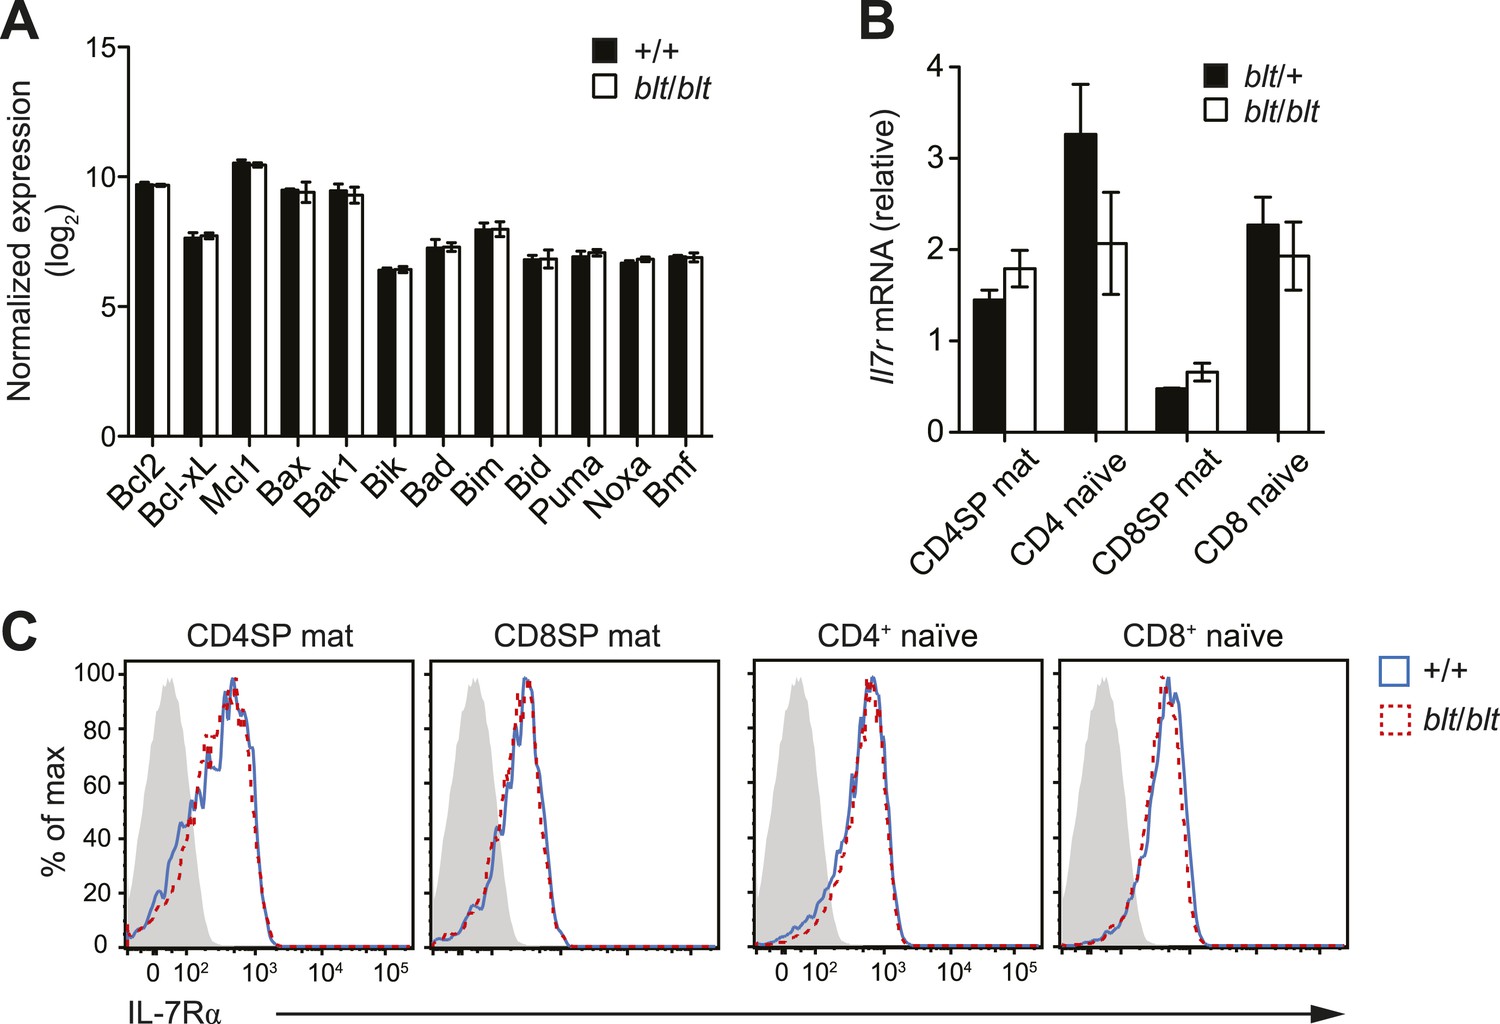
Normal expression of IL-7 receptor and Bcl2 family members.
(A) Normalized expression levels of indicated Bcl2 family genes from Affymetrix array analysis of mRNA from sorted WT and blt/blt mature CD4SP thymocytes (mean ± s.d., n = 3). (B) Quantitative RT-PCR analysis of Il7r transcript in FACS-purified mature SP thymocytes and naïve T cells (mean ± s.d., n = 3). (C) Surface expression of IL-7Rα on WT (CD45.1+CD45.2+) and blt/blt (CD45.2+) mature SP thymocytes and naïve T cells from mixed chimeras. Data are representative of eight mice.
Figure 4—figure supplement 3
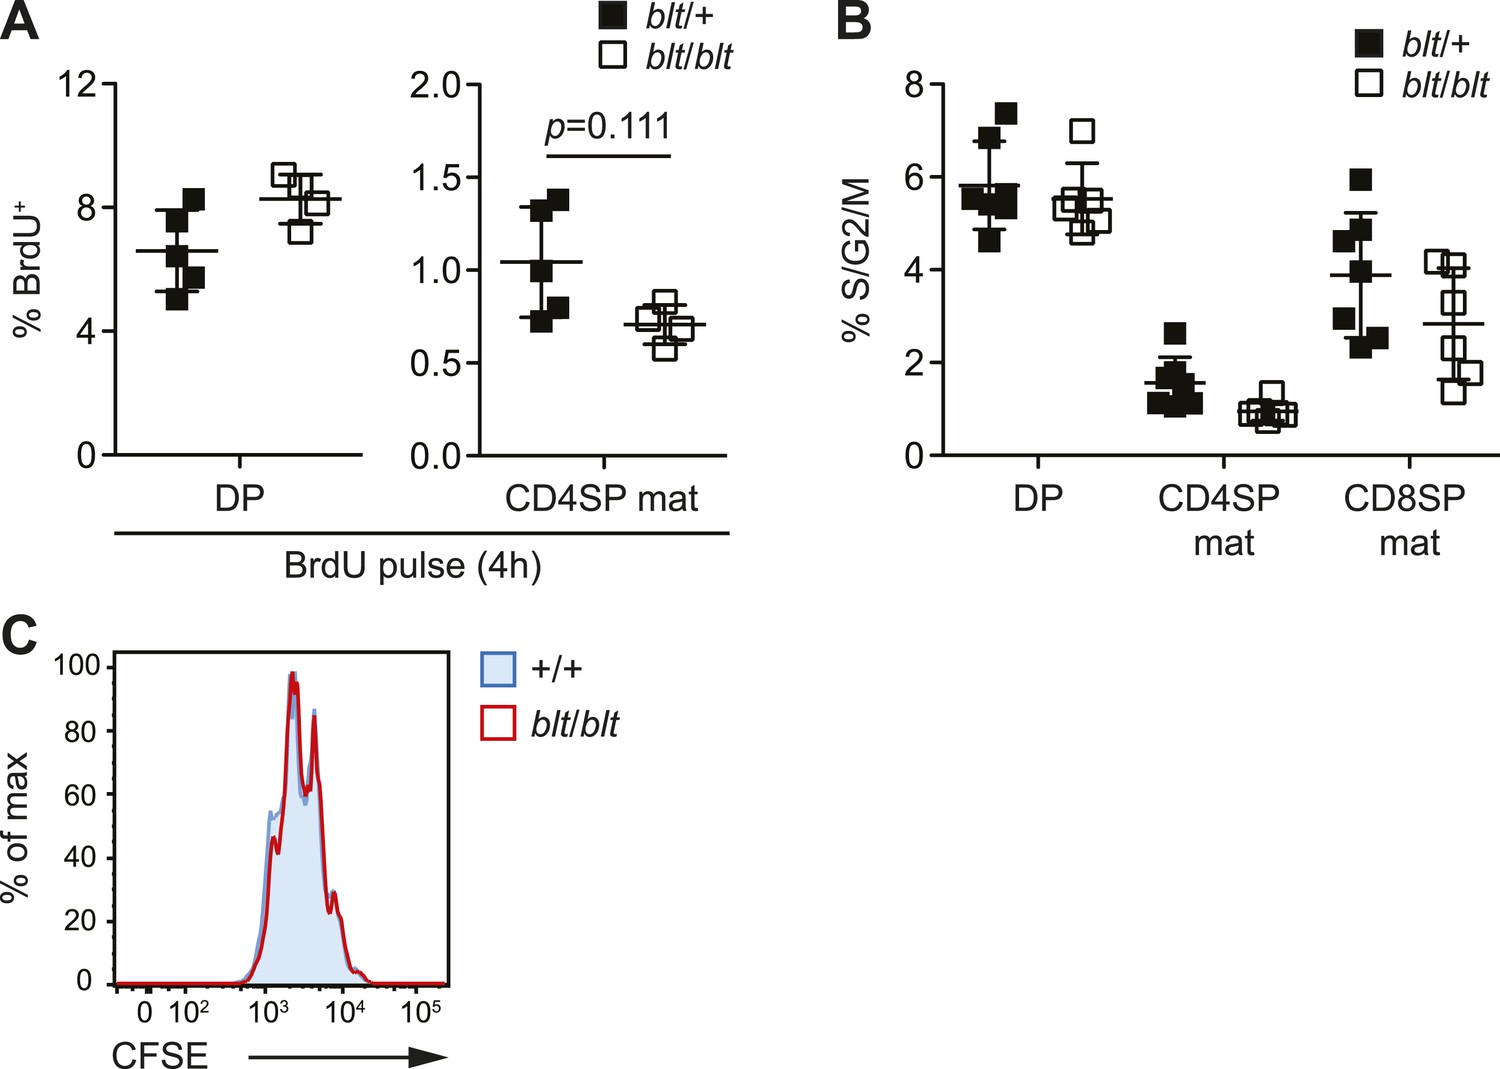
blt/blt naïve T cells proliferate normally in response to TCR stimulation in vitro and show no significant reduction in cycling of mature SP thymocytes.
(A) BrdU labeling of DP and mature CD4SP thymocytes from blt/+ (n = 5) and blt/blt (n = 4) mice after a 4 h pulse (mean ± s.d., two-tailed Mann-Whitney test). (B) Percentage of indicated thymocyte subsets in S/G2/M phases of the cell cycle, as defined by >2n DNA content. Data pooled from three independent experiments (mean ± s.d., n = 6–7). (C) Analysis of CFSE dilution by congenically marked WT and blt/blt CD4+ naïve T cells in mixed culture, after 3 days of stimulation with plate-bound αCD3 and αCD28. Data are representative of two independent experiments.
Figure 5
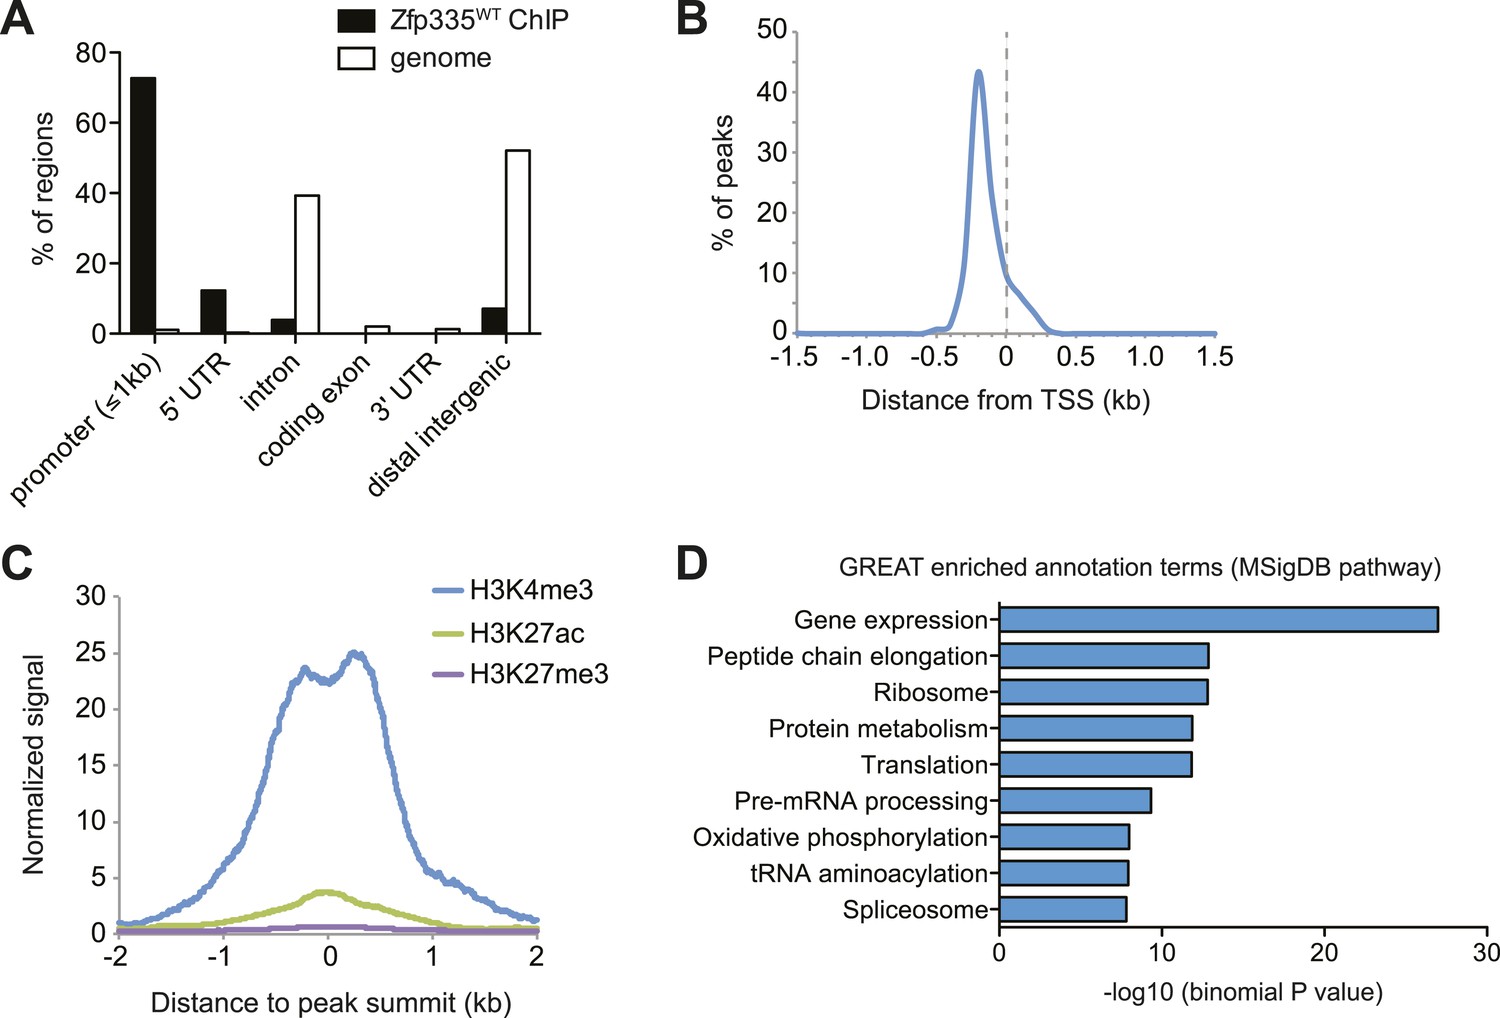
Genome-wide analysis of Zfp335 binding sites in wild-type thymocytes based on ChIP-seq using an antibody against the C-terminus of Zfp335.
(A) Genomic feature annotation of Zfp335 peaks reveals strong enrichment in promoter regions (≤1 kb upstream of TSS) and 5ʹ UTRs relative to genomic background. (B) Average profile of peak center distances from nearest RefSeq TSS for 141 Zfp335 peaks located within ±1.5 kb of a TSS, showing a positional preference for binding upstream of the TSS. (C) Average density of H3K4me3 (blue), H3K27ac (green) and H3K27me3 (purple) marks for a region from −2 kb to +2 kb relative to Zfp335 peak summits, based on ENCODE histone modification ChIP-seq data for murine whole thymus. (D) Gene ontology analysis of genes associated with Zfp335 binding sites using GREAT. Top enriched annotation terms in the MSigDB pathway ontology are shown.
Figure 6 with 1 supplement
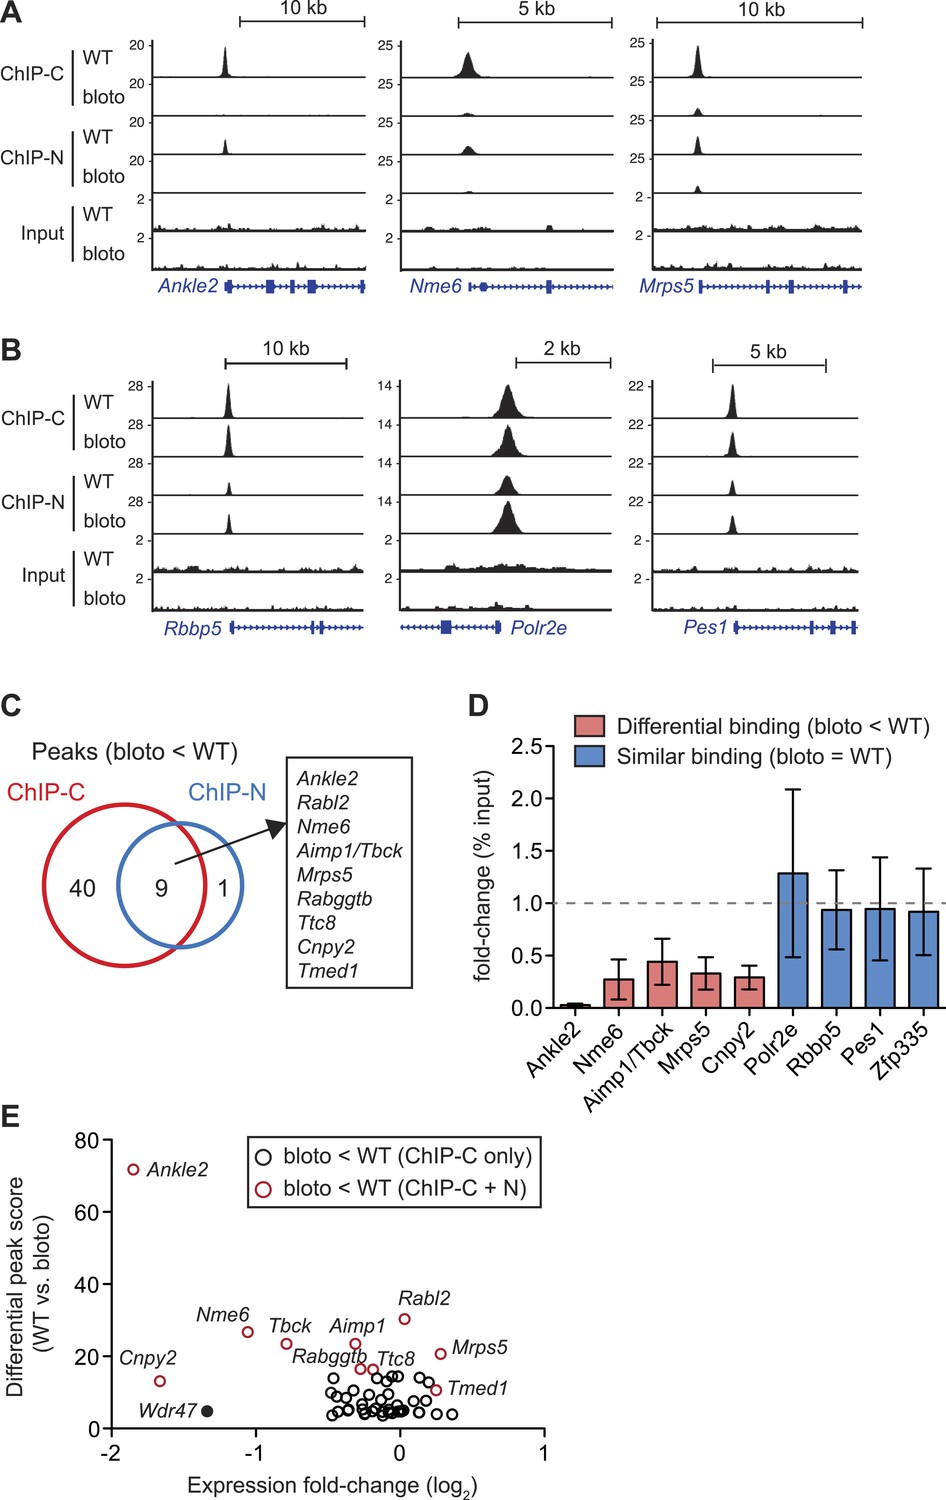
Decreased Zfp335 binding in blt/blt thymocytes is detected for a subset of target genes.
(A) Signal tracks showing Zfp335 occupancy at three target genes (Ankle2, Nme6, Mrps5) for which significantly decreased binding in blt/blt relative to WT thymocytes is observed using both the C-terminus-specific antibody (ChIP-C) and the N-terminus-specific antibody (ChIP-N). Vertical axis, fragment pileup per million reads (normalized to library sequencing depth). Input, sequencing of input genomic DNA (background control). (B) Signal tracks showing Zfp335 occupancy at three target genes (Rbbp5, Polr2e, Pes1) for which no reduction in binding is detected in blt/blt thymocytes. (C) Identification of nine putative differentially bound target sites and their ten associated genes from the intersection of differential peaks (bloto < WT) called for both ChIP-C and ChIP-N data sets. We consider Aimp1 and Tbck to be associated with a single peak as they share a bidirectional promoter. (D) ChIP-qPCR analysis of Zfp335 binding at selected targets to validate ChIP-seq-based assessment of differential binding in blt/blt thymocytes. ChIP enrichment was calculated as percent input; results are presented as the fold-change in ChIP enrichment for blt/blt vs WT (mean ± s.d., n = 3 for three independent experiments). (E) Relative Zfp335 binding and gene expression changes for target genes associated with the ChIP-C set of differentially bound regions: horizontal axis, expression fold-change (log2) values from microarray analysis of blt/blt vs WT mature CD4SP thymocytes; vertical axis, score reflecting likelihood that Zfp335 binding is significantly enriched in WT relative to blt/blt thymocytes. Red circles, target genes identified as differentially bound in both ChIP-C and ChIP-N data sets (Figure 6C); black circles, target genes associated with reduced Zfp335 binding in the ChIP-C but not ChIP-N data set. Wdr47 is highlighted (filled black circle) as a target gene that was identified as differentially bound only in the ChIP-C data set (Figure 6—figure supplement 1C,D) but showed significantly downregulated expression in blt/blt thymocytes (Figure 6—figure supplement 1B,E).
Figure 6—figure supplement 1
Analysis of correlation between changes in Zfp335 binding and gene expression in blt/blt thymocytes.
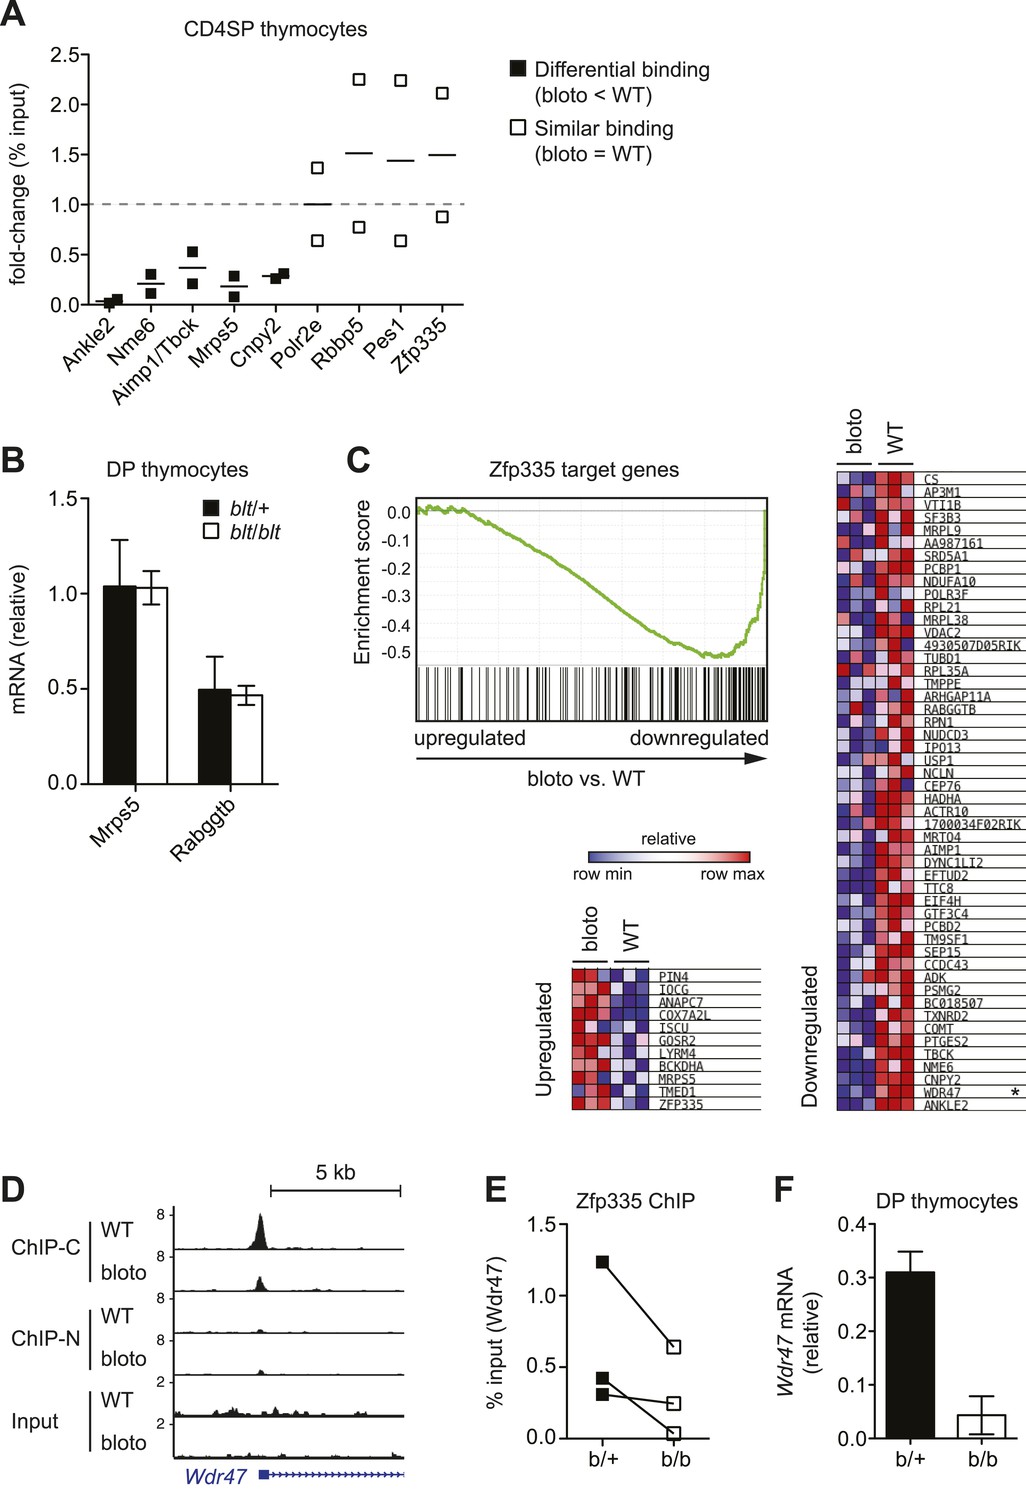
(A) ChIP-qPCR analysis of Zfp335 binding at selected targets in sorted CD4SP thymocytes. ChIP enrichment was calculated as percent input; results are presented as the fold-change in ChIP enrichment for blt/blt vs WT for two biological replicates. (B) Quantitative RT-PCR analysis of Mrps5 and Rabggtb mRNA in sorted DP thymocytes (mean ± s.d., n = 3). (C) GSEA plot comparing expression values of Zfp335 target genes (TSS within ±1 kb of a Zfp335 peak) in blt/blt vs WT mature CD4SP thymocytes (left). Heatmaps depicting relative expression of the top 50 downregulated (right) and top 11 upregulated (bottom left) target genes; Wdr47 is marked with an asterisk. (D) ChIP-seq signal tracks showing Zfp335 occupancy at Wdr47, a target gene for which reduced Zfp335 binding is detected in the ChIP-C but not ChIP-N data set. (E) ChIP-qPCR confirmation of reduced Zfp335 binding to the Wdr47 promoter. Antibody used was specific for C-terminal epitope of Zfp335. ChIP enrichment represented as % input; matched data points for blt/+ (filled symbols) vs blt/blt (open symbols) thymocytes from three independent ChIP experiments shown. (F) Quantitative RT-PCR analysis of Wdr47 mRNA in sorted DP thymocytes (mean ± s.d., n = 2–3).
Figure 7 with 1 supplement
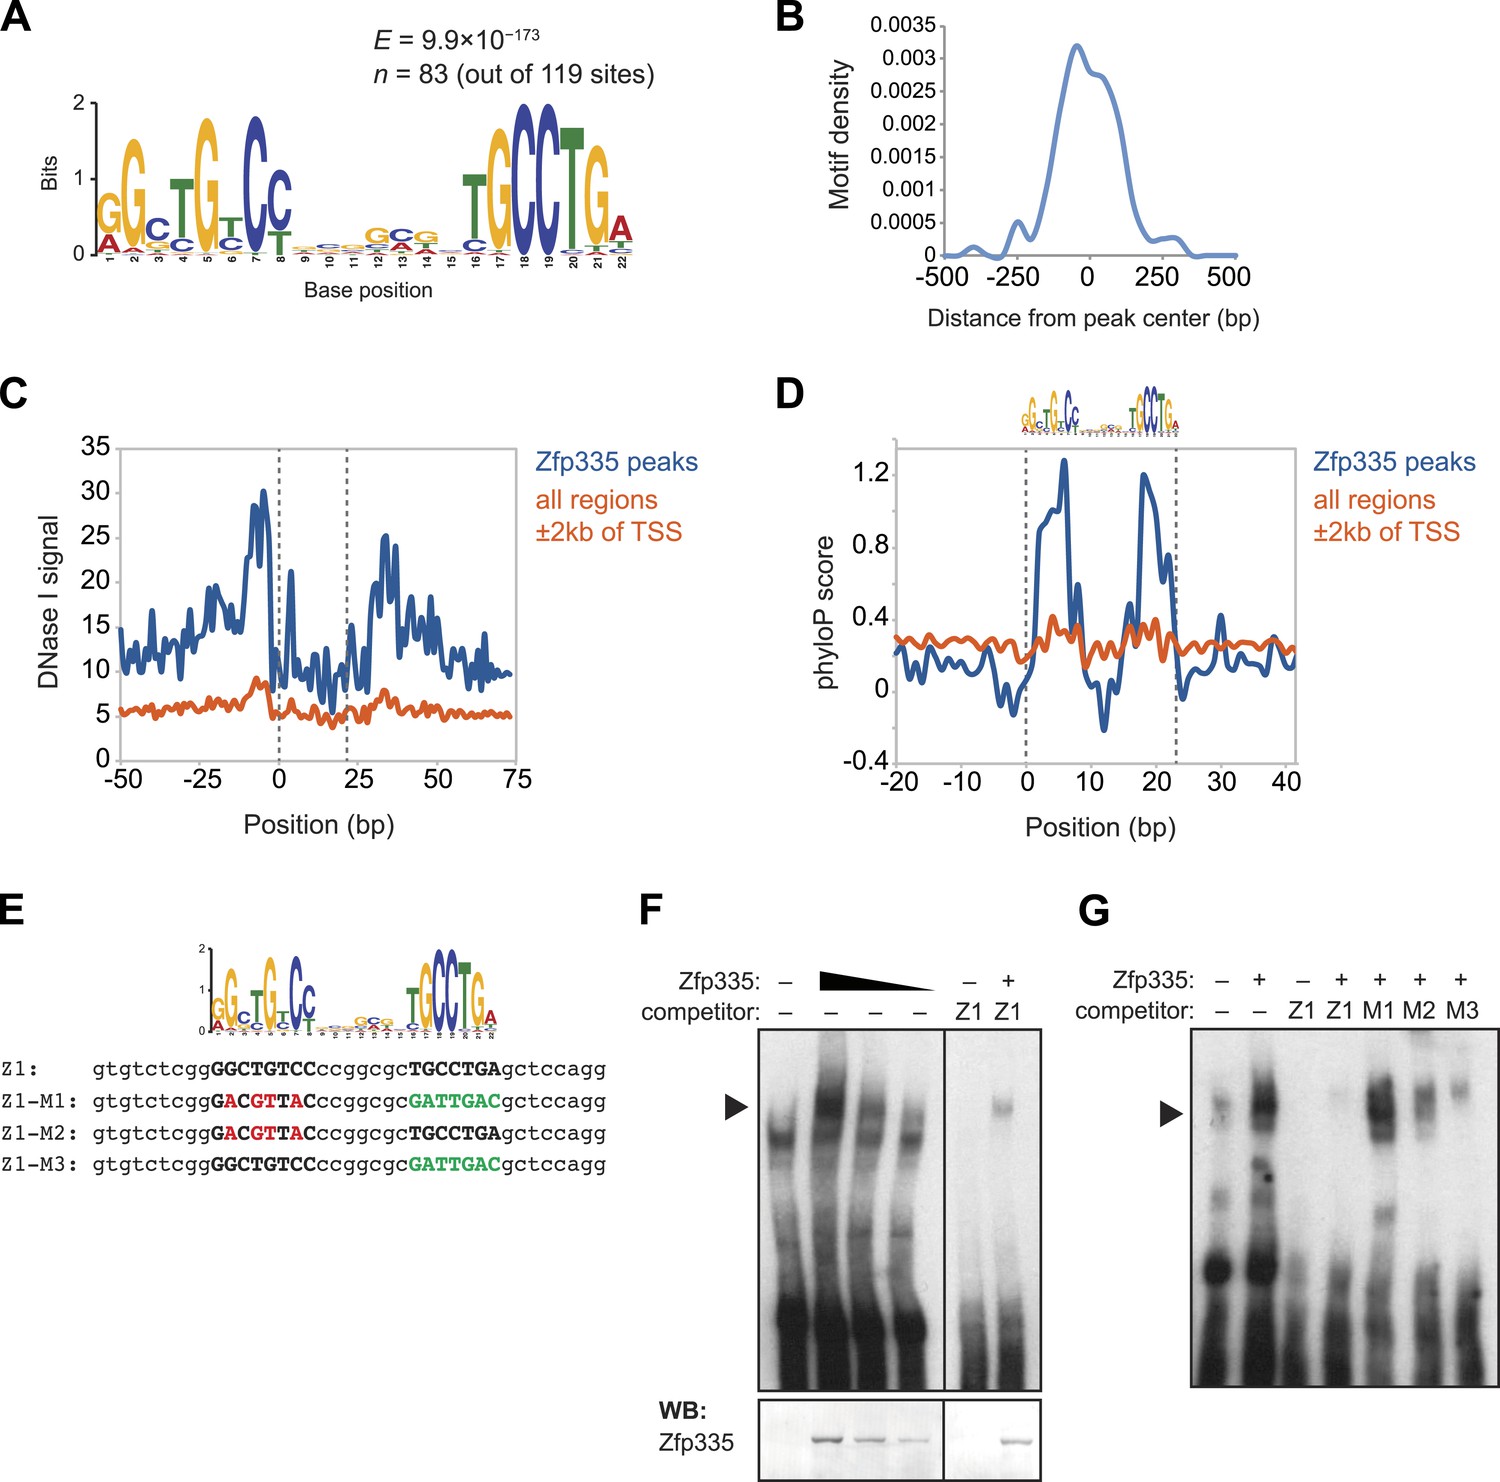
Identification of a novel DNA motif bound by Zfp335.
(A) Sequence motif identified by de novo motif search of WT Zfp335 ChIP-seq peaks. (B) Density histogram showing localization of motif relative to Zfp335 peaks. (C) DNase I genomic footprinting analysis of motif sites in Zfp335 ChIP-seq peaks (blue) compared with motif sites in all regions ±2 kb of TSS (orange), using ENCODE DGF data for whole thymus. The 22 bp motif is marked on both sides by dashed lines. (D) Sequence conservation (phyloP) profiles around Zfp335 motif sites within ChIP-seq peaks (blue) vs sites in all regions ±2 kb of TSS (orange). (E) Sequences of oligonucleotide probes used in (F) and (G). Z1 probe sequence was derived from Zfp335 binding site at the Zfp335 promoter and contains the primary consensus motif (capitalized, bold letters). For probes M1–M3, the first half (red), second half (green), or both parts of the consensus motif are mutated as shown. (F) Gel shift assay demonstrating sequence-specific binding of Zfp335 protein to labeled Z1 probe. Nuclear extracts from 293T cells transfected with control (−) or FLAG-Zfp335 (+) expression vectors were used. Signal from Zfp335-specific complexes (black arrowhead) is eliminated with an excess of unlabeled Z1 competitor oligo. Relative amounts of total Zfp335 protein verified by Western blot (bottom panel). Data are representative of three independent experiments. (G) Zfp335 binding to labeled Z1 probe in the presence of competition from unlabeled mutant oligos Z1–M1, Z1–M2, and Z1–M3. Signal intensity inversely correlates with ability of mutant probe to bind Zfp335: M1 is least able to bind, followed by M2, then M3. Black arrowhead, Zfp335 complex. Data are representative of three independent experiments.
Figure 7—figure supplement 1

Further EMSA characterization of Zfp335-binding motif.
(A) Gel shift assay showing Zfp335 complex formation with labeled Z1 probe but not with Pdap1 (Pd) probe containing the motif reported in a previous study (Yang et al., 2012). The standard Ikaros gel shift probe (Molnár and Georgopoulos, 1994; Cobb et al., 2000), IKbs4 (Ik), was used as negative control. (B) Zfp335 binding to labeled Z1 probe is competed away in the presence of excess unlabeled Z1 oligo, whereas Pdap1 (Pd) and Ikaros (Ik) oligos have no effect. Data from (A) and (B) are representative of two independent experiments.
Figure 8 with 1 supplement

Ankle2 is a functional target gene of Zfp335 and its dysregulation by Zfp335R1092W contributes to the maturation defect in blt/blt T cells.
(A) Quantitative RT-PCR analysis of Ankle2 transcript levels in indicated thymocyte and naïve T cell populations sorted from blt/+ and blt/blt mice (mean ± s.d., n = 3–4). (B) Western blot for Ankle2 protein in wild-type (+/+) and mutant (b/b) thymocytes, with actin as loading control. (C) Rag1-GFP blt/blt bone marrow was retrovirally transduced with either WT Zfp335 or control vector and used to reconstitute irradiated hosts. CD4+ RTEs from these chimeras were sorted into transduced (Thy1.1+) and non-transduced (Thy1.1−) populations and analyzed for Ankle2 expression by RT-qPCR (mean ± s.d., n = 3). (D) Gating strategy for spleen CD4+ naïve T cells, subdivided into GFPhi (less mature) and GFPlo (more mature) populations. Red line, Rag1-GFP+ naïve T cells; blue dashed line, Rag1-GFP+ mature SP thymocytes; grey fill, Rag1-GFP− CD45.1+ host naïve T cells (background control). GFPlo and GFPhi T cells were then gated on Thy1.1 reporter expression as indicated. Flow cytometry plots shown are for chimeras reconstituted with Ankle2- or empty vector-transduced Rag1-GFP blt/blt bone marrow. (E) Change in the percentage of cells transduced with Ankle2 (n = 6), WT Zfp335 (n = 5) or control vector (n = 10) during naïve T cell maturation (Δ%Thy1.1+ = %Thy1.1+ GFPlo − %Thy1.1+ GFPhi). A higher Δ%Thy1.1+ indicates enrichment of the reporter+ cells in the more mature GFPlo population compared to the less mature GFPhi population. Data are represented as Tukey box plots; *p < 0.05, **p < 0.01 (one-tailed Mann–Whitney test). Chimeras were analyzed 8 weeks post-reconstitution.
Figure 8—figure supplement 1
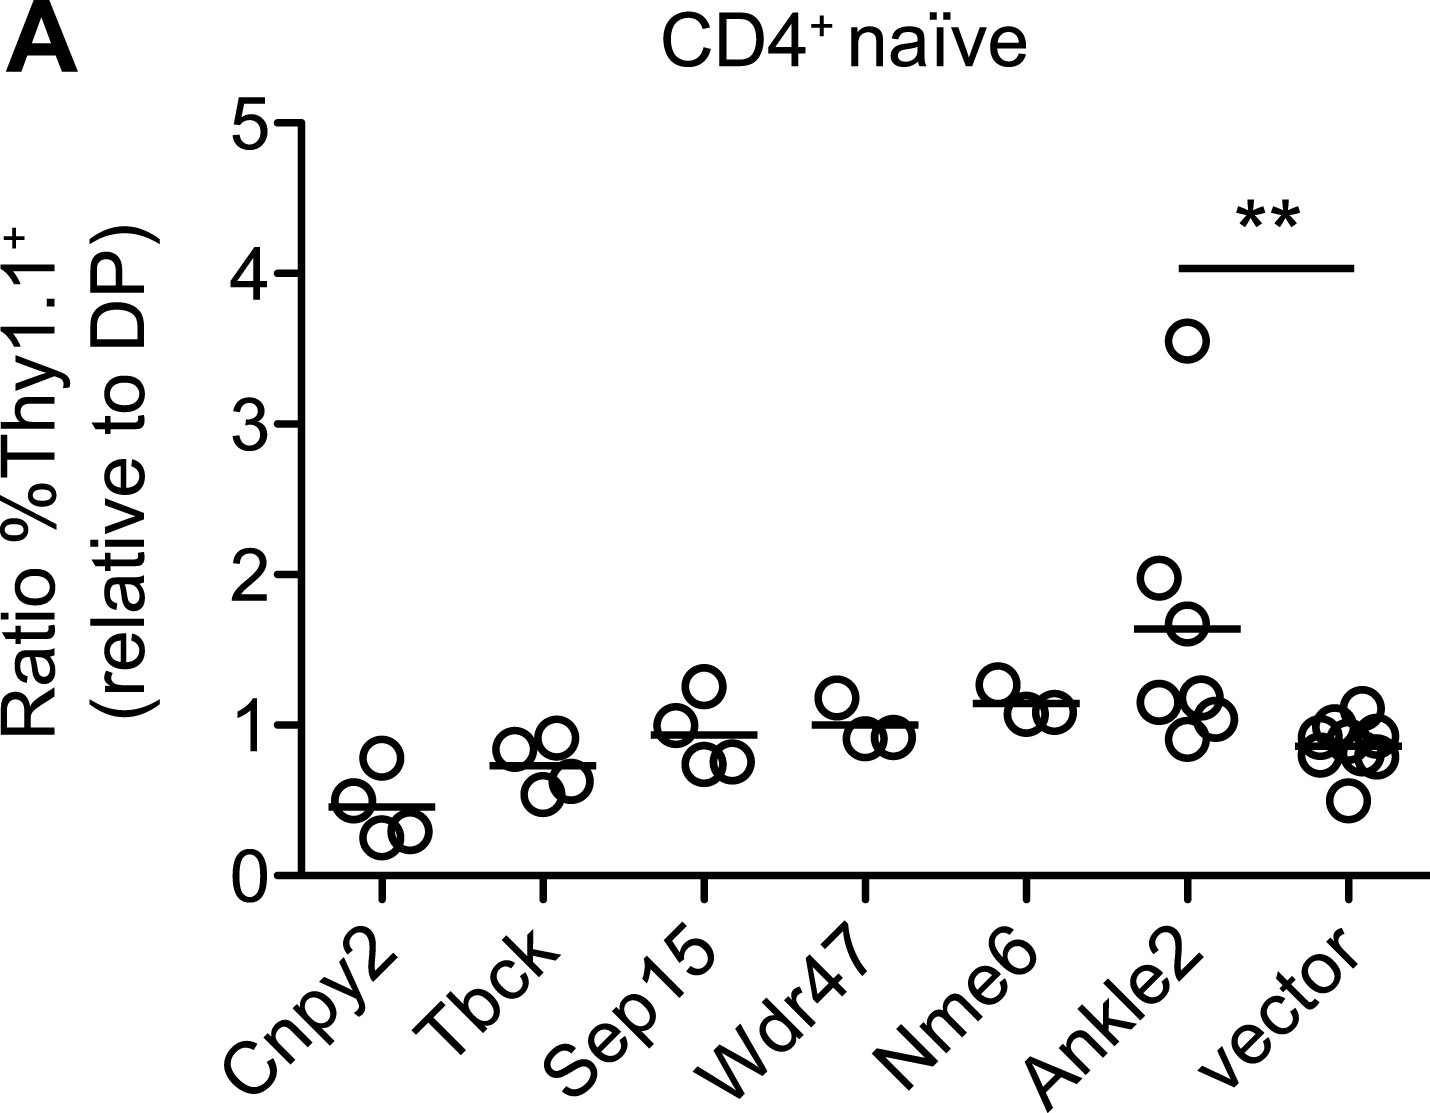
Ectopic expression of other Zfp335 target genes is not sufficient to reverse the T cell maturation defect.
(A) blt/blt bone marrow was retrovirally transduced with Ankle2, Cnpy2, Nme6, Sep15, Tbck, Wdr47, or control vector, and used to reconstitute irradiated chimeras. The normalized ratios of %Thy1.1+ CD4+ naïve T cells relative to %Thy1.1+ DP thymocytes are shown. Overexpression of Ankle2 yielded a ratio greater than that for vector control, suggesting it is able to drive T cell maturation to some degree. Other constructs tested either showed weak or insignificant effects (Nme6, Wdr47, Sep15, Tbck), or may be inhibitory for maturation (Cnpy2). Each symbol represents one chimeric mouse.; **p < 0.01 (one-tailed Mann-Whitney test).
Additional files
-
Supplementary file 1
Hierarchical clustering analysis of 108 genes differentially expressed (p < 0.05, fold-change > 1.2) in blt/blt vs. WT mature CD4SP thymocytes and CD4+ RTEs.
- https://doi.org/10.7554/eLife.03549.023
-
Supplementary file 2
Summary statistics for ChIP-seq read alignment, mapping and peak calling.
- https://doi.org/10.7554/eLife.03549.024
-
Supplementary file 3
ChIP-seq peaks for all WT and bloto thymocyte datasets, annotated with the nearest gene TSS.
- https://doi.org/10.7554/eLife.03549.025
-
Supplementary file 4
Functional annotation of Zfp335 target genes, with major enriched categories represented.
- https://doi.org/10.7554/eLife.03549.026
-
Supplementary file 5
Sequences of oligonucleotides used for EMSA.
- https://doi.org/10.7554/eLife.03549.027
-
Supplementary file 6
Sequences of primers used for RT-qPCR.
- https://doi.org/10.7554/eLife.03549.028
-
Supplementary file 7
Sequences of primers used for ChIP-qPCR.
- https://doi.org/10.7554/eLife.03549.029
Download links
A two-part list of links to download the article, or parts of the article, in various formats.
Downloads (link to download the article as PDF)
Open citations (links to open the citations from this article in various online reference manager services)
Cite this article (links to download the citations from this article in formats compatible with various reference manager tools)
Zinc finger protein Zfp335 is required for the formation of the naïve T cell compartment
eLife 3:e03549.
https://doi.org/10.7554/eLife.03549


