Discovery of a small molecule that inhibits bacterial ribosome biogenesis
- McMaster University, Canada
- The Scripps Research Institute, United States
Figures
Figure 1 with 1 supplement
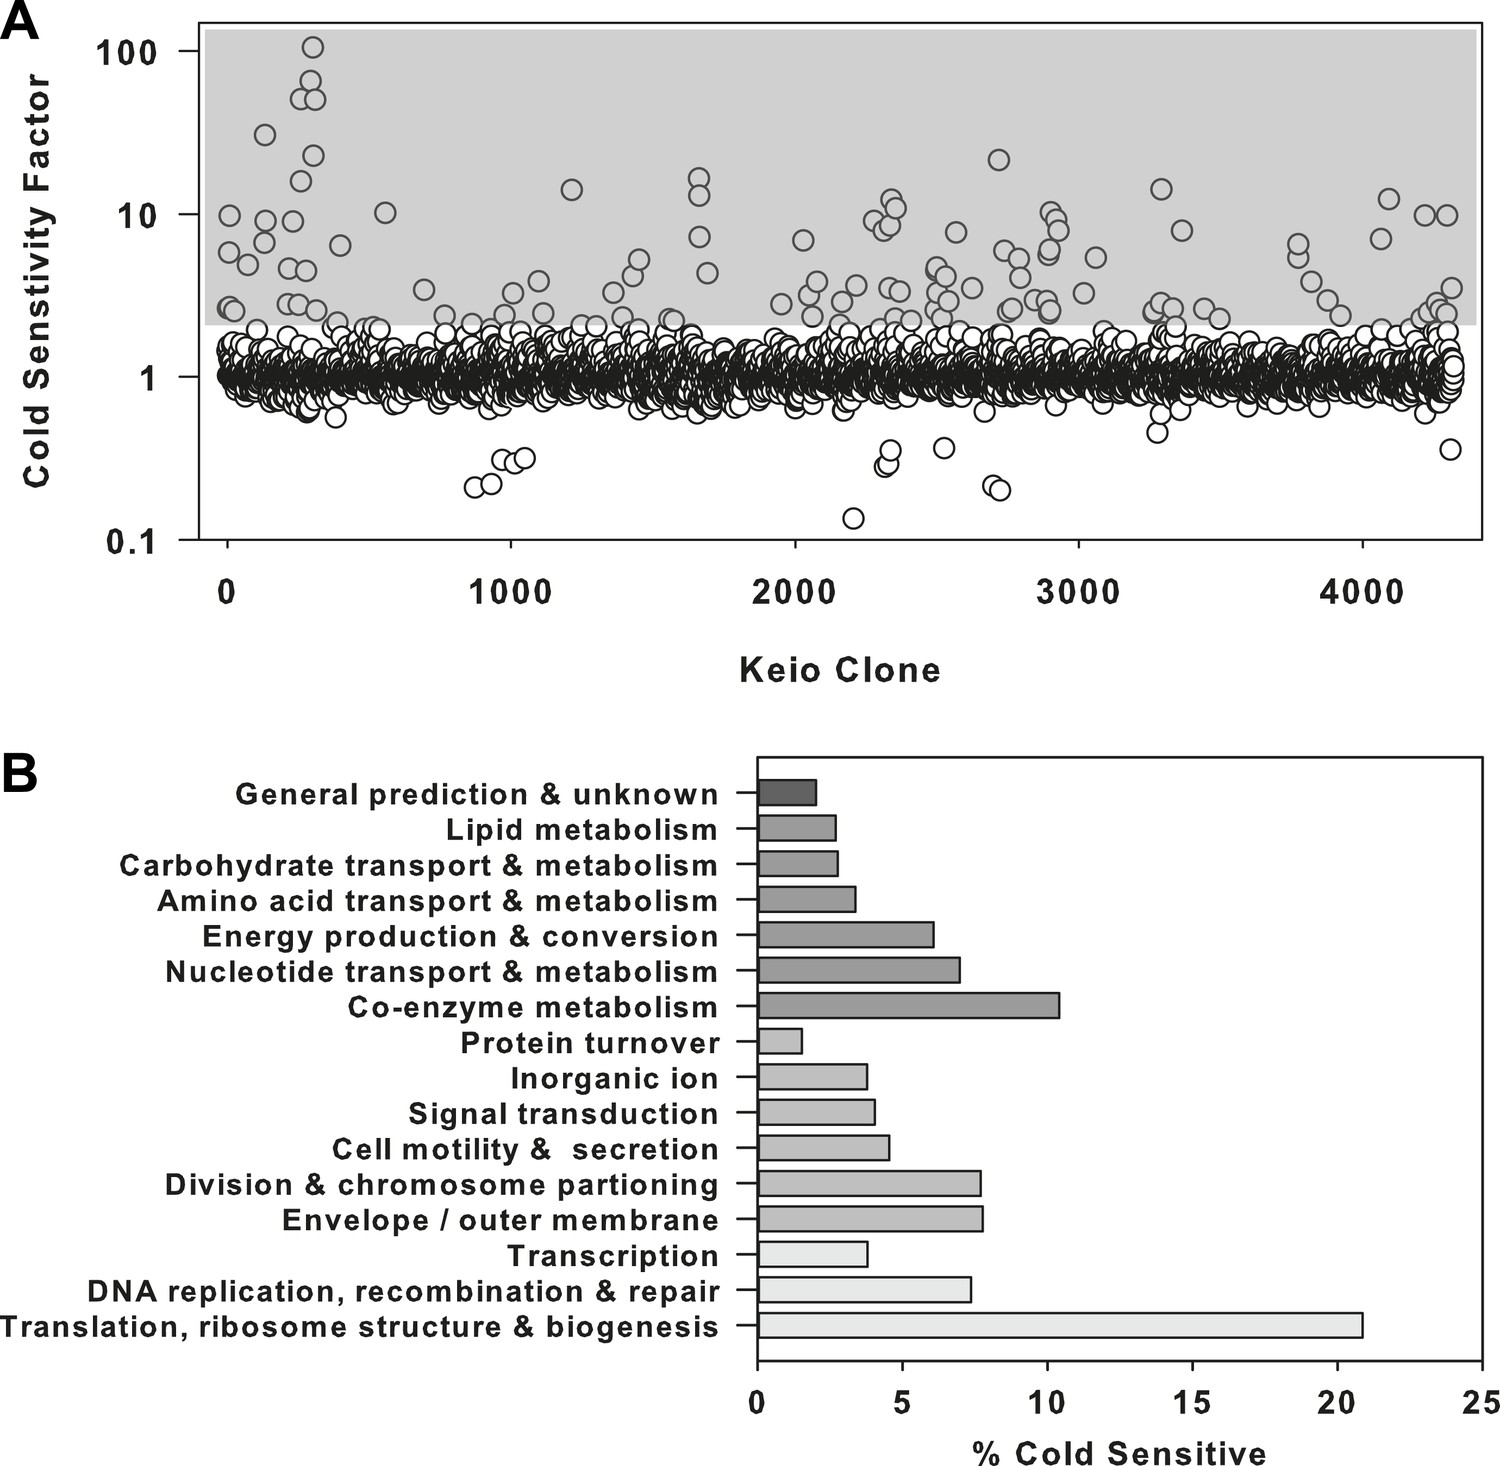
The ribosome is a primary target of cold stress.
(A) Screen of the E. coli Keio collection for cold sensitivity. Each strain's cold sensitivity factor is defined as the ratio of growth at 37°C to growth at 15°C. Cold sensitivity factors for each strain were normalized to 1, based on the mean of all cold sensitivity factors calculated for the entire collection. Growth at each temperature was calculated based on the average of two replicates. A gray box highlights strains exhibiting cold sensitivity in the top 3.5% (155 strains). (B) The 155 cold sensitive genes from (A) were grouped based on clusters of orthologous groups classifications. The percentage of cold sensitive genes in each functional class was defined as the number of cold sensitive genes in that class divided by the total number of non-essential E. coli genes in that same functional class. By permuting the classification assignments, we determined that the proportion of cold sensitive genes in the translation class (21%) was significant with a bootstrapped p-value < 1e−6.
-
Figure 1—source data 1
Screen of the E. coli Keio collection.
Cold sensitivity factors for each strain were normalized to 1, based on the mean of all cold sensitivity factors calculated.
- https://doi.org/10.7554/eLife.03574.004
Figure 1—figure supplement 1

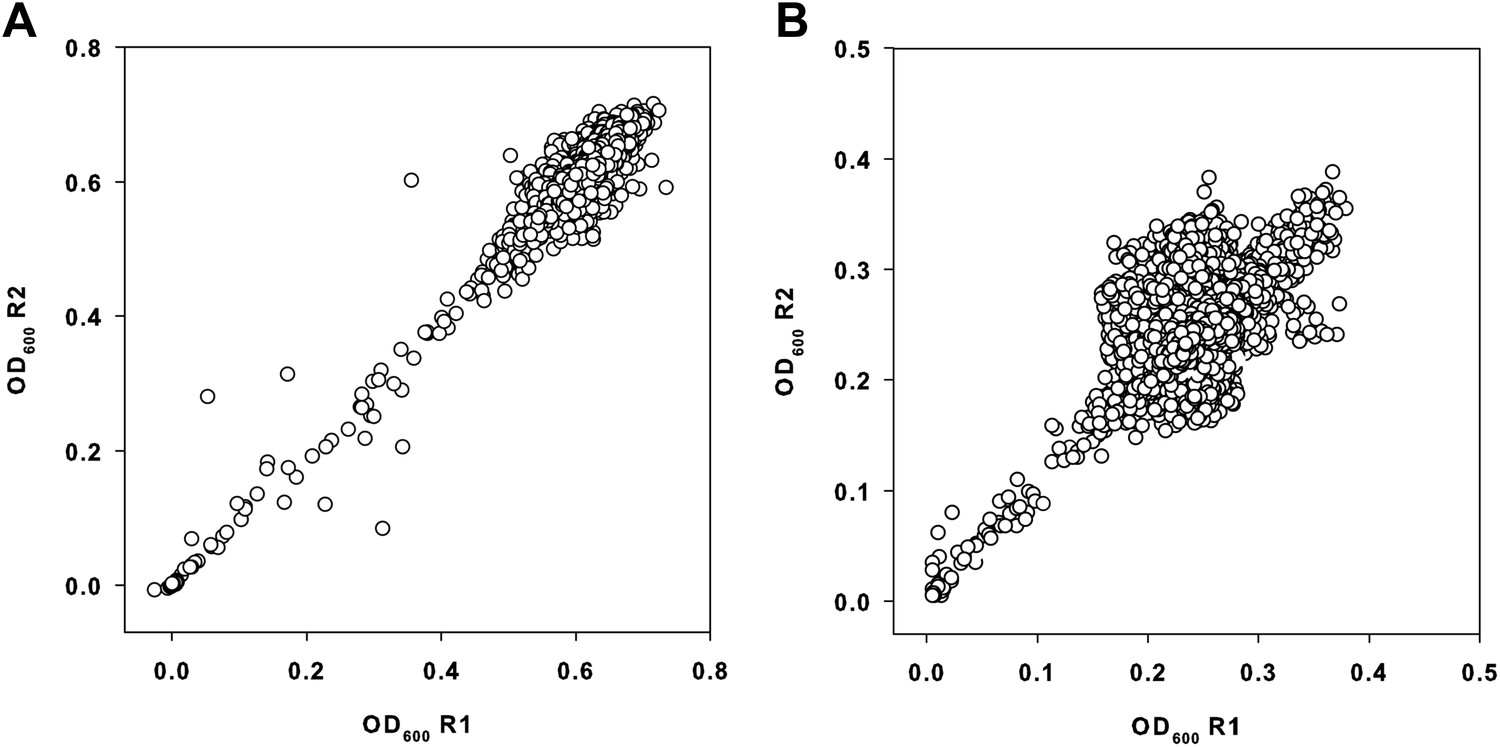
Primary data from the screen of the E. coli Keio collection.
(A) Replicate plot of Keio strains grown in duplicate at 37°C for 24 hr. (B) Replicate plot of Keio strains grown in duplicate at 15°C for 48 hr. Cells were grown in LB media supplemented with 50 μg/ml kanamycin for the aforementioned durations and subsequently read at 600 nm using a Perkin Elmer EnVision 96-well plate reader. Cells were grown in a final volume of 100 μl per well. (C) Distribution of functional classes amongst the top 3.5% of strains identified as cold sensitive. Classes are grouped according to the following: information storage and transfer (light gray); cellular processes (mid gray); metabolism (dark gray); genes of unknown function (very dark gray) according to clusters of orthologous groups.
Figure 2 with 2 supplements
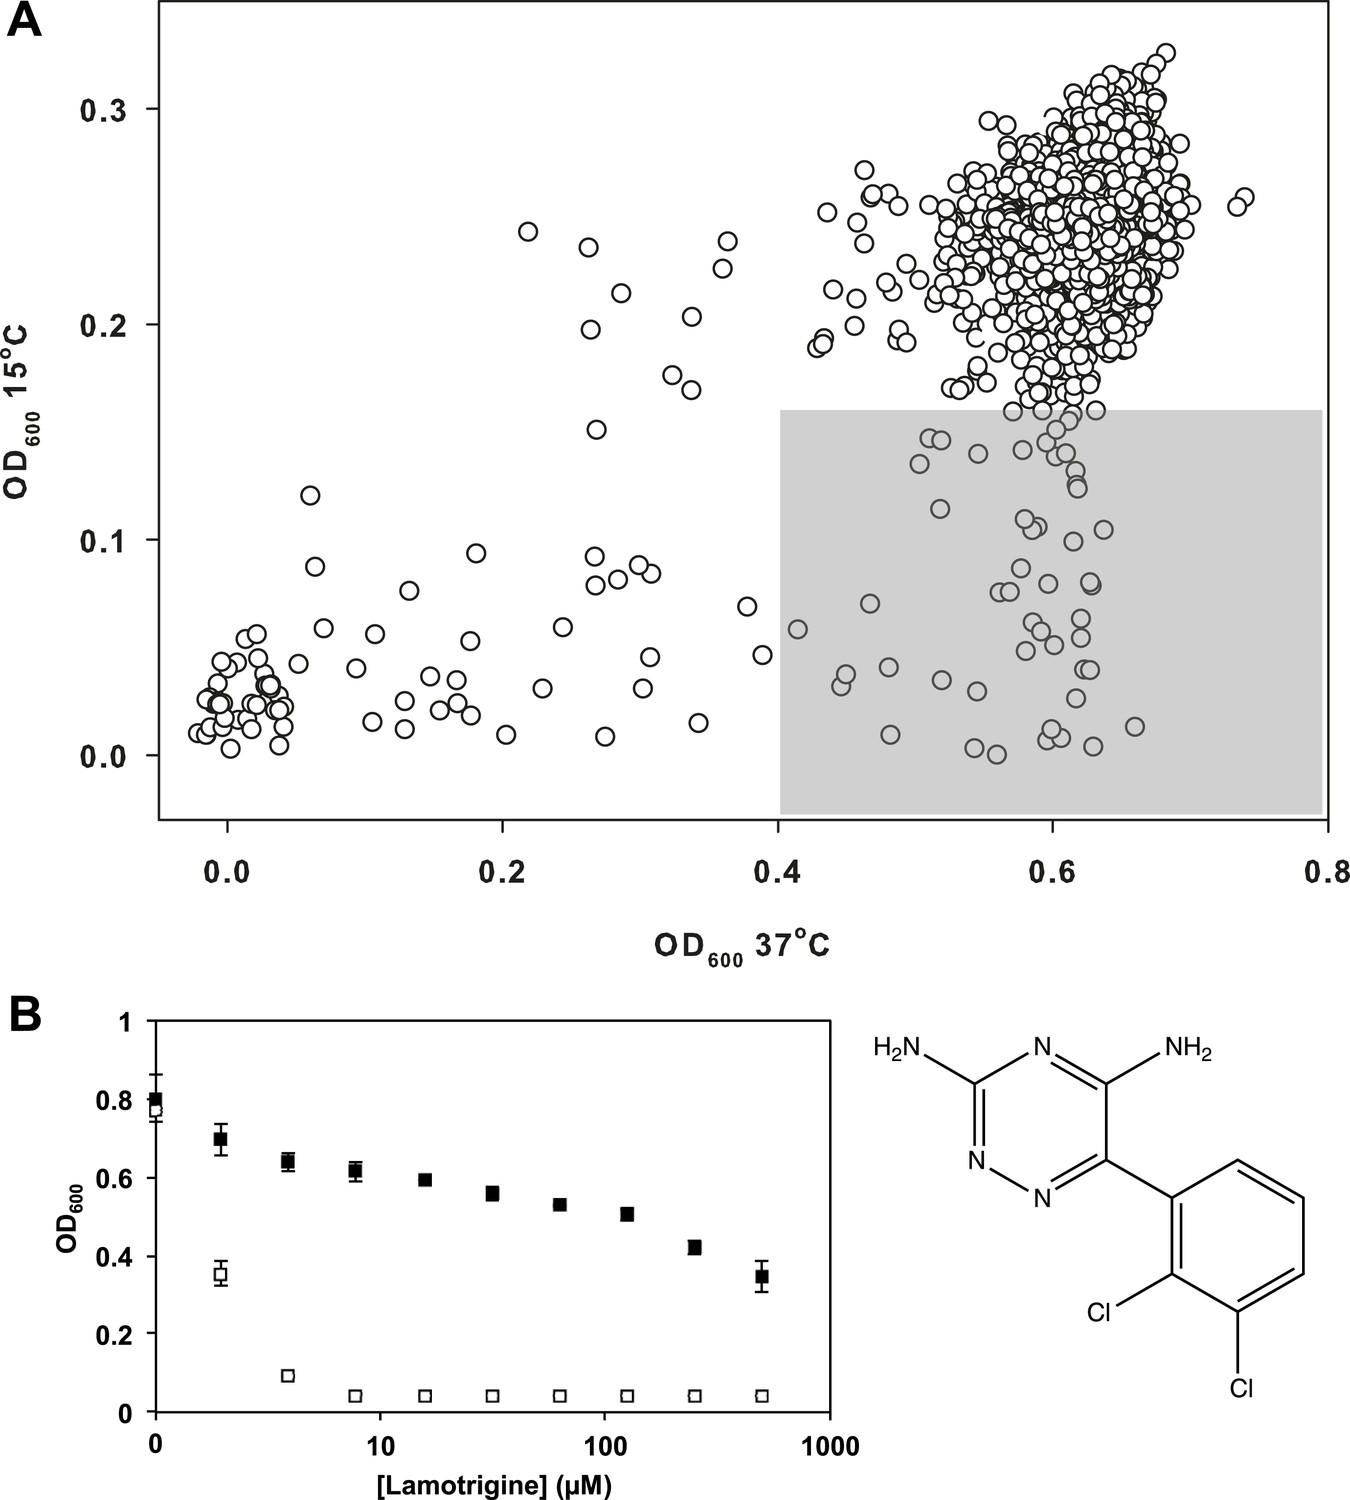
Lamotrigine induces profound cold sensitivity in E. coli.
(A) Screen of ∼30,000 small molecules at 10 μM against E. coli for cold sensitivity. Compounds found within the gray region were selected for secondary screening. Hit inclusion boundaries are defined as molecules residing >3σ below the mean OD600 at 15°C and <2σ below the mean OD600 at 37°C. Growth at each temperature was calculated based on the average of two replicates. (B) Dose-response analysis of lamotrigine at 37°C (black dots) and 15°C (white dots). Error bars represent the error of two biological replicates.
-
Figure 2—source data 1
Small molecule screen for cold senstivity.
OD values were normalized across screening plates to account for plate-to-plate variations.
- https://doi.org/10.7554/eLife.03574.007
Figure 2—figure supplement 1
Primary data from the small molecule screen.
(A) Replicate plot of E. coli BW25113 grown in the presence of 10 μM of each molecule from a collection of ∼30,000 at 37°C for 24 hr, in duplicate. (B) Replicate plot of E. coli BW25113 grown in the presence of 10 μM of each molecule from a collection of ∼30,000 at 15°C for 48 hr, in duplicate. Cells were grown in LB media and subsequently read at 600 nm using a Perkin Elmer EnVision 96-well plate reader. Cells were grown in a final volume of 100 μl per well.
Figure 2—figure supplement 2
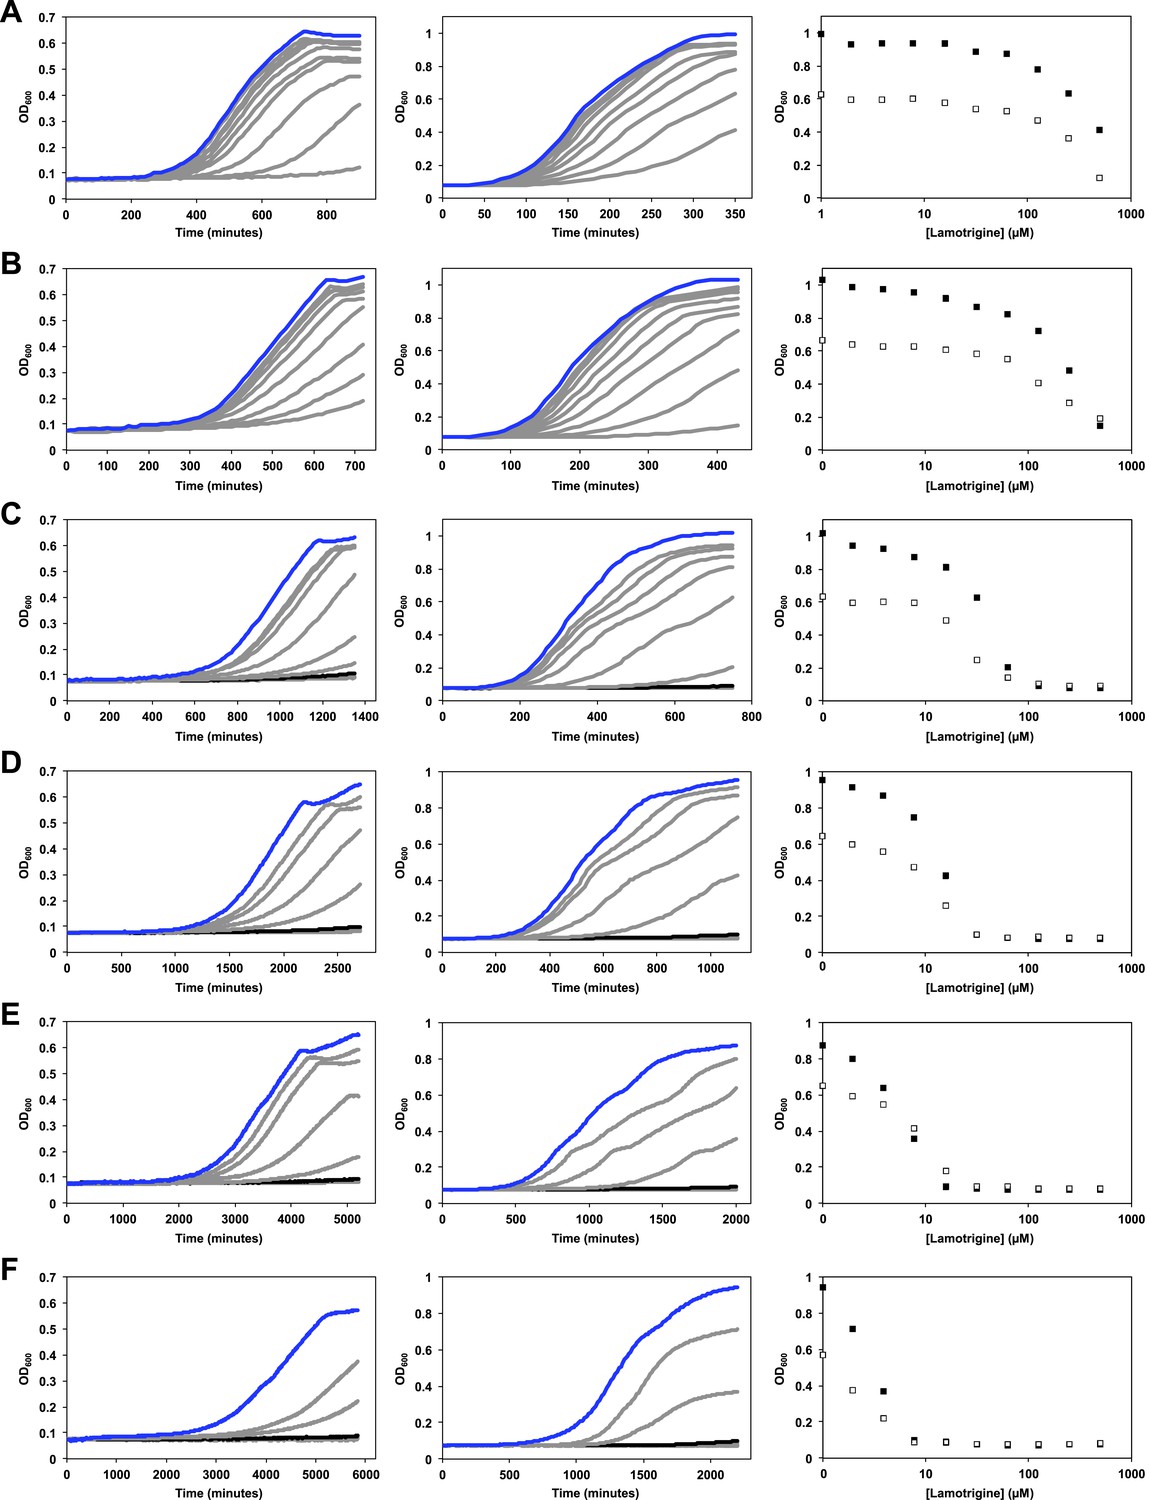
Temperature dependence of lamotrigine activity in E. coli.
(A) E. coli BW25113 was grown in M9 (left column) and LB (middle column) until early stationary phase in the presence of varying concentrations of lamotrigine at 42°C. Cells were also grown at 37°C (B), 30°C (C), 25°C (D), 20°C (E), and 15°C (F). Blue lines represent no-drug control cultures. Black lines represent cultures treated with MIC quantities of lamotrigine. Dose-response curves of cells grown in LB (black dots) and M9 (white dots) in the presence of lamotrigine are also shown for each temperature. Cells were grown in a final volume of 100 μl with continuous shaking and read at 600 nm every 10 min using a Tecan Sunrise 96-well plate reader.
Figure 3 with 1 supplement
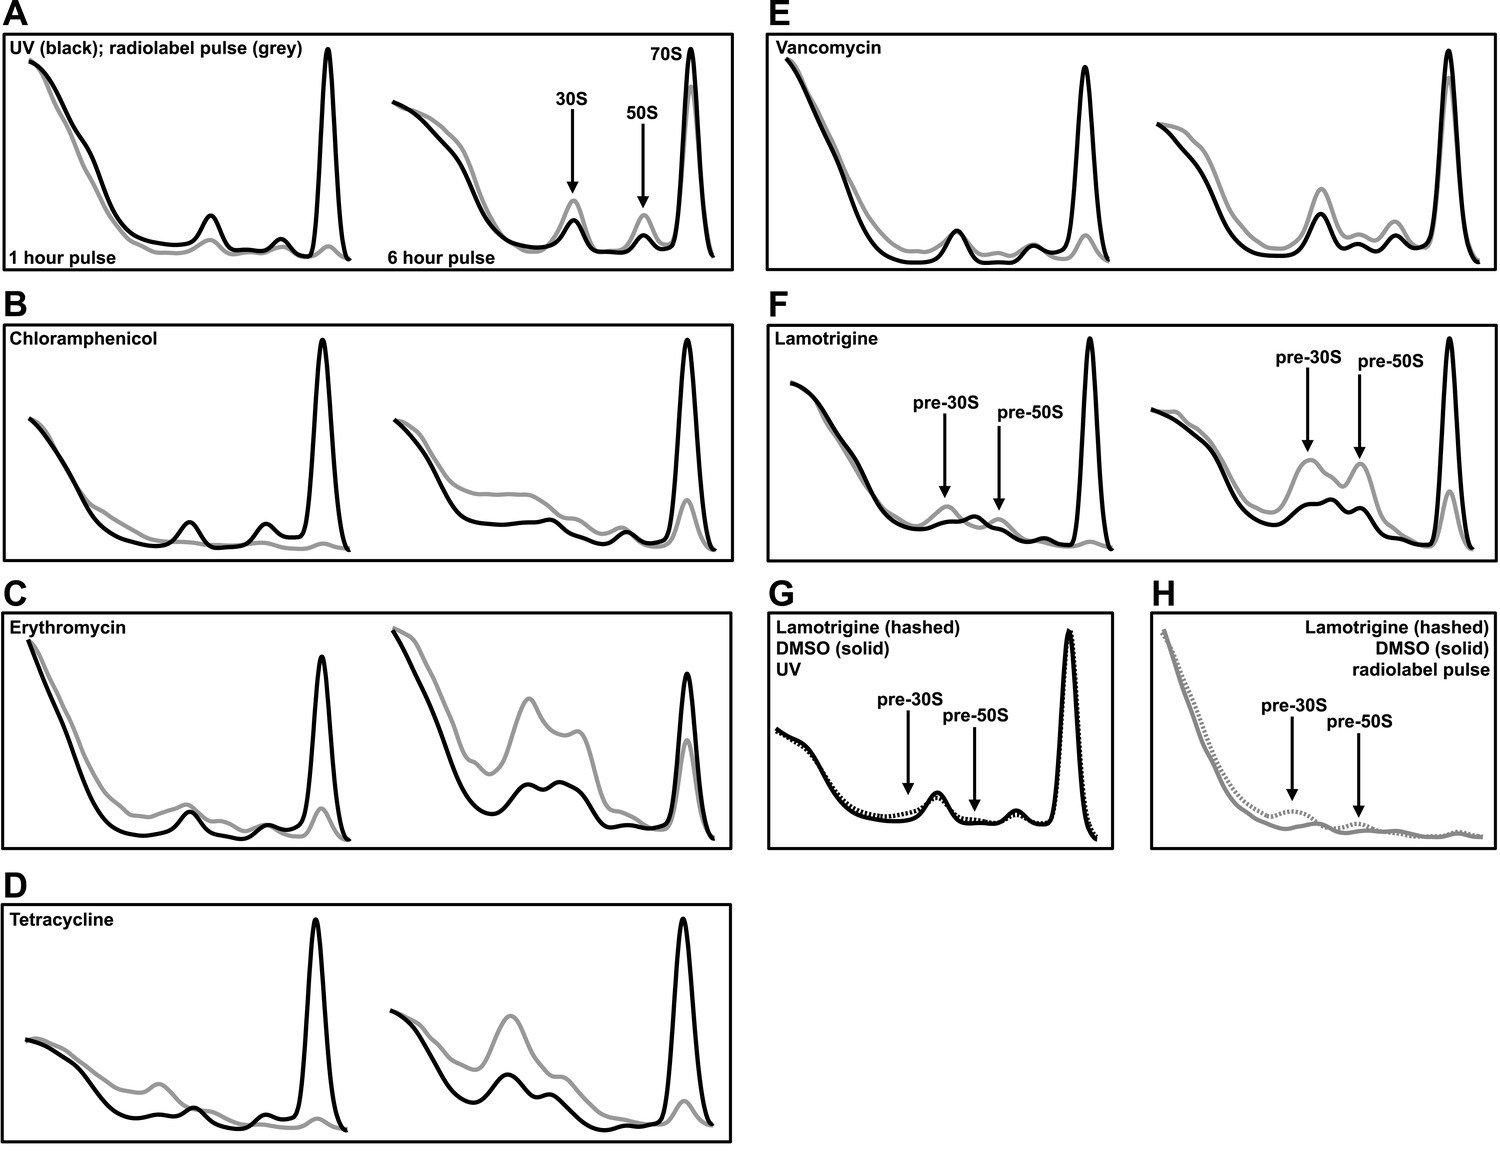
Lamotrigine treatment results in the accumulation of non-native ribosomal particles.
(A) Cells were treated with DMSO (vehicle) and immediately pulse labeled with [14C]-uridine. Cells were harvested after 1 hr (left) and 6 hr (right) of treatment, and ribosomal particle accumulation was monitored using UV absorbance at 260 nm (black trace) and scintillation counting (gray trace). Also shown are treatments with 2× MIC chloramphenicol (B); 2× MIC erythromycin (C); 2× MIC tetracycline (D); 2× MIC vancomycin (E); and 2× MIC lamotrigine (F). (G) Early-log cultures of E. coli were treated with DMSO (solid line) or 2× MIC lamotrigine (hashed line), pulse labeled with [14C]-uridine, and incubated for 5 min. Ribosomal particles were separated on a sucrose gradient and monitored using UV absorbance. (H) These gradients were also analyzed via scintillation counting.
Figure 3—figure supplement 1
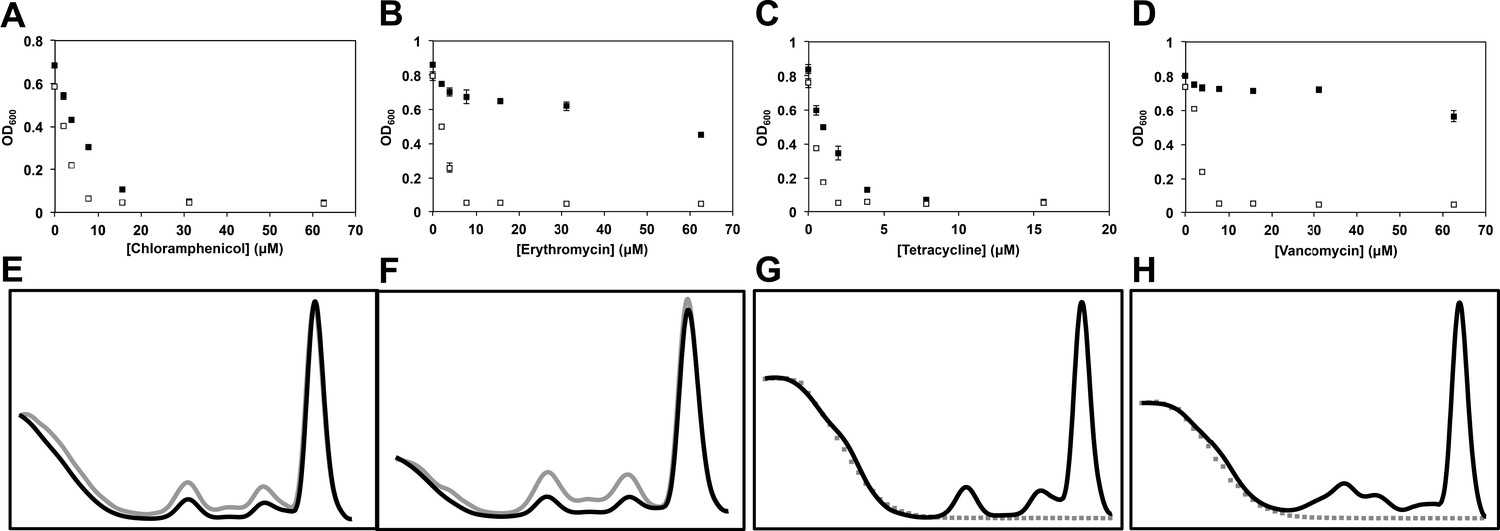
Temperature-dependent antibiotic activity in E. coli.
(A) E. coli BW25113 was grown in LB media at 37°C for 24 hr (black dots) and 15°C for 48 hr (white dots) in duplicate in the presence of varying concentrations of chloramphenicol, (B) erythromycin, (C) tetracycline, and (D) vancomycin. Cells were grown in a final volume of 100 μl. Minimum inhibitory concentration is defined as the lowest concentration of antibiotic required to prevent growth by >95%, as analyzed by OD600. Error bars represent the error of two biological replicates. (E) Sucrose gradients of ribosomal particles from early-log cultures of E. coli treated with DMSO at 37°C. Cells were treated with DMSO and immediately pulse labeled with [14C]-uridine. Cells were harvested after 1 hr (∼3 doublings) of treatment and ribosomal particle accumulation was monitored using UV absorbance at 260 nm (black trace) and scintillation counting (gray trace). (F) Cells were also treated with 2× MIC (15.6 μM) of lamotrigine and ribosomes analyzed in the same manner. (G) Sucrose gradients of ribosomal particles from early-log cultures of E. coli treated with DMSO and immediately labeled with [3H]-lamotrigine to a final concentration of 0.2 μCi/ml. Cells were grown at 15°C in 25 ml of LB and harvested after 6 hr of treatment, after which they were lysed and the ribosomal particles separated through a sucrose gradient. The gradient was passed through a UV cell measuring absorbance at 260 nm (black trace) and 500 μl fractions were subsequently collected and scintillation counted to localize [3H]-lamotrigine (gray dots). (H) Same as (G), except cells were treated with 1× MIC unlabeled lamotrigine in place of DMSO.
Figure 4 with 2 supplements

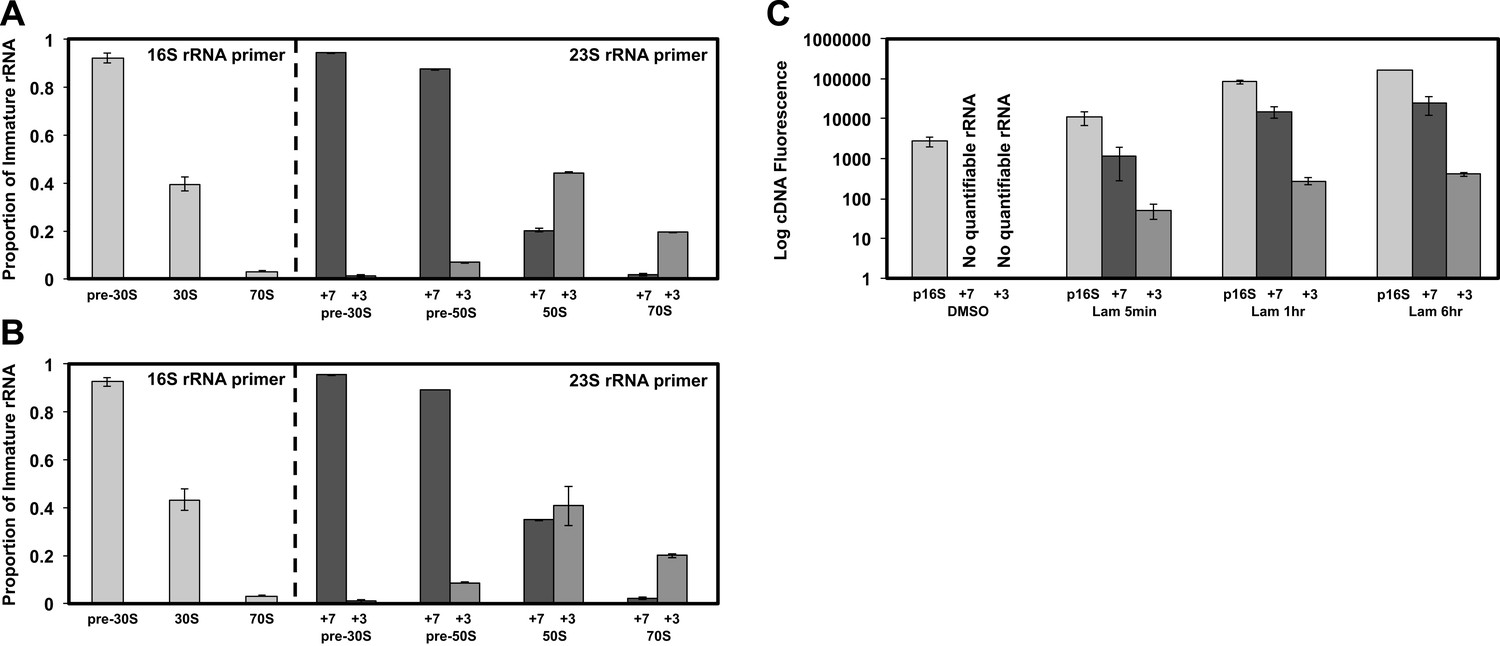
Non-native ribosomal particles are immature 30S and 50S subunits.
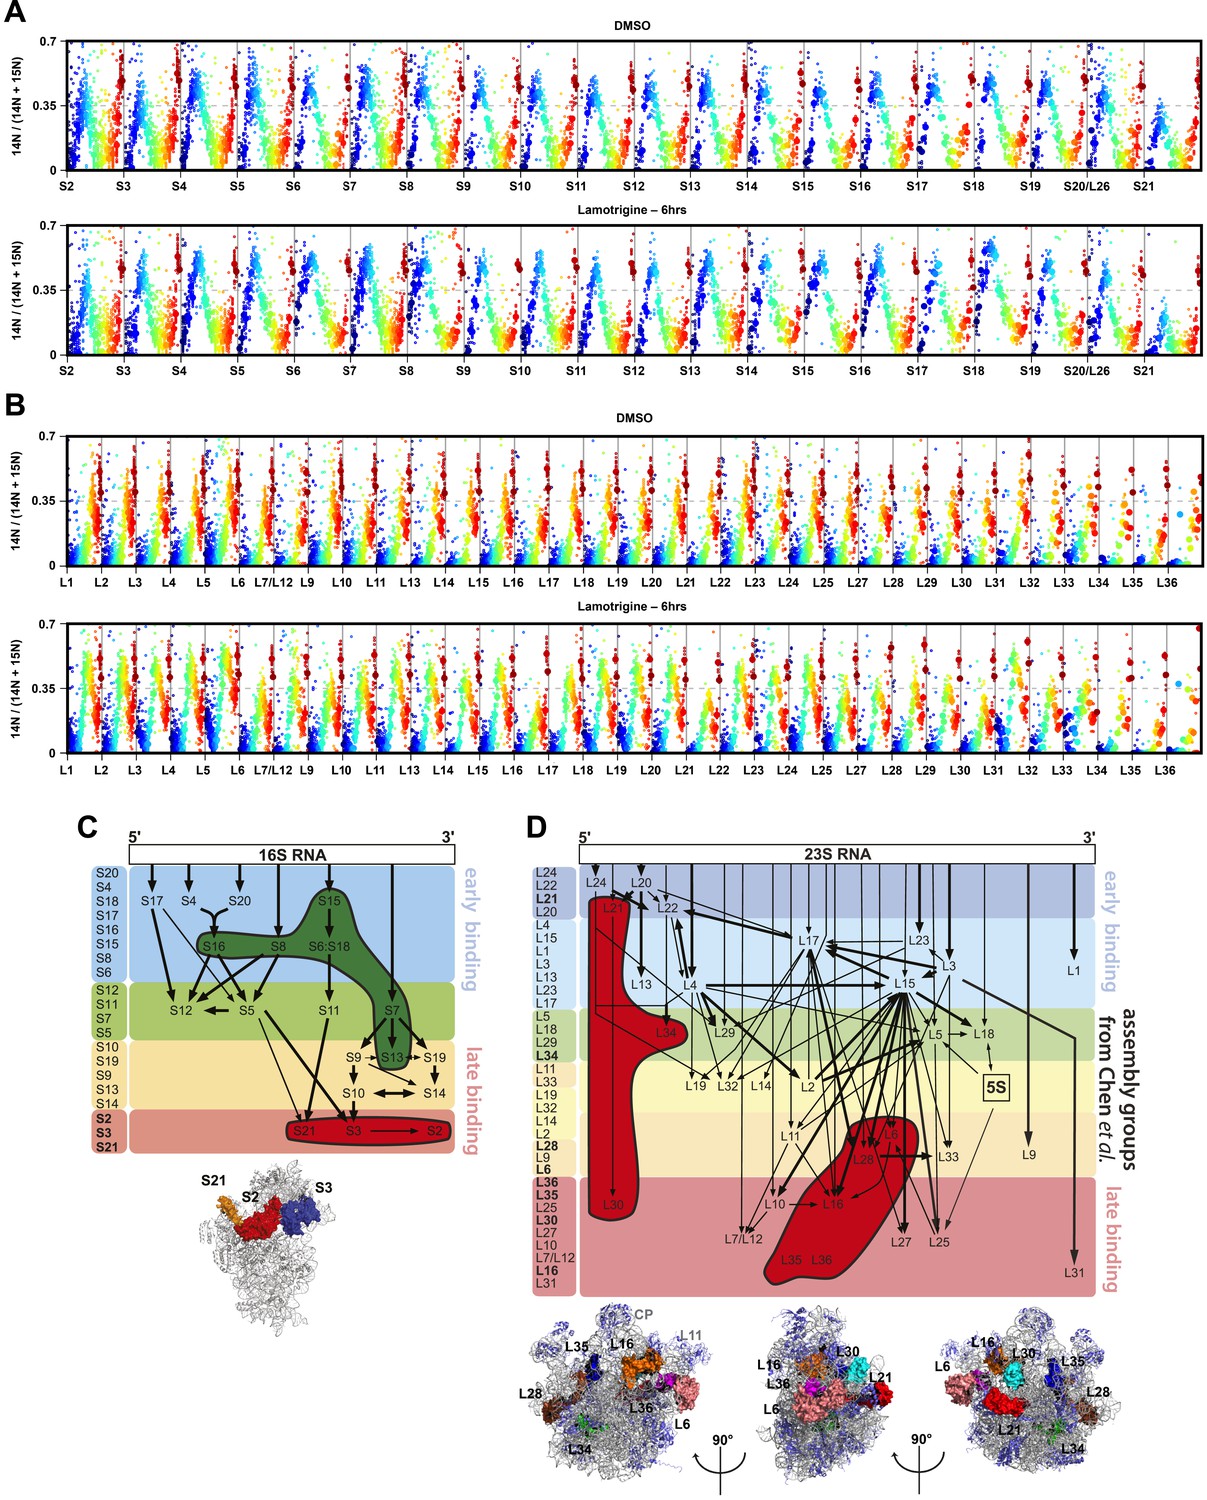
(A) 5′ cleavage sites of 16S and 23S rRNA. (B) 5′ primer extension analysis of ribosomal particles harvested from DMSO- and lamotrigine-treated E. coli. Early-log cells were treated with DMSO for 6 hr or 2× MIC lamotrigine for 5 min, ribosomal particles were separated on a sucrose gradient, and rRNA was fractionated according to increasing sedimentation rates as indicated (pre-30S, 30S, pre-50S, 50S, and 70S). Particle detection by reverse transcription used a 16S rRNA specific primer (light gray) or a 23S rRNA specific primer (gray and dark gray). Proportion of immature rRNA was calculated as (immature 16S rRNA species/total 16S rRNA species) and (immature 23S rRNA species/total 23S rRNA species). +7 and +3 represent immature 23S rRNA containing an additional 7 nucleotides and 3 nucleotides at the 5′ terminus, respectively. Error bars represent the error of two biological replicates. (C) Quantitative cDNA production of rRNA species within pre-30S regions from DMSO- and lamotrigine-treated E. coli. Early-log cells were treated with DMSO for 6 hr or 2× MIC lamotrigine for 5 min, 1 hr, and 6 hr. Ribosomal particles were separated on a sucrose gradient, and rRNA purified from a single pre-30S fraction from each treatment was reverse transcribed in parallel using 16S- and 23S-specific primers. p16S represents immature 16S rRNA. Error bars represent the error of two biological replicates. (D) Quantitation of ribosomal protein occupancy within individual fractions collected from sucrose gradients. Fractions are colored from blue (lowest density portion of the gradient) to red (highest density portion of the gradient). Each open circle represents a unique peptide measurement; closed circles denote median values. Occupancy profiles for early (S15, L24) and late binding (S3, L28) proteins are compared between sucrose gradients analyzed using DMSO (top) or lamotrigine-treated (bottom) cells. (E) R-protein occupancy of ribosomal particles harvested from sucrose density gradient fractions of DMSO- (red) and lamotrigine-treated (green) E. coli. Data are plotted as a heat map using the median occupancy values (see results) corrected for the amount of sample analyzed in each fraction and normalized to scale from 0 (white) to 1.0 (darkest shade). Small subunit (left) fractions span the pre-30S to the pre-50S regions of the sucrose gradient. Large subunit fractions (right) span the late-30S to the late-50S regions of the sucrose gradient. A representative 70S fraction is included in each data set. Absorbance measured at 260 nm is plotted for the region analyzed above each heat map. (F) Mass spectrometric localization of RbfA and DeaD in sucrose density gradient fractions of DMSO- (red) and lamotrigine-treated (green) E. coli. Relative protein abundance was calculated as described in ‘Materials and methods’.
-
Figure 4—source data 1
R-protein occupancy across sucrose gradients, normalized to the maximum value observed.
- https://doi.org/10.7554/eLife.03574.013
Figure 4—figure supplement 1
5′ primer extension of lamotrigine-treated E. coli.
(A) 5′ primer extension analysis of ribosomal particles harvested from E. coli treated with 2× MIC lamotrigine for 1 hr. Early-log cells were treated with lamotrigine, ribosomal particles were separated on a sucrose gradient, and rRNA was fractionated according to increasing sedimentation rates as indicated (pre-30S, 30S, pre-50S, 50S, and 70S). Particle detection by reverse transcription used a 16S rRNA specific primer (light gray) or a 23S rRNA specific primer (gray and dark gray). Proportion of immature rRNA is calculated as (immature 16S rRNA species/total 16S rRNA species) and (immature 23S rRNA species/total 23S rRNA species). +7 and +3 represent immature 23S rRNA containing an additional 7 nucleotides and 3 nucleotides at the 5′ terminus, respectively. Error bars represent the error of two biological replicates. (B) Same as (A), except cells were treated with 2× MIC lamotrigine for 6 hr. (C) Quantitative cDNA production of rRNA species within pre-30S regions from DMSO- and lamotrigine-treated E. coli. Early-log cells were treated with DMSO for 6 hr or 2× MIC lamotrigine for 5 min, 1 hr, and 6 hr. Ribosomal particles were separated on a sucrose gradient, and rRNA purified from a single pre-30S fraction from each treatment was reverse transcribed in parallel using 16S- and 23S-specific primers. p16S represents immature 16S rRNA. Error bars represent the error of two biological replicates.
Figure 4—figure supplement 2
R-protein mass spectrometry of ribosomal particles from lamotrigine-treated E. coli.
(A) R-protein occupancy of small subunit proteins across sucrose gradients from DMSO (top) and lamotrigine-treated (bottom) cells. Each open circle represents a unique peptide measurement in a given fraction. Closed circles highlight the median value for each peptide in a given fraction. Individual fractions are colored from blue (lowest density portion of the gradient) to red (highest density portion of the gradient). (B) Same as (A), except monitoring abundance of large subunit proteins. (C) Over-represented (green) and under-represented (red) small subunit r-proteins of the pre-30S particle that accumulates during lamotrigine treatment are highlighted on the Nomura assembly map (Held et al., 1974; Chen et al., 2012). Assembly groups are colored according to Chen and Williamson (2013). Low occupancy proteins highlighted on the 30S subunit (PDB 2AVY) cluster around the neck of the 30S subunit. (D) Under-represented (red) large subunit r-proteins from the pre-50S particle that accumulates during lamotrigine treatment are highlighted on the Nierhaus assembly map (Herold and Nierhaus, 1987; Chen et al., 2012). Depleted proteins highlighted on the 50S subunit (PDB 2Y11) generally cluster in a ring around the L1 arm, central protuberance, and L11 arm.
Figure 5 with 1 supplement

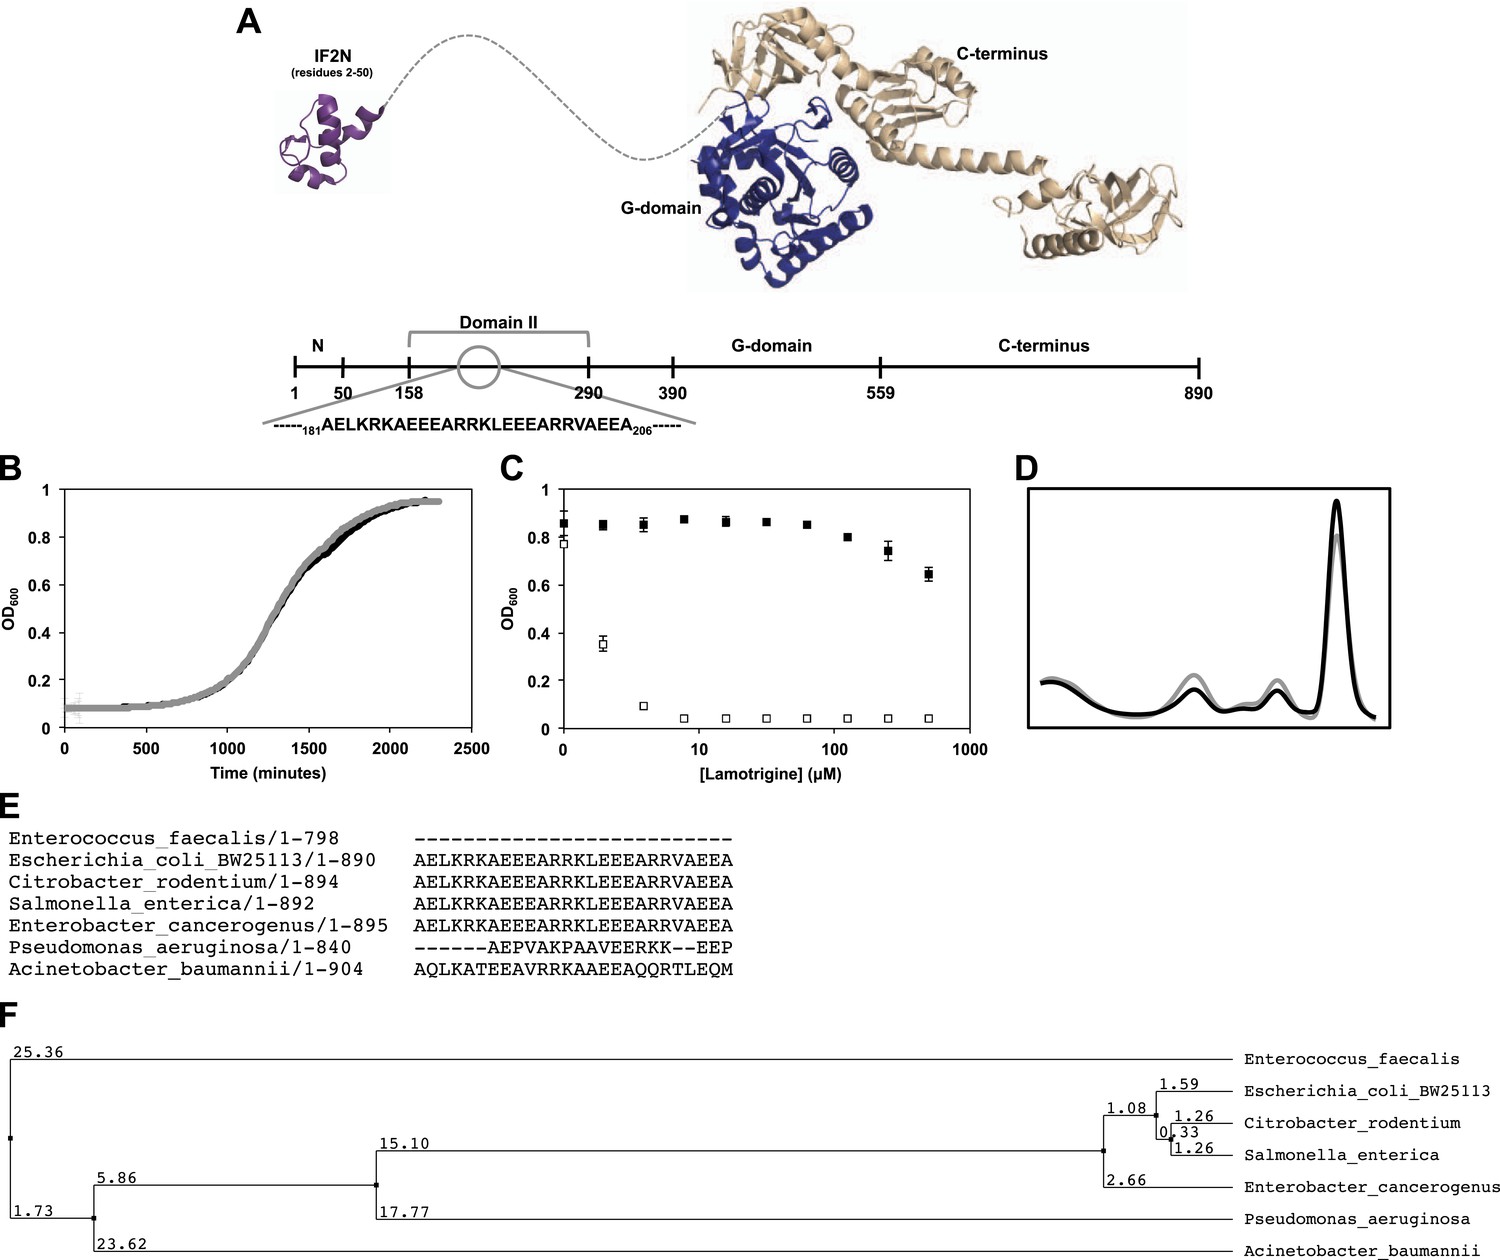
Lamotrigine binds to wild type but not mutant IF2 in a G-nucleotide-dependent manner.
(A) General domain organization of Enterobacteriaceae IF2-α with lamotrigine suppressor mutations mapped against the parental E. coli BW25113 sequence. (B) Experimental design of [3H]-lamotrigine association assay. (C) Relative association of [3H]-lamotrigine to wild-type E. coli IF2 and lamotrigine suppressor IF2 (mutant #3) under varying conditions. CPMs of the experimental samples were normalized to the baseline flow-through of [3H]-lamotrigine in buffer. Error bars represent the error of three biological replicates.
Figure 5—figure supplement 1
Genetic determinants of lamotrigine activity.
(A) Structures of E. coli IF2N (PDB 1ND9) and Methanothermobacter thermautotrophicus IF2/eIF5B (PDB 1G7R) depicting the location of lamotrigine suppressor mutations in E. coli IF2. All mutations are localized within domain II. (B) Example, growth curves of E. coli BW25113 (black trace) and lamotrigine suppressor mutant #3 (gray trace) in 150 μl LB media at 15°C shaking at 200 rpm. Cells were read at OD600 every 10 min throughout the duration of the experiment. (C) Example, potency analysis of lamotrigine against E. coli BW25113 (white dots) and lamotrigine suppressor mutant #3 (black dots) at 15°C in LB media. Cells were grown for 48 hr prior to reading OD600. Error bars represent the error of two biological replicates. (D) Example, sucrose gradient of ribosomal particles from early-log cultures of lamotrigine suppressor mutant #3 treated with 2× MIC of lamotrigine at 15°C. Cells were treated with lamotrigine and immediately pulse labeled with [14C]-uridine. Cells were harvested after 6 hr of treatment, and ribosomal particle accumulation was monitored using UV absorbance at 260 nm (black trace) and scintillation counting (gray trace). (E) IF2 homologs from various bacterial species were aligned using the MuscleWS multiple sequence alignment plugin through Jalview version 2.8. Residues 181 to 206 (E. coli numbering) are shown, depicting the conservation of this region exclusively in the Enterobacteriaceae. (F) Using Jalview, a distance tree relating the various IF2 homologs was calculated based on average distance using the percent identity. IF2 homology between the Enterobacteriaceae predicts lamotrigine potency at 15°C. See Supplementary file 2 for potency analyses.
Figure 6 with 1 supplement
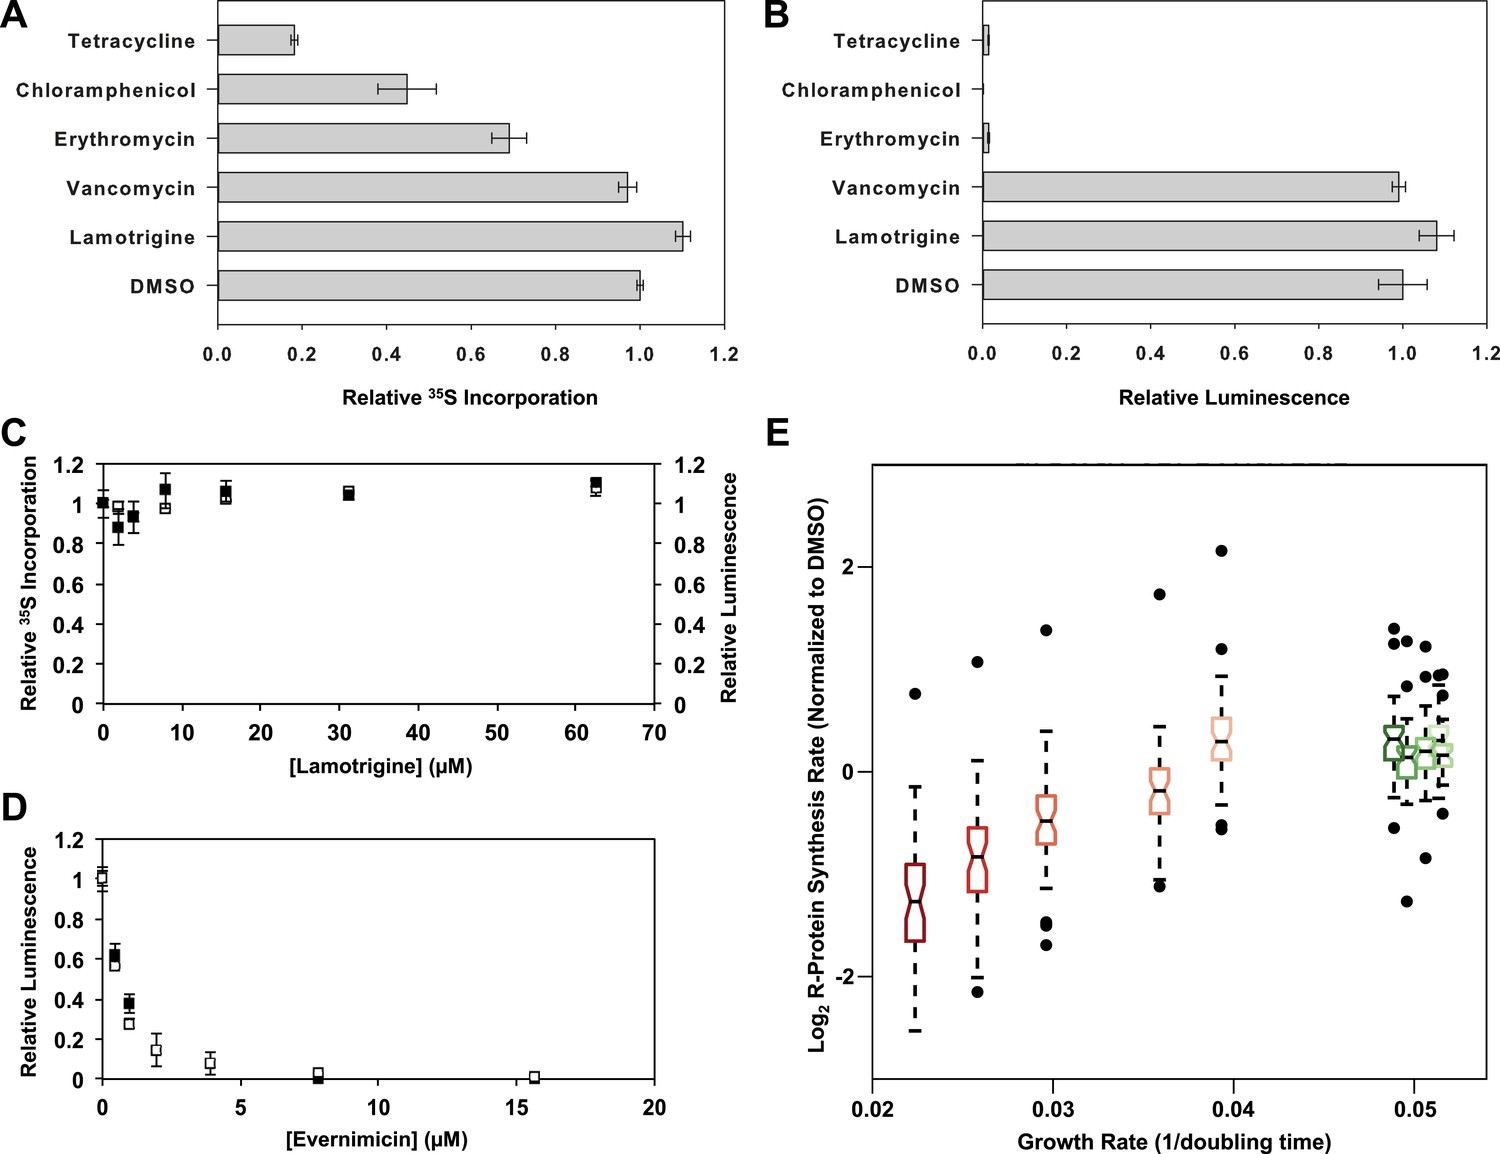
Accumulation of immature ribosomal subunits is not the result of translation inhibition.
(A) [35S]-methionine incorporation into early-log cells grown for 2.6 hr in M9 media at 15°C. Immediately prior to the radioactivity pulse, cultures were treated with 8× MIC of each antibiotic. [35S]-methionine incorporation was quantified by liquid scintillation counting. Error bars represent the error of two biological replicates. (B) Cell-free coupled transcription/translation reactions in the presence of 8× MIC of each antibiotic. Samples were incubated at 15°C for 4 hr, at which time reactions were halted on ice, excess luciferin was added, and luminescence was monitored. Error bars represent the error of two biological replicates. (C) [35S]-methionine incorporation (black dots) and cell-free luminescence (white dots) as a function of lamotrigine concentration. Samples were prepared as described in (A) and (B). (D) Cell-free coupled transcription/translation reactions in the presence of increasing concentrations of evernimicin at 37°C (black dots) and 15°C (white dots). Reactions were assembled and analyzed as in (B). (E) Analysis of growth rate and r-protein synthesis rate as a function of lamotrigine and chloramphenicol concentrations. Synthesis rates were determined for each ribosomal protein using quantitative mass spectrometry. For each condition, r-protein synthesis rates (50 measurements per treatment) are presented as a notched box and whisker plot centered at the growth rate (1/hr) observed for that treatment (‘Materials and methods’). Black dots represent synthesis rates of individual proteins in excess of (1.5 × inner quartile range) of that data set. Light to dark shades of red represent 2×, 3×, 4×, 5×, and 6× MIC of chloramphenicol. Light to dark shades of green represent 2×, 3×, 4×, 5×, and 6× MIC of lamotrigine. Values were normalized to the DMSO control and log transformed.
-
Figure 6—source data 1
In vivo r-protein synthesis rates measured using qMS.
Synthesis rates are log2 transformed after normalization to the measured synthesis rate of E. coli in the presence of DMSO. Growth rates are reported as 1/doubling time (hr).
- https://doi.org/10.7554/eLife.03574.019
Figure 6—figure supplement 1
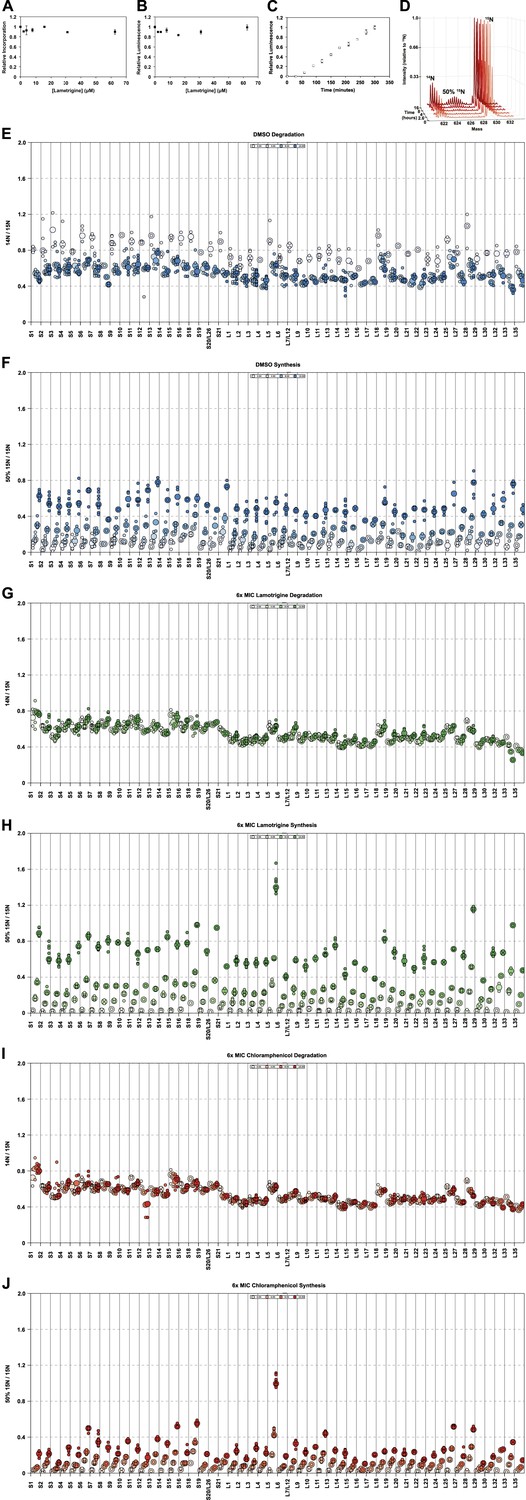
Effects of lamotrigine on translation in E. coli.
(A) [35S]-methionine incorporation into early-log cells grown for 2 hr (∼3 doublings) in M9 media at 37°C. Immediately prior to the radioactivity pulse, cultures were treated with increasing concentrations of lamotrigine. [35S]-methionine incorporation was quantified by liquid scintillation counting. Error bars represent the error of two biological replicates. (B) Cell-free coupled transcription/translation reactions in the presence of increasing concentrations of lamotrigine. Samples were incubated at 37°C for 1 hr, at which time reactions were halted on ice, excess luciferin was added, and luminescence was monitored. Error bars represent the error of two biological replicates. (C) Kinetics of cell-free transcription/translation system at 15°C. 10 μl reactions containing 1% DMSO were read every 30 min for 5 hr to establish a linear range of luciferase production. Error bars represent the error of two biological replicates. (D) Example, pulse-labeling data showing the incorporation of 50% 15N into an r-protein peptide as a function of time. Similar data were gathered for all r-protein peptides from cells treated with DMSO; 2×, 3×, 4×, 5×, and 6× MIC lamotrigine; and 2×, 3×, 4×, 5×, and 6× MIC chloramphenicol. (E) R-protein degradation as a function of time in DMSO-treated cultures. Protein degradation is defined as (14N intensity/15N intensity) for each peptide. Light shades to dark shades represent 0, 4, 8, and 16 hr of 50% 15N pulse. Small circles represent individual peptide measurements. Large circles denote the median measurement for that sample. (F) R-protein synthesis as a function of time in DMSO-treated cultures. Protein synthesis is defined as (50% 15N intensity/15N intensity) for each peptide. Light shades to dark shades represent 0, 4, 8, and 16 hr of 50% 15N pulse. (G and I) are the same as (E), except for 6× MIC lamotrigine and 6× MIC chloramphenicol, respectively. (H and J) are the same as (F), except for 6× MIC lamotrigine and 6× MIC chloramphenicol, respectively.
Figure 7
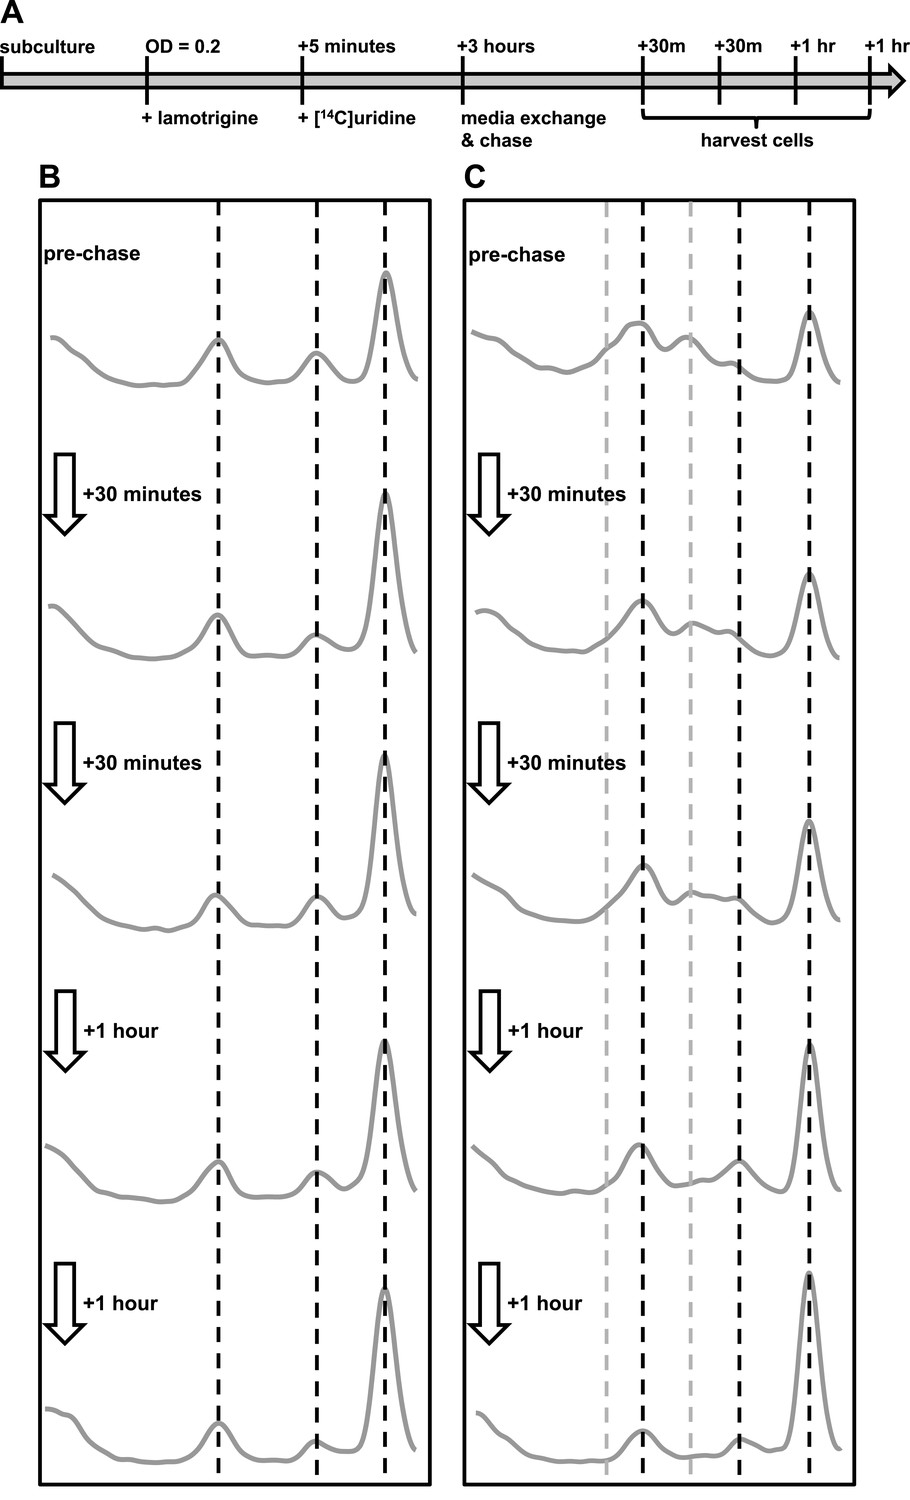
Immature ribosomal particles sediment as mature subunits upon removal of lamotrigine stress.
Particles were analyzed by sedimentation over sucrose gradients and analyzed with radioactivity detection. (A) Experimental design of pulse-chase analysis of E. coli treated with 2× MIC lamotrigine. (B) Cells were treated with DMSO and concurrently pulsed with [14C]-uridine for 3 hr in LB media at 15°C prior to media exchange and unlabeled uridine chase. This time course reveals that no additional radiolabel was incorporated into ribosomal subunits during the chase period. (C) Cells were treated as in (B), except with 2× MIC lamotrigine in place of DMSO, revealing that radiolabeled pre-30S and pre-50S particles matured to 30S and 50S particles over the duration of chase period.
Additional files
-
Supplementary file 1
Related to Figure 1. Identification of previously reported cold sensitive ribosome biogenesis genes. All genes presented have been reported as cold sensitive. The Comments column describes whether each gene deletion strain displayed cold sensitivity in our screen of the Keio collection.
- https://doi.org/10.7554/eLife.03574.022
-
Supplementary file 2
Related to Figure 5. Temperature-dependent activity of lamotrigine across bacterial species.
- https://doi.org/10.7554/eLife.03574.023
Download links
A two-part list of links to download the article, or parts of the article, in various formats.
Downloads (link to download the article as PDF)
Open citations (links to open the citations from this article in various online reference manager services)
Cite this article (links to download the citations from this article in formats compatible with various reference manager tools)
Discovery of a small molecule that inhibits bacterial ribosome biogenesis
eLife 3:e03574.
https://doi.org/10.7554/eLife.03574


