Structure of catalase determined by MicroED
- Janelia Research Campus, Howard Hughes Medical Institute, United States
Figures
Figure 1
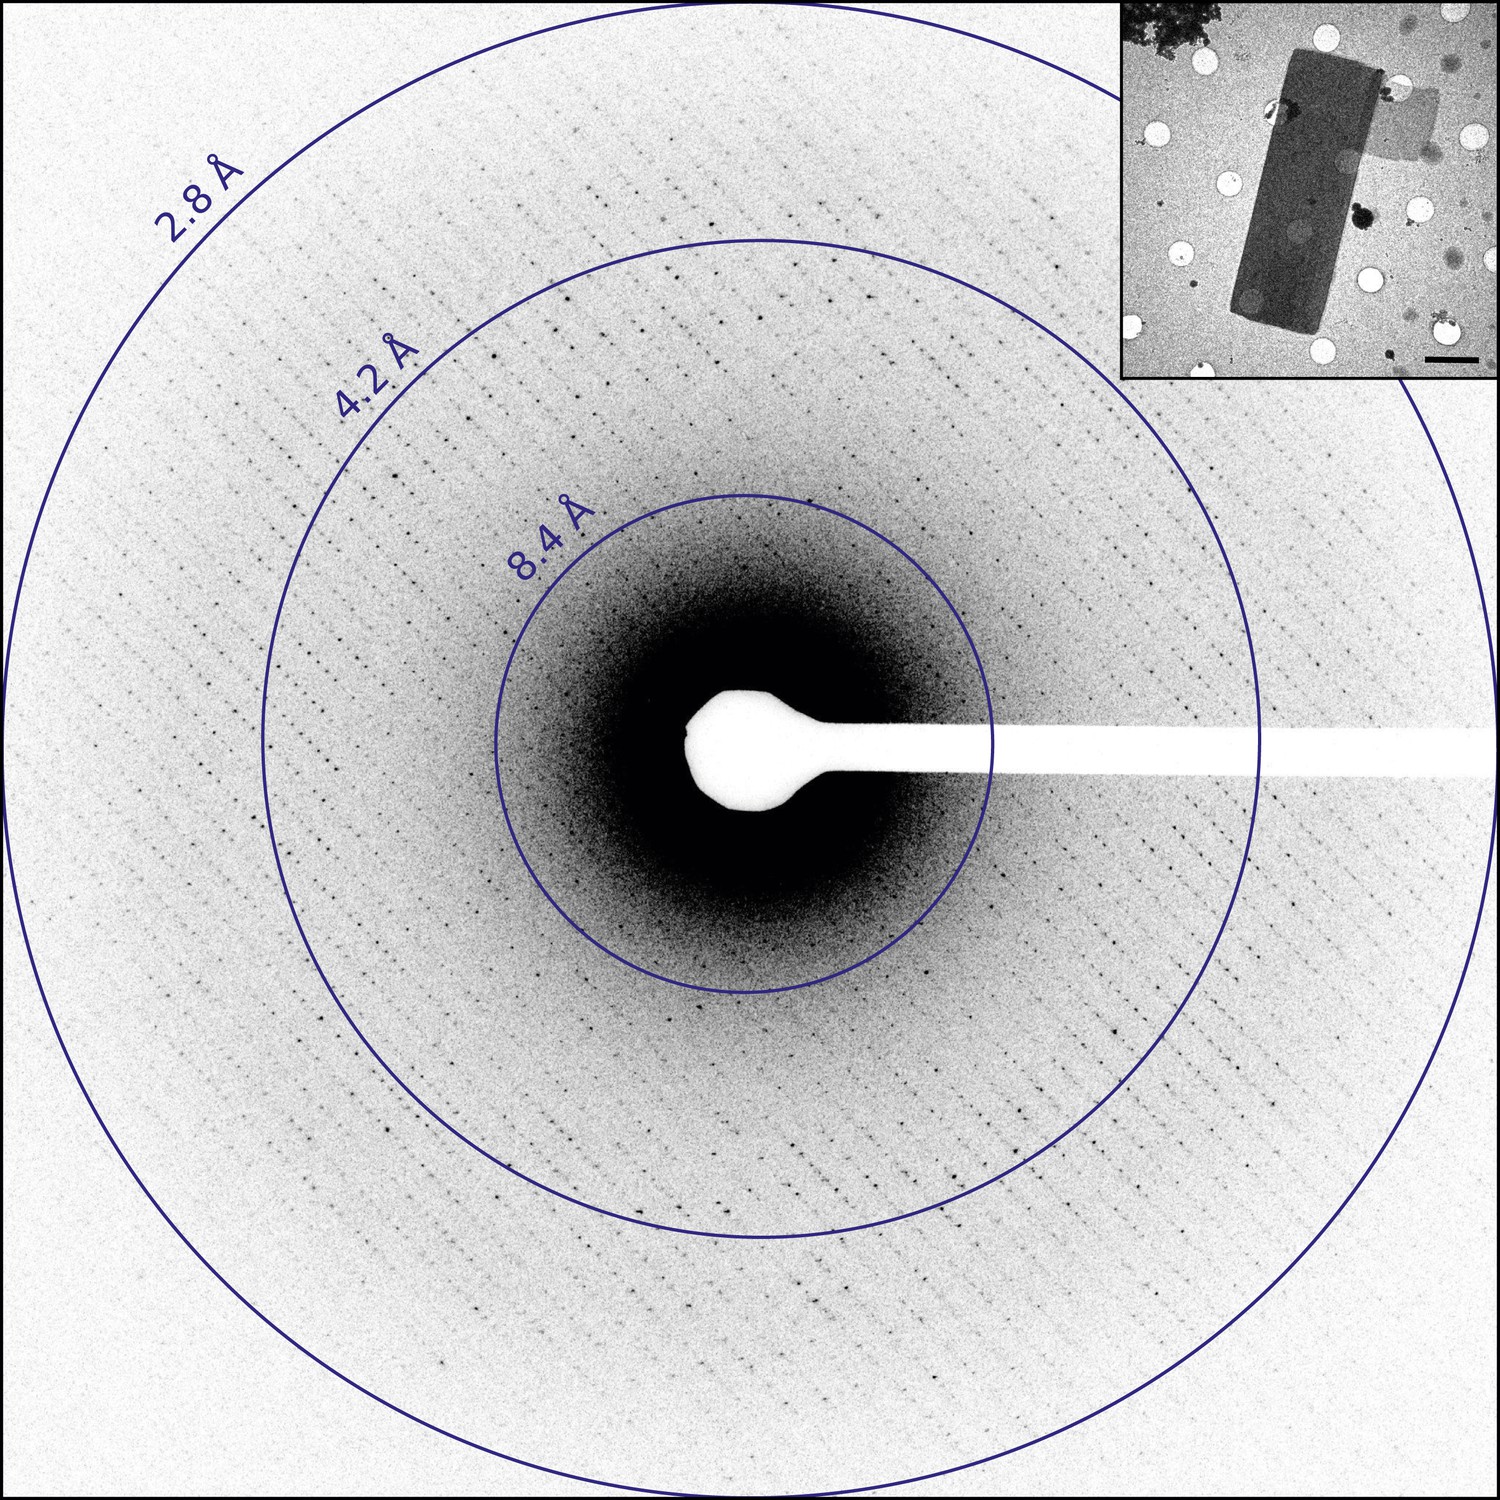
Diffraction from catalase microcrystals.
Representative untilted still diffraction pattern of a catalase microcrystal that shows sharp reflections extending to approximately 3.0 Å. Crystals of this quality were used to collect a data set by continuous rotation. Inset shows an example catalase microcrystal as seen in over-focused diffraction mode. Scale bar is 2 µm. The dimensions of most microcrystals varied between 6 and 20 µm in length, 2 and 8 µm in width, and the thickness was approximately 100–200 nm, in agreement with previous catalase crystal sizes (Dorset and Parsons, 1975b).
Figure 2 with 1 supplement
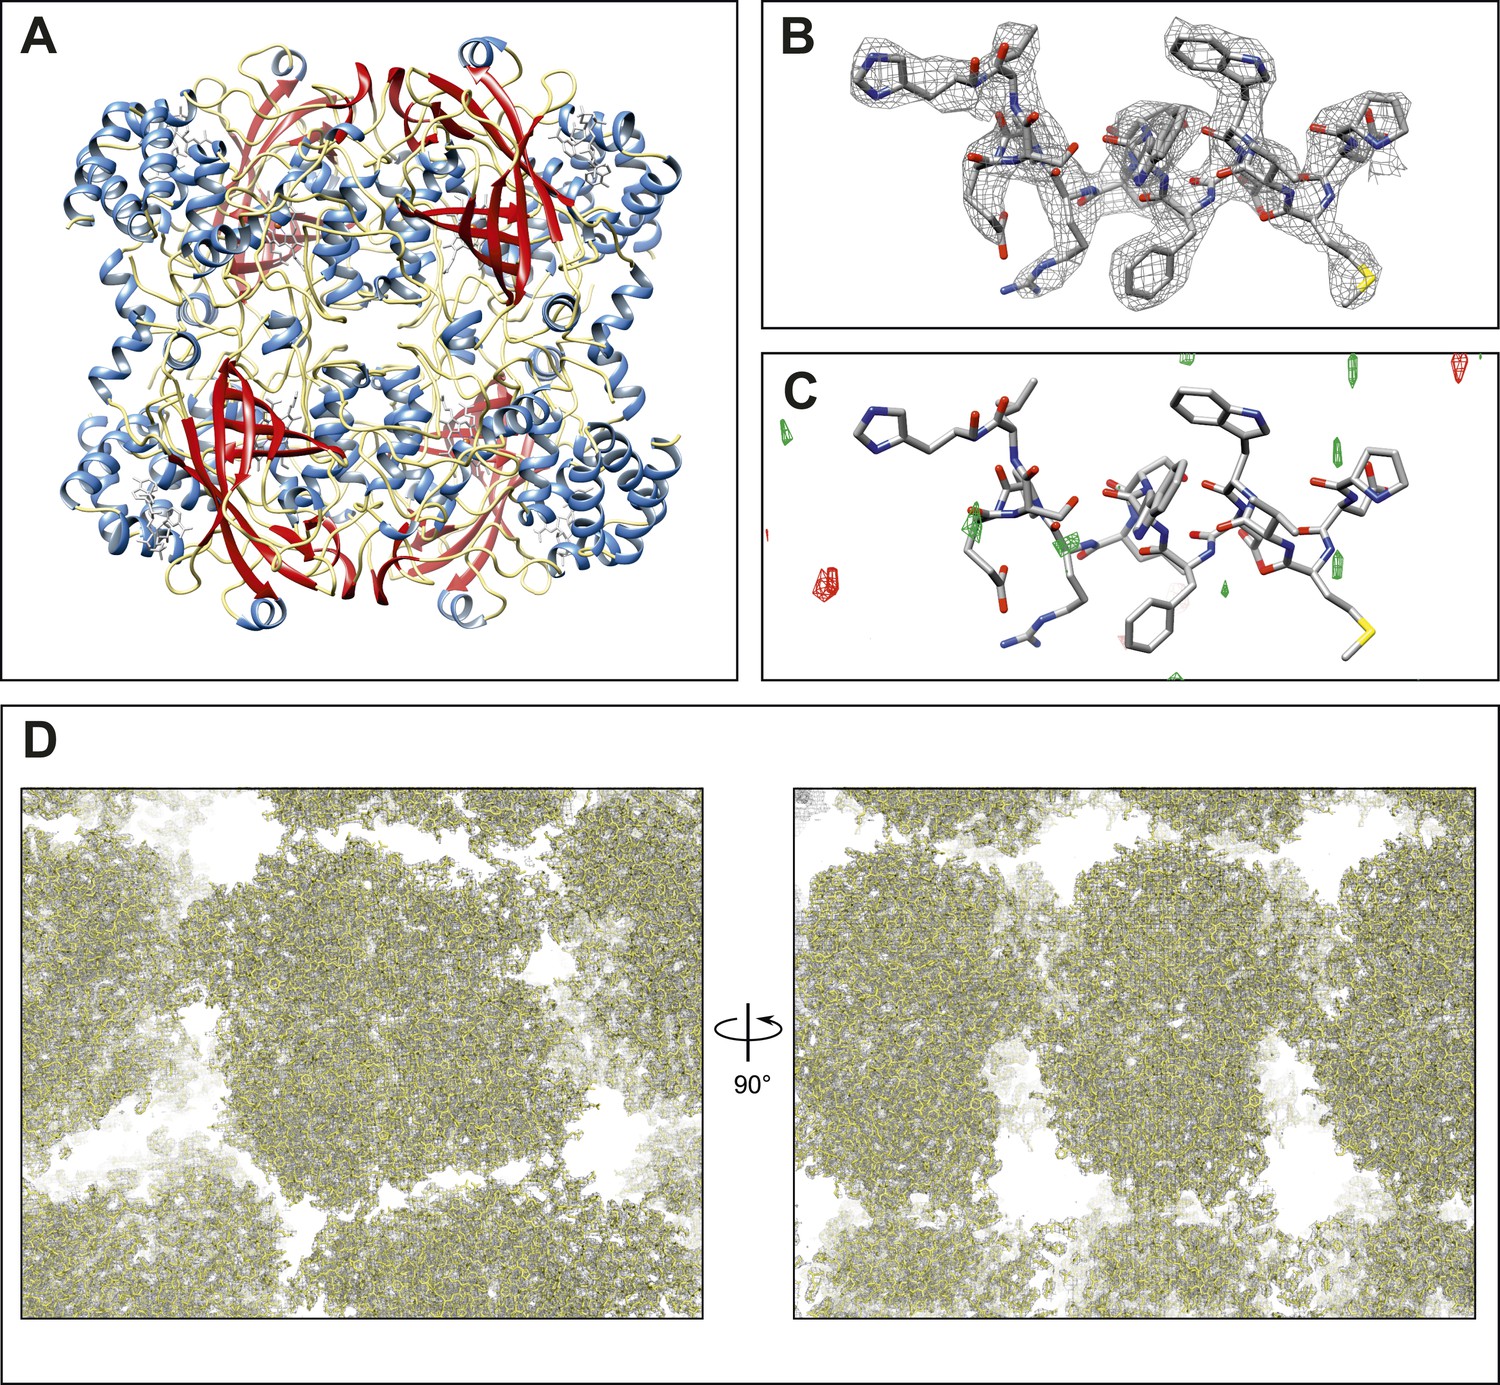
Final structure of catalase at 3.2 Å resolution determined by MircoED.
(A) The complete refined catalase structure shown as ribbons. The corresponding 2mFobs-DFcalc density map around the complete structure can be seen in Video 2. (B) The density map, contoured at 1.5 σ, around a representative region of the structure (residues 178–193 of chain A) shows well-defined density around the model. (C) The mFobs-DFcalc difference map, contoured at +2.5 σ (green) and −2.5 σ (red), around the same region shows no interpretable densities near the model indicating no obvious differences between the observed data and the calculated model. (D) Views of the density map (contoured at 1.0 σ) around a large region of the crystal lattice shows there is no significant density in the in the solvent channels of the catalase crystal.
Figure 2—figure supplement 1
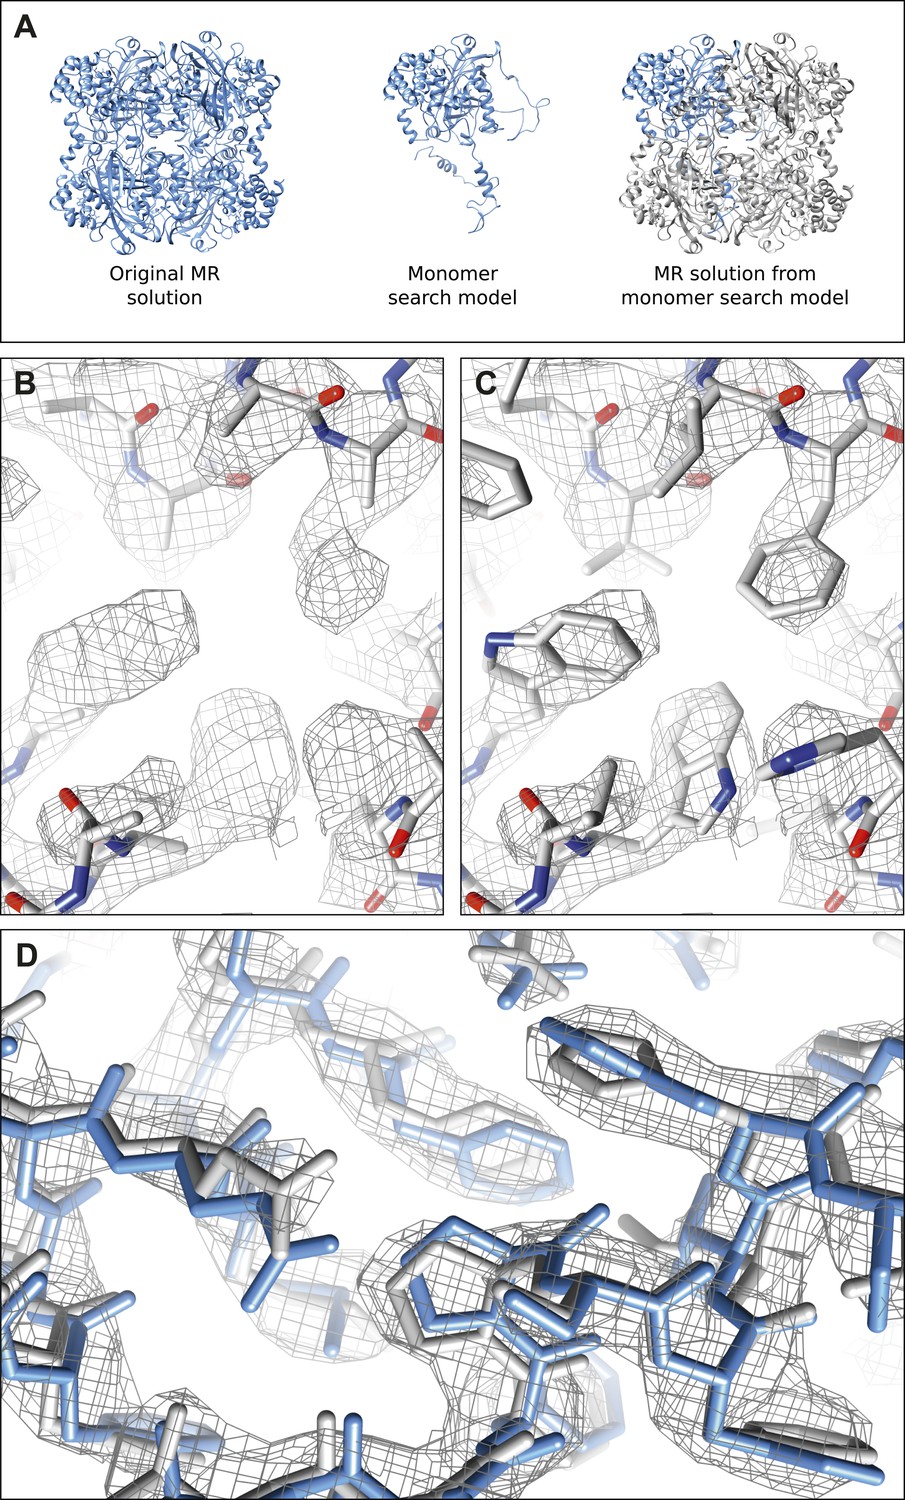
Molecular replacement validation tests.
(A) The results of the single monomer MR show that all four chains of the tetramer could be properly placed. The RMSD between this MR solution and the original MR solution from complete tetramer search model was only 0.381 Å. (B–C) The result of MR with a polyalanine model (B) shows well-defined density extending beyond the alanine model where the proper side-chains could be placed (C). (D) The model (gray) and corresponding 2mFobs-DFcalc density map (contoured at 1.5 σ) resulting from the autobuild procedure shows good agreement with our final refined model (blue) indicating the high quality of the maps from our data.
Figure 3

Final Model validation tests.
(A–D) To check for model bias in the final MicroED data (A and C), and to compare with data obtained from synchrotron X-ray diffraction (B and D), residues 181–185 (A–B) or the heme groups (C–D) from all four chains were removed prior to simulated annealing and re-refinement. In all cases, significant positive mFobs-DFcalc difference density (contoured at ±2.0 σ) can be seen for the missing regions, which are displayed in yellow for clarity, indicating no significant model bias in the final structure. (E–H) When a model (PDB ID: 3RGP; gray) lacking NADP was used to phase the MicroED data or the synchrotron x-ray data, both of which contained NADP, significant density in the mFobs-DFcalc difference map was observed although it appeared fragmented even at a lower contour level. This density could be fit with the NADP and the conformational change of residue F197 present in our final refined model is apparent. Maps presented in panels (E–H) are all unrefined, following MR.
Videos
Video 1
Catalase diffraction data set collected by continuous rotation.
Diffraction data was recorded at an exposure time of 6 s per frame from a single crystal as the stage was continuously rotating at ∼0.09° s−1.
Video 2
Final density map and model of catalase at 3.2 Å.
The 2mFobs-DFcalc density map contoured at 1.5 σ shows good agreement with the final refined model.
Tables
Table 1
Resolution and completeness for catalase data sets
| Crystal 1 | Crystal 2 | Crystal 3 | Crystal 4* | Crystal 5 | |
|---|---|---|---|---|---|
| Resolution (Å) | 27.9–2.8 | 21.1–2.9 | 16.4–2.9 | 21.2–3.0 | 20.8–3.5 |
| (3.0–2.8) | (3.0–2.9) | (3.0–2.9) | (3.1–3.0) | (3.9–3.5) | |
| Unit cell dimensions | |||||
| a (Å) | 68.7 | 68.5 | 67.8 | 67.8 | 67.9 |
| b (Å) | 170.4 | 170.1 | 171.1 | 172.1 | 171.3 |
| c (Å) | 205.0 | 203.6 | 204.5 | 182.1 | 202.3 |
| α = β = γ (°) | 90 | 90 | 90 | 90 | 90 |
| Completeness (%) | 30.2 | 28.1 | 51.7 | 76.5 | 61.6 |
| (37.1) | (24.0) | (42.2) | (62.4) | (56.9) | |
-
Values in parentheses reflect the highest resolution shell.
-
*
Data set used for final structure.
Table 2
Comparison of merging and refinement statistics for catalase data sets
| Multi-2.8 Å | Multi-3.0 Å | Multi-3.2 Å | Single-3.0 Å | Single-3.2 Å* | |
|---|---|---|---|---|---|
| Total crystals | 5 | 5 | 5 | 1 | 1 |
| Resolution (Å) | 27.8–2.8 | 27.8–3.0 | 27.8–3.2 | 21.2–3.0 | 21.2–3.2 |
| (2.9–2.8) | (3.1–3.0) | (3.4–3.2) | (3.1–3.0) | (3.4–3.2) | |
| Rmerge (%) | 25.8 | 25.5 | 24.8 | 18.7 | 17.5 |
| (42.0) | (41.2) | (38.2) | (38.8) | (32.7) | |
| CC1/2 | 0.906 | 0.920 | 0.933 | 0.886 | 0.891 |
| (0.231) | (0.348) | (0.574) | (0.426) | (0.555) | |
| Multiplicity | 4.8 | 5.2 | 5.6 | 2.4 | 2.4 |
| (2.0) | (3.1) | (3.6) | (2.2) | (2.3) | |
| Completeness (%) | 71.8 | 78.1 | 80.1 | 76.5 | 79.4 |
| (35.2) | (61.8) | (72.2) | (62.4) | (75.5) | |
| Mean (I/σ(I)) | 3.2 | 3.4 | 3.5 | 3.2 | 3.4 |
| (2.5) | (2.2) | (2.1) | (1.7) | (2.0) | |
| Rwork/Rfree | 36.1/39.2 | 37.1/38.4 | 34.6/37.3 | 27.3/31.9 | 26.2/30.8 |
-
Values in parentheses reflect the highest resolution shell.
-
*
Data set used for final structure.
Table 3
Data collection and refinement statistics
| Data Collection | |
| Excitation voltage | 200 kV |
| Electron source | Field emission gun |
| Wavelength (Å) | 0.025 |
| Total dose per crystal (e−/Å2) | ∼6.8 |
| Frame rate (frame/s) | 1/6 |
| Rotation rate (°/s) | 0.09 |
| Angular range per frame (°/s) | 0.54 |
| No. crystals used | 1 |
| Total angular range collected (°) | ∼61 |
| Merging Statistics* | |
| Space group | P212121 |
| Unit cell dimensions | |
| a, b, c (Å) | 67.8, 172.1, 182.1 |
| α = β = γ (°) | 90 |
| Resolution (Å) | 21.2–3.2 (3.4–3.2) |
| Total reflections | 67,064 (9873) |
| Rmerge (%) | 17.5 (32.7) |
| Total unique reflections | 28,143 (4278) |
| Multiplicity | 2.4 (2.3) |
| Completeness (%) | 79.4 (75.5) |
| Mean (I/σ(I)) | 3.4 (2.0) |
| CC1/2 | 0.891 (0.555) |
| Data Refinement | |
| Reflections in working set | 26,732 |
| Reflections in test set | 1369 |
| Rwork/Rfree (%) | 26.2/30.8 |
| RMSD bonds (Å) | 0.006 |
| RMSD angles (°) | 1.05 |
| Ramachandran (%)† | |
| (Favored, allowed, outlier) | 96.6; 3.3; 0.1 |
-
*
Values in parentheses reflect the highest resolution shell.
-
†
Statistics given by MolProbity (Chen et al., 2010).
Download links
A two-part list of links to download the article, or parts of the article, in various formats.
Downloads (link to download the article as PDF)
Open citations (links to open the citations from this article in various online reference manager services)
Cite this article (links to download the citations from this article in formats compatible with various reference manager tools)
Structure of catalase determined by MicroED
eLife 3:e03600.
https://doi.org/10.7554/eLife.03600


