TAF4, a subunit of transcription factor II D, directs promoter occupancy of nuclear receptor HNF4A during post-natal hepatocyte differentiation
- Institut de Genetique et de Biologie Moleculaire et Cellulaire, CNRS/INSERM/UDS, France
- Aix-Marseille Université, UMR1090, France
- INSERM, UMR1090, France
Figures
Figure 1 with 1 supplement
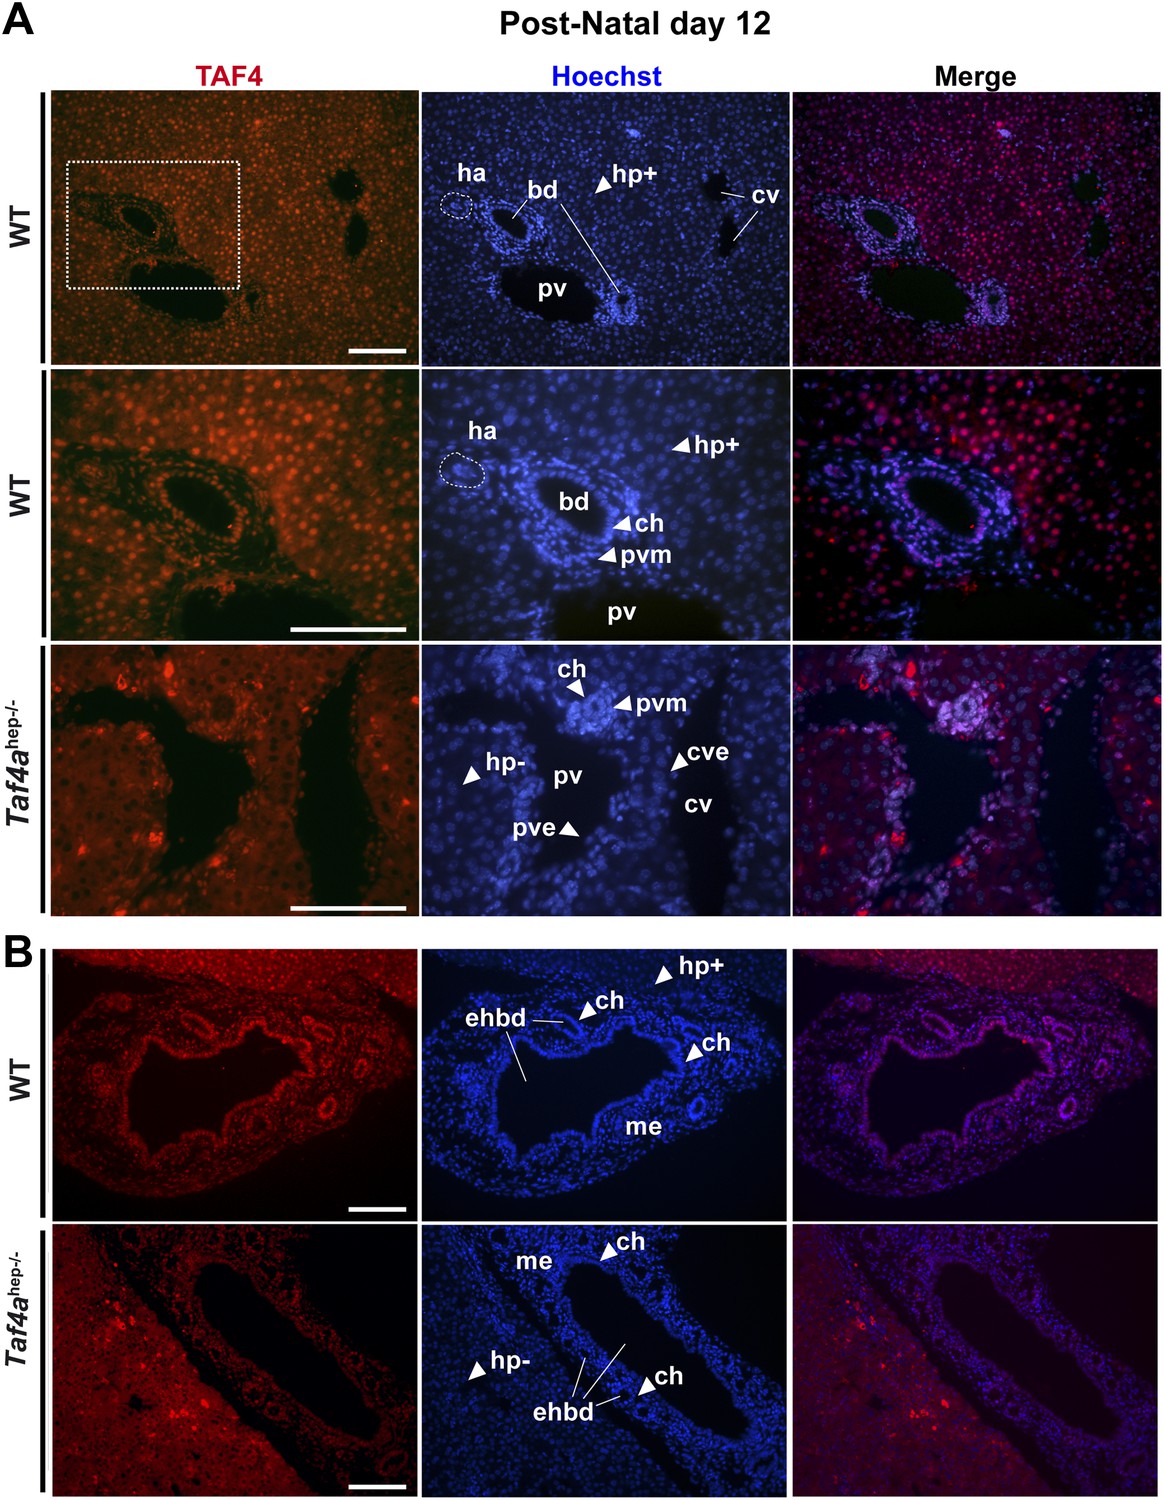
Expression of TAF4 in neonatal liver.
(A) The first two panels show immunostaining for TAF4 in sections of WT liver at P12, while the third panel shows immunostaining in sections from TAF4 mutant liver. The boxed region in the upper panel is blown up in the lower panel. Bd; bile duct, ha; hepatic artery, pv; portal vein, and cv; central vein, Hp+; TAF4-expressing hepatocyte, Hp−; TAF4 negative hepatocyte after Cre-mediated inactivation, ch; cholangiocyte, pvm; portal vein mesenchyme, cve; central vein endothelium. (B) Immunofluorescence for TAF4 expression in sections through WT and Taf4ahep−/− liver illustrating persistent expression in the extra-hepatic bile duct (ehbd) cholangiocytes and associated mesenchyme (scale bar = 100 µm).
Figure 1—figure supplement 1
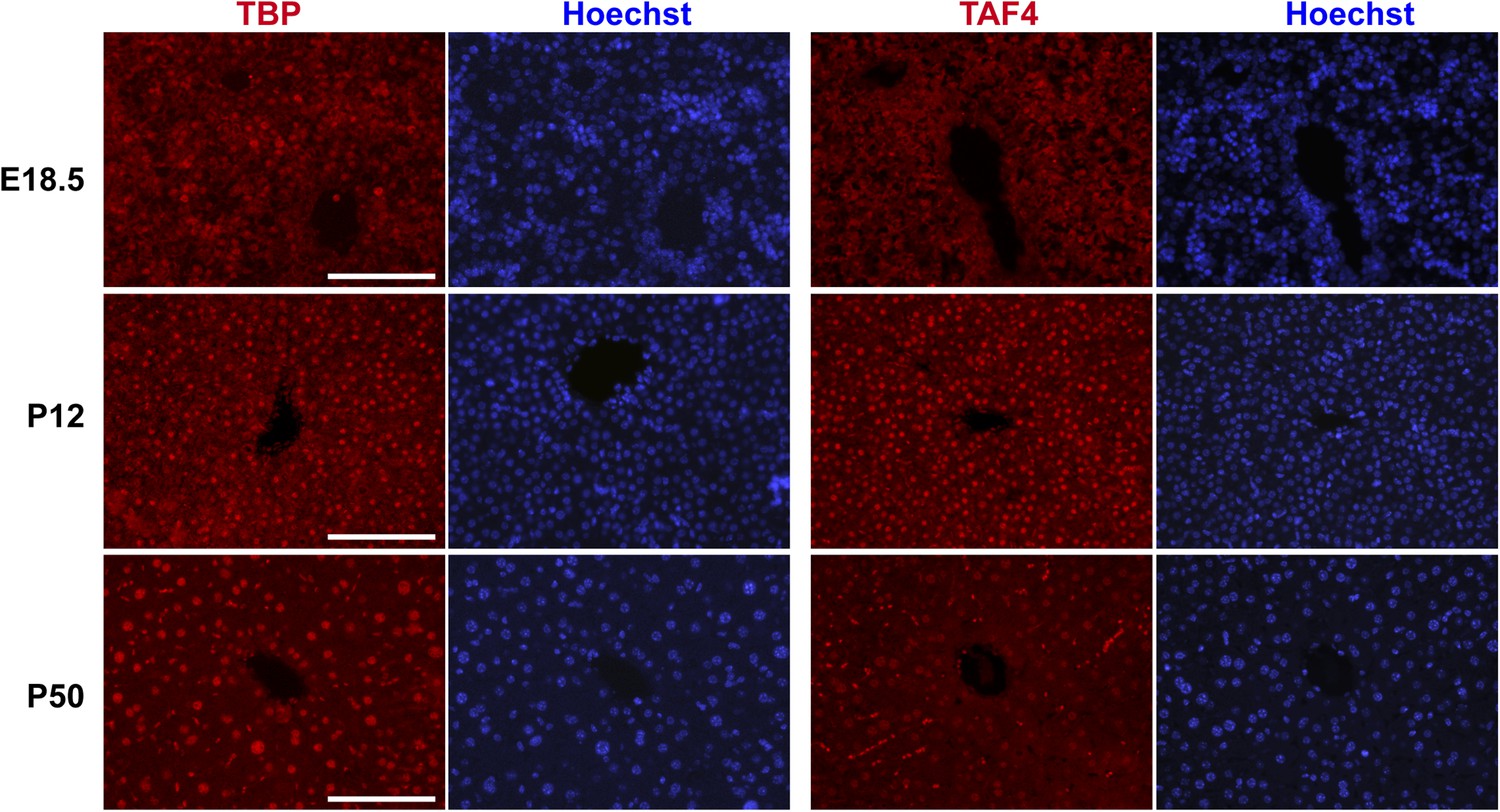
Comparison of TBP and TAF4 expression in late embryonic to adult stage liver.
Immunostaining for TBP or TAF4 in WT livers at the indicated stages (scale bar = 100 µm).
Figure 2 with 1 supplement
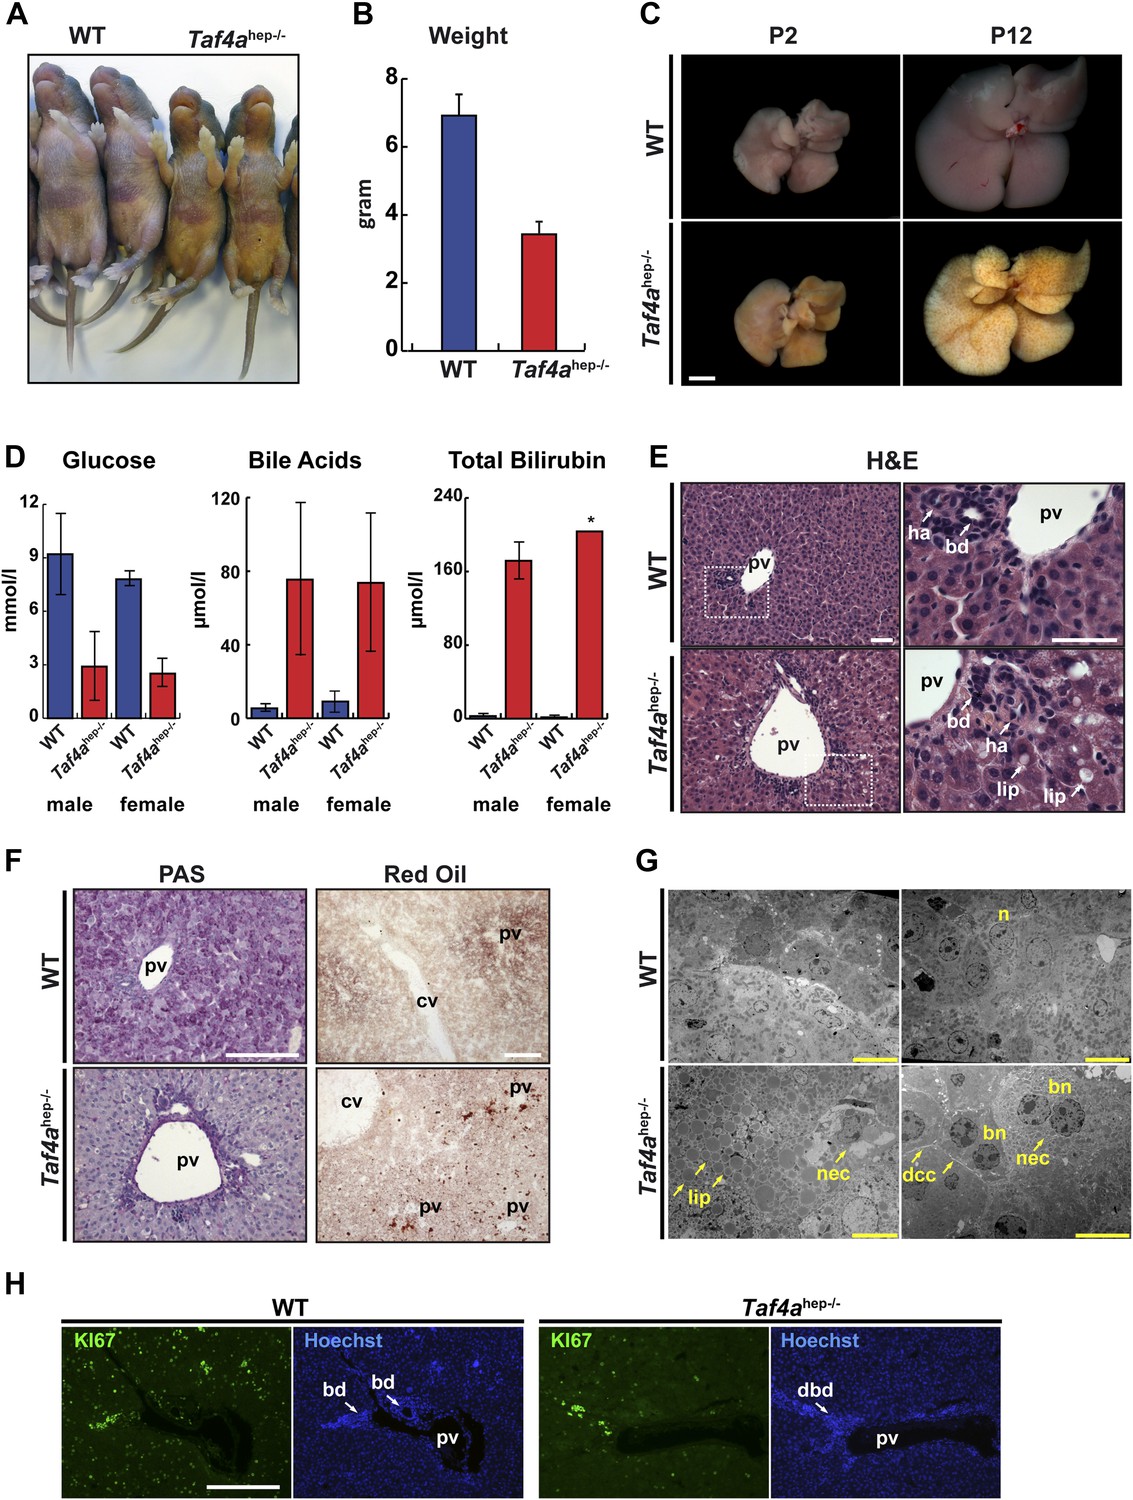
Physiopathology of TAF4 inactivation in post-natal hepatocytes.
(A) WT and Taf4ahep−/− animals at P4. (B) Body weight of WT and Taf4ahep−/− animals at P12, N = 20. (C) Livers from animals at P2 and 12 (scale bar = 2 mm). (D) Analysis of serum from WT and Taf4ahep−/− animals for the indicated parameters at P10, N = 6. (E) Hematoxylin–eosin staining of liver sections. Right panel shows a higher resolution of the boxed area of the left panel (scale bar = 30 µm). Pv; portal vein, bd; bile duct, dbd; defective bile duct; ha; hepatic artery, lip; lipid droplets. (F) Periodic acid–Schiff and oil red O staining of livers (scale bar = 100 µm). Cv; central vein. (G) Electron micrographs of livers (scale bar = 10 µm). Nec; necrosis, n; nucleus, bn; bi-nucleate cell, dcc; defective cell–cell-contacts.
Figure 2—figure supplement 1
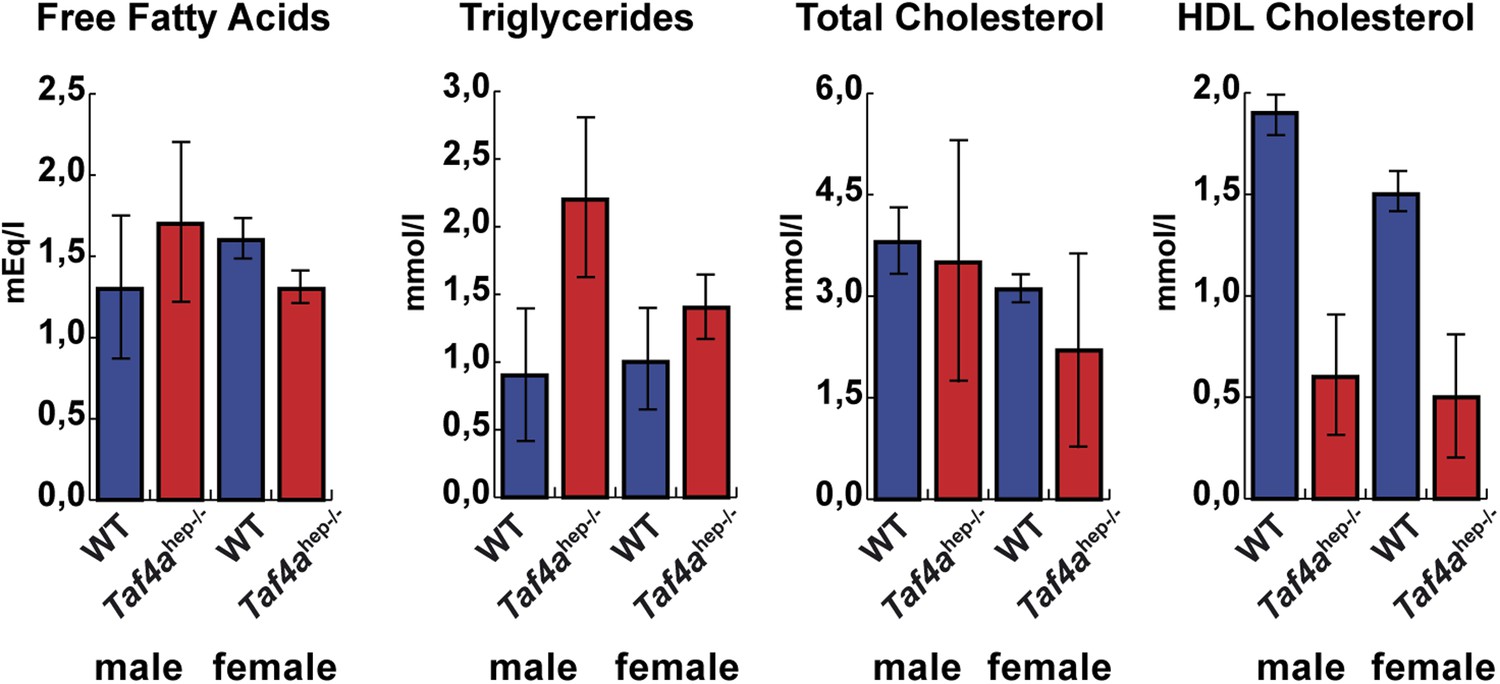
Physiopathology of TAF4 inactivation in post-natal hepatocytes.
Analysis of serum from WT and Taf4ahep−/− animals for the indicated parameters at P10, N = 6.
Figure 3 with 1 supplement
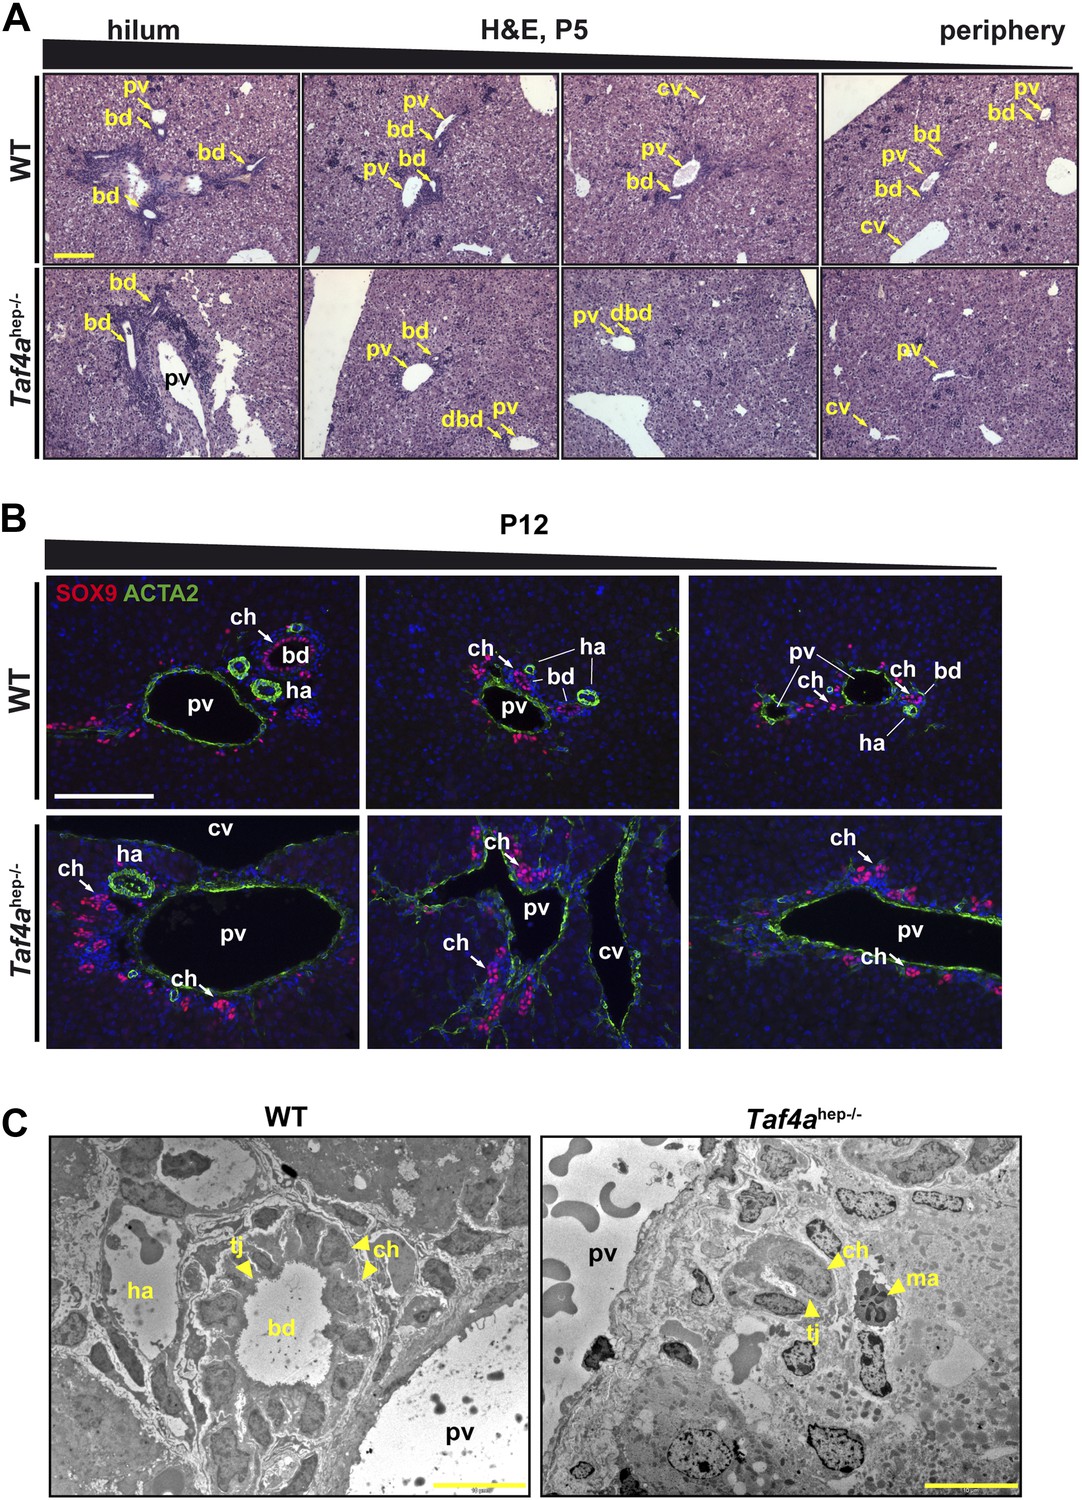
Bile duct paucity.
(A) Hematoxylin–eosin staining of livers at P5 from the hilum towards the periphery as indicated (scale bar = 100 µm). (B) Immunofluorescence for SOX9 and ACTA2 in sections through WT and Taf4ahep−/− liver at P12 from the hilum towards the periphery as indicated (scale bar = 100 µm). (C) Electron micrographs illustrating bile ducts in WT and Taf4ahep−/− liver showing a normal duct with lumen in WT and defective ducts in the mutant lacking normal lumen (scale bar = 10 µm). pv; portal vein, bd; bile duct, cv; central vein, ha; hepatic artery, tj; tight junction, ch; cholangiocytes, ma; infiltrating macrophage.
Figure 3—figure supplement 1
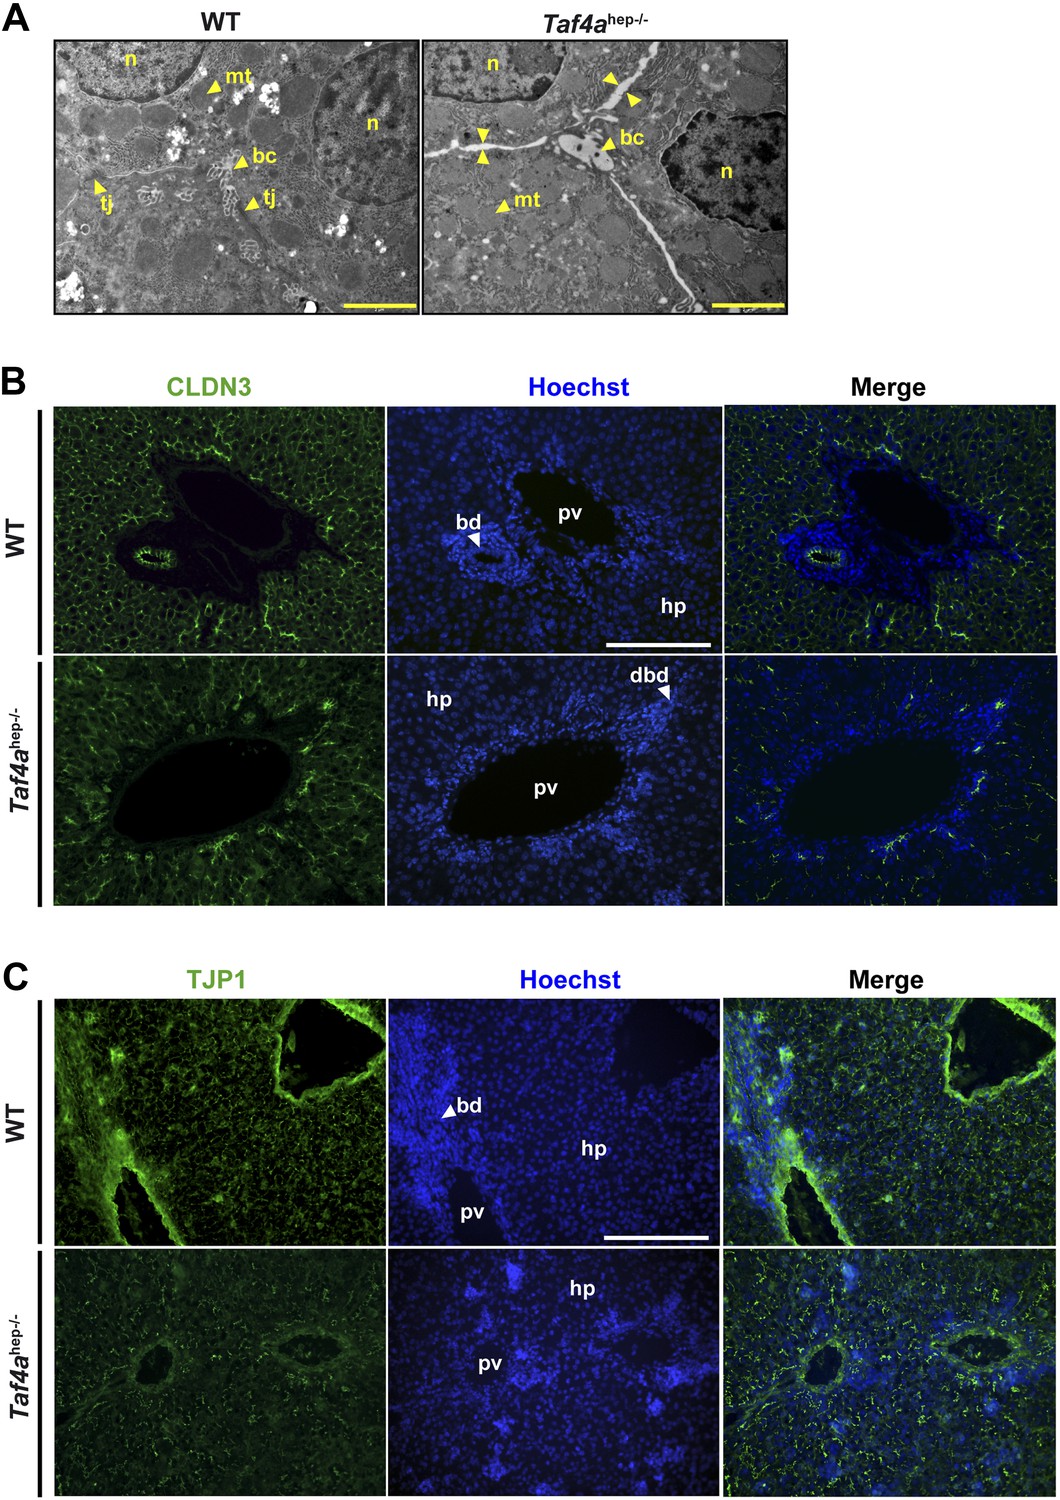
Defective tight junction formation and loss of bile–blood barrier.
(A) Electron micrographs of sections from WT and Taf4ahep−/− liver at P12. Tj; tight junction, mt; mitochondria, bc; bile canaliculus, n; nucleus. Double arrows indicate regions of enhanced intercellular space (scale bar = 2 µm). (B and C) Immunofluorescence for tight junction components CLDN3 and TJP1 in sections of WT and Taf4ahep−/− livers at P12 (scale bar = 100 µm).
Figure 4 with 1 supplement
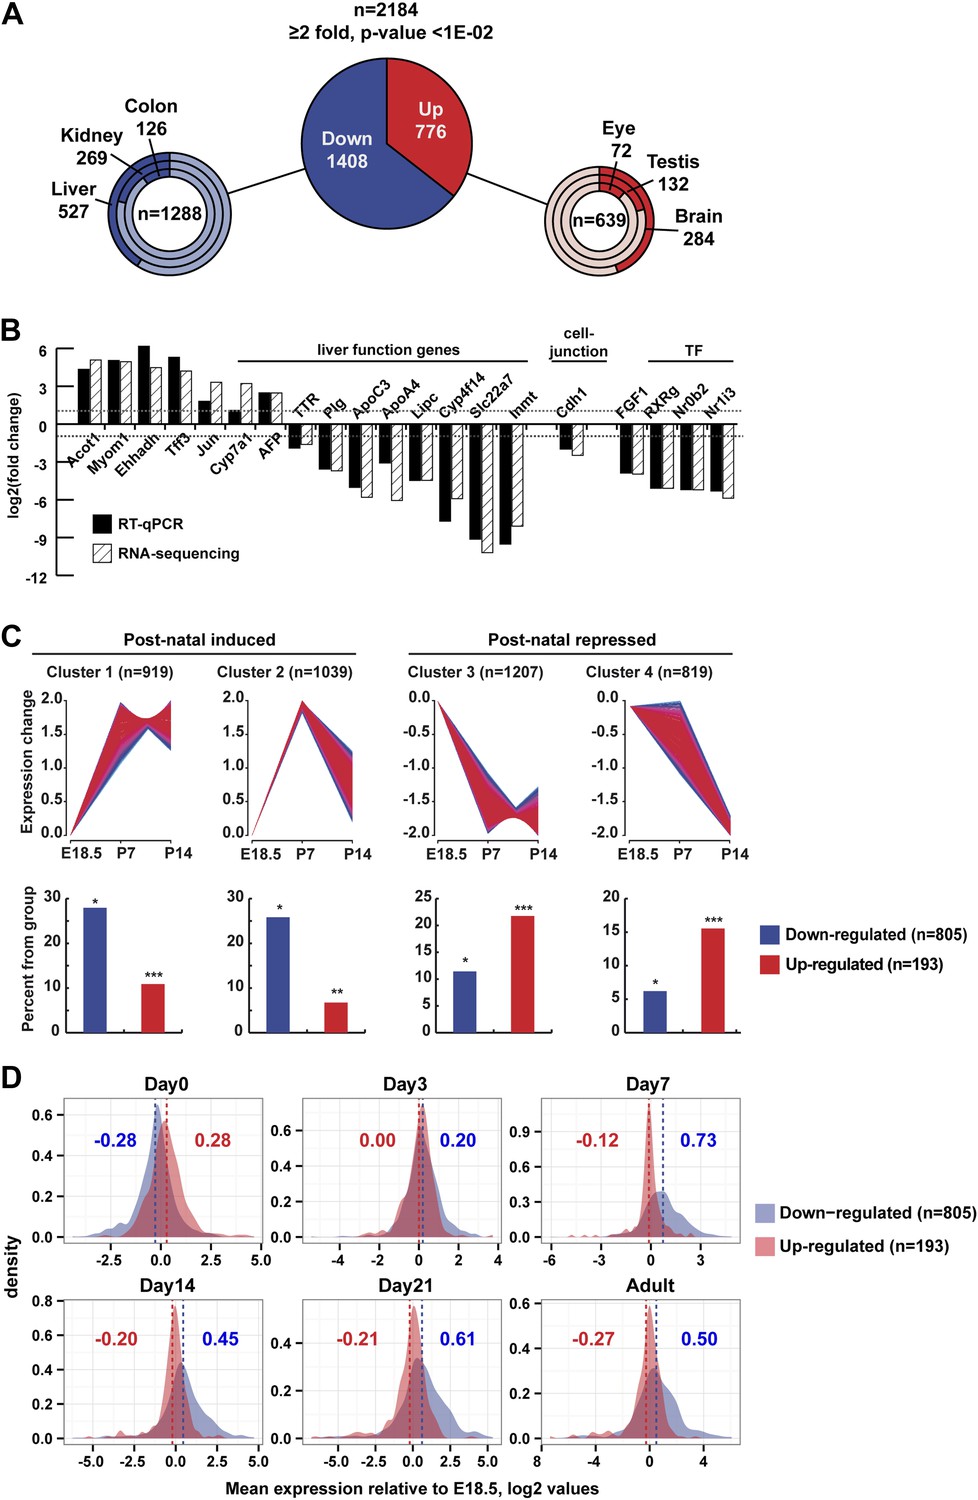
Gene expression.
(A) Ontology of up- and down-regulated genes. (B) Comparison of gene expression changes measured by RNA-seq and qPCR. (C) Assignment of deregulated transcripts to clusters determined by their expression kinetics during normal liver development at the indicated stages. Gene expression data for last day of embryonic development (E18.5), P7 and P14, was normalized to have a mean of 0 and a SD of 1 and clustered using fuzzy c-means clustering (Futschik and Carlisle, 2005) implemented in the mfuzz R package. The number of clusters was decided empirically. Each cluster was then overlapped with the down- and up-regulated genes from our RNA-seq. The significance of cluster assignments was assessed by calculation of the hypergeometric p-value. The number of up- and down-regulated genes included in the public data is indicated along with the % of each class present in the cluster (hypergeometric tests p-values: *p < 1e−06, **p < 1e−04, ***p < 0.05). (D) The Log2 mean expression value during neonatal stages for up- and down-regulated genes relative to their expression at E18.5. The mean expression of down-regulated genes increased after birth, whereas that of the up-regulated genes decreased.
Figure 4—figure supplement 1
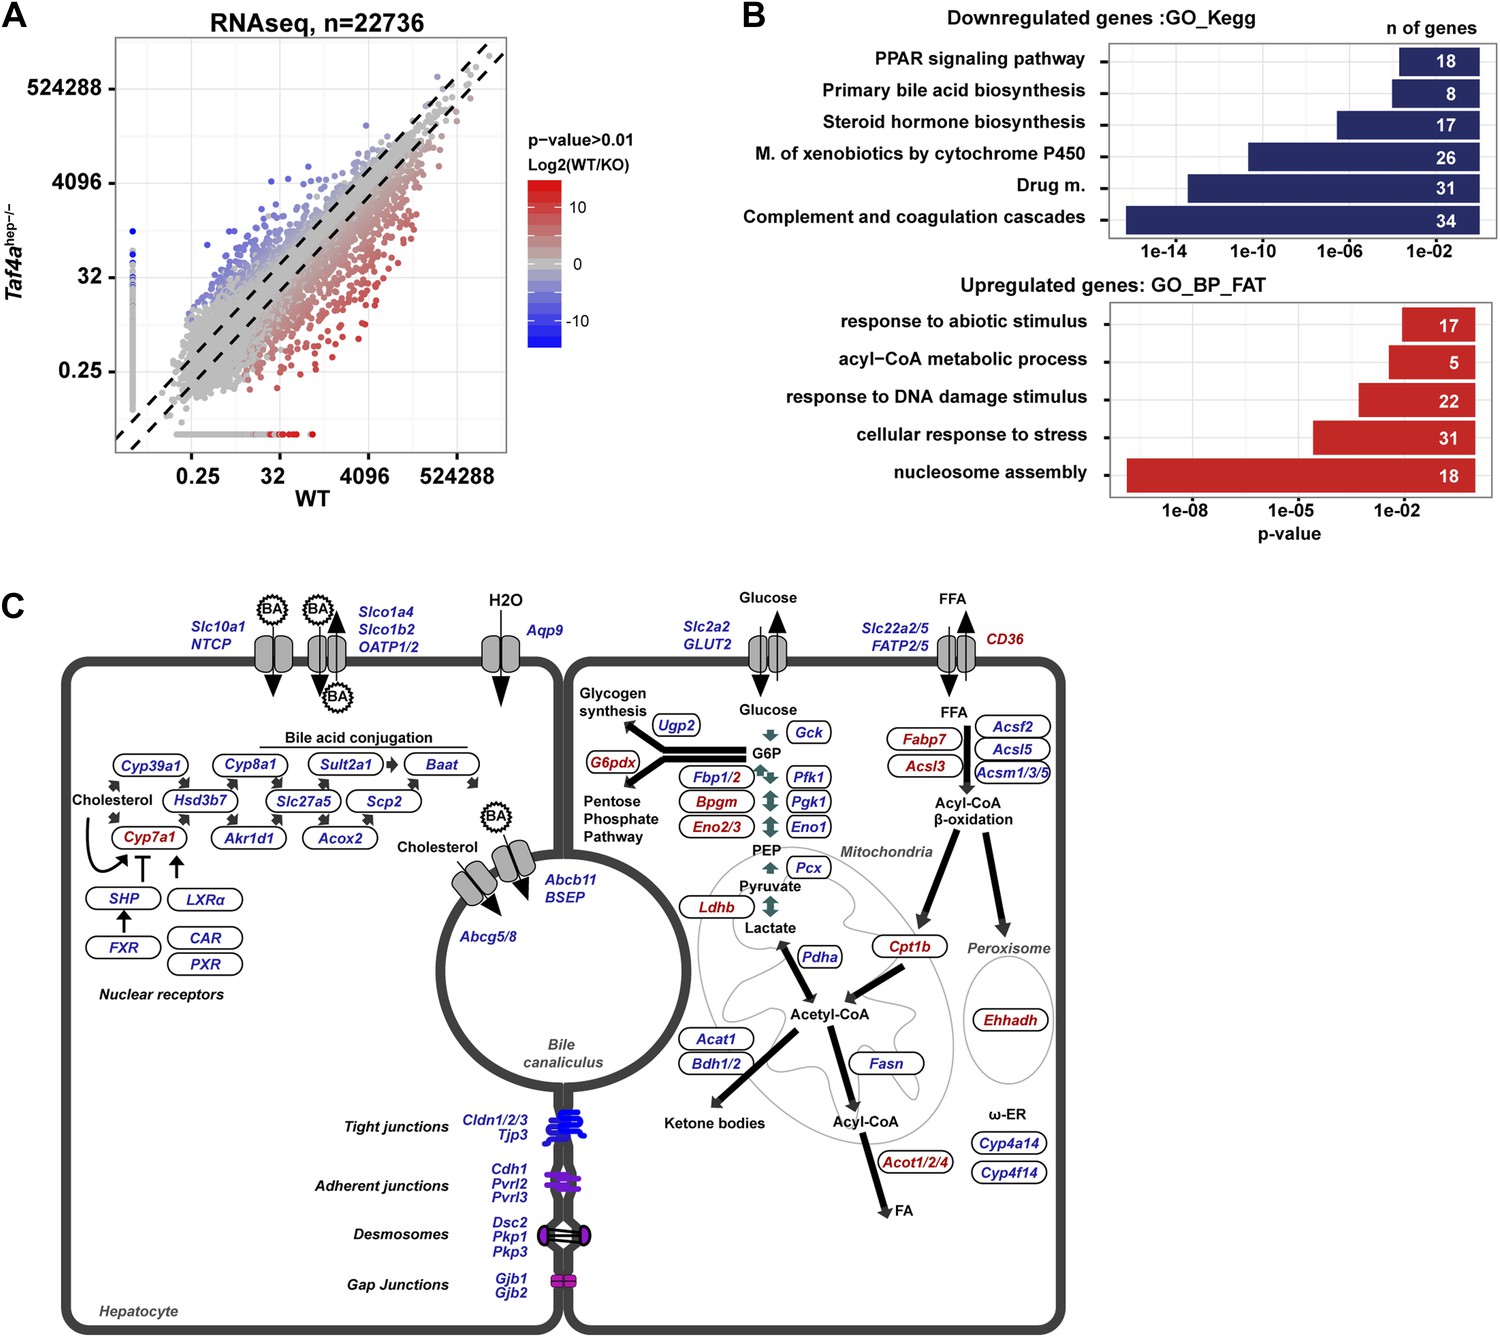
Deregulated gene expression in Taf4ahep−/− liver.
(A) RNA-seq comparison of gene expression in WT and TAF4-mutant liver. (B) Ontology analysis of the up- and down-regulated transcripts. (C) Schematic integration of deregulated genes in metabolic pathways and cell structure. Down-regulated genes are in blue and up-regulated genes in red.
Figure 5
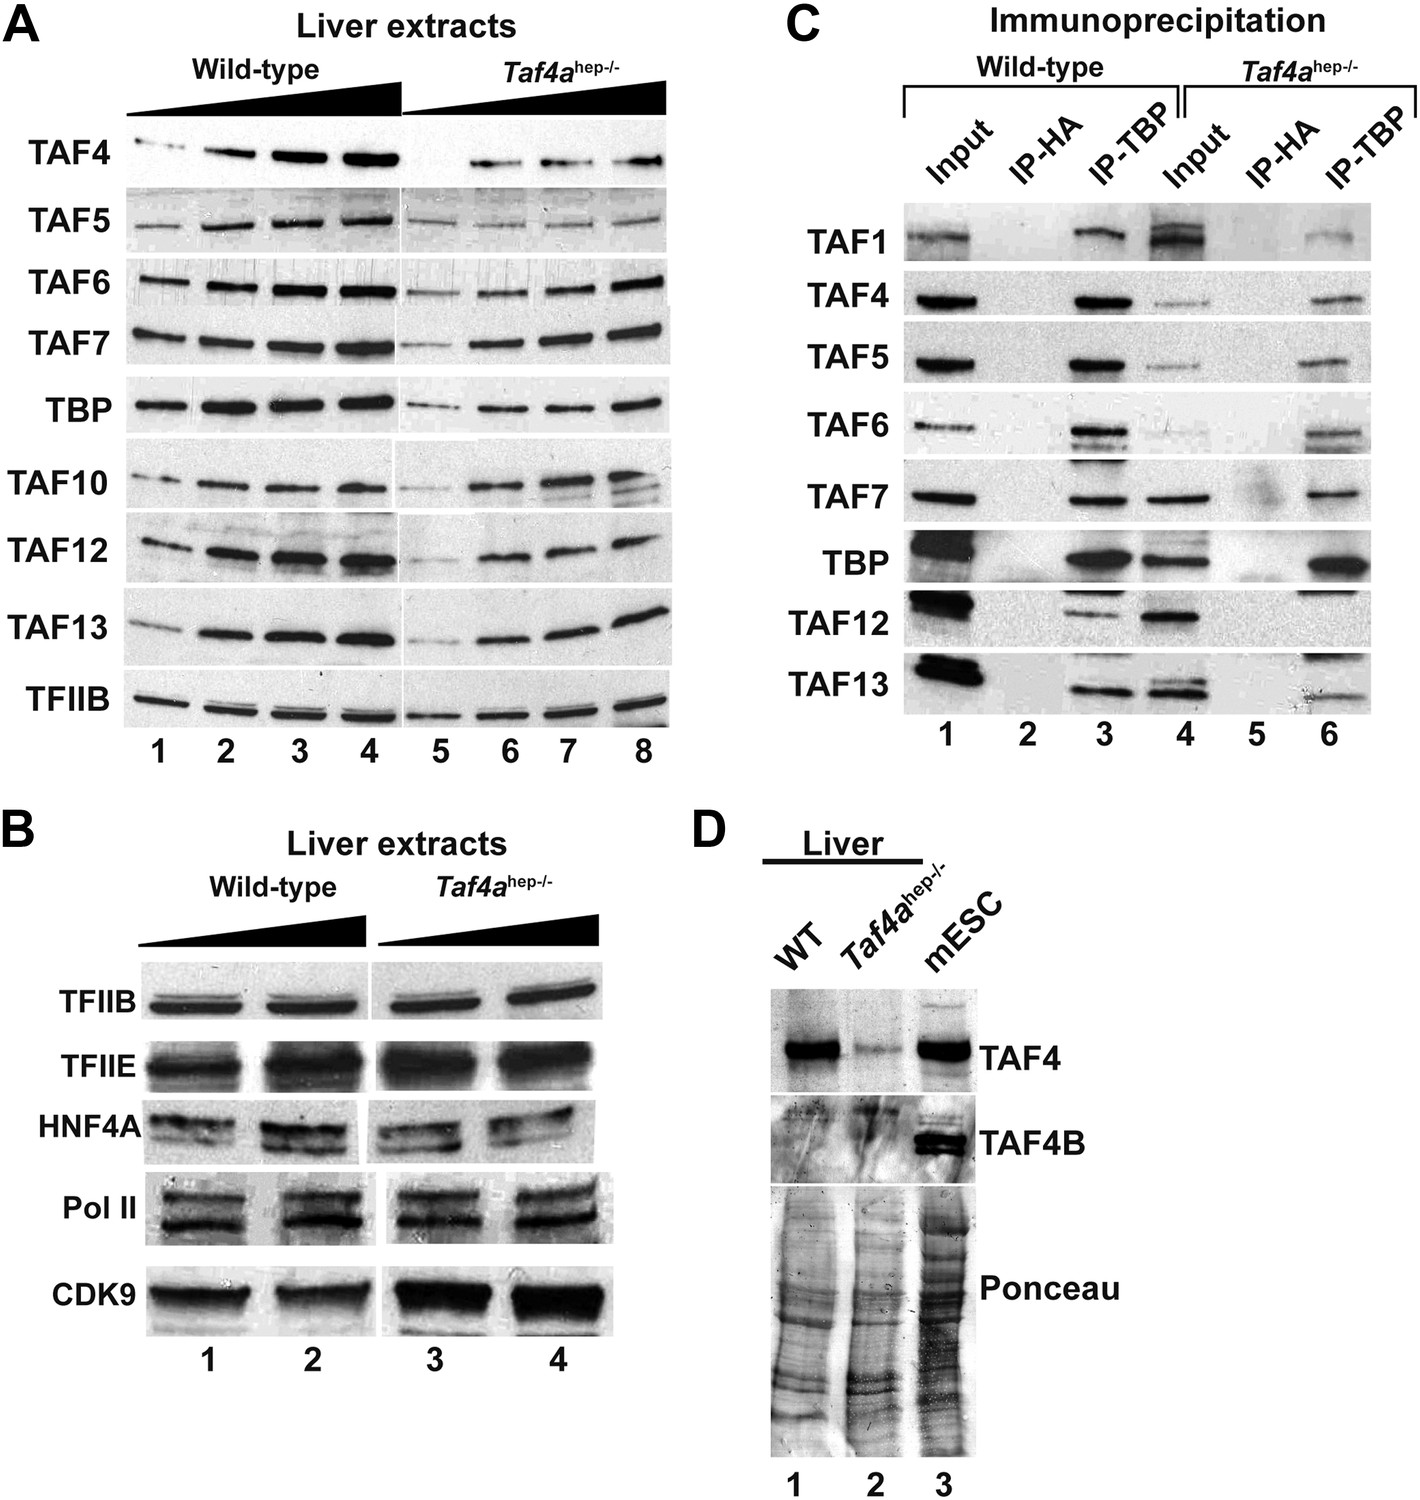
Expression and integrity of TFIID.
(A and B) Expression of TBP and TAFs in liver nuclear extracts (10, 20, 30, 40 µg in A and 20 and 40 µg in B). (C) Expression of the indicated TAFs in the input, the control anti-HA IP, and the anti-TBP IP. (D) Absence of TAF4B in the wild-type and TAF4-mutant liver extracts. An extract from mouse embryonic stem cells (mESC) was used as a positive control where TAF4B can be clearly detected.
Figure 6 with 1 supplement

Defective pre-initiation complex formation.
(A and B) Genomic occupancy of the indicated factors and of H3K4me3 in WT and Taf4ahep−/− liver. Left panel shows the global profile and the right panels show occupancy at all expressed genes or up- and down-regulated genes as indicated. (C) Integrated read count of the indicated ChIP-seq tracks and the Dio1 or Angptl loci.
Figure 6—figure supplement 1
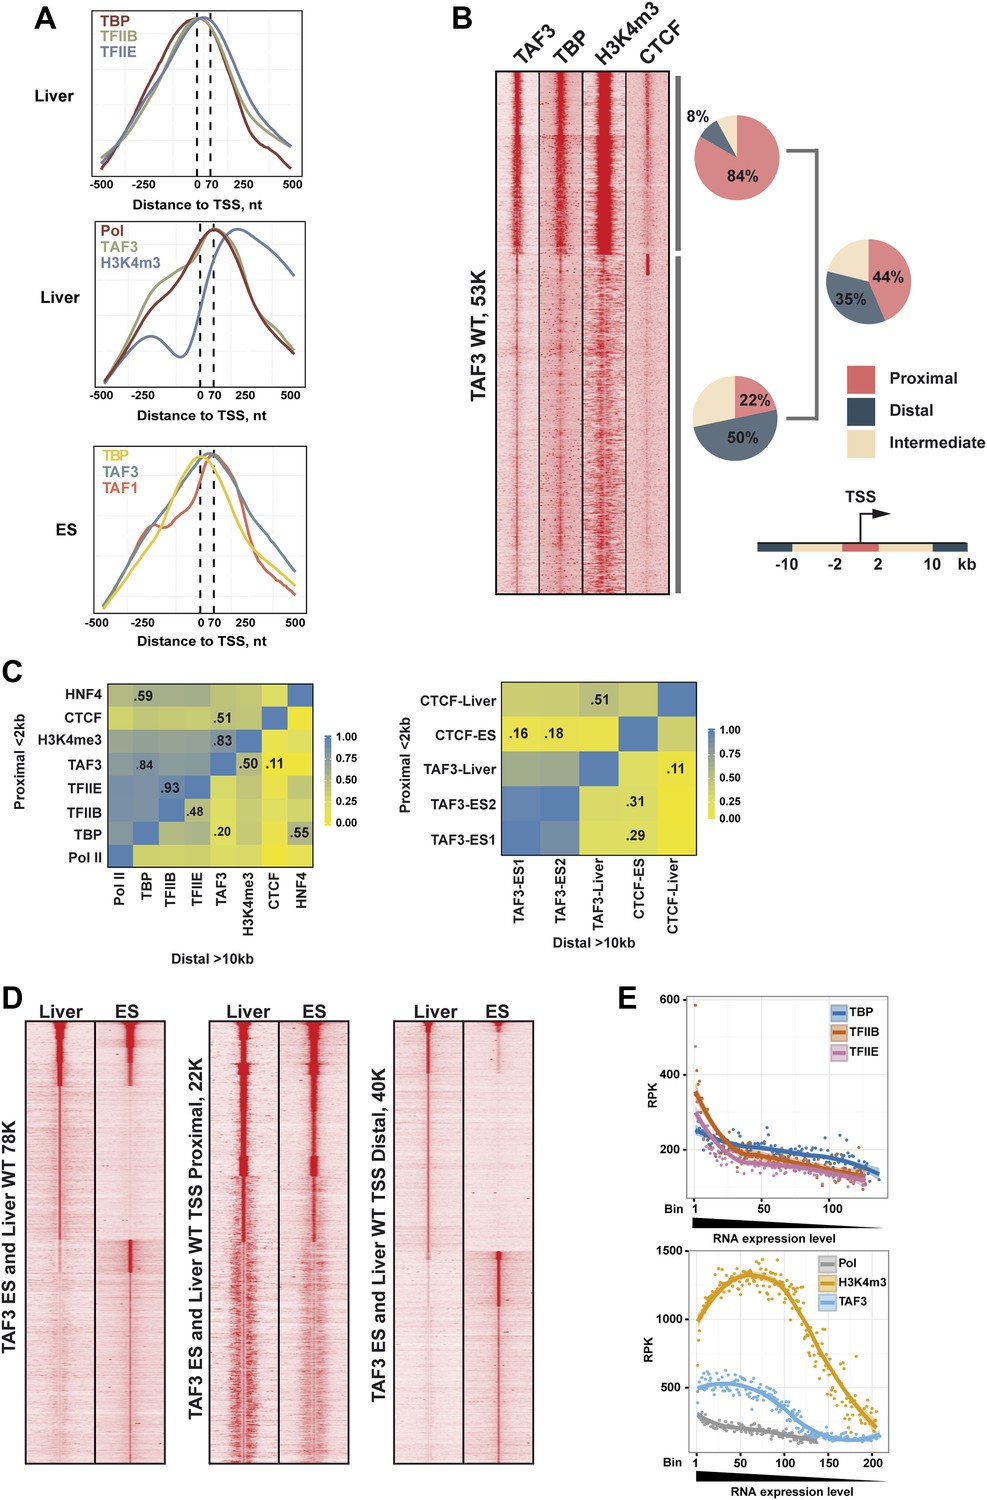
TAF3 genomic occupancy in liver and ES cells.
(A) Metaprofiles from ChIP-seq illustrating the different localisations of each factor relative to the TSS (±500 nucleotides with respect to the TSS) in liver and mouse ES cells. (B) Density cluster profiles of ChIP-seq against the indicated factors centred on the TAF3 occupied sites (±5kb). The % of sites in clusters A and B corresponding to proximal, intermediate, and distal elements and for total TAF3 occupancy are indicated. (C) Heatmaps showing correlation between the ChIP-seq densities of the indicated factors at regions proximal or distal to the TSS. The % correlation for the more relevant combinations is indicated. (D) Comparative density cluster profiles of ChIP-seq against TAF3 in liver and ES cells at either TSS proximal regions (±2 kb with respect to the TSS) or distal regions (> ± 10 kb with respect to the TSS). The ChIP-seq data for ES cells was downloaded from NCBI GEO database with accession GSE30959 (Liu et al., 2011). (E) Comparison of PIC formation and H3K4me3 with respect to gene expression. For each PIC component a list of associated genes was defined with an occupied site within ±2 kb from the corresponding TSS. Occupancy was normalized by the peak length and calculated as reads per kilobase (RPK). The genes from RNA-seq data (approx. 23K) were ranked relative to their expression level, divided into bins of 100, and attributed to the level of PIC component occupancy. Bins containing less than 20 genes were not included.
Figure 7
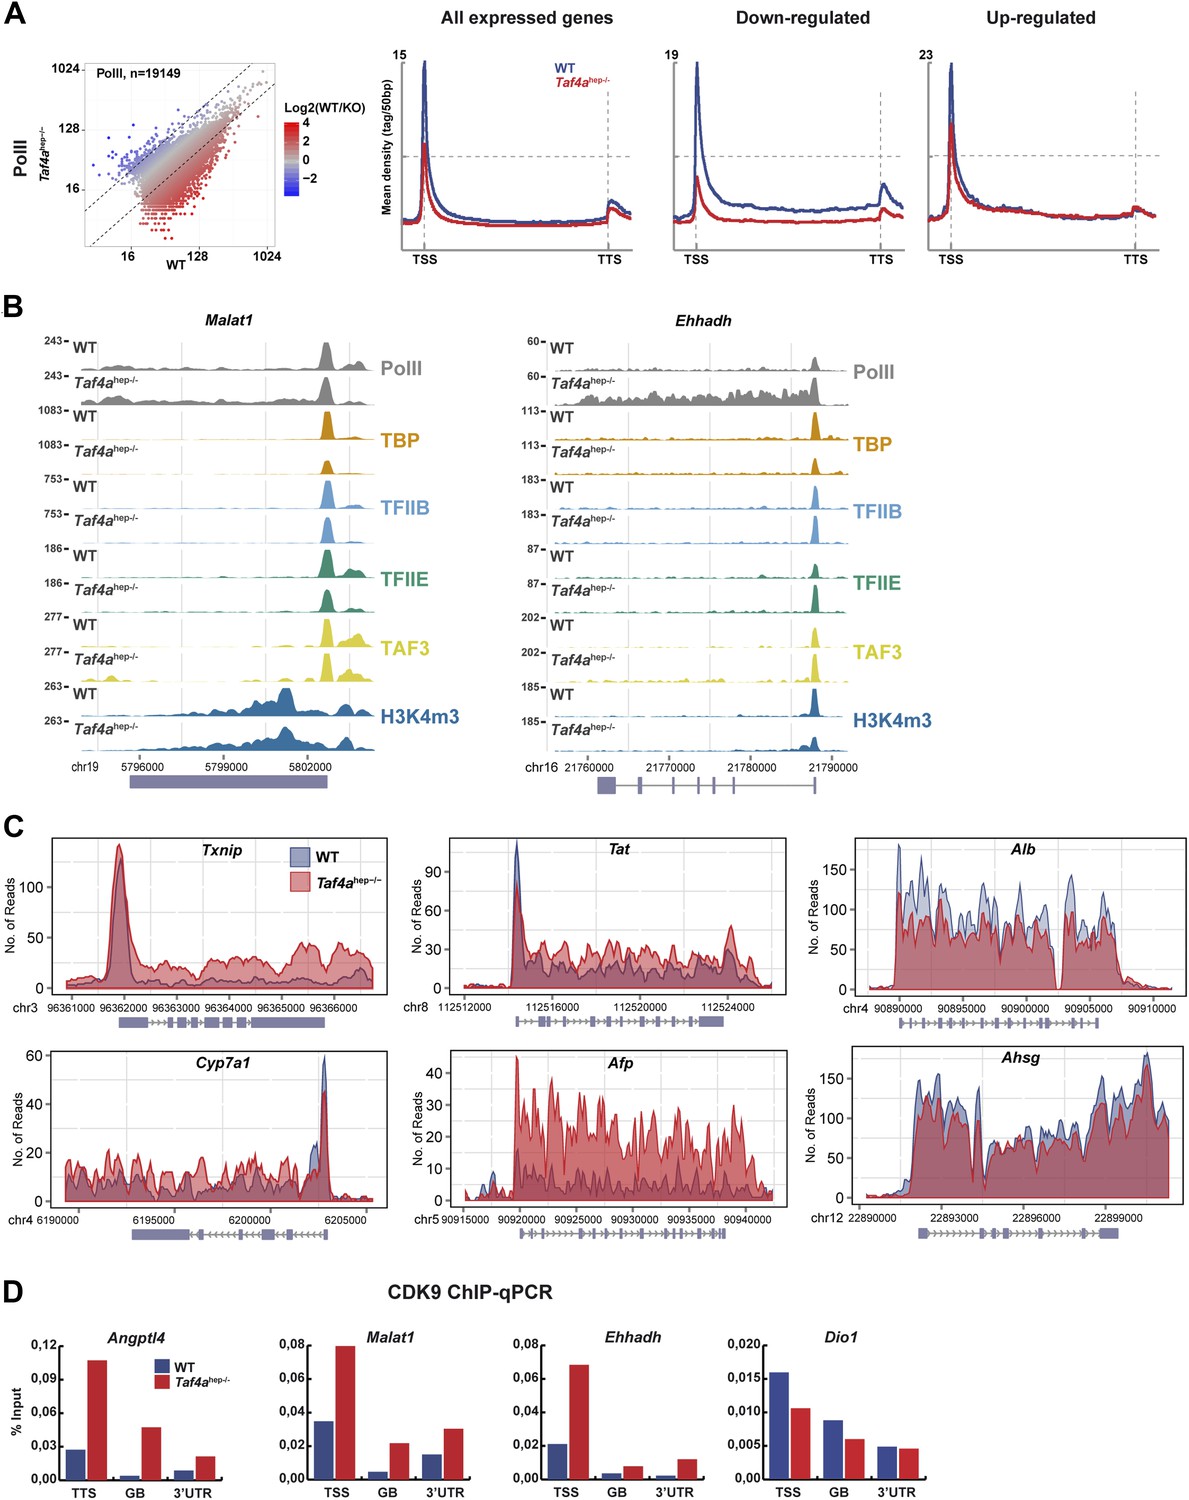
Changes in Pol II elongation.
(A) Pol II genomic occupancy in WT and in Taf4ahep−/− liver. (B) ChIP-seq tracks at the Malat or Ehhadh loci. (C) Overlays of Pol II ChIP-seq densities at the indicated gene loci. (D) ChIP-qPCR of CDK9 at the TSS, gene body (GB), and 3′UTR of the indicated genes. The % input is indicated.
Figure 8 with 2 supplements
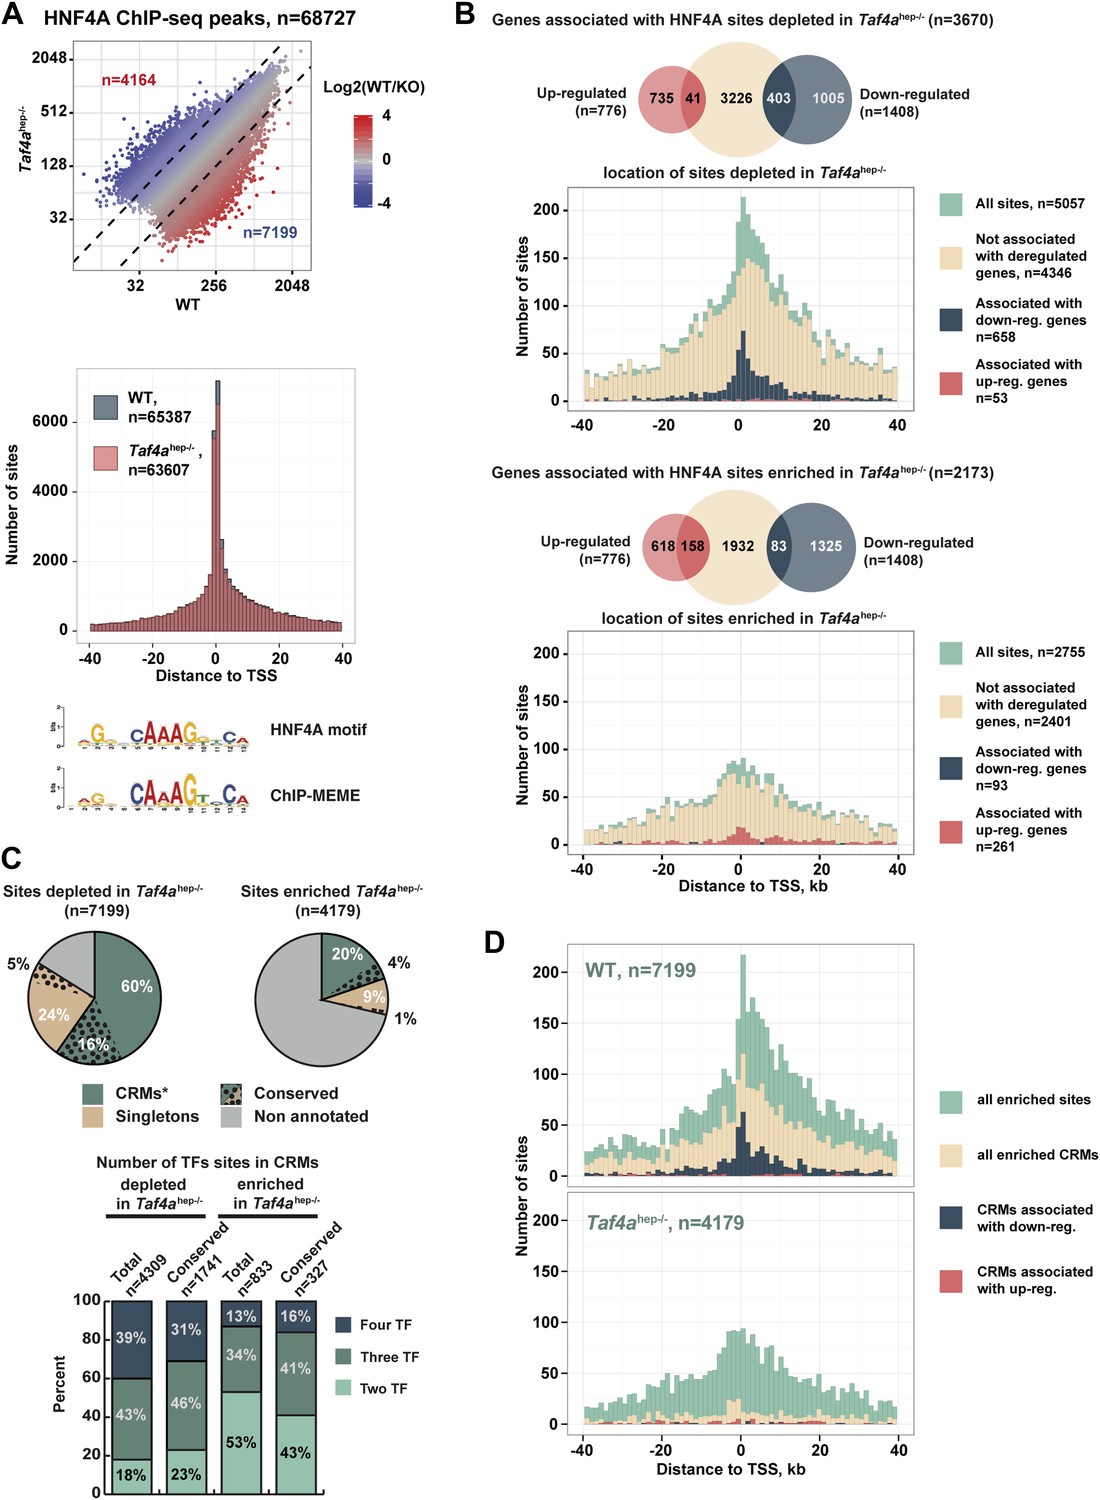
TAF4 is required to recruit HNF4A to functional CRMs.
(A) Comparison of HNF4A ChIP-seq in WT and in Taf4ahep−/− liver and location of HNF4A occupied sites relative to the TSS. Comparison of the HNF4A consensus-binding sequence from our data generated by ChIP-MEME with the previously defined sequence. (B) Venn diagrams illustrate the number of genes with at least one HNF4A binding site either depleted or enriched in Taf4ahep−/− liver, within ±40 kb with respect to the TSS, intersected with up- or down-regulated genes. Graphs illustrate the locations of either the total, depleted or enriched HNF4A sites associated with the up and down-regulated genes within a window of ±40 kb with respect to the TSS. Total sites are shown in green and the sites associated with up- and down-regulated genes are shown in red and blue, respectively. (C) Upper panel shows the % of HNF4A-occupied sites enriched or depleted in Taf4ahep−/− liver that correspond to evolutionarily conserved or non-conserved CRMs. The lower panel shows the % of CRMs in each class that comprise sites for 1, 2, or 3 transcription factors in addition to HNF4A. (D) Location of HNF4A-occupied sites or CRMs, as indicated, enriched in WT or Taf4ahep−/− livers relative to the TSS corresponding to all peaks, all CRMs, or CRMs associated with down- and up-regulated genes.
Figure 8—figure supplement 1
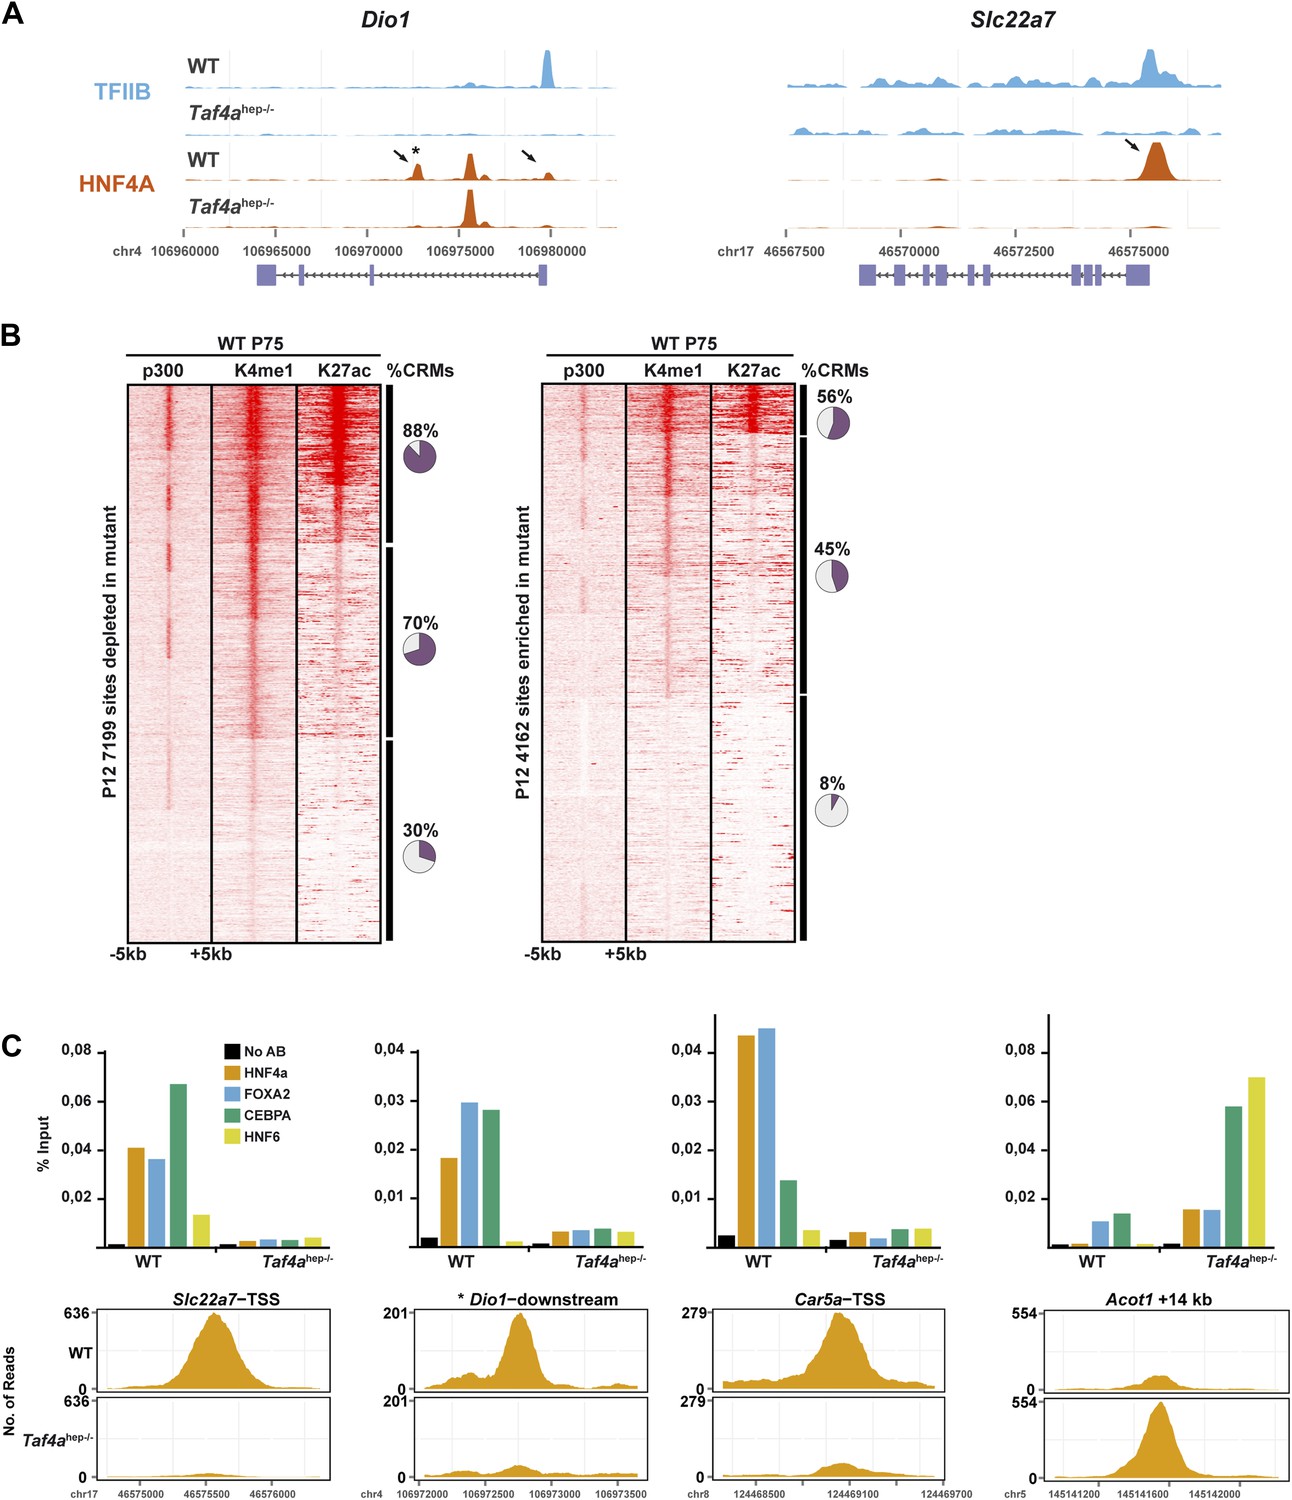
HNF4A genomic occupancy.
(A) UCSC view of the TFIIB and HNF4A ChIP-seq tracks at the Dio1 or Slc22a7 loci. Arrows indicate HNF4A-binding sites that are depleted in TAF4-mutant liver. (B) Association of HNF4A sites enriched or depleted in the TAF4 mutant liver with active enhancer marks in adult liver. The % of CRMs in each cluster is indicated to the right of the panels. The ChIP-seq data for p300, H3K4me1, and H3K27ac in adult liver used from the ENCODE project (http://genome.ucsc.edu/ENCODE/) (Shen et al., 2012). (C) ChIP-qPCR against the indicated factors that co-occupy four different CRMs. The Dio1 downstream CRM is indicated by * in panel (A). The Slc22a7 CRM is occupied by all 4 factors in WT, whereas the Dio1 and Car5a CRMs are occupied by only 3 of the 4 factors and not by HNF6. The Acot1-associated CRM that gains HNF4A occupancy in the mutant is occupied by all 4 factors. FOXA1 and CEBPA occupy their sites in the wild-type and mutant, while HNF4A and HNF6 are recruited only in the mutant.
Figure 8—figure supplement 2
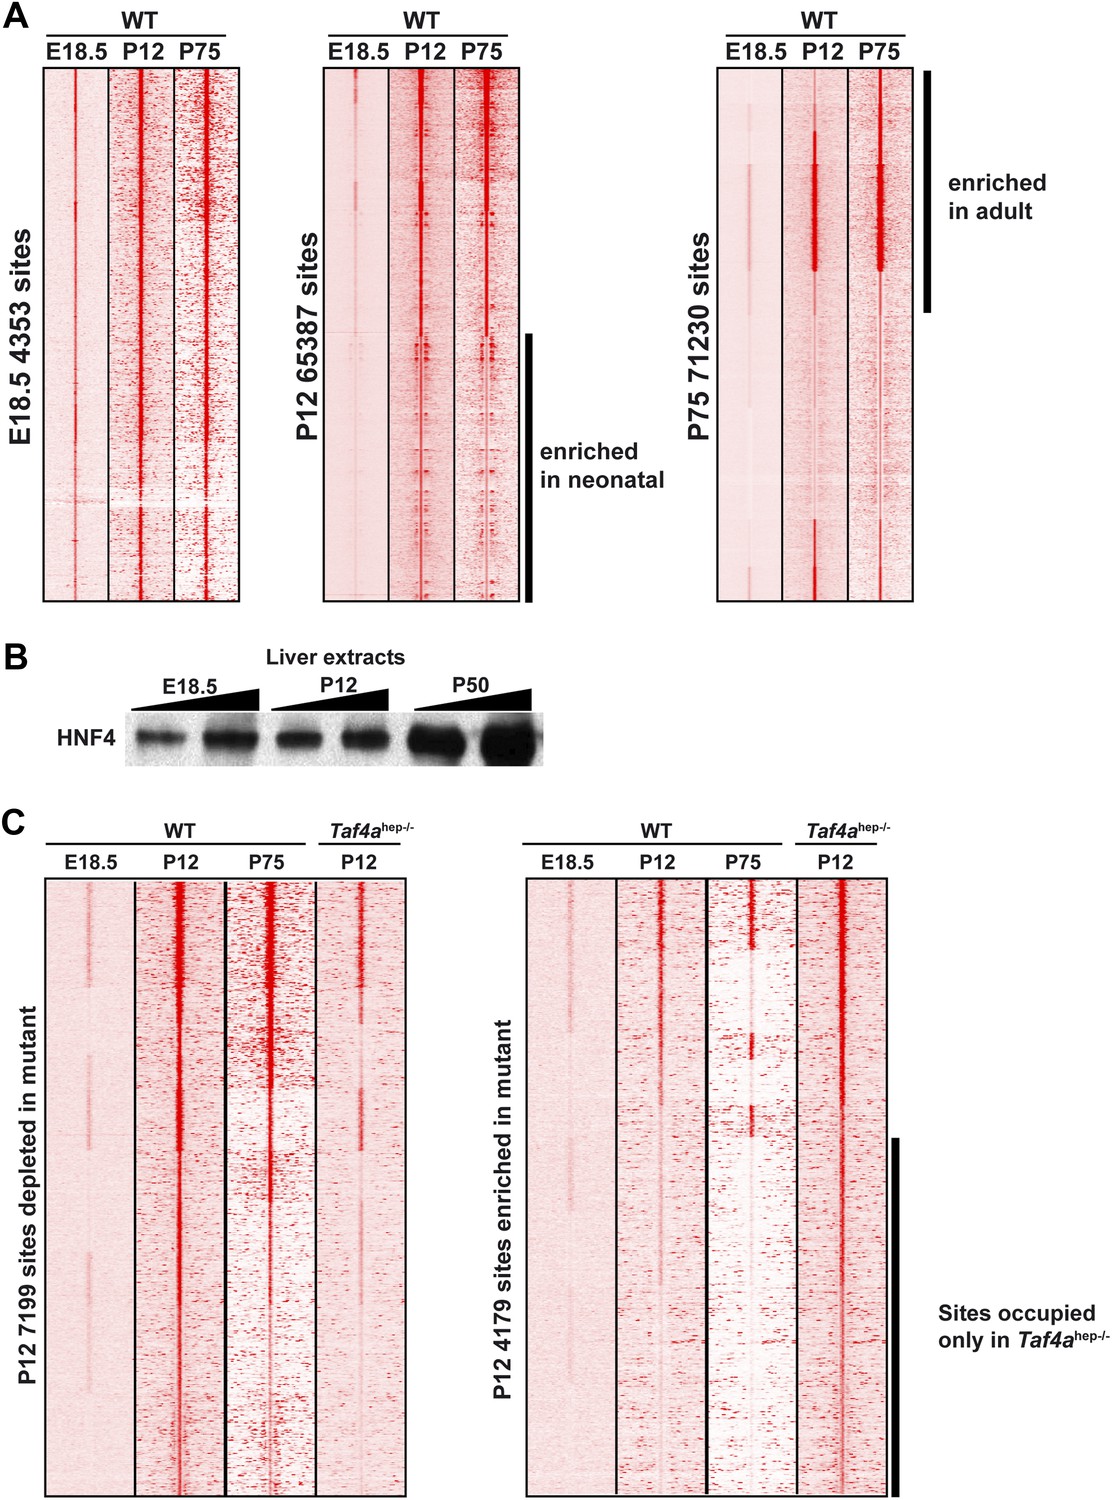
HNF4A genomic occupancy during liver development.
(A) Density cluster profiles of HNF4A ChIP-seq at embryonic day 18.5, P12 and P75. Peaks in the left panel are centred on those occupied at E18.5, in the middle panel on those occupied at P12, and in the right panel at P75. The data for P75 HNF4A occupancy is from Schmidt et al. (2010) [Arrayexpress E-TABM-722]). (B) Western blot of HNF4A expression in 30 µg of nuclear extract from WT embryonic, post-natal, and adult liver. (C) Density cluster profiles of HNF4A ChIP-seq at embryonic day 18.5, P12 and P75 at the sites depleted or enriched in the TAF4 mutant liver (left and right panels, respectively).
Figure 9
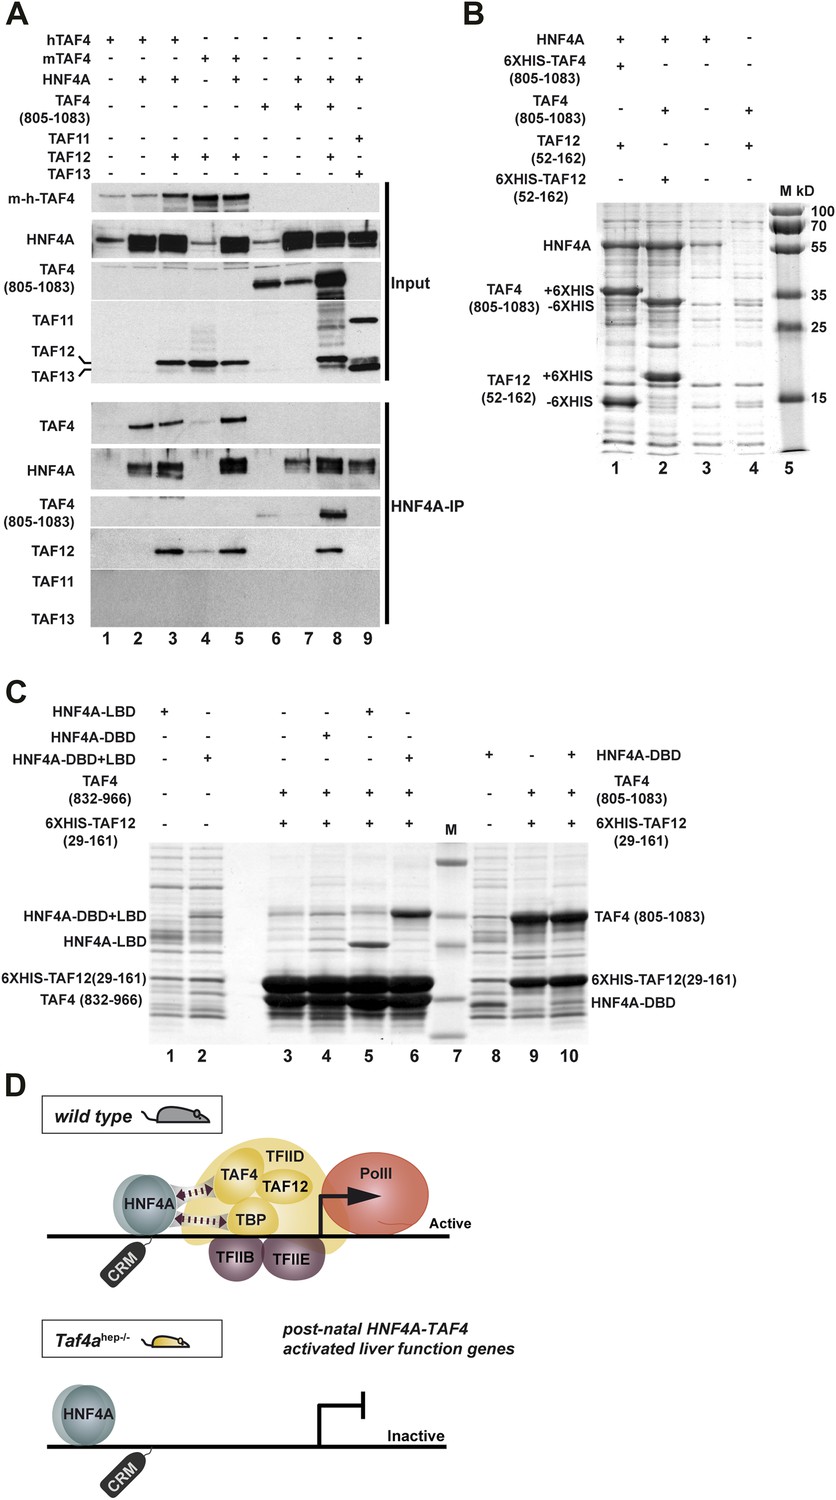
HNF4A interacts directly with the TAF4–TAF12 heterodimer via its LBD.
(A) HEK cells were transfected with vectors expressing the constructs indicated above each lane. The upper panel represents proteins in the transfected cell extracts, the lower the proteins in the anti-HNF4A IP. (B) Formation of an HNF4A–TAF4–TAF12 complex from bacterial expressed proteins. SDS-PAGE followed by Coomassie brilliant blue staining of proteins retained on the cobalt-agarose column. Co-expressed proteins are shown above each lane and their locations to the left of the panel. Similar experiments with N-terminal 6HIS-tagged HNF4A were also attempted, but the presence of the tag induced degradation of recombinant HNF4A in bacteria not shown. (C) Bacterial co-expression of HNF4A domains with TAF4–TAF12. Co-expressed proteins are shown above each lane and their locations to the left of the panel. As the HNF4A-DBD co-migrates with TAF4 (832–966), it was re-expressed with TAF4 (805–1083). (D) Model for cooperative HNF4A–TFIID function in hepatocyte gene activation. HNF4A interacts with TBP and TAF4 in TFIID via its DBD and LBD, respectively. These interactions are required for PIC formation on target promoters and occupancy of functional HNF4A sites regulating transcription of liver-specific genes during neonatal hepatic maturation.
Additional files
-
Supplementary file 1
Excel table of RNA-seq data. Pages 1 and 2 show the genes down- and up-regulated in TAF4 mutant liver respectively. Page 3 indicates genes with associated HNF4A occupied sites in E18.5 liver and page 4 the ontology terms associated with these genes. Page 5 lists genes that show loss of HNF4A occupancy and down-regulation in TAF4 mutant liver and page 6 the ontology terms associated with these genes (Supplementary file 1).
- https://doi.org/10.7554/eLife.03613.019
Download links
A two-part list of links to download the article, or parts of the article, in various formats.
Downloads (link to download the article as PDF)
Open citations (links to open the citations from this article in various online reference manager services)
Cite this article (links to download the citations from this article in formats compatible with various reference manager tools)
TAF4, a subunit of transcription factor II D, directs promoter occupancy of nuclear receptor HNF4A during post-natal hepatocyte differentiation
eLife 3:e03613.
https://doi.org/10.7554/eLife.03613


