Large-scale filament formation inhibits the activity of CTP synthetase
- Princeton University, United States
- McGill University, Canada
- University of California, Davis, United States
Figures
Figure 1 with 7 supplements
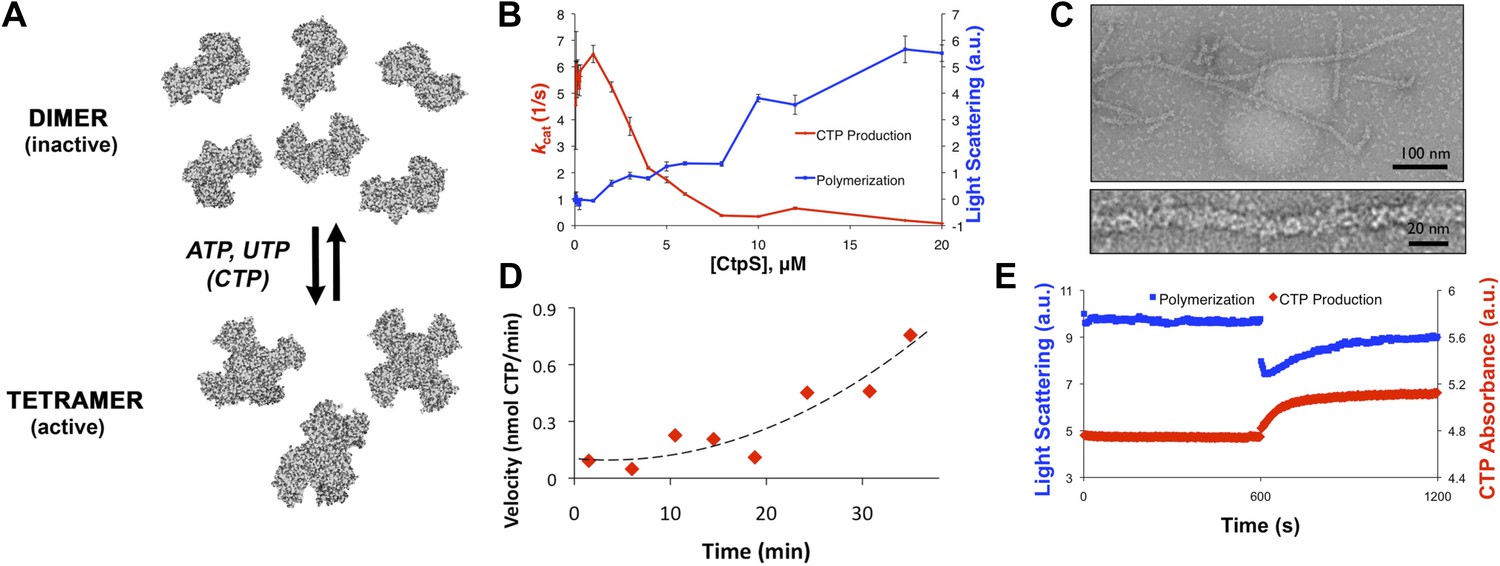
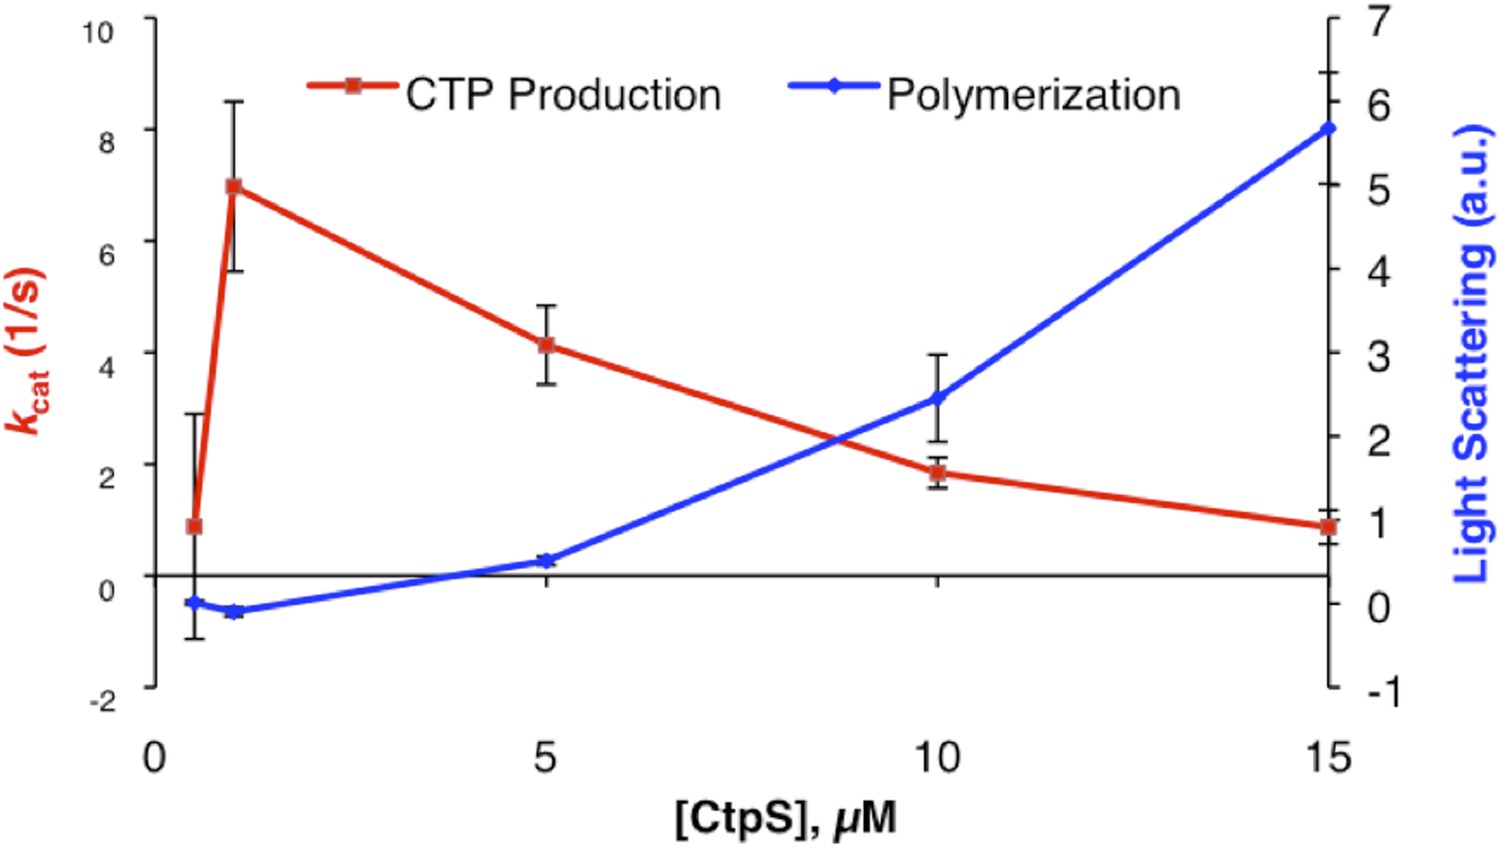
CtpS polymerization and enzymatic activity are inversely related.
(A) A model of oligomeric regulation of CtpS. Tetramer formation from CtpS dimers is favored by a combination of enzyme concentration as well as nucleotide (substrates ATP and UTP or product CTP) and Mg2+ binding. (B) CtpS was incubated in activity buffer containing all substrates for CTP production. As the enzyme concentration increases, CtpS shows assembly by light scattering and the kcat value (Vobs/[CtpS]) decreases. Error bars = standard error (SE), n = 3–5. (C) Negative stain image of CtpS filaments assembled after CTP synthesis reaction. Smaller particles in the background resemble the X-shaped CtpS tetramer. A single filament is shown at bottom. (D) CtpS polymers formed in activity buffer were ultracentrifuged to pellet polymers. The pellet fraction was resuspended and CTP production was recorded. (E) CtpS assembly and activity were assayed after CtpS was first polymerized, followed by addition of saturating amounts of substrate after 600 s.
Figure 1—figure supplement 1
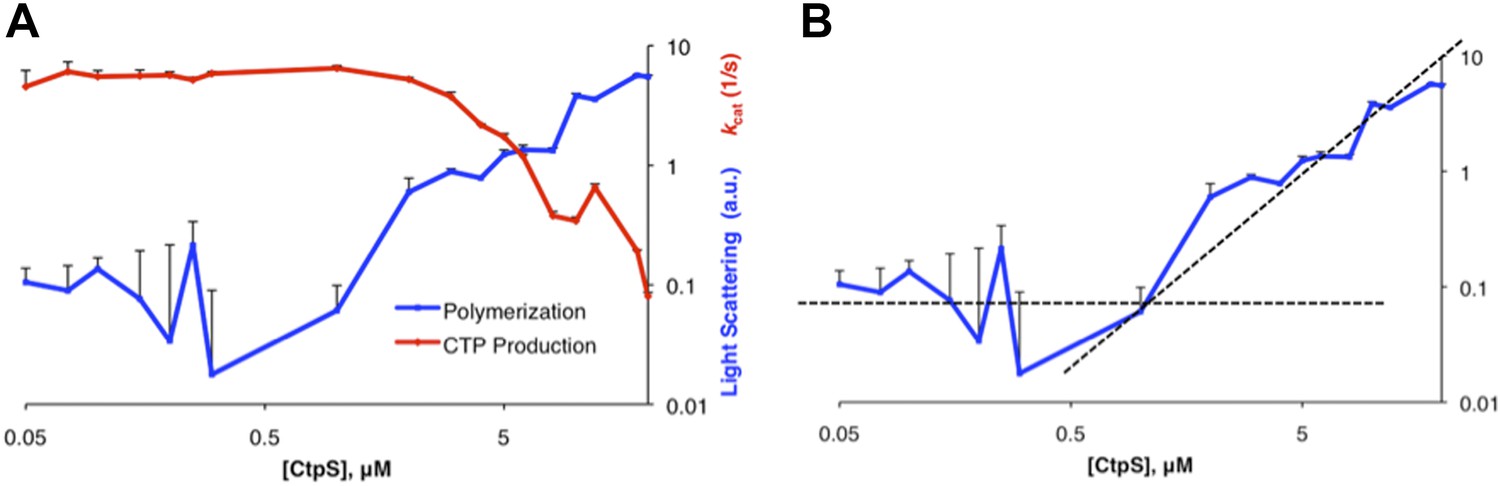
Determination of threshold concentration for CtpS polymerization in activity buffer.
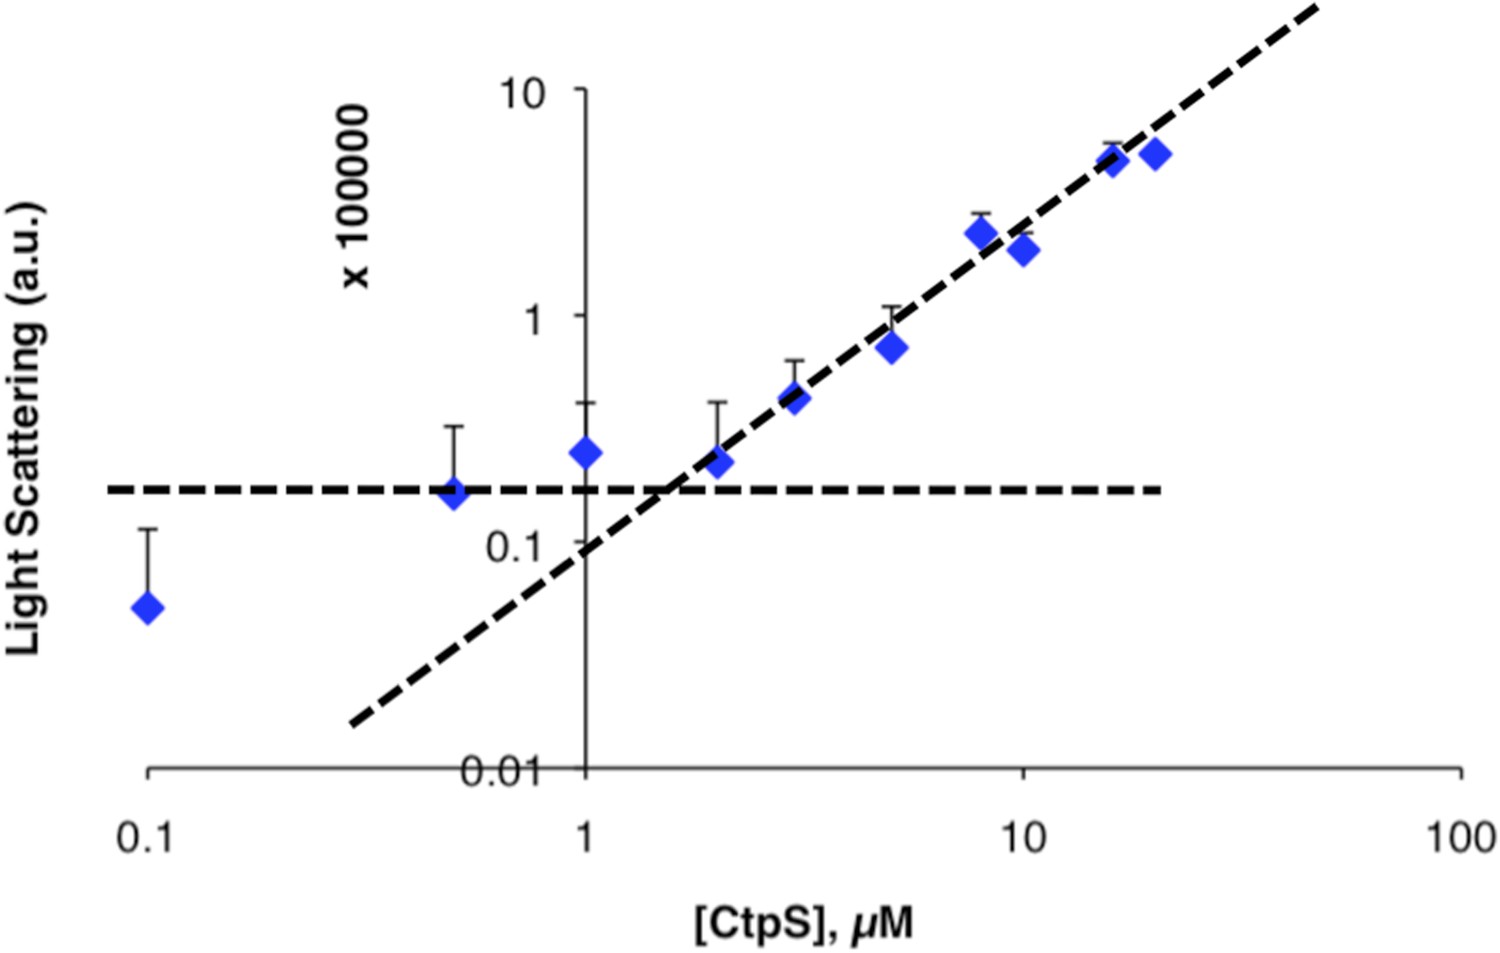
(A) Below 1 µM, the changes in light scattering (blue) are very low. At low [CtpS] the net changes in light scattering were both above and below zero, so the absolute values are plotted to allow comparison on a logarithmic plot (only the values for 0.05 µM and 0.075 µM CtpS were above zero). CtpS activity (red) is plotted on a logarithmic plot to compare the concentration at which polymerization and activity decreases begin. (B) The logarithmic plot of polymerization shows an inflection point at 1 µM. This predicts an approximate threshold concentration for polymerization between 1 µM and 2 µM.
Figure 1—figure supplement 2
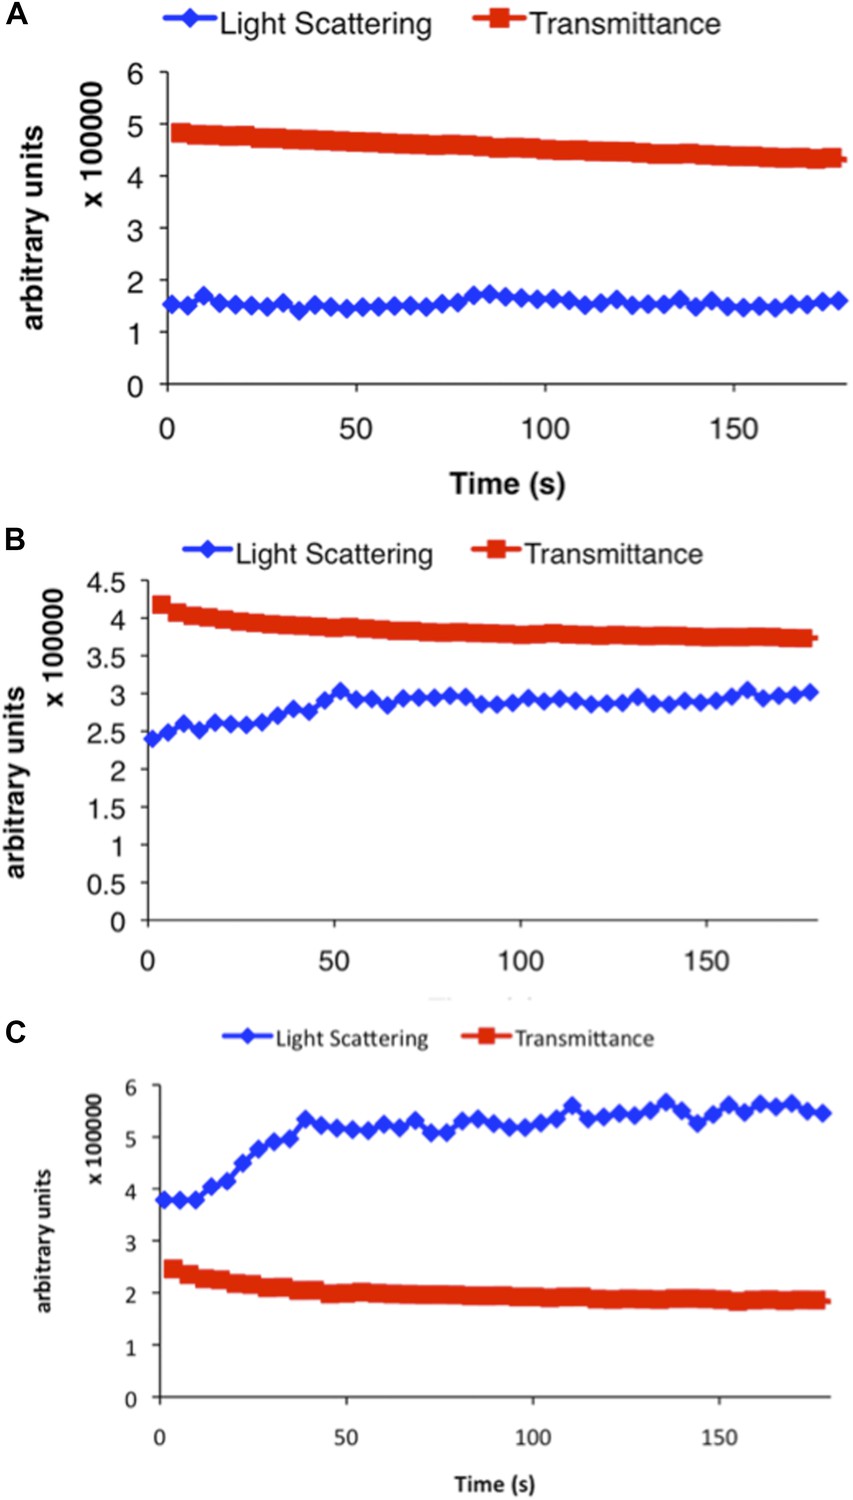
Representative examples of raw data from three different concentrations of CtpS incubated in activity buffer included in Figure 1B.
Light scattering (polymerization) is shown in blue and transmittance data (CTP accumulation) is shown in red. (A) 100 nM CtpS (below polymerization threshold). (B) 2 µM CtpS (at polymerization threshold). (C) 5 µM CtpS (above polymerization threshold).
Figure 1—figure supplement 3
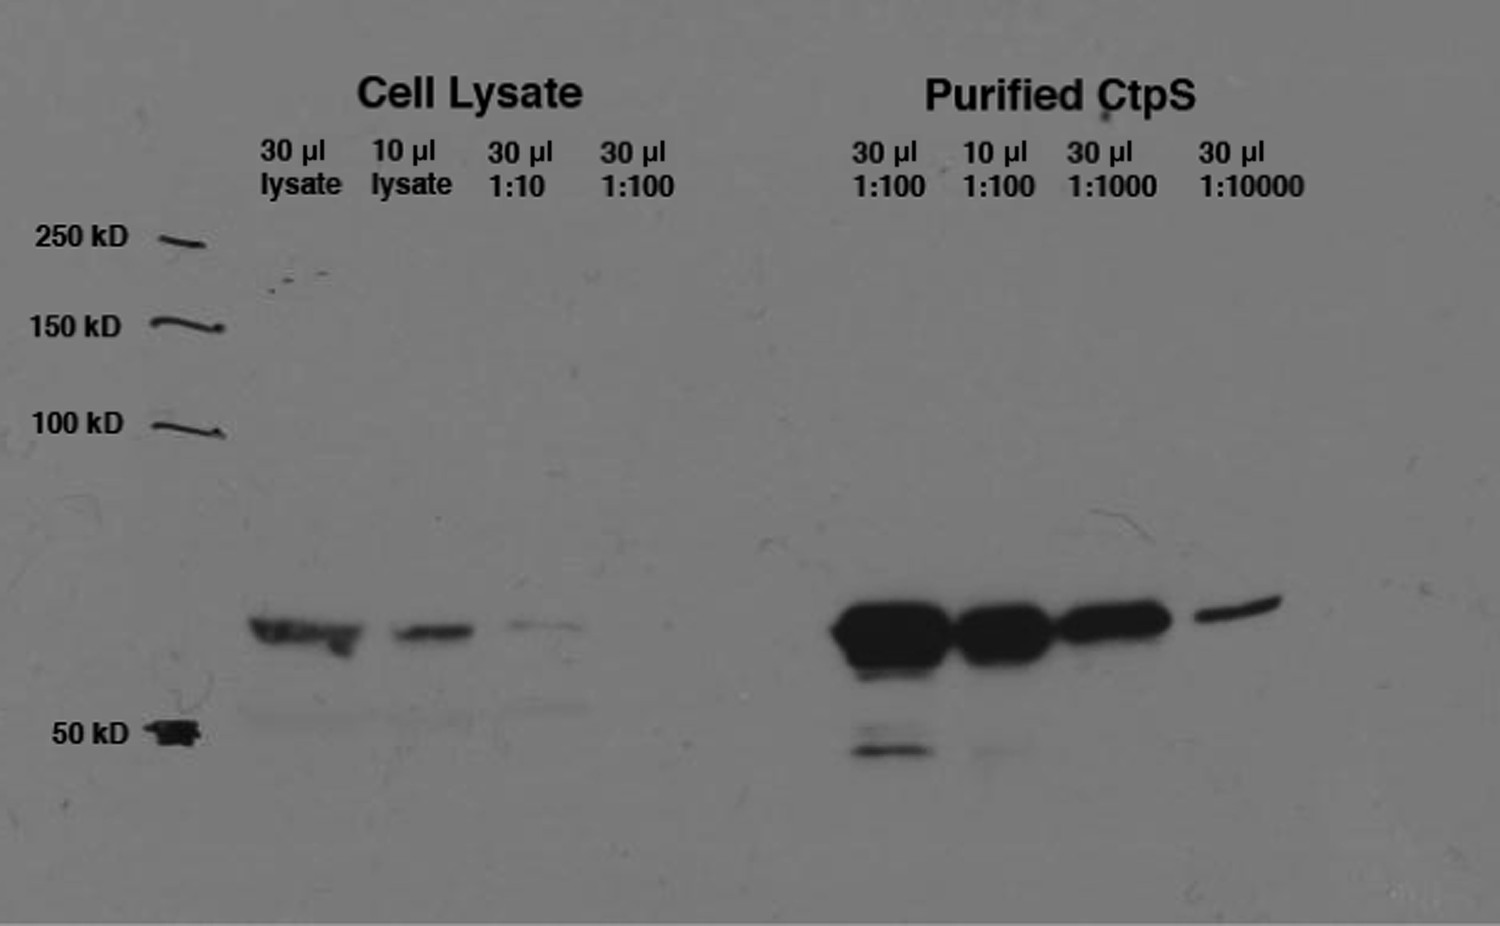
Calculation of intracellular CtpS in minimal media.
Levels of native CtpS protein in wild-type E. coli NCM3722 were compared to dilutions of the purified protein of known concentration (9 mg/ml). Band intensities were quantified using ImageJ. Amount of cells in lysate was approximated to be 8 × 10⁸/OD600 unit. Volume of an E. coli cell was approximated to be 1 µm3.
Figure 1—figure supplement 4

CtpS activity is not sensitive to incubation on ice.
Due to concerns that placing resuspended polymers on ice may affect enzymatic activity significantly, we compared the activity level of CtpS reactions under typical conditions (t = 0 min) vs incubation on ice. For later time points, 10 µl of cold CtpS-containing buffer was added to room temperature activity buffer to match the conditions of the ultracentrifuguation assay (Figure 1C). Overall activity does not change over the course of the experiment at the lower temperature.
Figure 1—figure supplement 5

CtpS higher order structures disassemble over time after centrifugation.
Light scattering values from the pellet fraction of polymerized CtpS decrease over time after centrifugation from a baseline initial value. Pellet fraction stored on ice and compared to initial light scattering value immediately after resuspension.
Figure 1—figure supplement 6
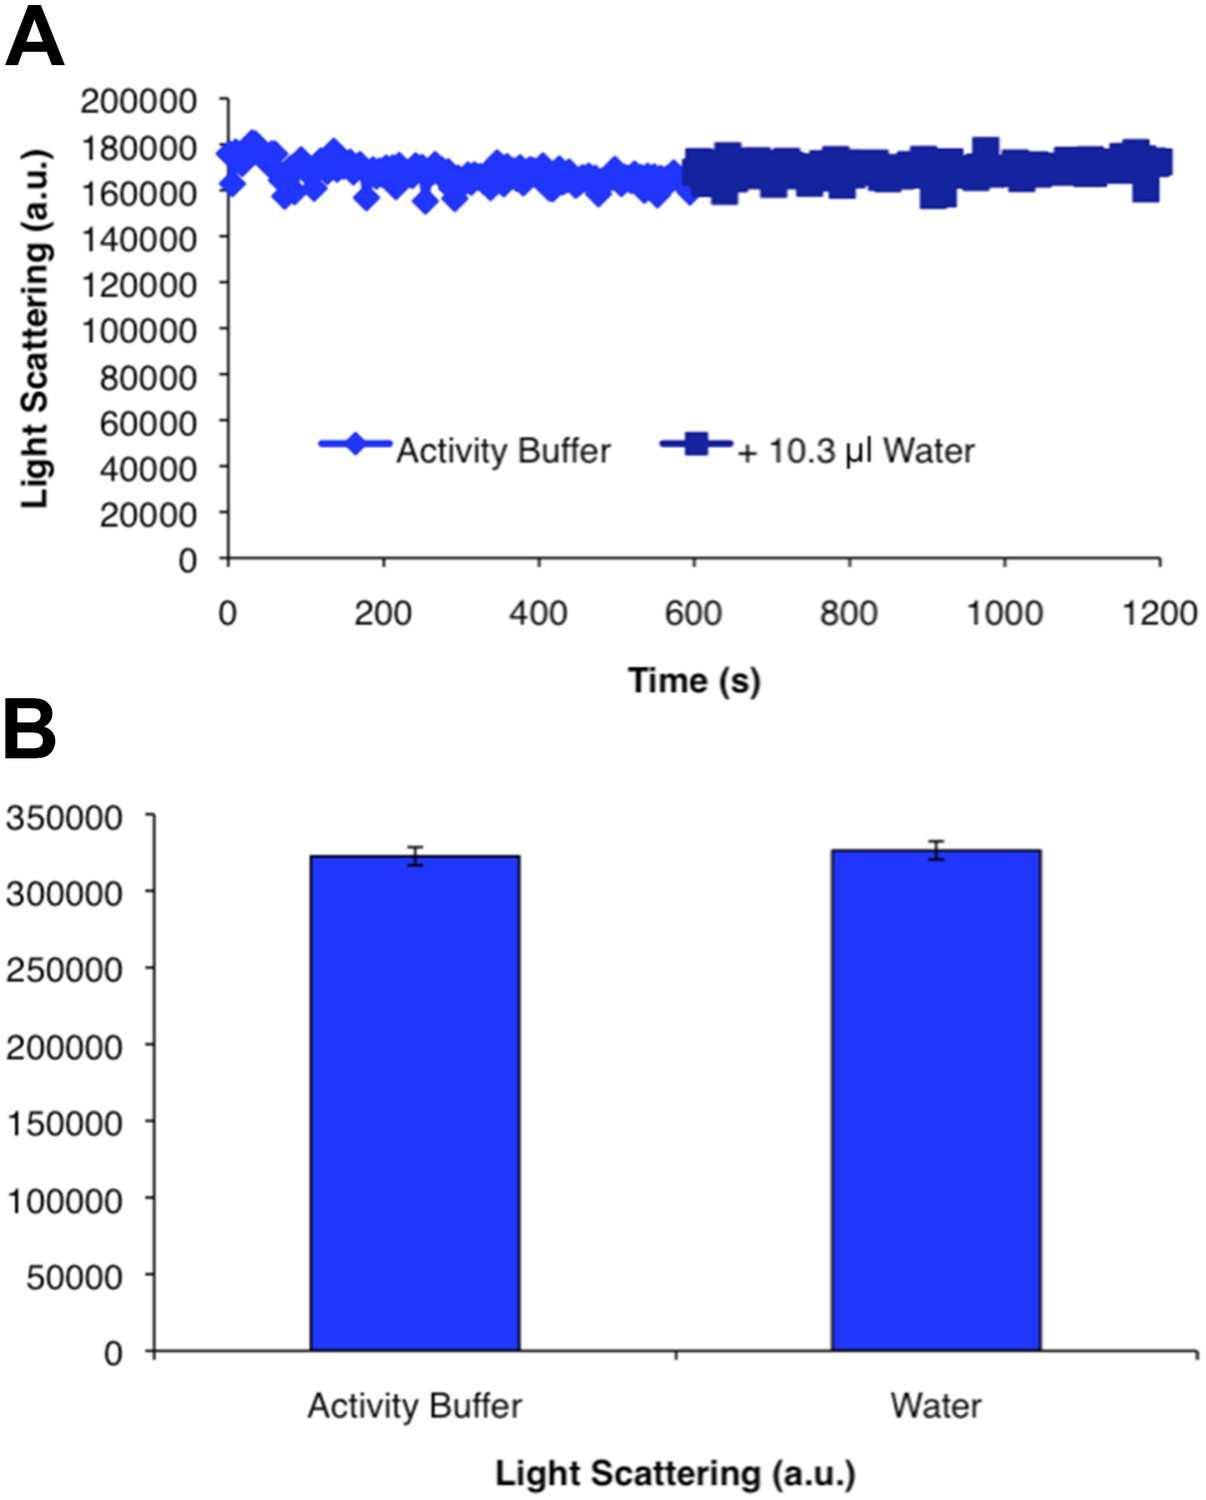
CtpS polymer disassembly is not caused by mechanical disruption of polymers.
Addition of an equivalent volume of water to the volume contributed by substrates added in Figure 1E to polymerized CtpS does not change light scattering values. Error bars in B are the standard deviation of light scattering values over the time course shown in A.
Figure 1—figure supplement 7
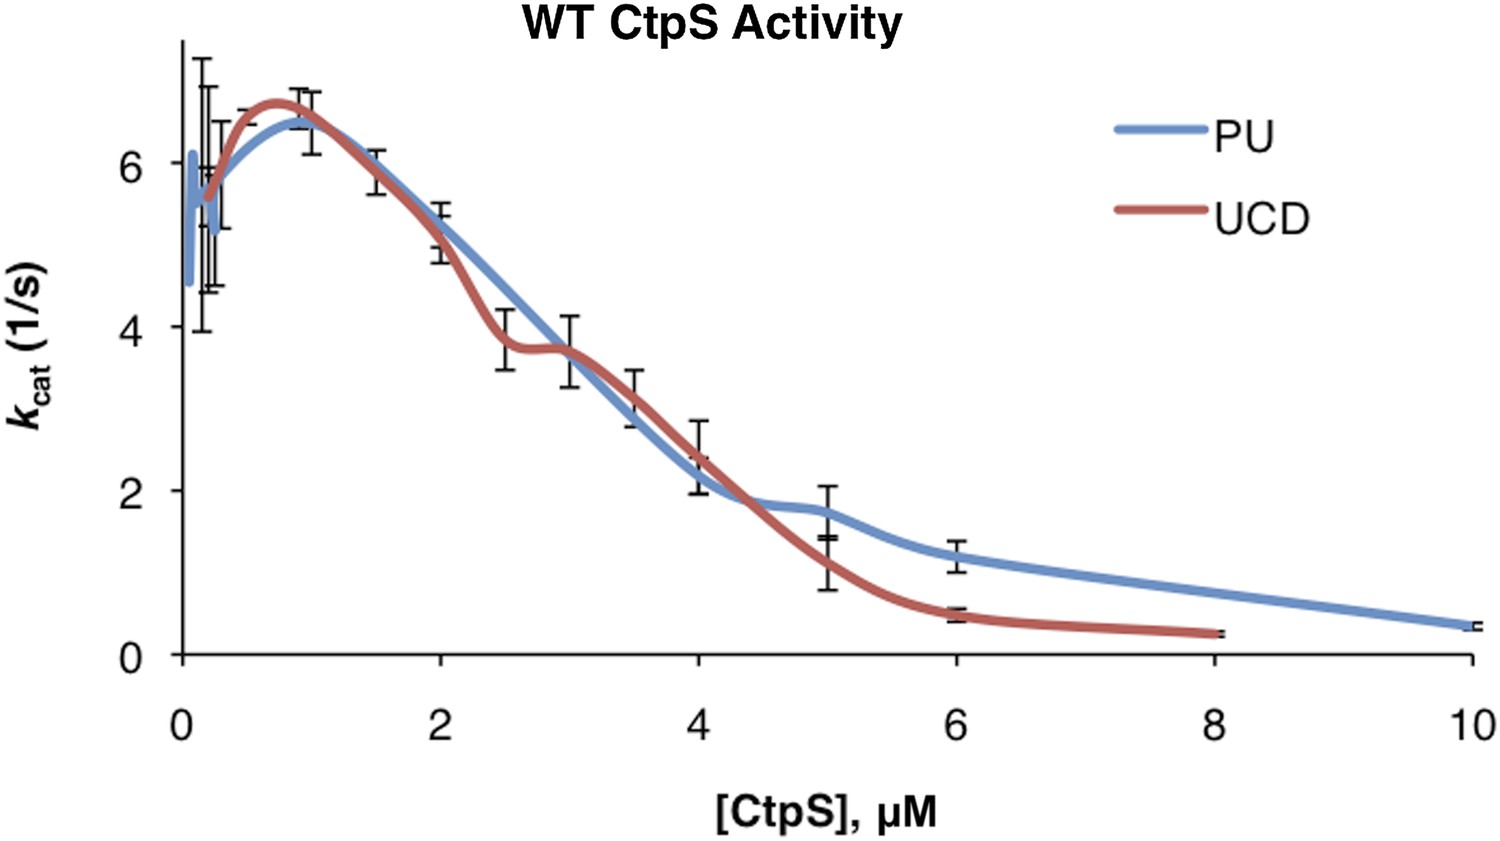
Correction of kcat values between initial Princeton and UC Davis data sets.
Linear correction was performed as described in ‘Materials and methods’ to generate overlapping data sets.
Figure 2 with 5 supplements

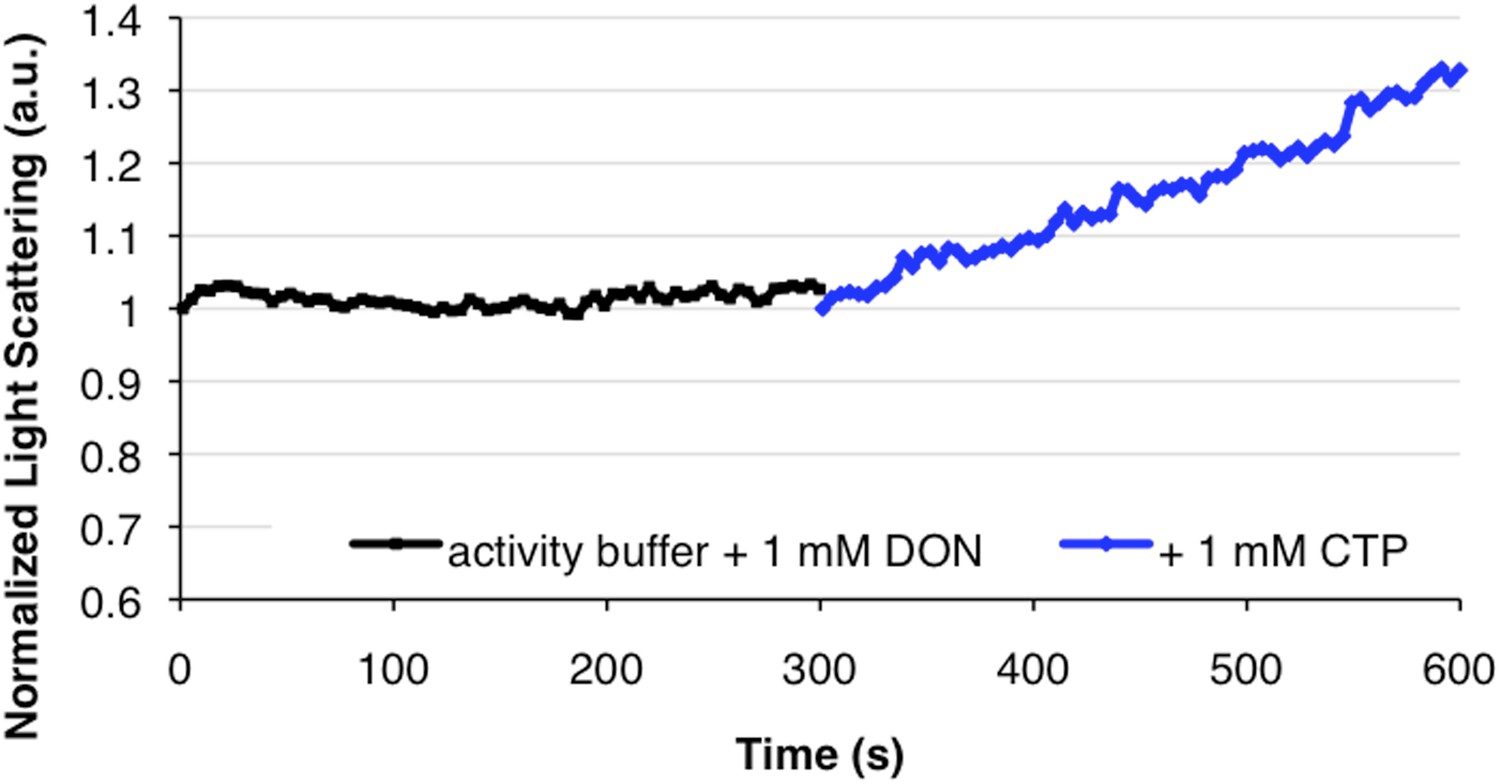
CTP is sufficient and necessary to stimulate CtpS polymerization.
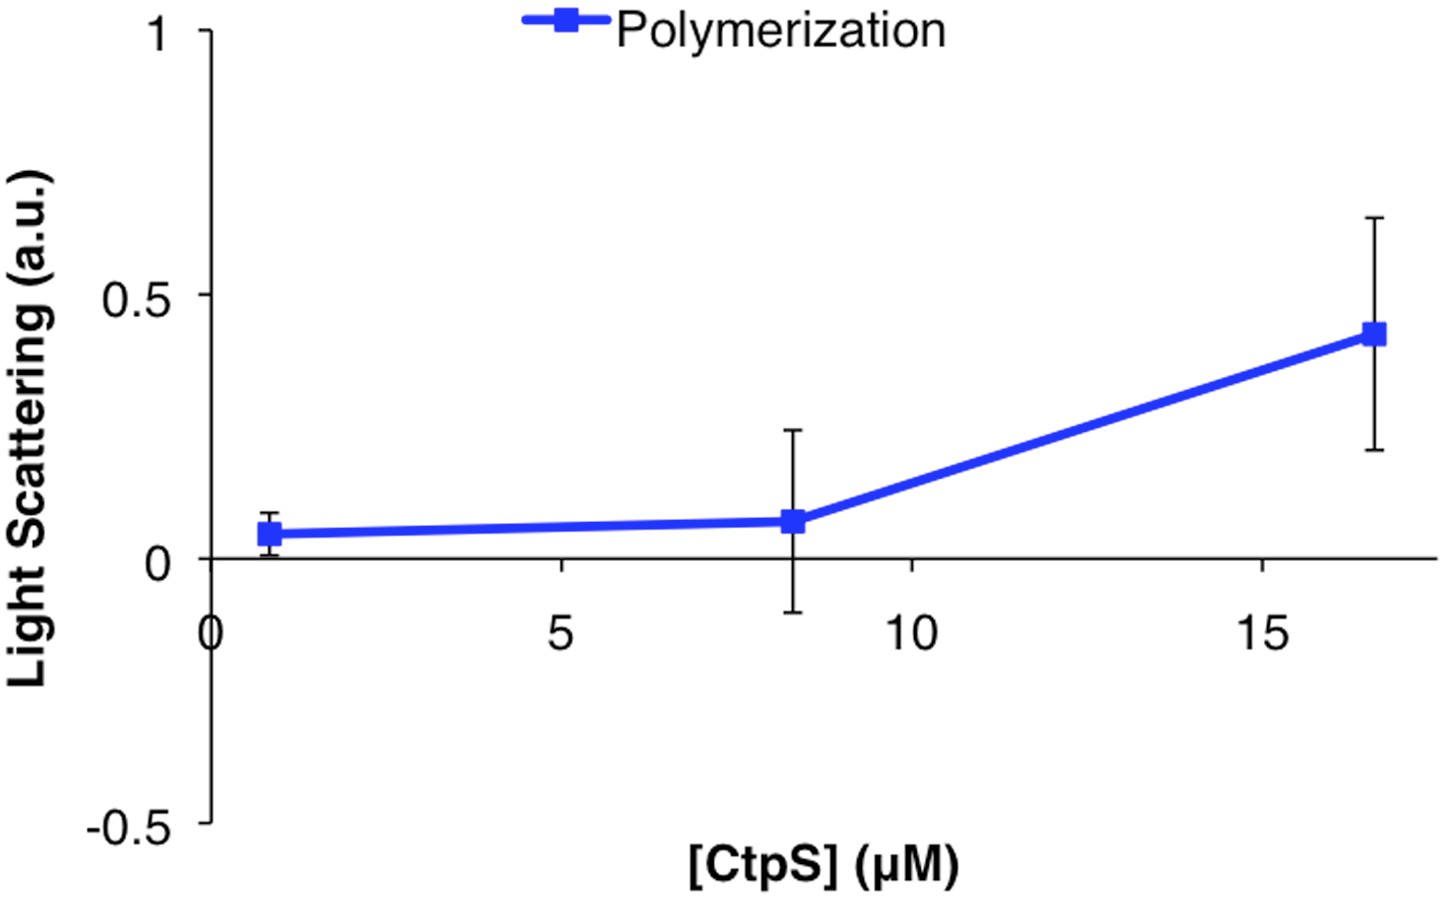
(A) CtpS levels were titrated in buffer containing 1 mM CTP (with no substrates present). Polymerization was observed in the same range of protein concentrations as in activity buffer. Error bars = SE, n = 3. (B) CtpS was allowed to polymerize at different CTP concentrations (with no substrates present). The polymers were collected by ultracentrifugation and changes in CtpS pellet abundance were quantified by immunoblot. Error bars = SE, n = 2. (C) Purified CtpSE155K, which is defective in CTP binding, showed no obvious changes in light scattering during the normal conditions of wild-type polymer assembly in activity buffer. Initial light scattering values were normalized to 1 to place wild-type CtpS and CtpSE155K on the same scale. Error bars = SE, n = 3. (D) CtpS Filaments of wild-type and mutants by negative stain electron microscopy. There were very few filaments observed in the absence of CTP (top row). Upon the addition of nucleotide and MgCl2, filaments were only observed in the wild-type sample (first column). Micrographs were all taken at 55,000X magnification. (E) CtpS was incubated in the inhibitor DON and 1 mM CTP and allowed to polymerize. Addition of ATP and UTP depolymerized the sample. Polymers did not reform.
Figure 2—figure supplement 1
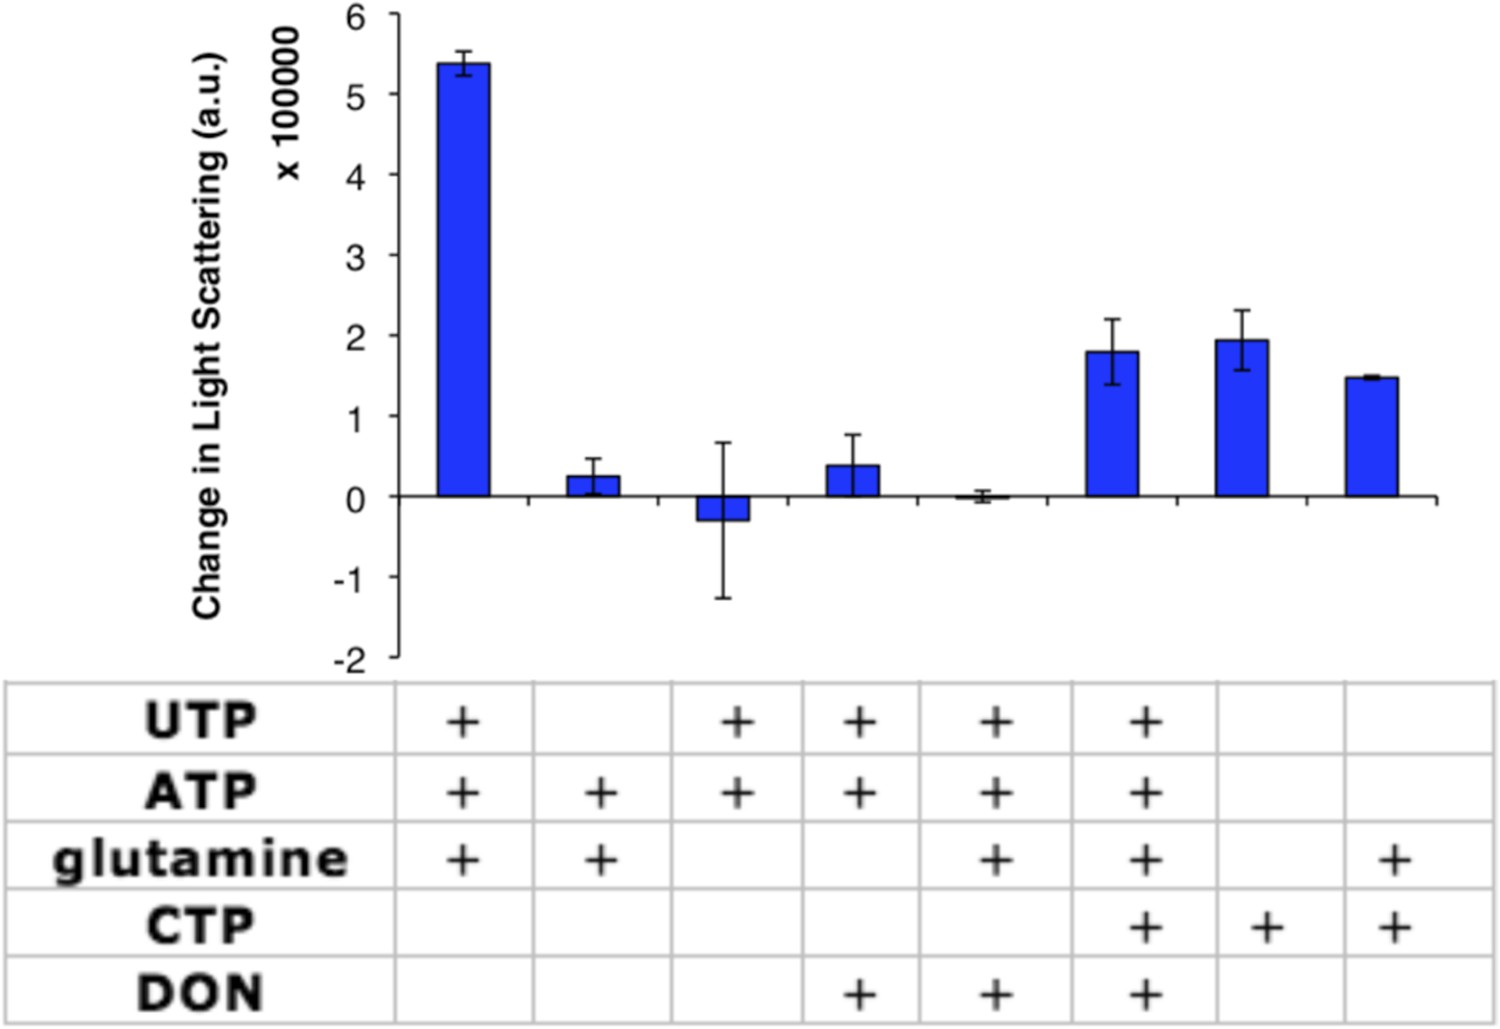
CtpS enzymatic activity or CTP addition is required for CtpS polymerization.
Addition of various factors (shown in table) to 10 µM CtpS indicates that glutamine binding is dispensable for CtpS polymerization. Full activity buffer (containing 1 mM ATP, 1 mM UTP, and 10 mM glutamine) or CTP are required for polymerization. Omission of a substrate from activity buffer or addition of the inhibitor 1 mM DON inhibits polymerization. 1 mM DON has no effect on CTP-induced polymerization. Error bars = SE (n = 2).
Figure 2—figure supplement 2
Determination of threshold concentration for CtpS polymerization in 1 mM CTP.
Threshold concentration was calculated as in Figure 1—figure supplement 1 for CtpS incubated in buffer with 1 mM CTP. The graph shows an inflection point at 1–2 µM. Error bars = SE (n = 3).
Figure 2—figure supplement 3
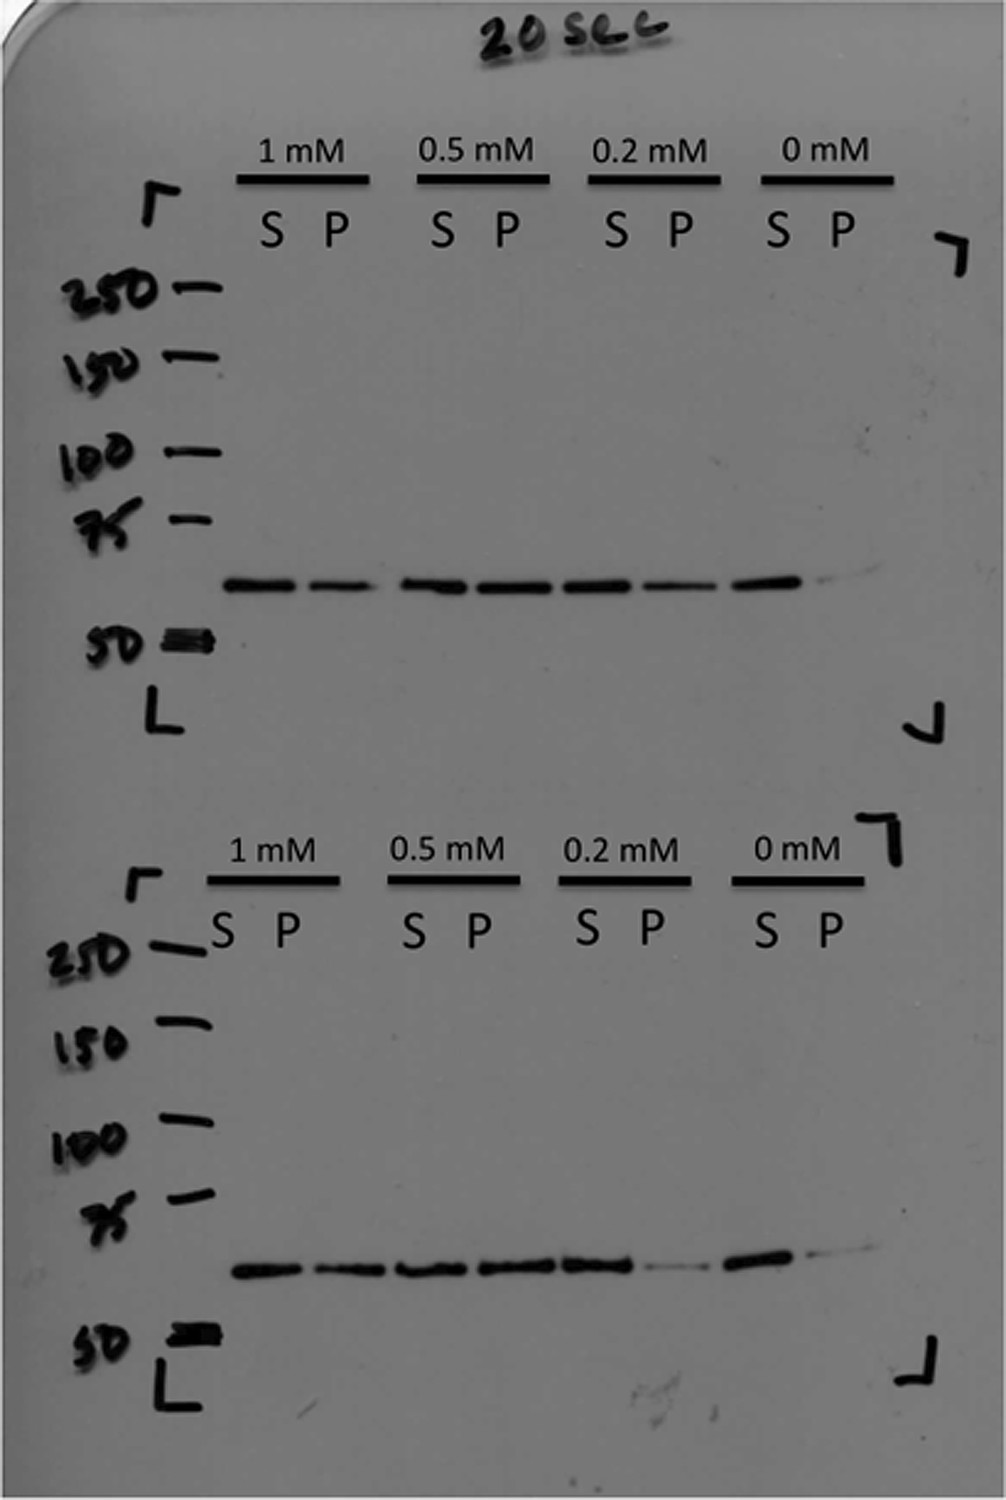
Immunoblot of CtpS pelleted by ultracentrifugation.
CtpS was incubated in titrating amounts of CTP as described in ‘Materials and methods’. Pellet fraction band density was calculated by ImageJ to determine fold change.
Figure 2—figure supplement 4

DON-treated CtpS is enzymatically inactive.
Samples of CtpS were allowed to polymerize in activity buffer. Then 10 mM DON was added to stop enzymatic activity. (A and B) Two independent representative experiments are shown. Light scattering (polymerization) and transmittance (CTP production) are shown on the same axis in arbitrary units. (C) Polymerization and activity before and after DON addition are compared. Overall amplitude of light scattering and transmittance data is affected by absorption by DON at the wavelengths of light used for the assay. Therefore, the slopes of each condition are shown.
Figure 2—figure supplement 5
DON inhibition of activity does not inhibit polymerization upon CTP addition.
In the converse experiment of Figure 2E, DON-inhibited CtpS incubated in substrates does not polymerize, but addition of 1 mM CTP stimulates polymerization.
Figure 3 with 2 supplements
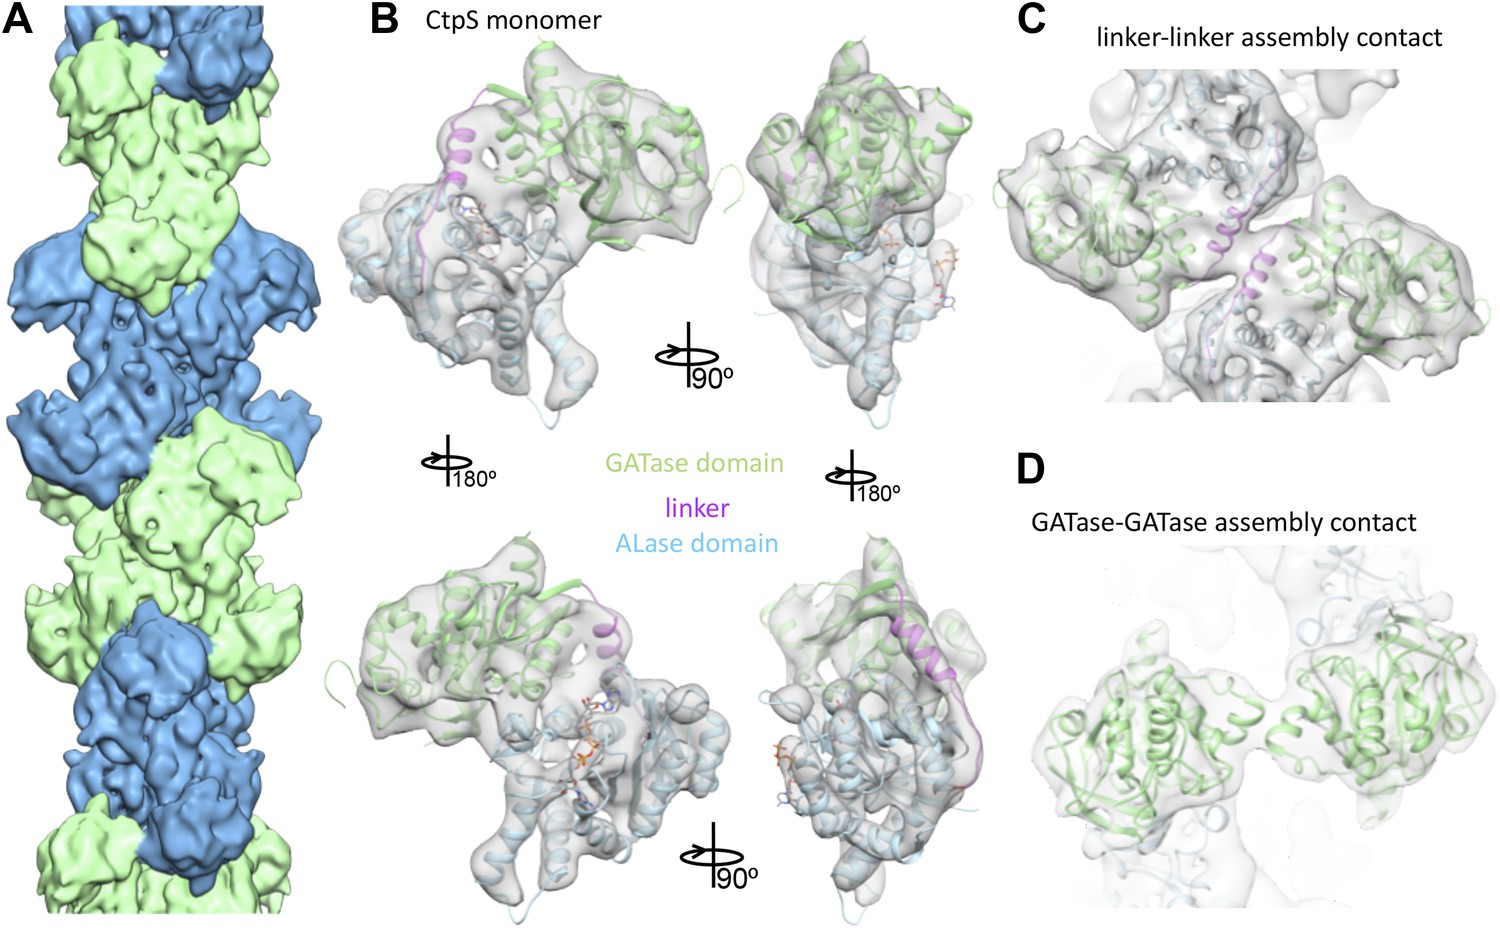
Cryo-EM structure of CtpS filaments at 8.4 Å resolution.
(A) A segment of the reconstructed filament, colored by helical subunit. (B) The E. coli CtpS crystal structure monomer fit into the cryo-EM density. Each domain was fit as a separate rigid body. (C) Novel filament assembly contacts between the linker domains. (D) Novel assembly contacts between the GATase domains.
Figure 3—figure supplement 1

Cryo-EM reconstruction of CtpS filaments.
(A) A field of CtpS filaments in cryo-EM. (B) Cryo-EM image of a single CtpS filament. (C) The reconstruction of CtpS filament shown at 8.4 Å resolution. In addition to the refined helical symmetry, local 2-2-2 point group symmetry was imposed on each helical subunit. (D) The resolution of the final reconstruction was estimated in two ways: the standard even-odd half volume test (blue), and a comparison of the cryo-EM structure to the atomic model (red). For both measures, the resolution is estimated at 10.4 Å by the 0.5 cutoff criterion, and 8.4 Å by the 0.143 criterion.
Figure 3—figure supplement 2

The CtpS monomer in the filament is in a similar conformation to crystallographic structures, and ADP and CTP are present.
(A) The fit CtpS monomer structure (orange) is overlaid with the available crystal structures of full-length CtpS (gray), aligned on the N-terminal ALase domain. (B) A difference map (blue mesh) was calculated between a model of the CtpS filament calculated from the fit crystal structure and the EM structure. Strong density (here rendered at 8σ) is observed for CTP in its binding site, while the ALase active site (red residues) remains empty. (C) Similarly strong density is found in the difference map in the positions of bound ADP. (D) Very weak density is observed for glutamine in the glutaminase active site (orange sticks), and no density associated with the proposed GTP binding site (red), suggesting weak or no binding of glutamine or GTP.
Figure 4
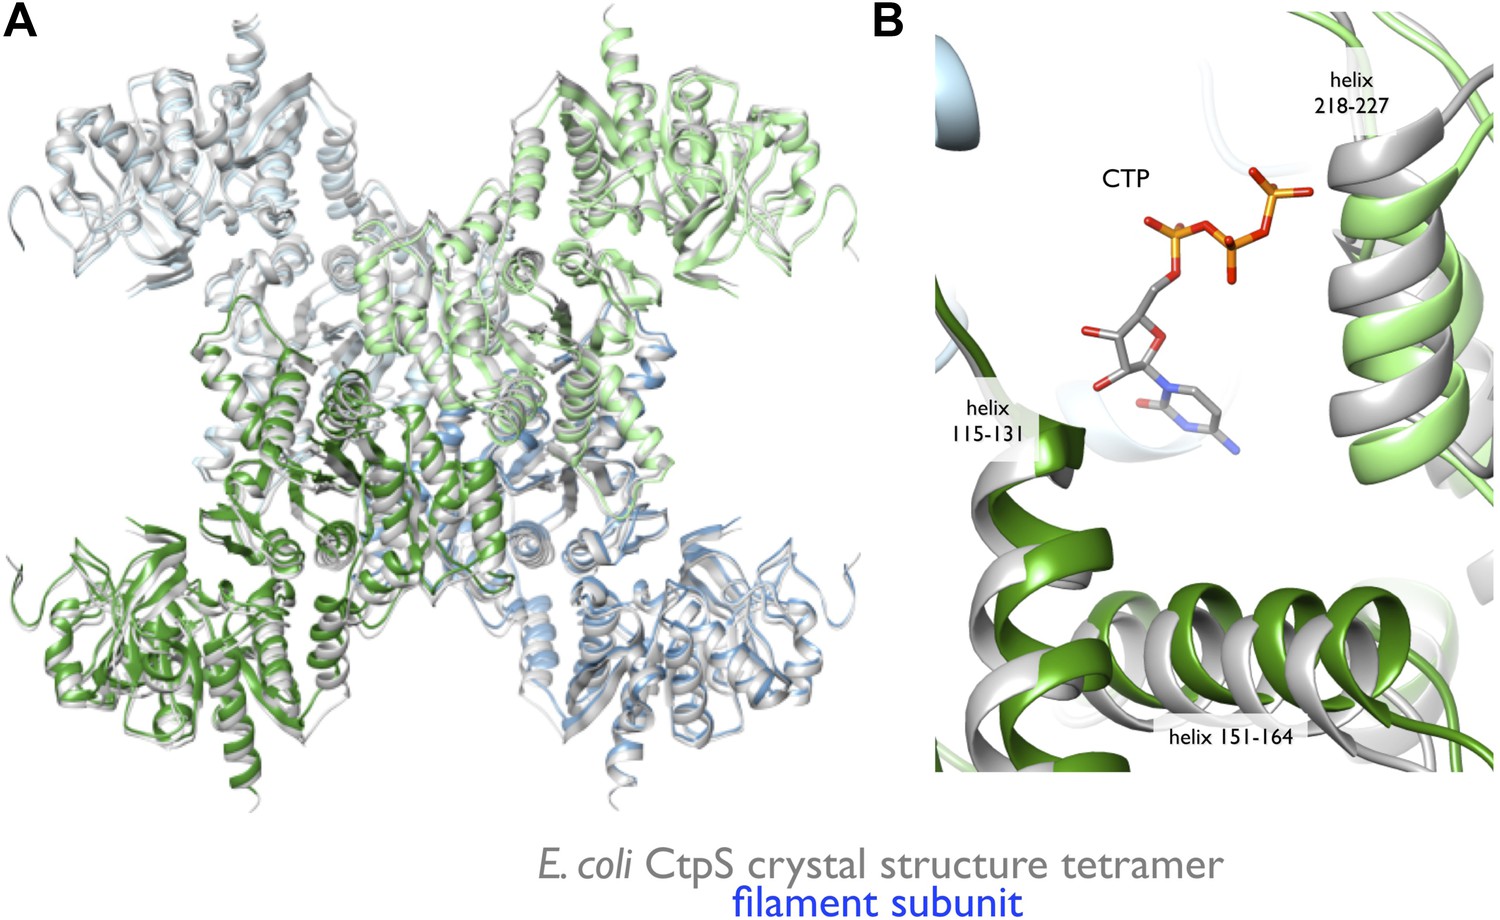
Rearrangement of the CtpS tetramerization interface within the filament.
(A) Superposition of the E. coli crystallographic tetramer (gray) with the atomic model from the cryo-EM structure (color), shows a rearrangement of the tetramerization contacts, primarily a compression of the tetramer along the filament axis. (B) Rearrangements of the tetramerization contacts shift the relative positions of helices near bound CTP (gray: crystal structure; color cryo-EM structure).
Figure 5
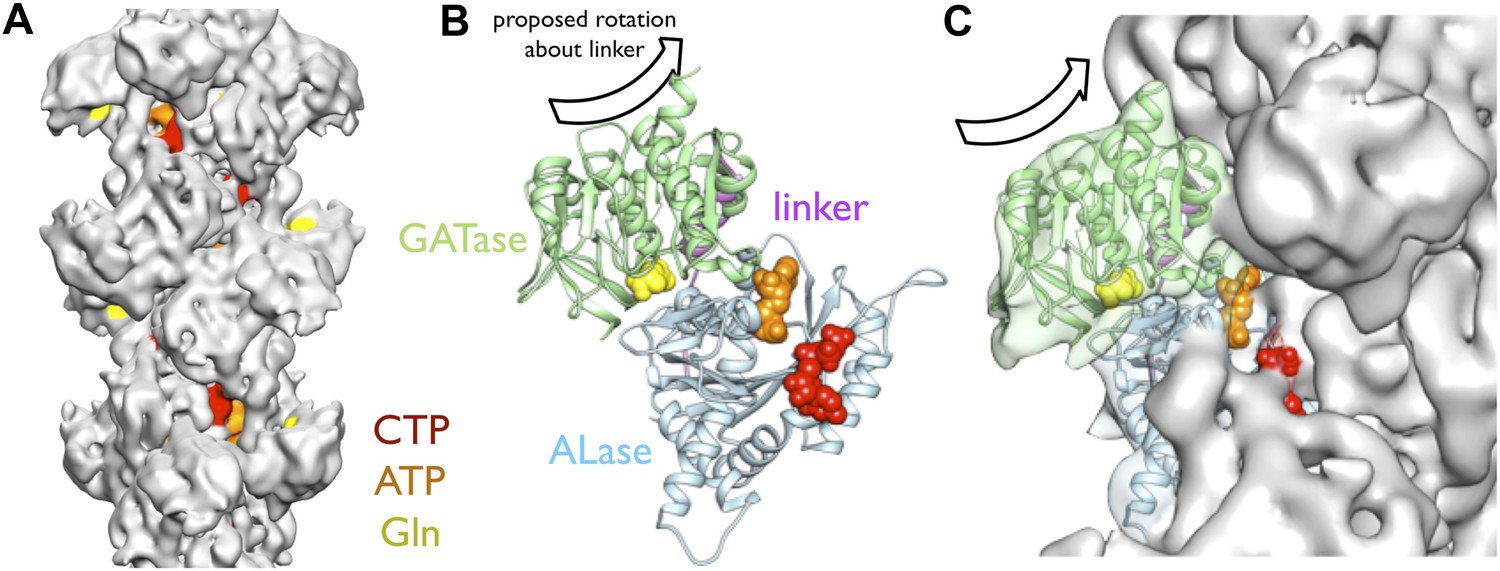
Implications of the CtpS filament structure for the mechanism of enzyme inhibition.
(A) The binding sites for ATP, CTP, and glutamine are all solvent accessible in the filament, suggesting that they are freely exchangeable in the filament form. (B) The approximate direction of the putative rotation of the glutaminase domain toward the amidoligase domain (arrow), which is predicted to create a shorter channel for ammonia diffusion. (C) In the filament structure, such a conformational change would be sterically hindered by contacts with adjacent filament subunits.
Figure 6 with 1 supplement
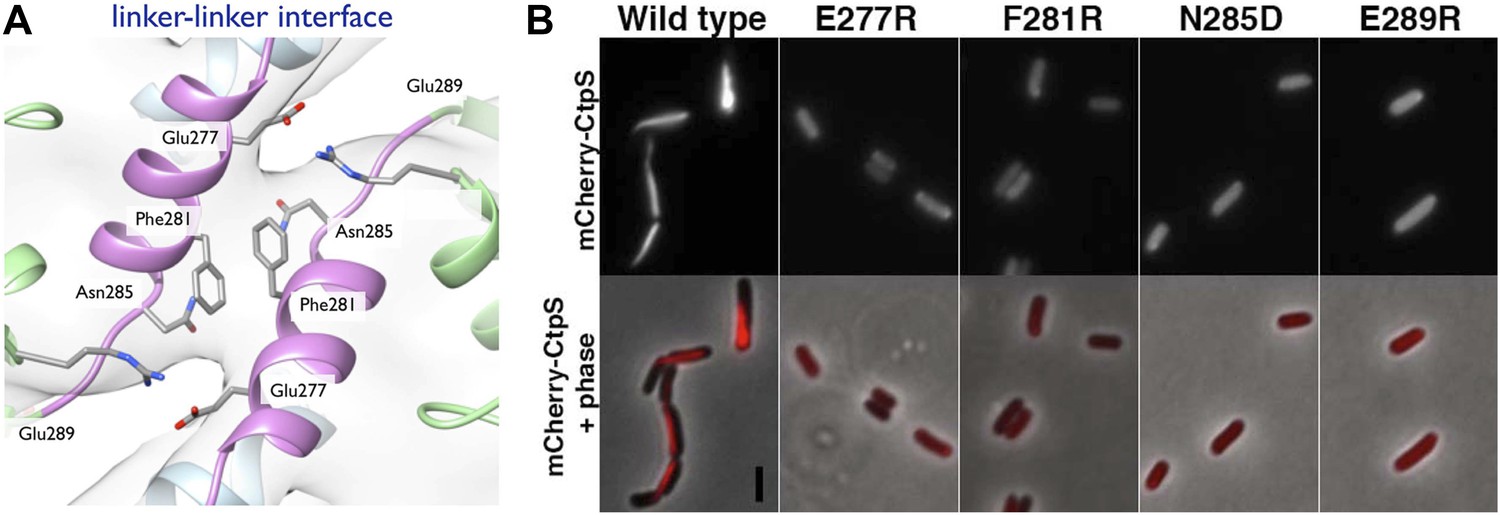
Linker helix residues form a polymerization interface.
(A) The positions of the four polymerization mutants in the model of the linker–linker filament assembly interface. (B) Point mutants were engineered into an mCherry-CtpS fusion and imaged upon expression in E. coli. Scale bar = 3 microns. Wild type mCherry-CtpS forms filaments while mutant mCherry-CtpSs show diffuse localizations.
Figure 6—figure supplement 1
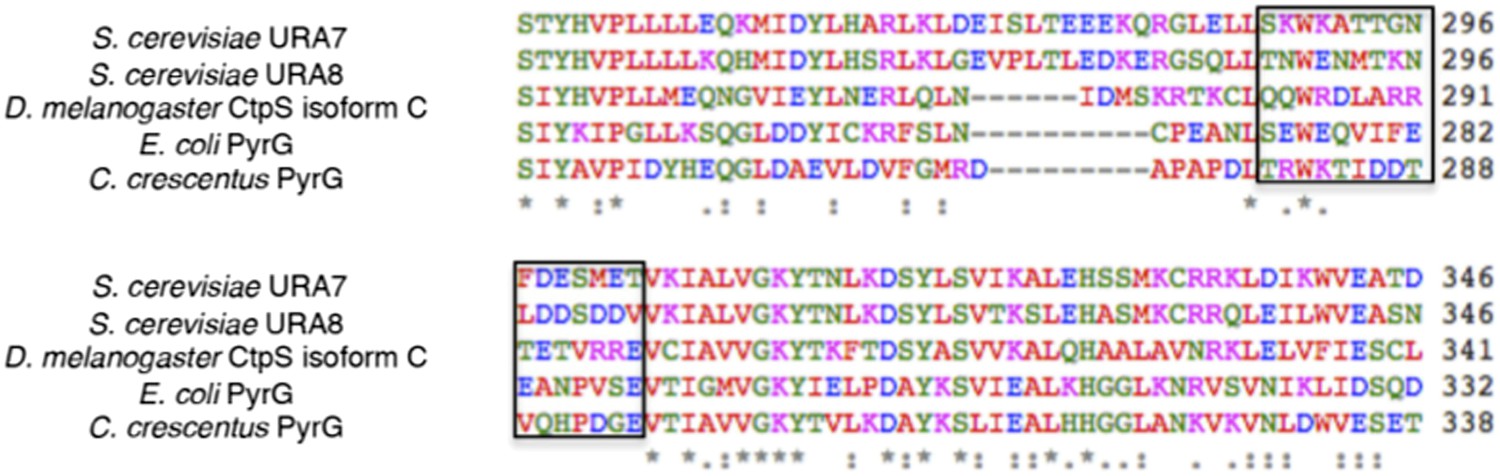
Sequence alignment of several CtpS primary sequences.
Note that the linker region is comprised of residues 274–284 in the E. coli sequence. The primary sequence of this region is not strongly conserved across species, however, there are several potential electrostatic (blue, purple) or hydrophobic (red) pi-stacking interactions between residues of adjacent tetramers. The linker region and nearby residues where site-mutations were engineered into E. coli CtpS is boxed in black.
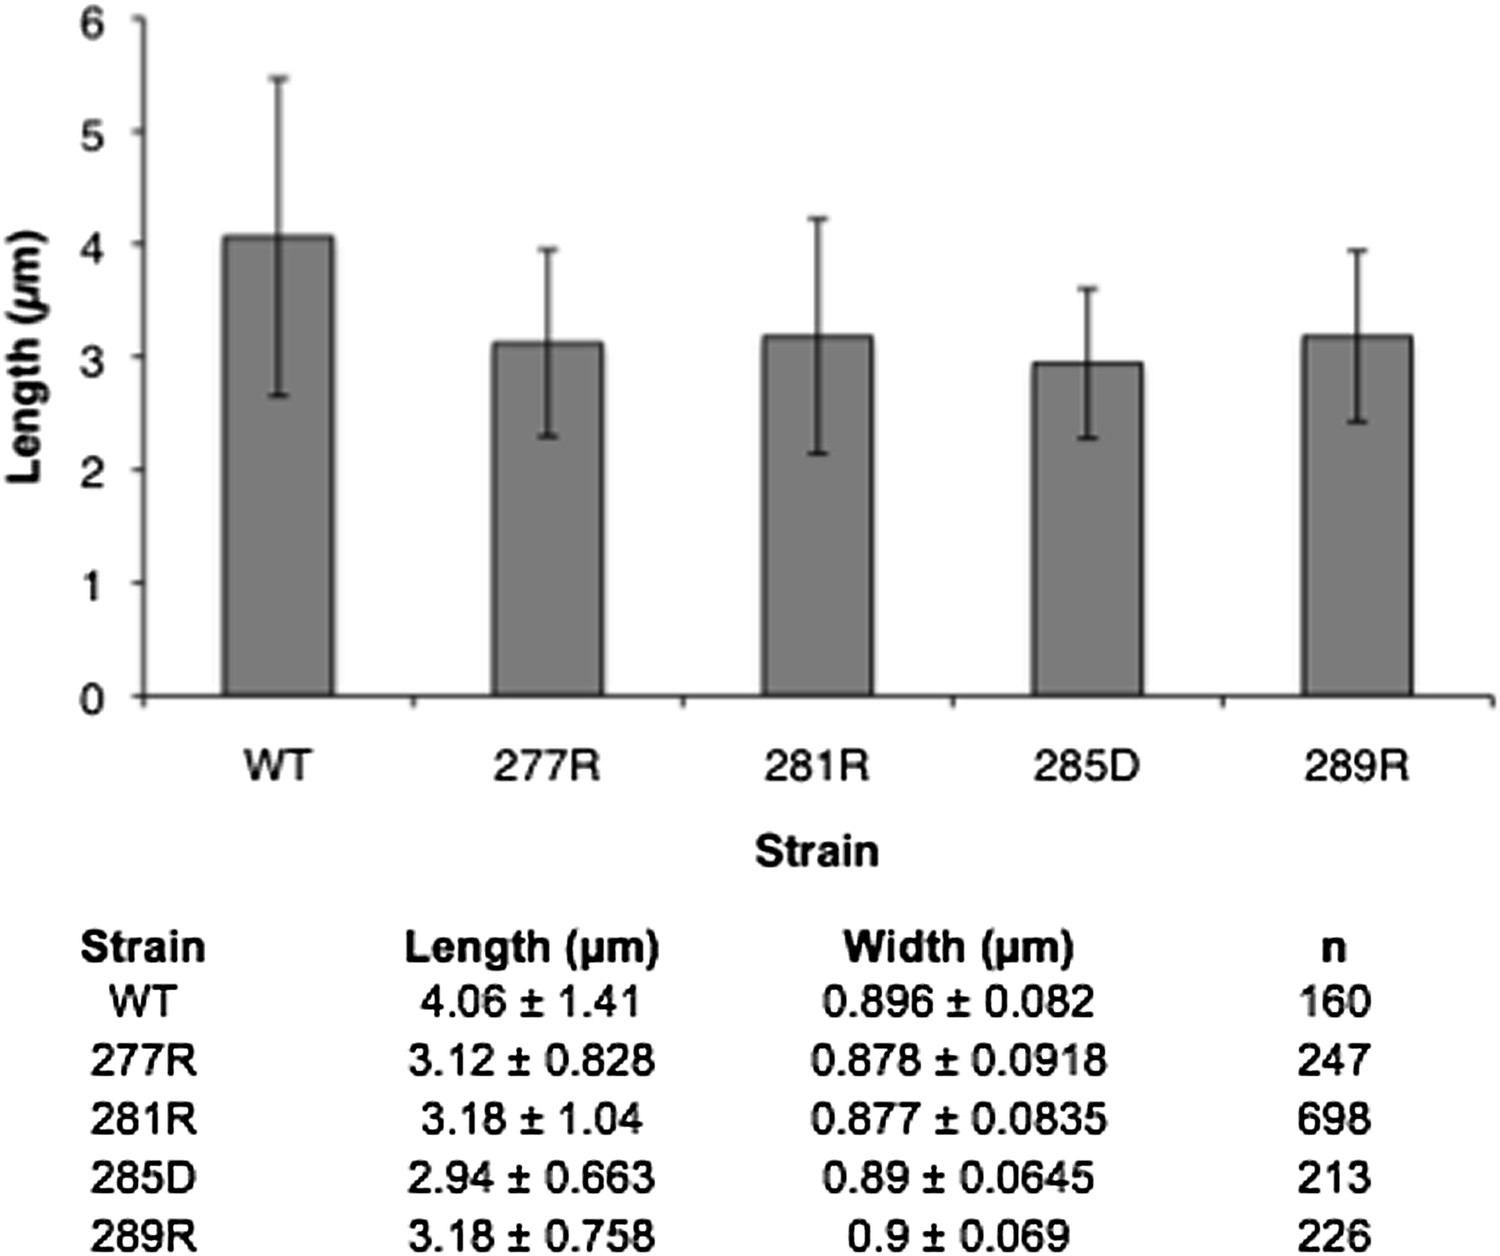
Figure 7 with 4 supplements

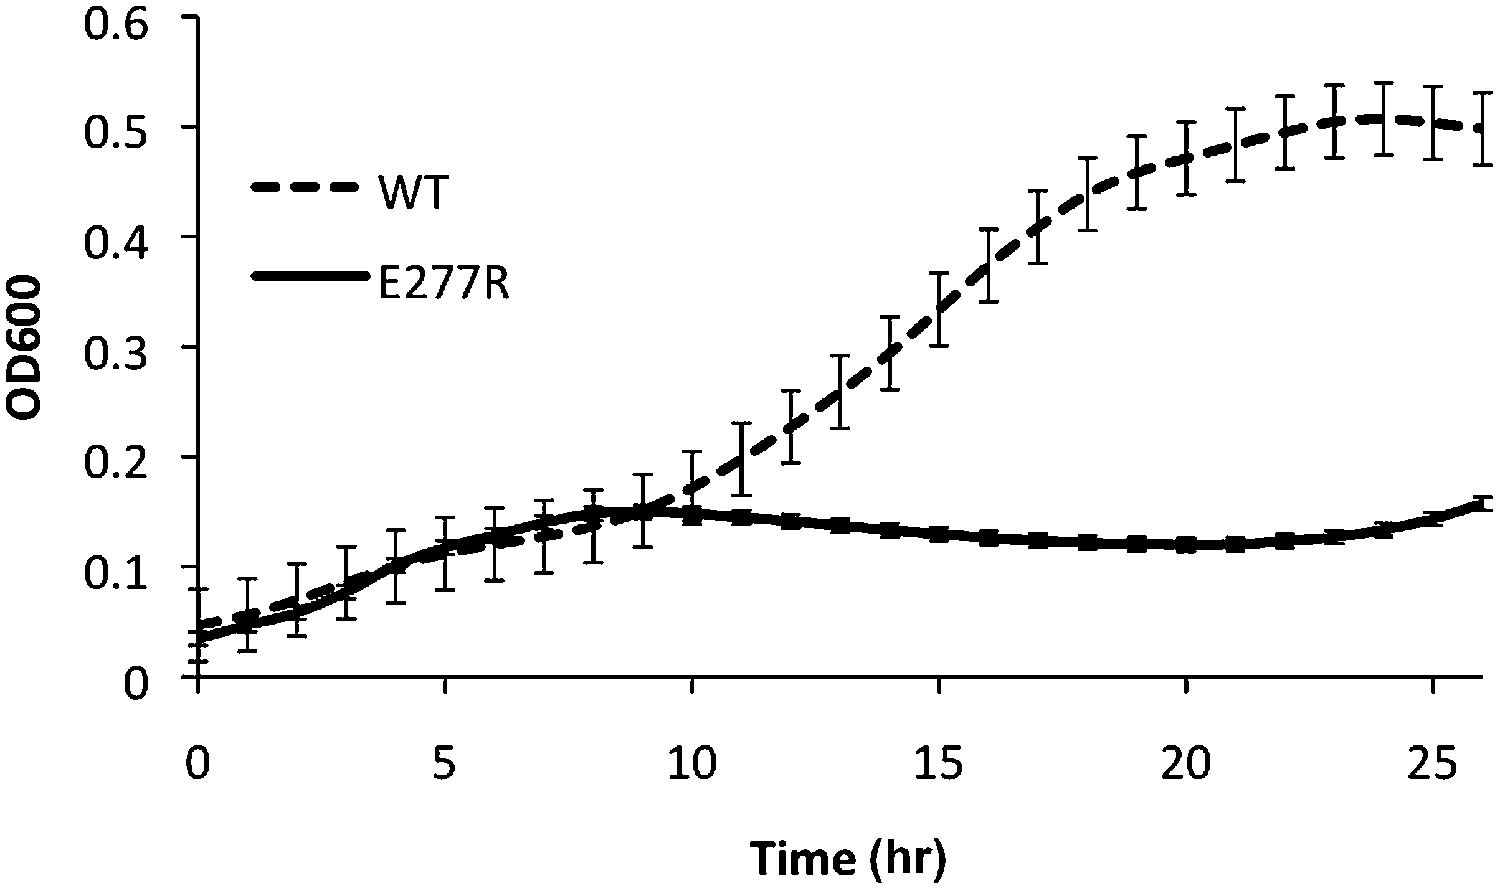
Linker helix mutations disrupt polymerization and cause a growth defect.
(A) The CTP production activity of titrated levels of CtpSE227R exhibited a small decrease in enzymatic activity as enzyme concentration increases when compared to wild-type protein. Error bars = SD, n = 3–6. (B) Purified CtpSE277R does not polymerize in the presence of CTP. For both wild-type and E277R CtpS, there were very few filaments observed in the absence of CTP (top row). Upon the addition of nucleotide and MgCl2, filaments were only observed in the wild-type sample (first column). (C) Growth curve comparing wild-type and CtpSE277R cells in LB media. CtpSE277R exhibits defective growth when compared to cells with wild-type CtpS. Both strains were grown overnight and subcultured into LB media. Growth curve comparing wild type to the defective growth of CtpSE277R mutant E. coli in minimal media. CtpSE277R mutants exhibit defective growth. Error bars = SE, n = 18.
Figure 7—figure supplement 1
CtpSE277R does not polymerize in vitro.
Right angle light scattering by CtpSE277R in activity buffer. Error bars = SE, n = 3.
Figure 7—figure supplement 2
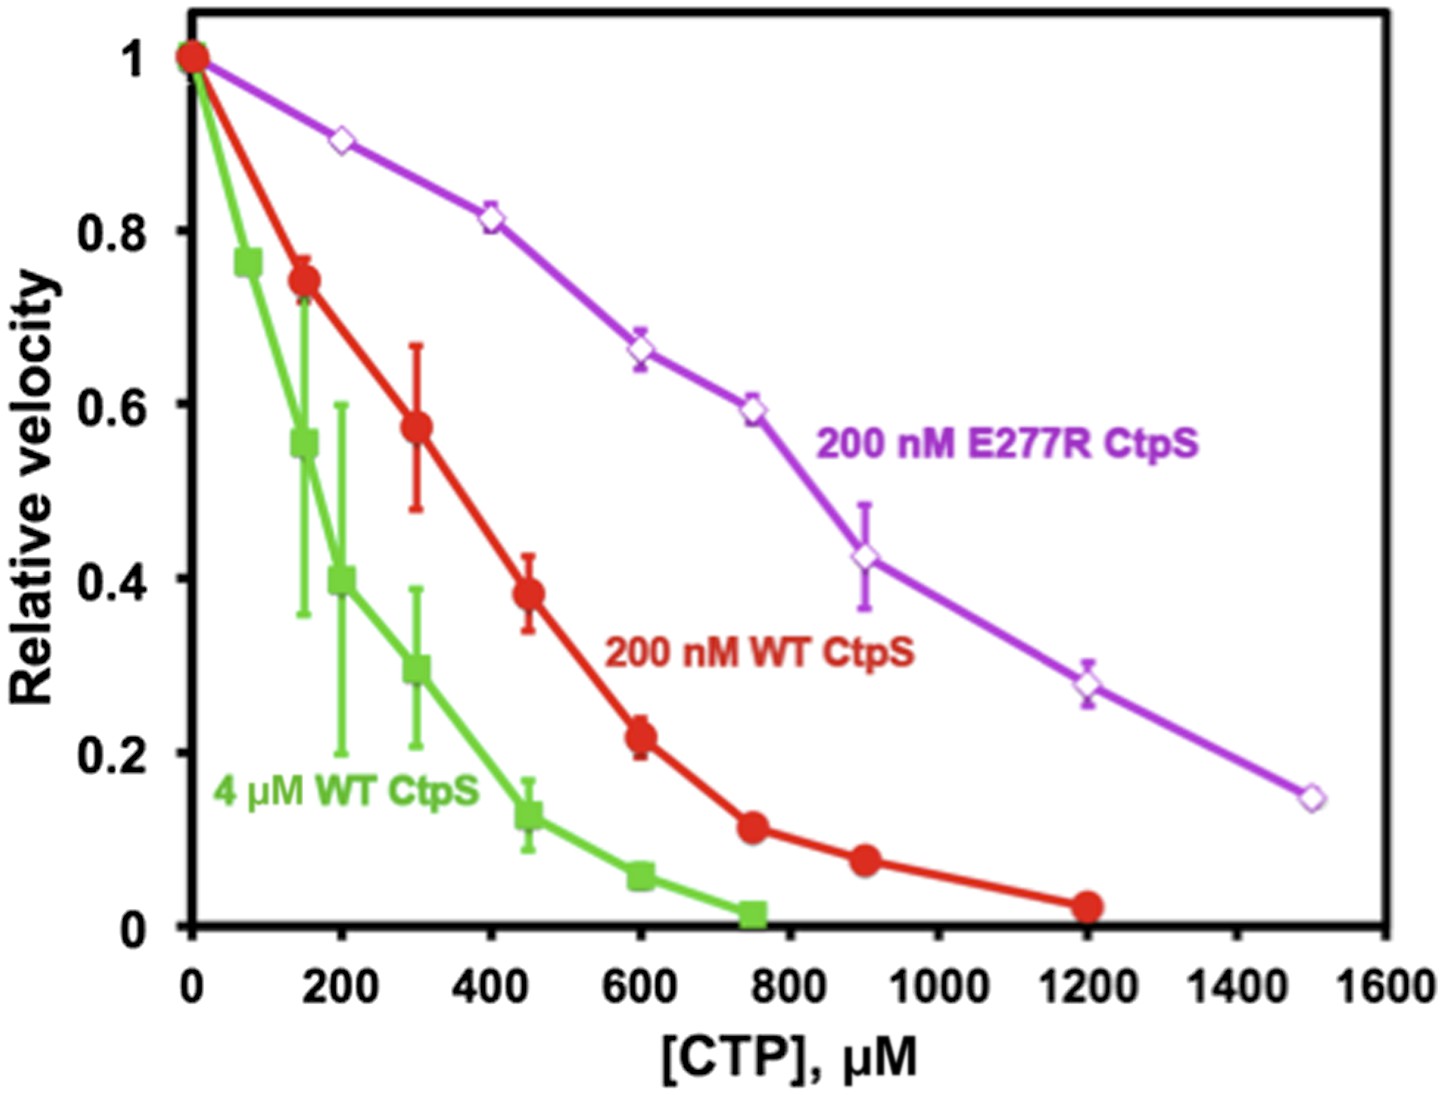
Polymerization enhances the inhibition of CtpS activity by CTP.
At a CtpS concentration below the threshold concentration, (200 nM, red circles), the CTP IC50 value is 330 μM. At concentrations that favor polymerization (4 μM CtpS, green squares), CTP binds with higher apparent affinity with an IC50 of 170 μM. Abolishing polymerization with E277R mutation reduced apparent CTP activity inhibtion (IC50 = 833 μM at 200 nM CtpSE277R) (purple open diamonds). The CTP synthesis vo values before normalization were 1.24, 18.5, and 0.82 μM/s for 200 nM CtpS, 4 μM CtpS, and 200 nM CtpSE277R, respectively.
Figure 7—figure supplement 3
Growth curve comparing wild type to the defective growth of CtpSE277R mutant E. coli in minimal media.
CtpSE277R mutants exhibit defective growth. Error bars = SE, n = 36.
Figure 7—figure supplement 4
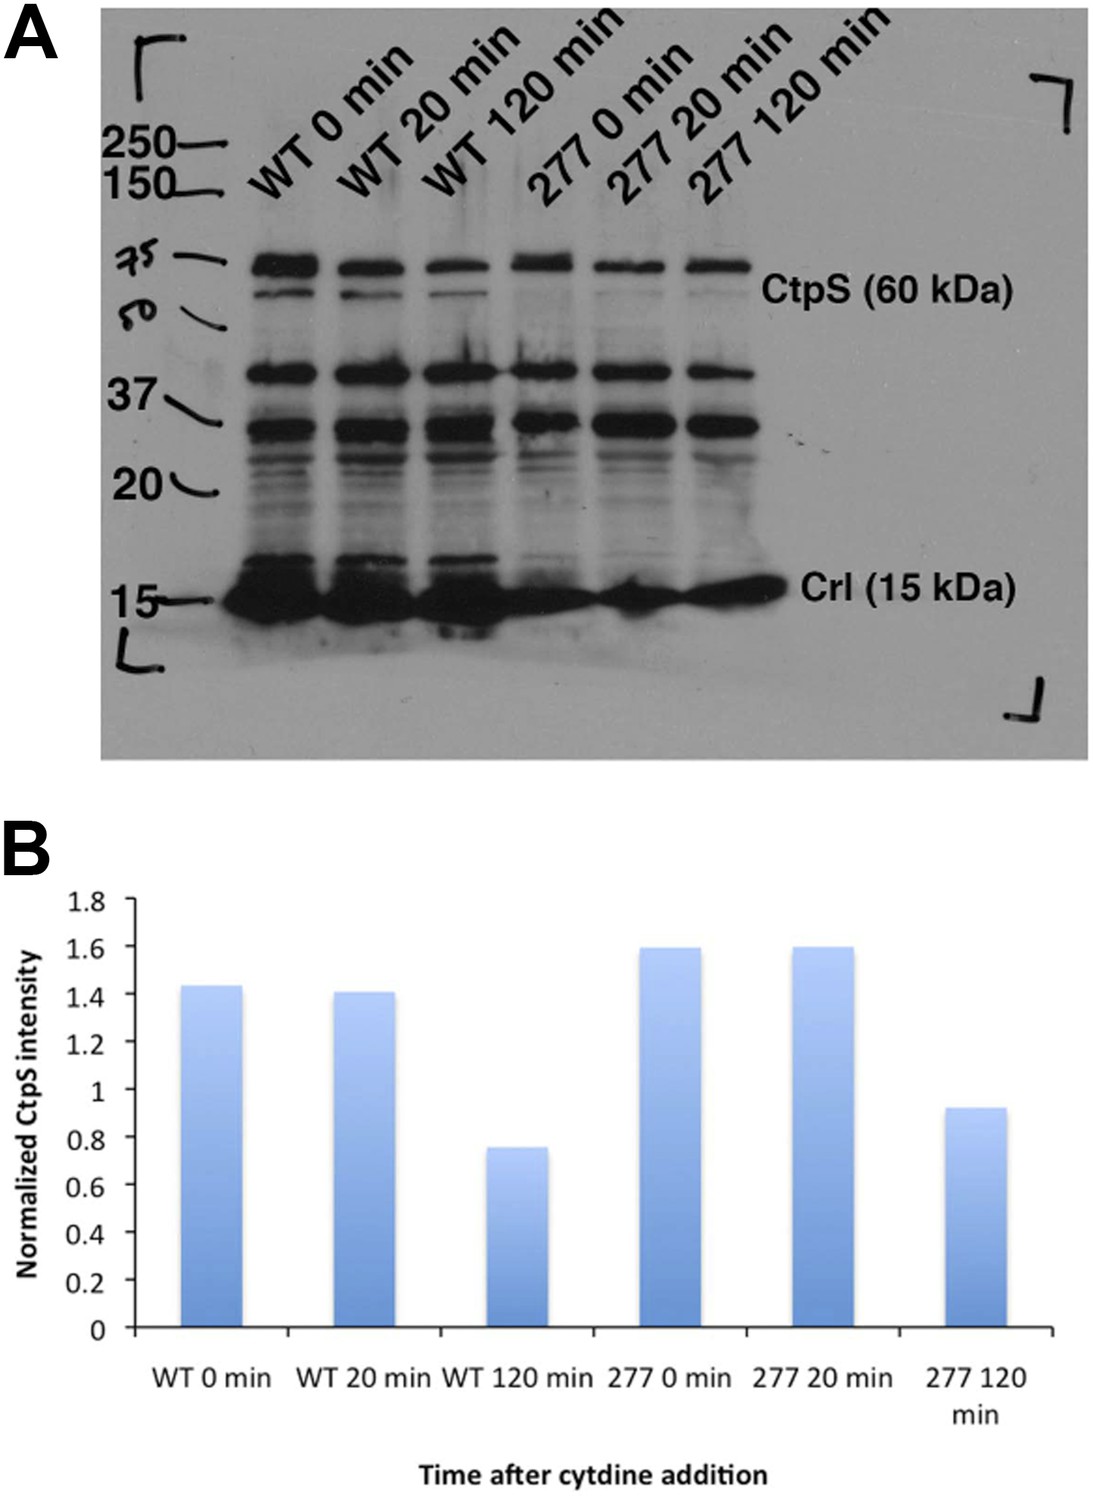
CtpS protein levels are not depleted in the CtpSE277R mutant.
(A) Immunoblot probing CtpS and Crl (loading control) levels in NCM3722 kanR and CtpSE277R cells after the addition of 200 µg/ml. (B) Relative intensity of CtpS normalized to Crl levels.
Figure 8 with 3 supplements

Mutation of polymerization interface disrupts CTP homeostasis in vivo.
(A) Metabolic profiling of wild type and CtpSE277R mutant cells after addition of cytidine to minimal media. Nucleotide biosynthesis molecules are shown. (B) Incorporation of C13-label into CTP pool in wild-type and CtpSE277R mutant cells. Incorporation occurs at similar levels in both strains. Error bars = SE, n = 3. (C) The proportion of unlabeled (C12) CTP in wild-type and CtpSE277R mutant cells. The ratio of C12-CTP to total CTP is higher in the CtpSE277R strain. Error bars = SE, n = 3. (D) Model of the fraction of active (nonpolymerized and UTP-bound) CtpS, plotted vs CTP concentration. Comparison is shown between competitive inhibition with polymerization, noncompetitive inhibition with polymerization, competitive-nonpolymerizing, and noncompetitive-nonpolymerizing mechanisms. In all cases, we chose a fixed UTP concentration equal to Kcp, the dissociation constant of CTP and polymerized CtpS (see Supplementary file 1 for details).
Figure 8—figure supplement 1
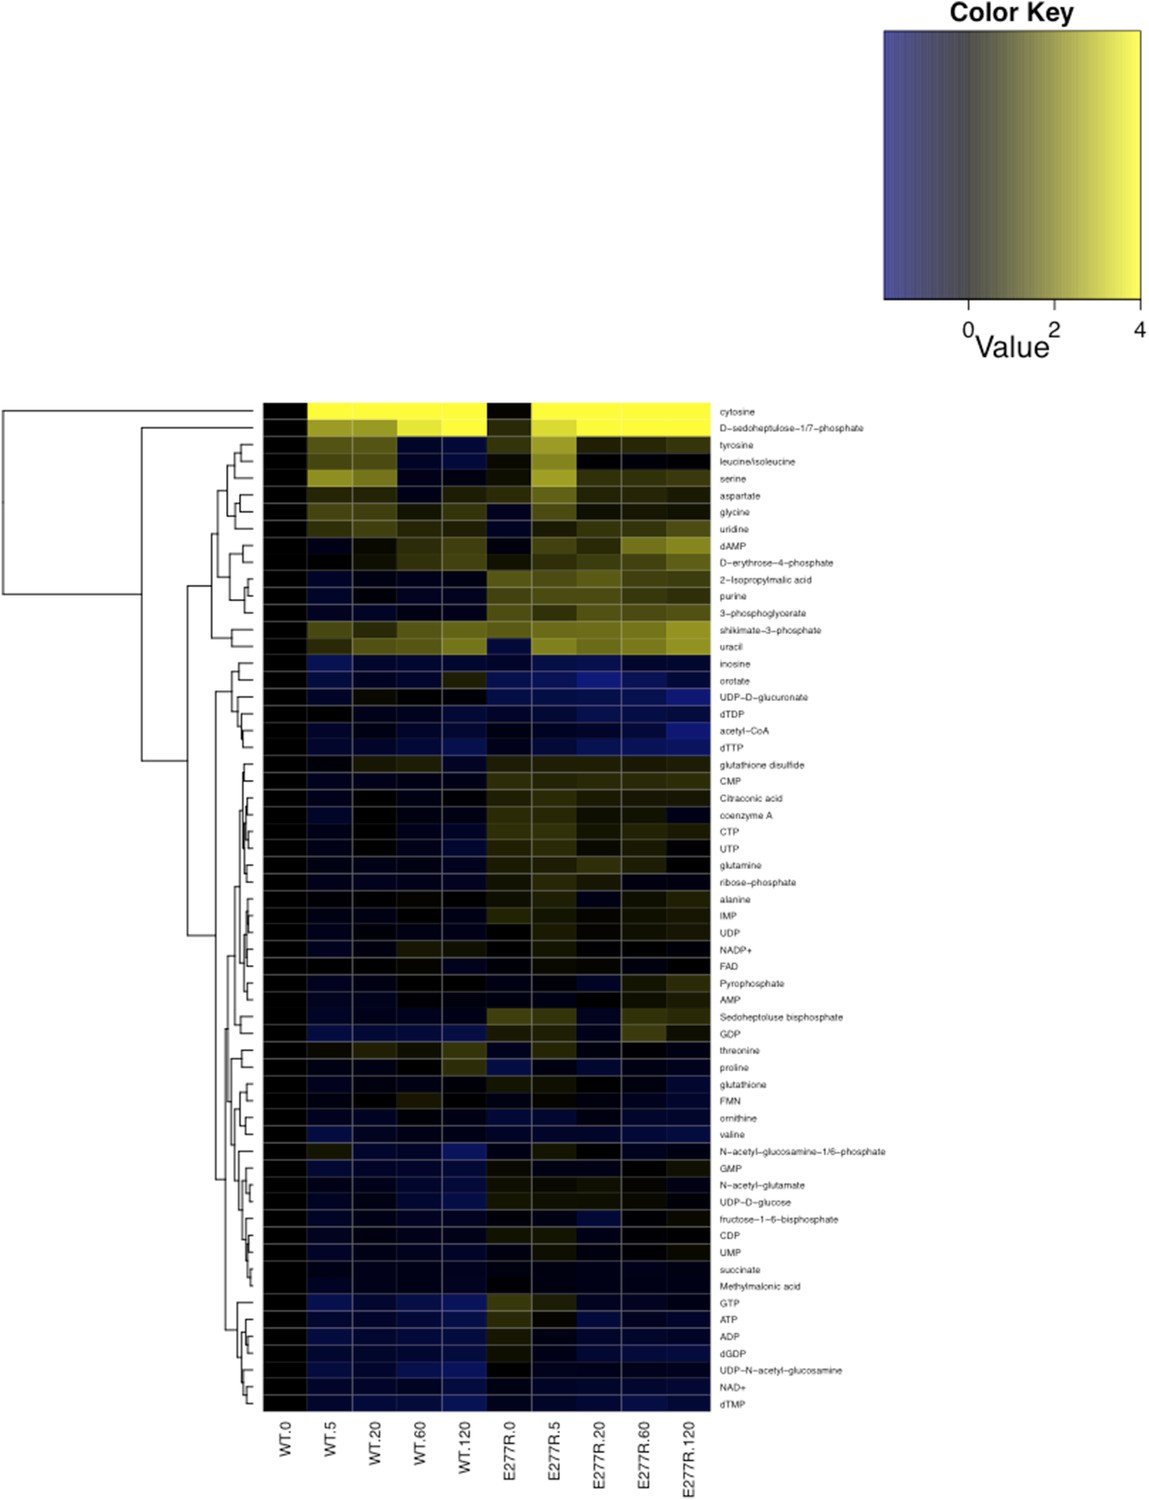
Metabolomic analysis of wild-type and CtpSE277R E. coli after addition of 200 µg/ml C13-cytidine.
Fold changes of metabolite levels of NCM3722 kanR E. coli and CtpSE277R E. coli were compared to wild type levels at 0 min. Hierarchical clustering of metabolites is shown.
Figure 8—figure supplement 2

CTP levels probed by mass spectrometry after addition of C13-labeled cytidine to the media.
Unlabeled C12-CTP population represents the proportion of CTP synthesized by CtpS from cellular pools of UTP. The CtpSE277R has a higher intracellular C12-CTP pool both at the initial time point as well as at the end of the time course, where C12-CTP is almost twice as high as in the wild-type strain.
Figure 8—figure supplement 3
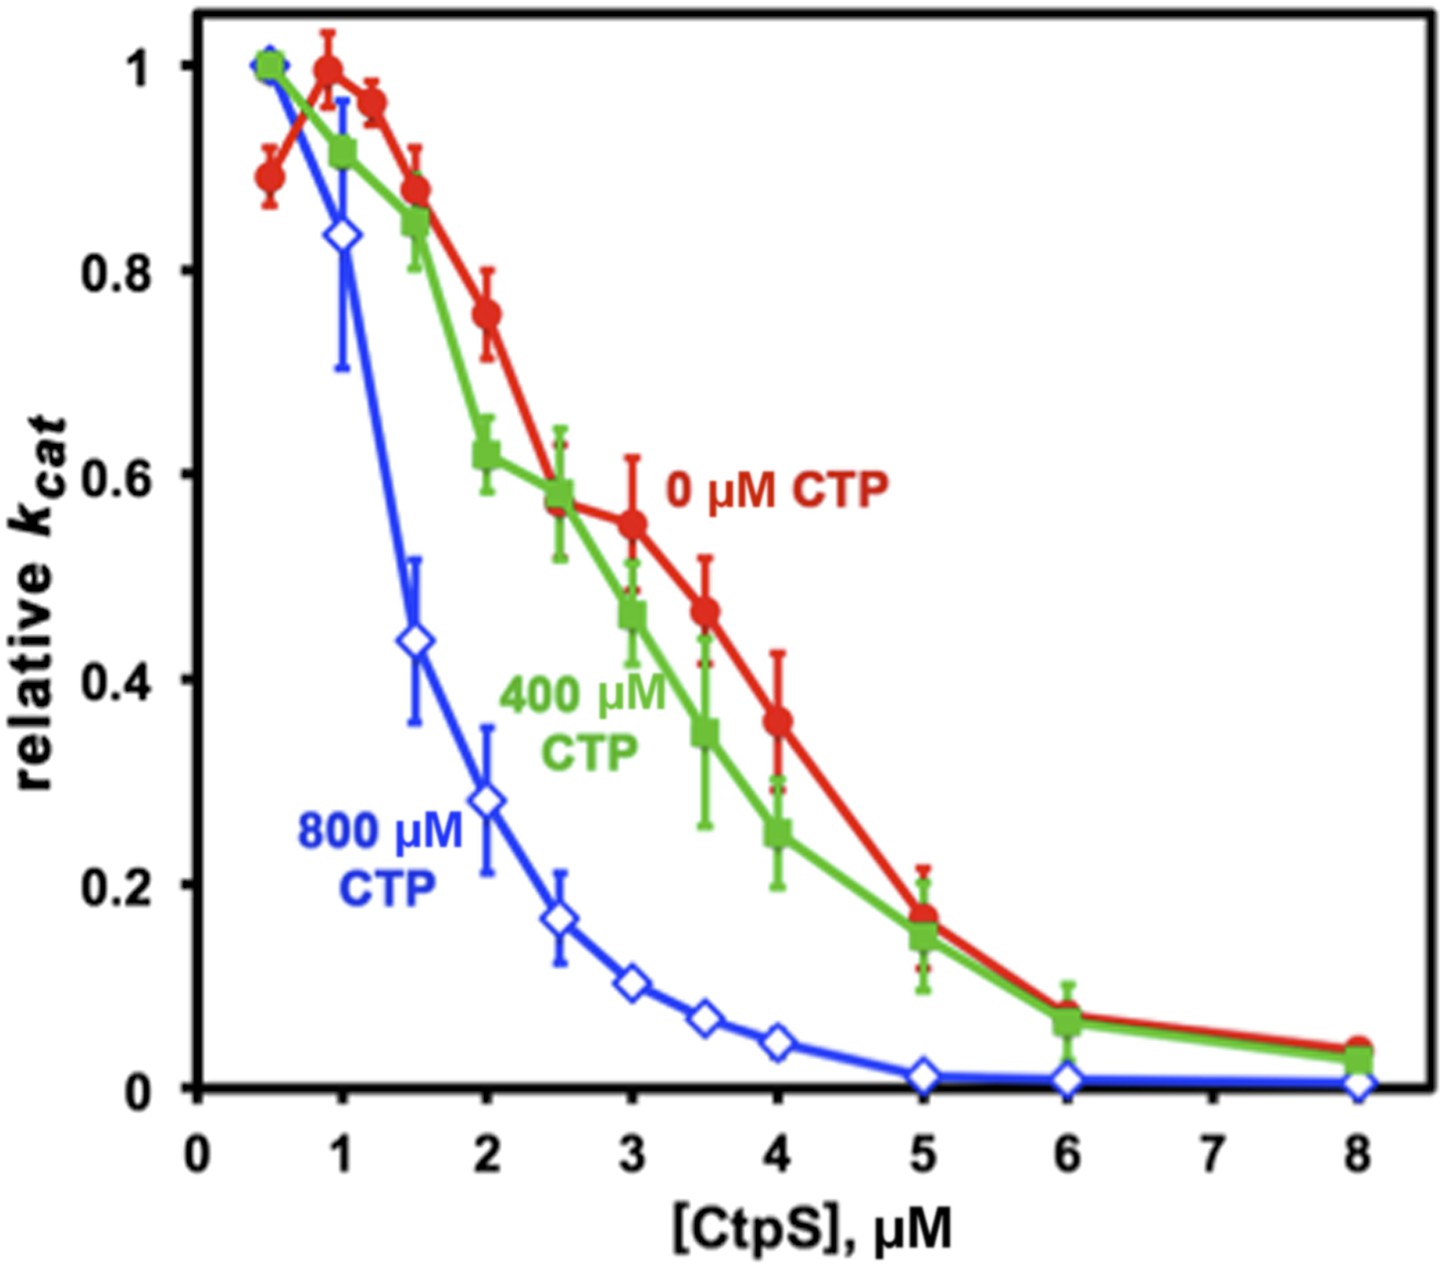
CTP binding enhances polymerization with a sharp response.
The concentration required to reduce CtpS-specific activity (kcat) to 50% of its maximum value, [CtpS]0.5, is inversely related to the affinity of the polymer for Ctps tetramers. In the absence of CTP, the [CtpS]0.5 value is 3.3 μM (red circles). At a CTP concentration near the IC50 value (400 μM), the [CtpS]0.5 value is slightly reduced (2.8 μM, green squares), while at 800 μM, the [CtpS]0.5 value significantly shifted towards polymerization ([CtpS]0.5 = 1.4 μM, blue open diamonds). The maximum kcat values before normalization were 6.7, 3.5, and 1.04 s−1 for experiments using 0, 400, and 800 μM CTP, respectively.
Figure 9
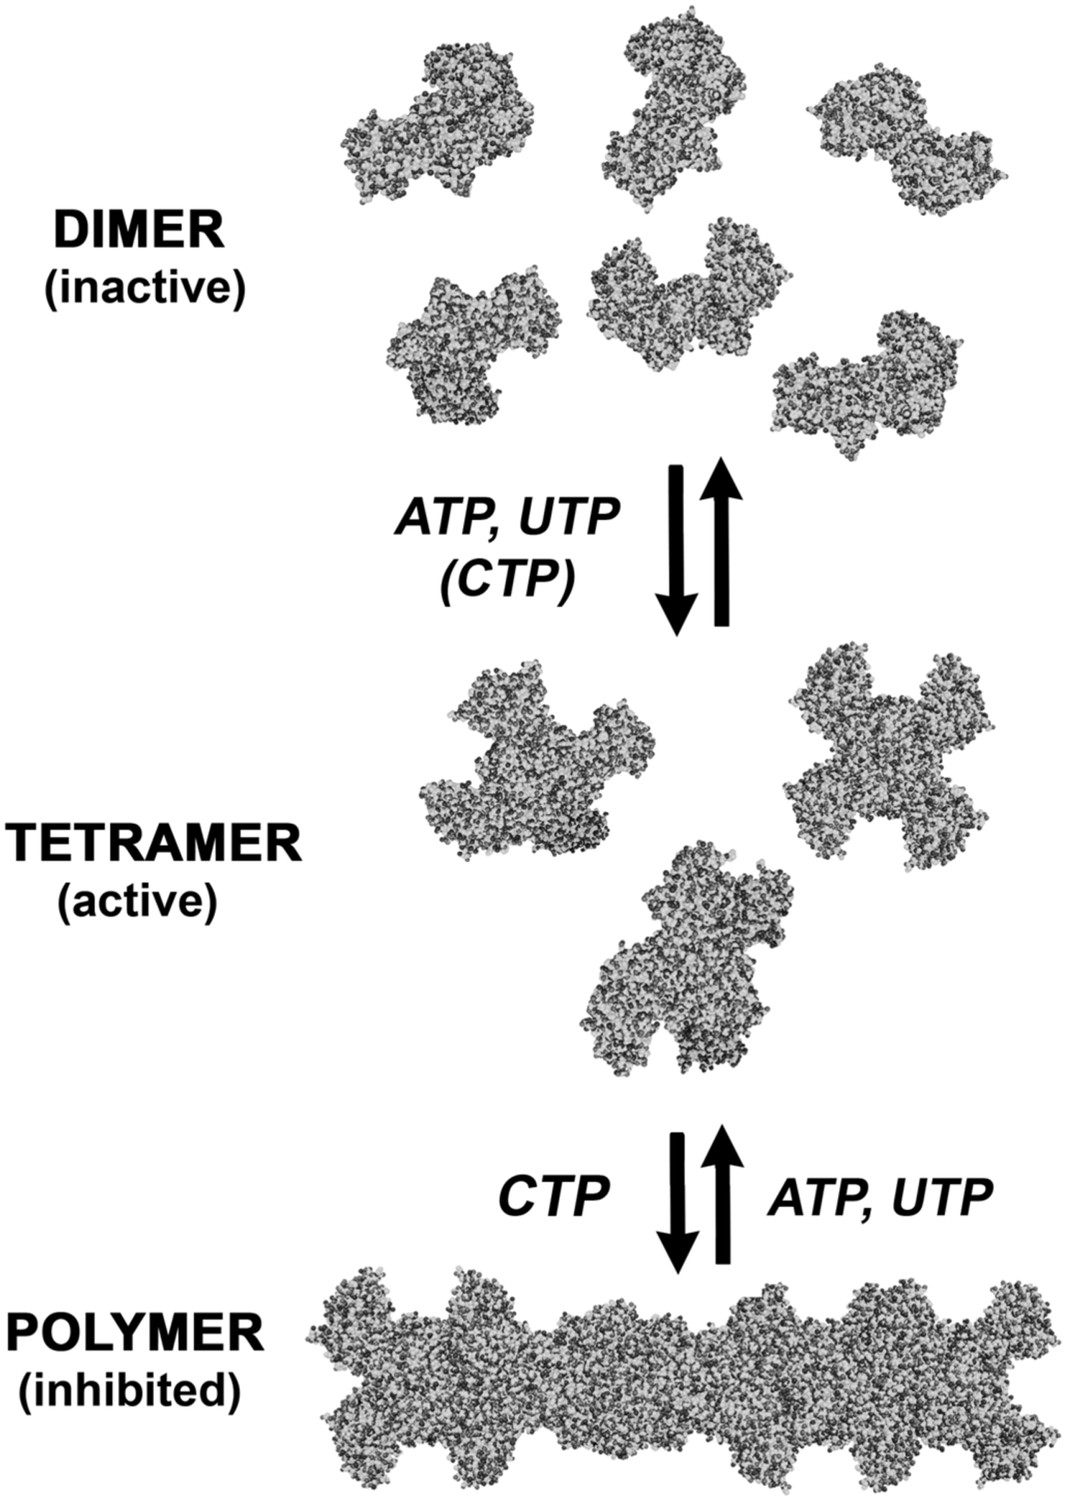
An expanded description of CtpS assembly.
As shown in Figure 1A, tetramer formation from CtpS dimers is favored by a combination of enzyme concentration as well as nucleotide (substrates ATP and UTP or product CTP) and Mg2+ binding. CTP binding and higher enzyme concentration further stimulates reversible formation of inhibited polymeric filaments, which can be disassembled by ATP/UTP.
Author response image 1
Author response image 2
Additional files
-
Supplementary file 1
Model of CtpS polymerization and inhibition.
- https://doi.org/10.7554/eLife.03638.034
Download links
A two-part list of links to download the article, or parts of the article, in various formats.
Downloads (link to download the article as PDF)
Open citations (links to open the citations from this article in various online reference manager services)
Cite this article (links to download the citations from this article in formats compatible with various reference manager tools)
Large-scale filament formation inhibits the activity of CTP synthetase
eLife 3:e03638.
https://doi.org/10.7554/eLife.03638


