Fast retrieval and autonomous regulation of single spontaneously recycling synaptic vesicles
- University of Texas Southwestern Medical Center, United States
Figures
Figure 1

Spontaneous increases in vGlut1-pHluorin fluorescence decay rapidly.
vGlut1-pHluorin was expressed via lentiviral infection in dissociated hippocampal cultures and neurons were imaged at 16–19 days in vitro. (A) Example image of vGlut1-pHluorin expression in NH4Cl (20 mM). Arrows indicate putative synapses. Scale bar is 5 μm. (B) Images were recorded in the presence of TTX, AP-5 and CNQX and spontaneous increases in fluorescence were observed. Example traces of spontaneous increases in fluorescence (3 left traces) and the average of all events in this experiment (right trace) are shown. Raw data is in grey, black trace is the moving average of three points, and the blue trace is a fit to a first order decay. (C) The amplitudes of spontaneous increases in fluorescence are distinguishable from noise. White bars are the amplitude change of a random section of the fluorescence recording, while successful events are in grey (for detection criteria see ‘Materials and methods’). Blue dashed line is a Gaussian fit centered at 0 a.u. and standard deviation of 212 a.u. (χ2 = 0.9). Red dashed line is a Gaussian distribution fit to the data with mean of 623 ± 122 a.u. and CV = 0.17 (n = 1178 events from four coverslips prepared from two cultures). (D) Distribution of decay times of spontaneous increases in fluorescence (grey) have a non-geometric (Beta-function) average of 0.37 s with upper bound = 7 and lower bound = 2 (n = 1178 events from four coverslips prepared from two cultures). Negative amplitude events from the same puncta (white) have a non-geometric (Beta-function) average of 0.20 s (n = 98 events from the same four coverslips). (E) Example traces of spontaneous increases in fluorescence in the presence of high (50 mM) Tris-buffered extracellular solution. (F) The resulting spontaneous increases in fluorescence were slower to decay with average decay time of 0.55 s with upper bound = 3.8 and lower bound = 2.1 (n = 1212 events from three coverslips generated from two cultures.) Inset shows cumulative probability distribution of decay time in cells with extracellular solution containing HEPES (Control; squares) and 50 mM Tris (circles) (KStest p < 0.001 with Dmax = 0.13 at 0.5 s). (G) Example traces of increases in fluorescence in response to single action-potential stimulation delivered at 0.05 Hz. (H) Amplitudes of stimulated increases in fluorescence are distinguishable from noise (white bars and blue Gaussian distribution) and could be fit with a Gaussian distribution centered at 641 ± 117 a.u. and CV = 0.26 (red dashed line; χ2 = 0.94). (I) Increases in fluorescence due to single-action potential stimulation delivered at 0.05 Hz were slower to decay with a non-geometric average of 0.83 s with upper bound = 4.4 and lower bound 3.6 and median decay time of 0.83 s (n = 694 events from four coverslips generated from two cultures). (J) Example traces of spontaneous increases in fluorescence in the presence of folimycin (80 nM). With inhibition of the vATPase, vesicles cannot be reacidified and therefore increases in fluorescence do not decay (n = 445 events from four coverslips generated from two cultures). (K) Amplitude distribution of spontaneous increases in fluorescence in the presence of folimycin are also distinguishable from noise and can be fit with a Gaussian curve with mean amplitude of 609 ± 195 a.u. and CV = 0.32 (χ2 = 0.87). (L) Cumulative probability histogram of amplitudes of spontaneous increases in fluorescence in 2 mM extracellular Ca2+ in the absence (open square) and presence of folimycin (grey square), and amplitudes of fluorescence increases evoked by stimulation (black square). The amplitude distributions of false positive events in 0 mM extracellular Ca2+ and folimycin (open diamond) and negative amplitude distributions of 0 mM extracellular Ca2+ false positive events (open triangle) were significantly smaller than amplitudes of putative spontaneous events with or without folimycin (KStest p < 0.05 for both false positive and negative amplitude) or stimulation-evoked fusion events (KStest p < 0.05 again for both conditions), but were not significantly different from one another (KStest p > 0.25 between false positives and negative amplitude distributions). The only significant difference between all distributions was between spontaneous increases in fluorescence with and without folimycin (KStest p < 0.05 Dmax = 0.08 at bin 450 a.u.).
Figure 2
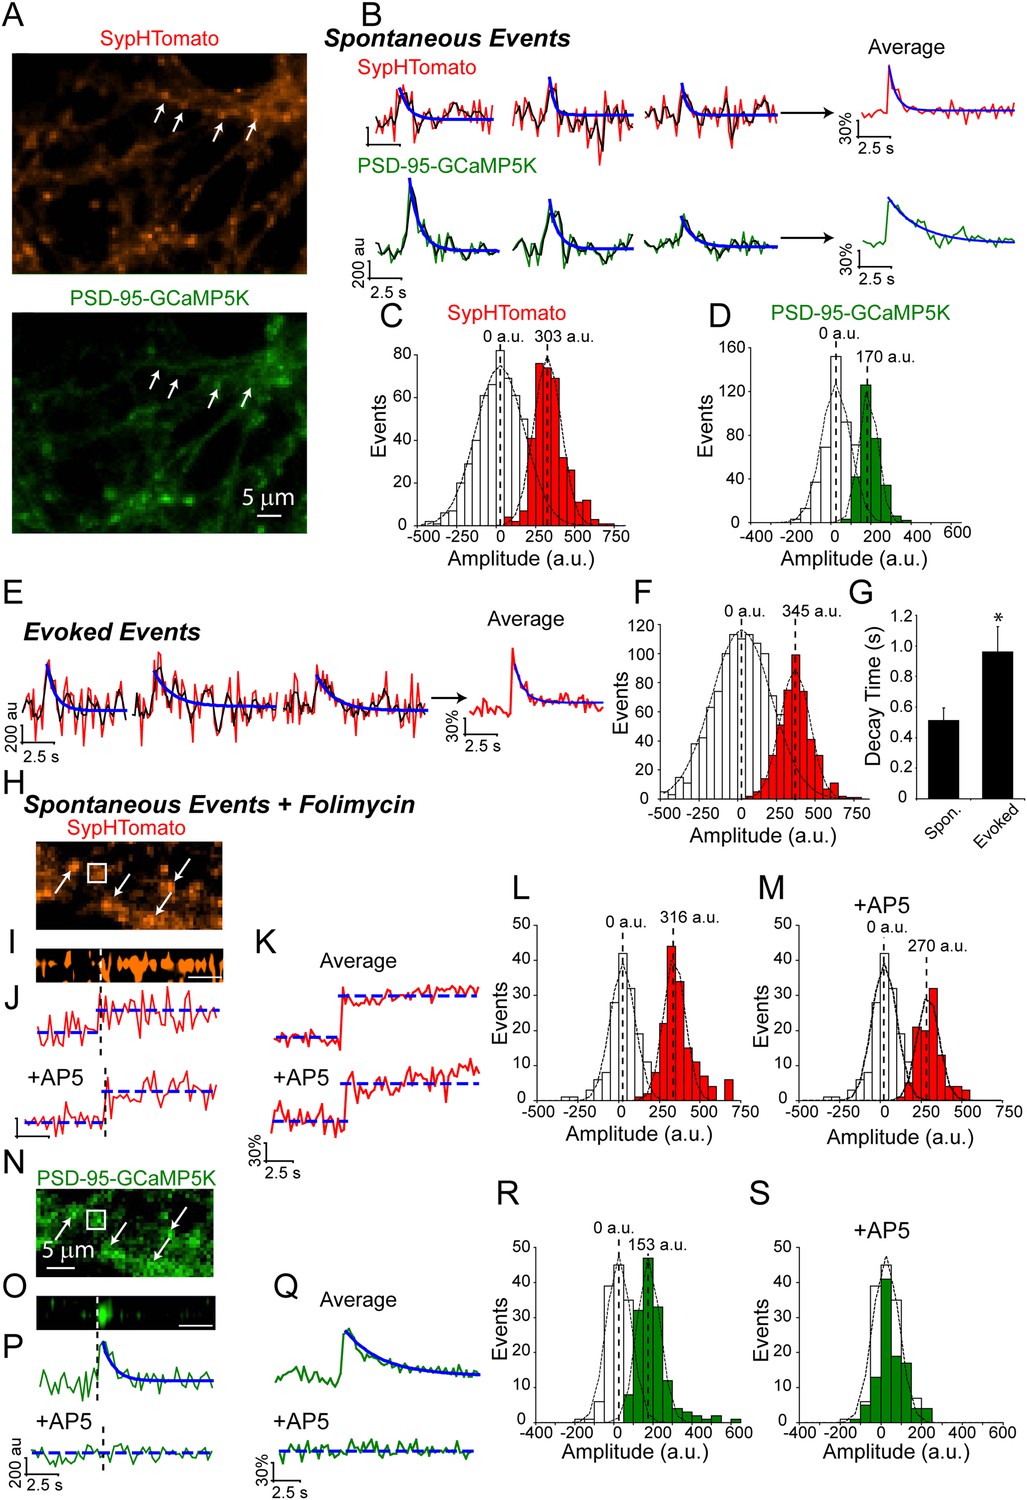
Dual color imaging shows that spontaneous fusion events are coupled to postsynaptic NMDA receptor-driven Ca2+ signals.
(A) Example images of SypHTomato and PSD-95-GCaMP5K expression. Arrows indicate putative synapses. Scale bar is 5 μm. (B) Example traces of SypHTomato (raw data in red, a moving average of three points in black and a fit of the decay time t in blue) and PSD-95-GCaMP5K (raw data in green, a moving average of three points in black and a fit of the decay time in blue). Because spontaneous increases in fluorescence were very small, we averaged events for each experiment representative average traces are shown at right. (C) The amplitude distribution of SypHTomato could be well fit with a Gaussian curve centered at 303 ± 92 a.u. (χ2 = 0.86) (n = 361 events from four coverslips generated from two cultures). (D) Amplitudes of PSD-95-GCaMP were distinguishable from noise and could be fit with a Gaussian curve with mean amplitude of 170 ± 50 (χ2 = 0.98) (n = 361 events from four coverslips generated from two cultures). (E) Example traces of SypHTomato fluorescence in response to single action potentials delivered at 0.05 Hz. Again, raw data is in red, a moving average of 3 points is in black and the decay time fit is in blue (n = 443 events from four coverslips generated from two cultures). (F) Amplitudes of fluorescence increases evoked by action-potential stimulation could be well fit by a Gaussian curve with mean of 345 ± 95 a.u (χ2 = 0.99). (G) Averaged traces of spontaneous increases in fluorescence decayed back to baseline with decay time = 0.51 ± 0.08 s (n = 4), while events that responded to stimulation (n = 3) decayed much slower t = 0.96 ± 0.06 (Student's t-test p value <0.05). (H) Example image of SypHTomato expression in the presence of folimycin. Arrows indicate putative synapses. The box is the region from which a line scan was taken (shown in panel I). (I) Line scan of SypHTomato fluorescence. White dashed line indicates where on the corresponding trace the fluorescence step occurred, scale bar = 2.6 s. (J) Example traces of events in the presence and absence of AP-5 from the same synapses. (K) Average of traces from the experiment of step-wise increase in fluorescence in the presence and absence of AP-5. (L) Increases in fluorescence in the presence of folimycin were separable from noise and could be fit with a Gaussian with mean amplitude of 316 ± 65 a.u. (χ2 = 0.49) (n = 154 events from four coverslips generated from two cultures). (M) The same synapses in the presence of AP-5 showed spontaneous increases in fluorescence that were still distinguishable from noise albeit with a slightly smaller amplitude distribution 270 ± 65 a.u. (χ2 = 0.48) that was not significantly different from amplitudes in the presence of folimcyin (not shown; KStest p < 0.01) (n = 103 events from four coverslips generated from two cultures). (N) Example image of corresponding PSD-95-GCaMP5K fluorescence. White arrows indicate putative synapses. The box is the region from which a line scan was taken. (O) Line scan of PSD-95-GCaMP5K fluorescence signal that occurred at the same time as the above SypHTomato signal. (P) Example traces of events in the presence and absence of AP-5. (Q) Average of traces in the presence and absence of AP-5. In the presence of AP-5, entry of Ca2+ into the postsynaptic terminal is prevented and thus there is no GCaMP5K signal. (R) PSD-95-GCaMP5K signals were separable from noise and could be fit with a Gaussian curve with mean amplitude of 153 ± 58 a.u. (χ2 = 0.80) (n = 154 events from four coverslips generated from two cultures). (S) In the presence of AP-5, Ca2+ is prevented from entering the postsynaptic terminal and results in no detectable GCaMP5K events (n = 103 events from four coverslips generated from two cultures.).
Figure 3 with 1 supplement
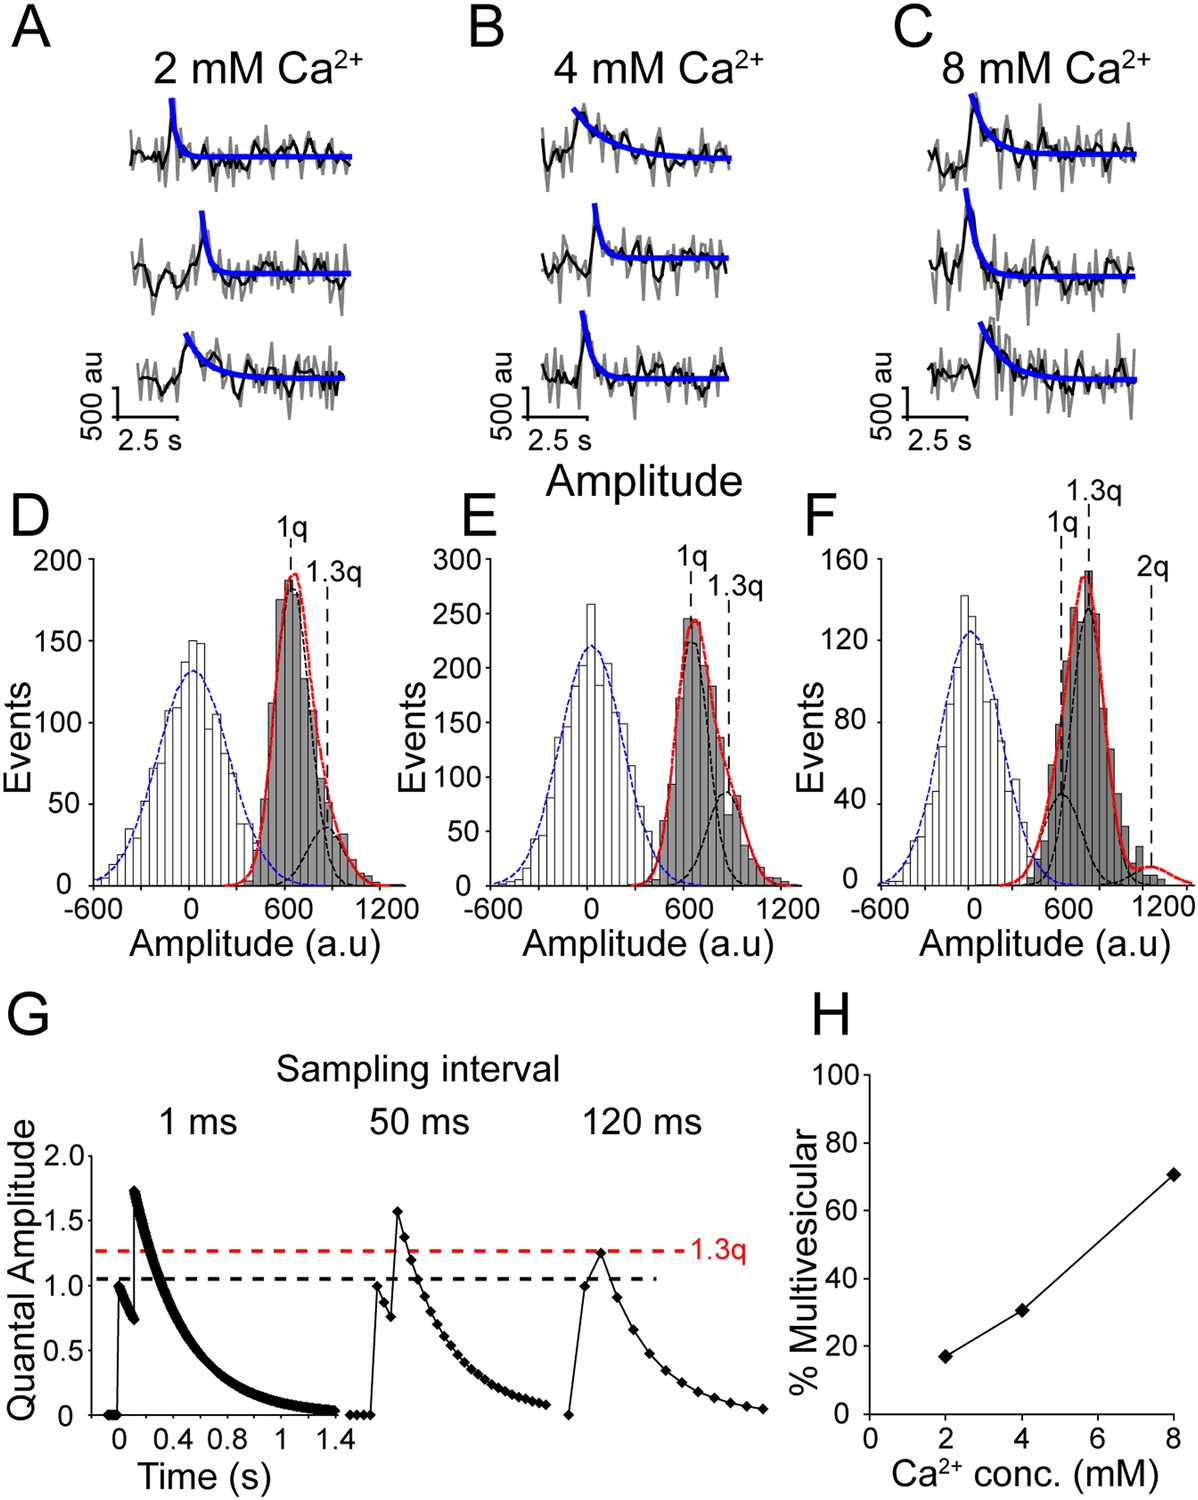
Increasing extracellular Ca2+ increases multivesicular release.
(A–C) Example traces of events in 2 mM (A), 4 mM (B) and 8 mM (C) extracellular Ca2+. Raw data are shown in grey, a moving average of 3 points is shown in black and the blue line indicates a fit of the decay. (D–F) Fluorescence amplitude distributions. White bars are noise fit by blue Gaussian distribution centered at 0 a.u., grey bars are successful fusion events fit by multiple Gaussian curves (black lines) and a sum of Gaussian curves (in red). (D) Fluorescence amplitudes in 2 mM extracellular Ca2+ were best fit by the sum of two Gaussian curves with mean amplitudes 623 ± 122 a.u. (1q) and 834 ± 111 a.u. (1.3q) (χ2 = 0.88). (n = 1178 events from four coverslips generated from two cultures). (E) Fluorescence amplitudes in 4 mM extracellular Ca2+ were well fit with two similar Gaussian curves 623 ± 98 a.u. (1q) and 834 ± 111 a.u. (1.3q) (χ2 = 0.70) (n = 1593 events from six coverslips generated from two cultures). (F) Fluorescence amplitudes of 8 mM Ca2+ were best fit with the sum of three Gaussian curves with mean amplitudes 623 ± 91 a.u. (1q), 834 ± 111 a.u. (1.3q) and 1246 ± 182 a.u. (2q) (χ2 = 1) (n = 1110 events from three coverslips generated from two cultures). (G) Model of two hypothetical events with normalized amplitudes of 1, decay times of 371 ms, and delay of onset of 118 ms, the same two events sampled at 120 ms results in fluorescence amplitude of 1.3 times a single event (1.3q). (H) The percent of events in 2, 4 and 8 mM extracellular Ca2+ that have amplitudes greater than a single Gaussian distribution were defined as multivesicular. This suggests that there are more multivesicular events at increasing extracellular Ca2+ concentrations.
Figure 3—figure supplement 1
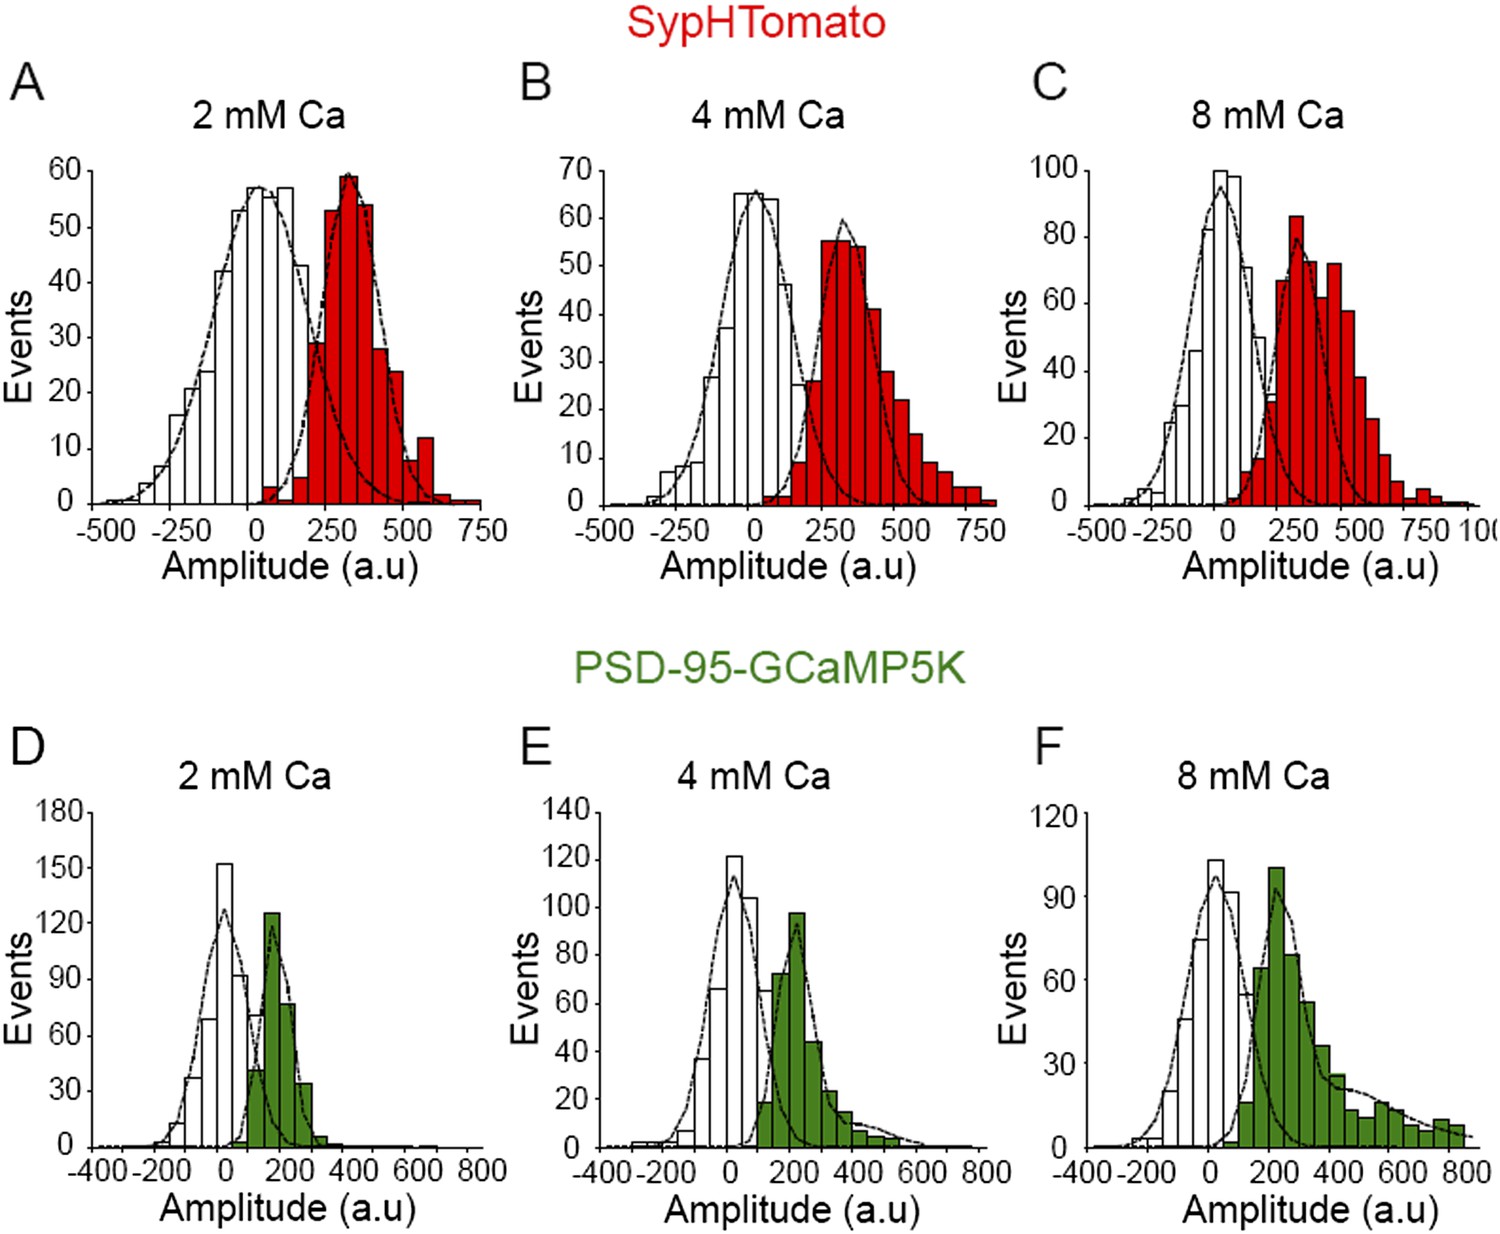
Increasing extracellular Ca2+ increases amplitude of spontaneous events detected by SypHTomato and PSD-95-GCaMP5K.
(A–C) Fluorescence amplitude distributions of spontaneous increases in sypHTomato (red) were separable from noise (white). Black lines are Gaussian distribution fits. (A) Fluorescence amplitudes of spontaneous increases in sypHTomato fluorescence in 2 mM extracellular Ca2+. Events could be fit with a single Gaussian distribution (black line) with mean amplitude of 303 ± 92 a.u. (χ2 = 0.86; n = 361 events from four experiments). (B) Fluorescence amplitudes of spontaneous increase in sypHTomato fluorescence in 4 mM extracellular Ca2+. The amplitude of SypHTomato events increased in a non-quantal fashion as in the case of vGlut-pHluorin signals. Black line is the Gaussian curve due to single vesicle fusion as predicted from 2 mM Ca2+ experiments. (n = 335 events from four experiments). (C) Fluorescence amplitudes of spontaneous increases in sypHTomato fluorescence increase further in 8 mM extracellular Ca2+ (n = 573 events from five experiments) (D-F) Fluorescence amplitudes of PSD-95-GCaMP5K (green) signals that corresponded with increases in sypHTomato were also separable from noise (white). Black lines are Gaussian distribution fits. (D) Amplitude distribution of PSD-95-GCaMP5K signals that correlated with SypHTomato signals in 2 mM extracellular Ca2+. PSD-95-GCaMP5K signals had a mean amplitude of 170 ± 50 a.u. (n = 361 events from 4 experiments). (E) Amplitude distribution of PSD-95-GCaMP5K signals that correlated with SypHTomato signals in 4 mM extracellular Ca2+. PSD-95-GCaMP5K signals could be well fit by the sum of two Gaussian distributions (black dashed line) with mean amplitudes of 191 ± 53 a.u. and 382 ± 106 a.u. (n = 292 events from four experiments). (F) Amplitude distribution of PSD-95-GCaMP5K signals that correlated with SypHTomato signals in 8 mM extracellular Ca2+. PSD-95-GCaMP5K signals could be well fit by the sum of three Gaussian distributions (black dashed line) with mean amplitudes of 208 ± 66 a.u., 416 ± 132 a.u. and 624 ± 198 a.u. (n = 472 events from five experiments).
Figure 4 with 1 supplement

Increasing extracellular Ca2+ does not alter fluorescence decay time.
(A) Distribution of fluorescence decay times in 4 mM extracellular Ca2+ can be fit with a beta-distribution with mean of 0.44 s with upper bound = 4.8 and lower bound = 2.1 (χ2 = 0.9; n = 1308 events from six coverslips over three cultures). (B) Distribution of fluorescence decay times in 8 mM extracellular Ca2+ were fit with a beta-distribution with mean of 0.44 s with upper bound = 4.8 and lower bound = 2.1 (χ2 = 1; n = 844 events from three coverslips from two cultures). (C) Cumulative probability histogram of decay times of spontaneous fluorescence events in 2, 4, and 8 mM extracellular Ca2+ showed no significant difference in decay time distributions (e.g. KStest 2 mM Ca2+ vs 8 mM Ca2+: p > 0.3 with Dmax = 0.04 at 0.5 s). However, the decay times of all spontaneous events were significantly different from the decay times of evoked-fusion events (for all comparisons KStest p < 0.01 with Dmax = 0.5 s). (D) Decay time did not correlate with amplitude of spontaneous events in 8 mM Ca2+ (R2 = 0.0014). 1q is the Gaussian mean of one event while 2q is the Gaussian mean of two simultaneous events, 1.3q is the amplitude calculated in Figure 3.
Figure 4—figure supplement 1
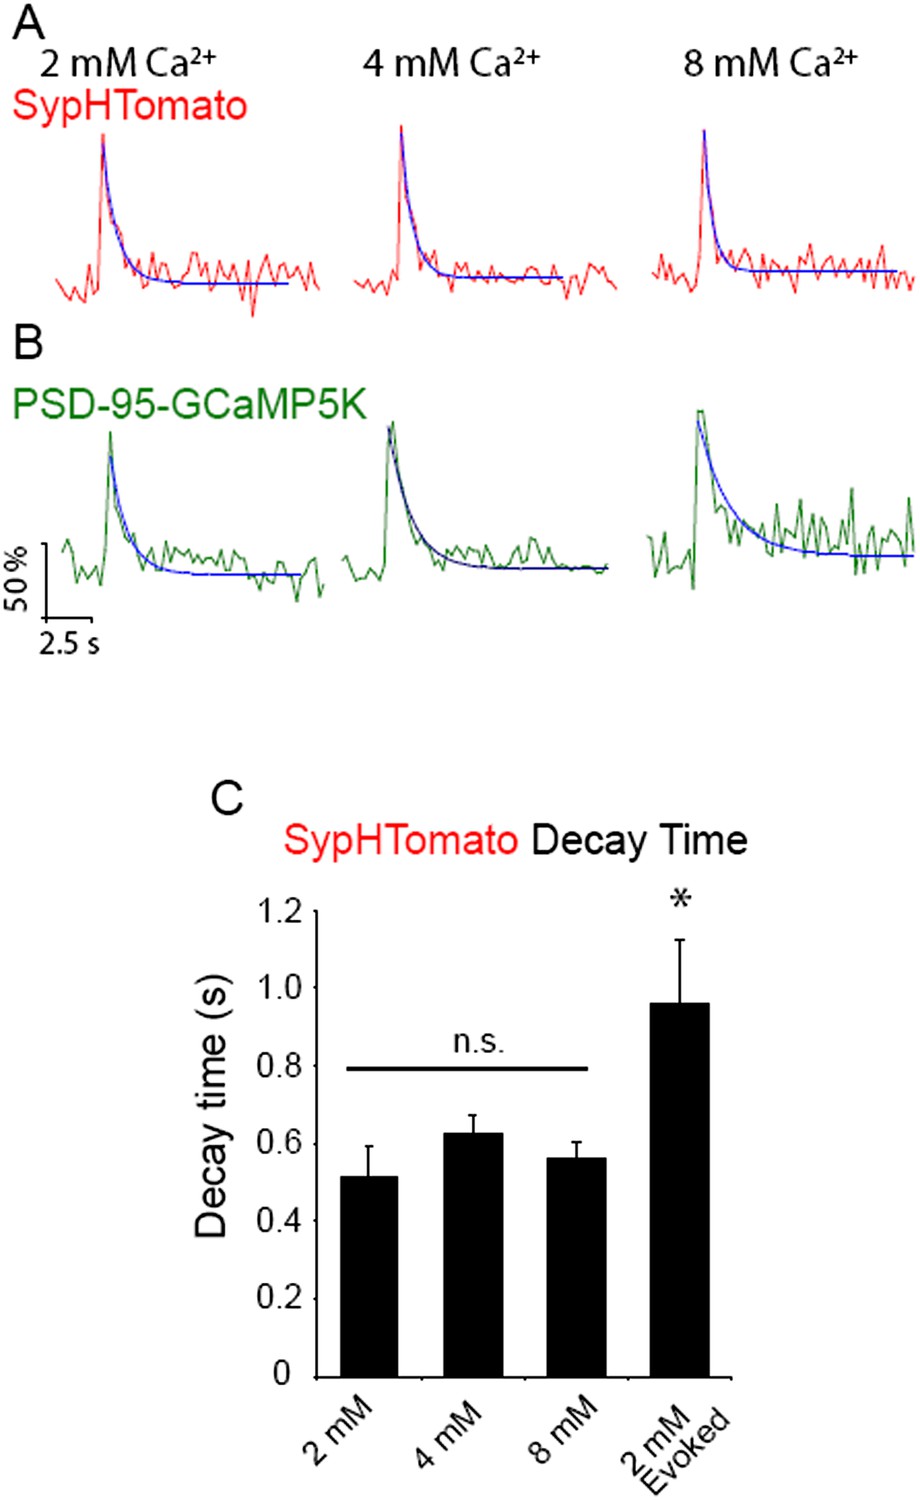
Increasing extracellular Ca2+ does not alter decay time of spontaneous increases in sypHTomato fluorescence.
(A) Example average traces of spontaneous increases in sypHTomato fluorescence (red) single experiments in 2 mM (left), 4 mM (middle), and 8 mM (right) extracellular Ca2+ with decay time fit in blue. (B) Example average traces from the same experiments as A of PSD-95-GCaMP5K events (green) that correspond with sypHTomato spontaneous increases in fluorescence in 2 mM (left), 4 mM (middle), and 8 mM (right) extracellular Ca2+ with decay time fit in blue. (C) Decay time does not change as a function of extracellular Ca2+, however increases in fluorescence due to stimulation are slower to decay than spontaneous increases in fluorescence (p < 0.05 One-way ANOVA with Bonferroni post hoc analysis).
Figure 5
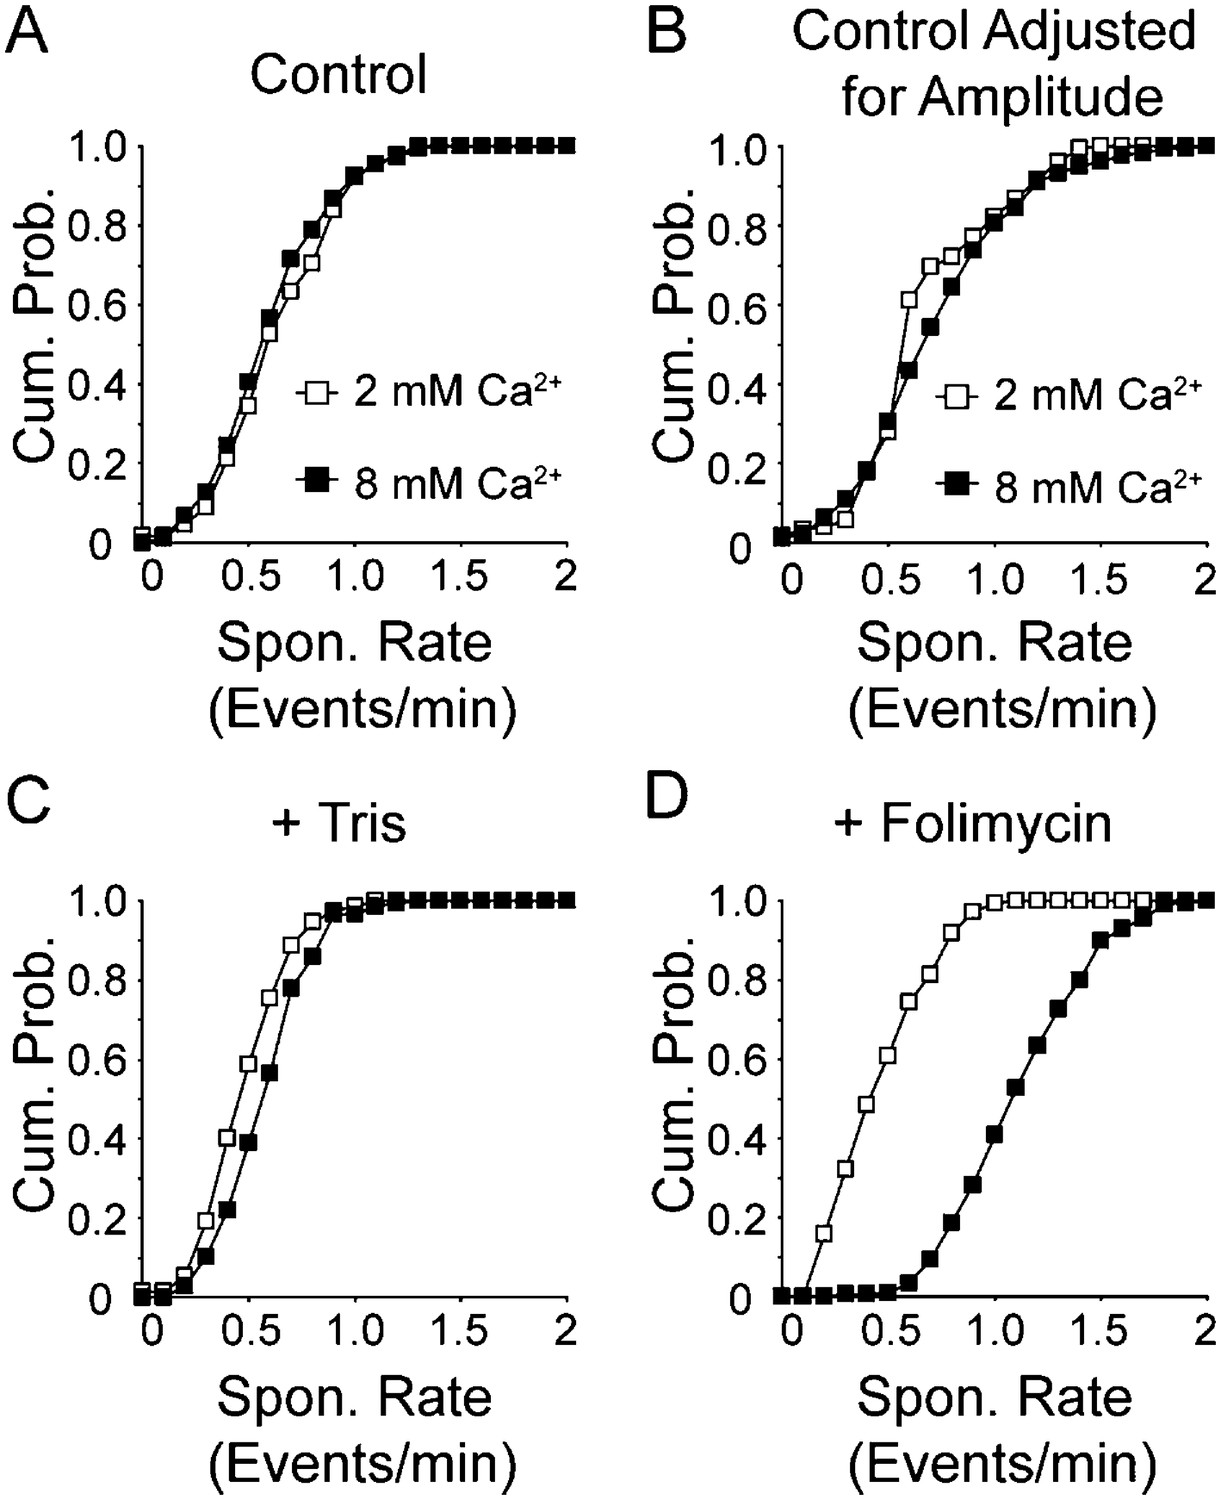
Increasing extracellular Ca2+ increases spontaneous fusion rate.
(A) Cumulative probability histogram of spontaneous event rate per synapse per minute in 2 mM and 8 mM extracellular Ca2+ (n = 175 synapses from four coverslips for both conditions, KStest p = 0.55 with Dmax = 0.8 fusion events per minute per synapse, with averages of 0.56 ± 0.02 and 0.49 ± 0.02 (Student's t-test p value = 0.2) events per minute per synapse for 2 and 8 mM Ca2+, respectively). (B) Cumulative probability histogram of spontaneous event rate per synapse per minute in 2 mM and 8 mM extracellular Ca2+ adjusted to count large amplitude events as two vesicle fusion events (n = 175 synapses from four coverslips for both conditions, KStest p < 0.05 with Dmax = 0.6 fusion events per minute per synapse, with averages of 0.70 ± 0.02 and 0.76 ± 0.03 (t-test p value = 0.1) events per minute per synapse for 2 and 8 mM Ca2+, respectively. (C) Cumulative probability histogram of spontaneous event rate per synapse per minute in Tris-buffered (50 mM) 2 mM and 8 mM extracellular Ca2+ solutions (n = 150 synapses from three coverslips for both conditions, KStest p < 0.05 with Dmax = 0.5 fusion events per minute per synapse, with average 0.4 ± 0.02 and 0.5 ± 0.02 (t-test p value <0.05) fusion events per minute per synapse for 2 and 8 mM Ca2+, respectively. (D) Cumulative probability histogram of spontaneous event rate per synapse per minute in 2 and 8 mM extracellular Ca2+ solution containing folimycin (n = 175 synapses from four coverslips for 2 mM Ca2+ and 216 synapses from four coverslips for 8 mM Ca2+; KStest p < 0.05 Dmax = 0.8 fusion events per synapse per minute, with average rates of 0.4 ± 0.02 and 1.1 ± 0.02 (p value <0.05) fusion events per minute per synapse for 2 and 8 mM Ca2+, respectively).
Figure 6
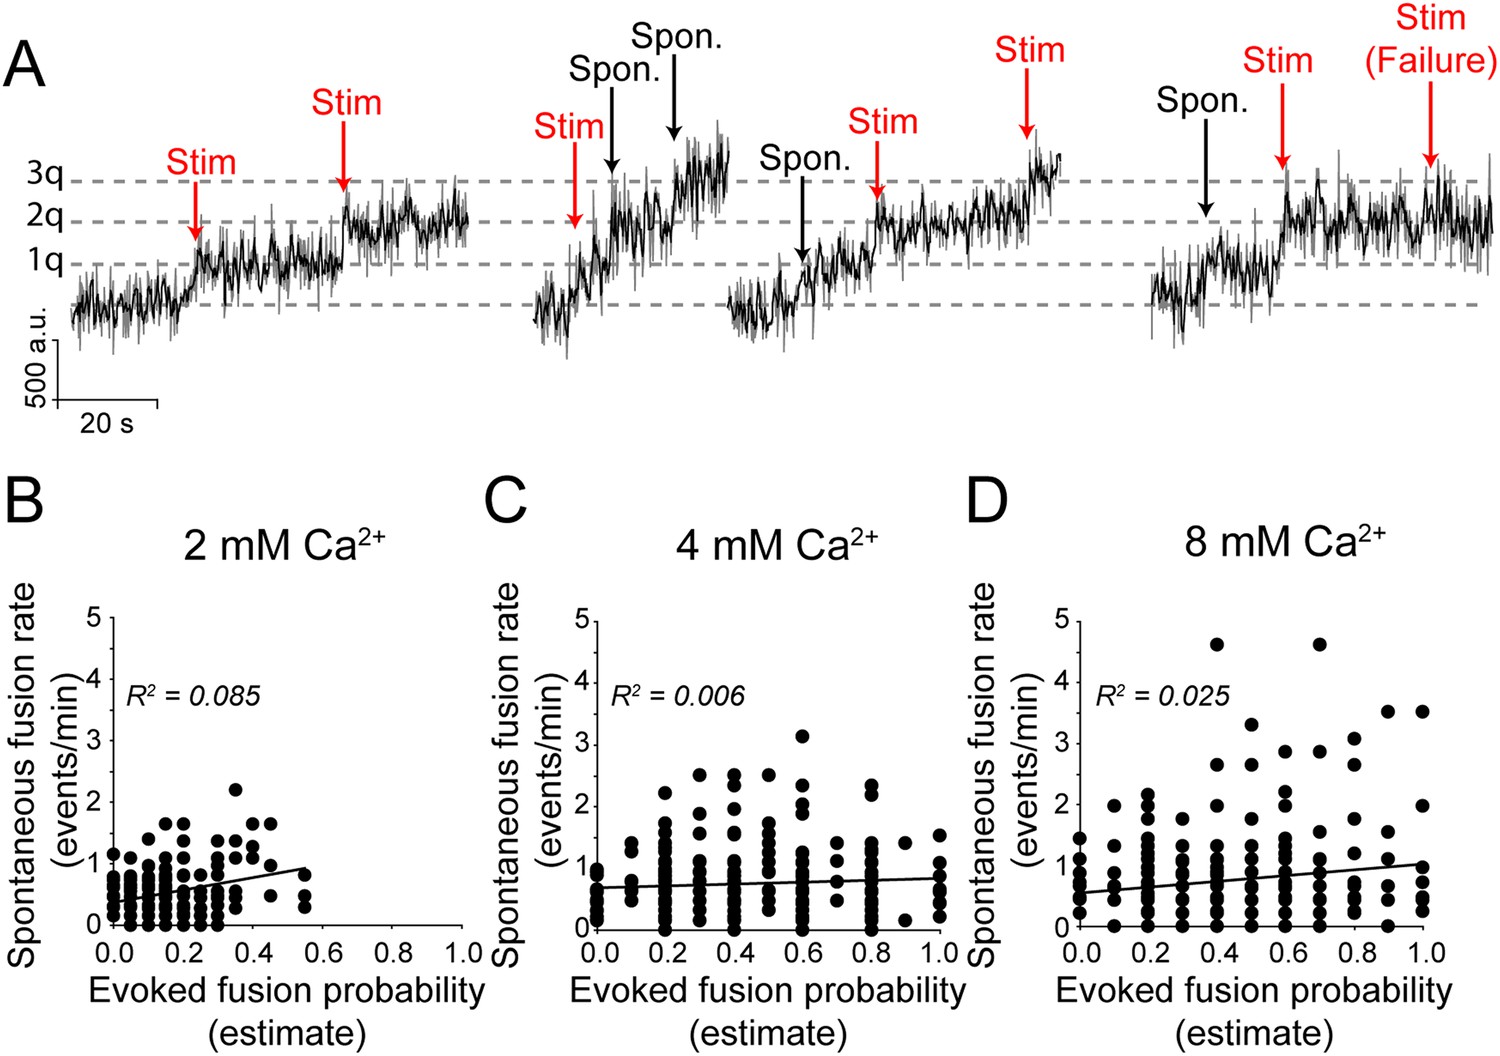
Spontaneous vesicle fusion rate and stimulation-evoked fusion probability do not correlate at a given synapse.
(A) Example traces of fusion events in the presence of folimycin. Neurons in 2 mM Ca2+ extracellular solution were stimulated with 1 AP delivered at 0.1 Hz while neurons in 4 and 8 mM Ca2+ were stimulated with 1 AP delivered at 0.033 (30 s inter-stimulus interval) due to the higher probability of release. Fusion events were categorized as spontaneous or evoked by their temporal distance from the stimulation time, with events within ±1 s of stimulation selected as evoked fusion events. Note that spontaneous and evoked events are both quantal, indicated by the dashed grey line. (B) There is limited correlation between spontaneous fusion rate and evoked fusion probability in 2 mM Ca2+. Distributions were best fit with a linear trend line with slope = 1.0 (Pearson's correlation coefficient R2 = 0.08, p value <0.01 and Spearman r = 0.16, p value = 0.02; n = 200 synapses from four coverslips). (C) The correlation between spontaneous and evoked transmission decreases further as extracellular Ca2+ increases to 4 mM best fit line with slope = 0.1 (Pearson's R2 = 0.01, p value = 0.17 and Spearman r = 0.032, p value = 0.58; n = 311 synapses from six coverslips). (D) The correlation remains low between spontaneous and evoked transmission in 8 mM extracellular Ca2+ with best fit line with slope = 0.5 (Pearson's R2 = 0.02, p value = 0.045 and Spearman r = 0.066, p value = 0.35; n = 240 synapses from four coverslips).
Author response image 1

Download links
A two-part list of links to download the article, or parts of the article, in various formats.
Downloads (link to download the article as PDF)
Open citations (links to open the citations from this article in various online reference manager services)
Cite this article (links to download the citations from this article in formats compatible with various reference manager tools)
Fast retrieval and autonomous regulation of single spontaneously recycling synaptic vesicles
eLife 3:e03658.
https://doi.org/10.7554/eLife.03658


