Quantitative analysis of mammalian GIRK2 channel regulation by G proteins, the signaling lipid PIP2 and Na+ in a reconstituted system
- Howard Hughes Medical Institute, The Rockefeller University, United States
Figures
Figure 1
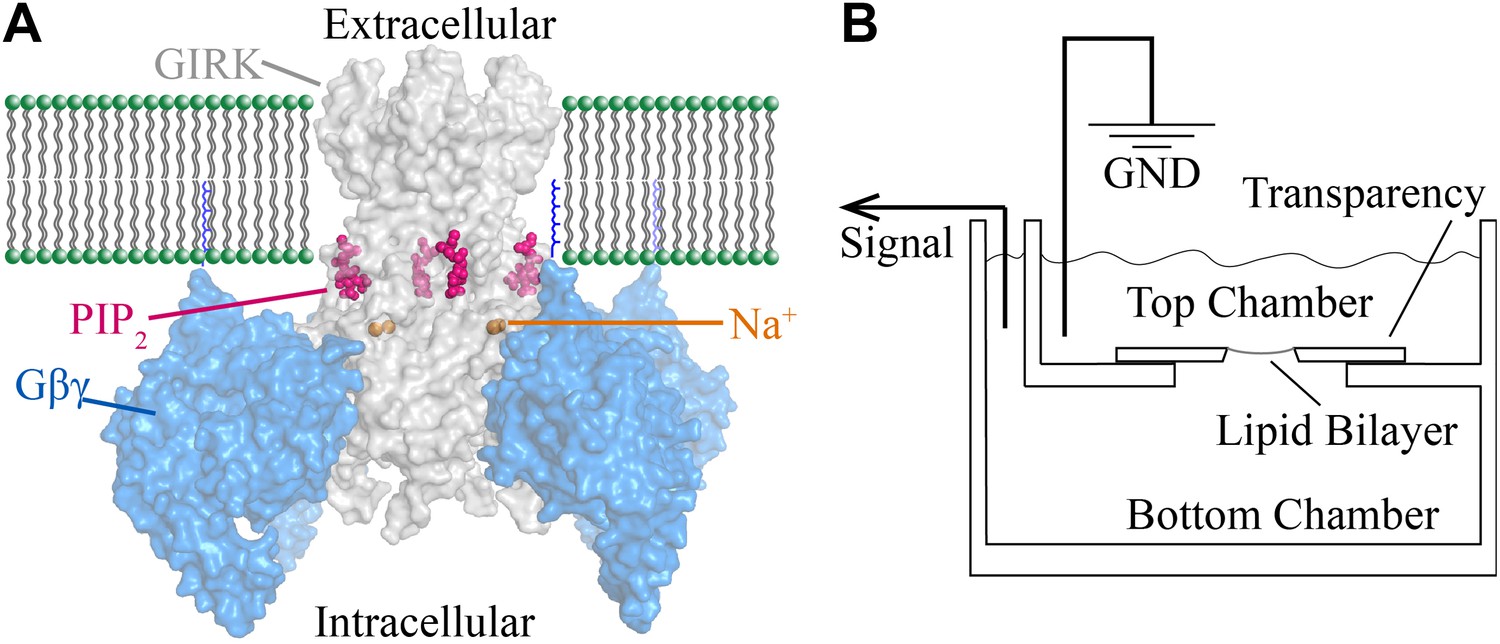
Structural depiction of GIRK2 regulation and horizontal planar bilayer configuration.
(A) View from the membrane plane of a GIRK2 channel (gray) bound to its activating ligands PIP2 (purple), Na+ (brown) and the heterodimeric G protein subunit Gβγ (blue, with the postulated geranylgeranyl group on the Gγ subunit drawn as blue lines) in surface representation (PDBID: 4KFM). There are four binding sites for each of these ligands on each GIRK2 homotetramer. (B) A schematic of the horizontal planar bilayer system used to characterize GIRK2 channel activity. Two solution-filled chambers in a polyoxymethylene block are separated by a piece of transparency film with a small hole (∼100 μm diameter). Lipid bilayers are formed across the hole by spontaneous thinning of a painted solution of lipid in decane. Membrane proteins are incorporated into the lipid bilayer by fusion of applied proteoliposomes. Soluble reagents are either directly applied to either chamber followed by thorough mixing or added via a local perfusion system. The two chambers are electrically voltage-clamped as indicated for current recordings.
Figure 2
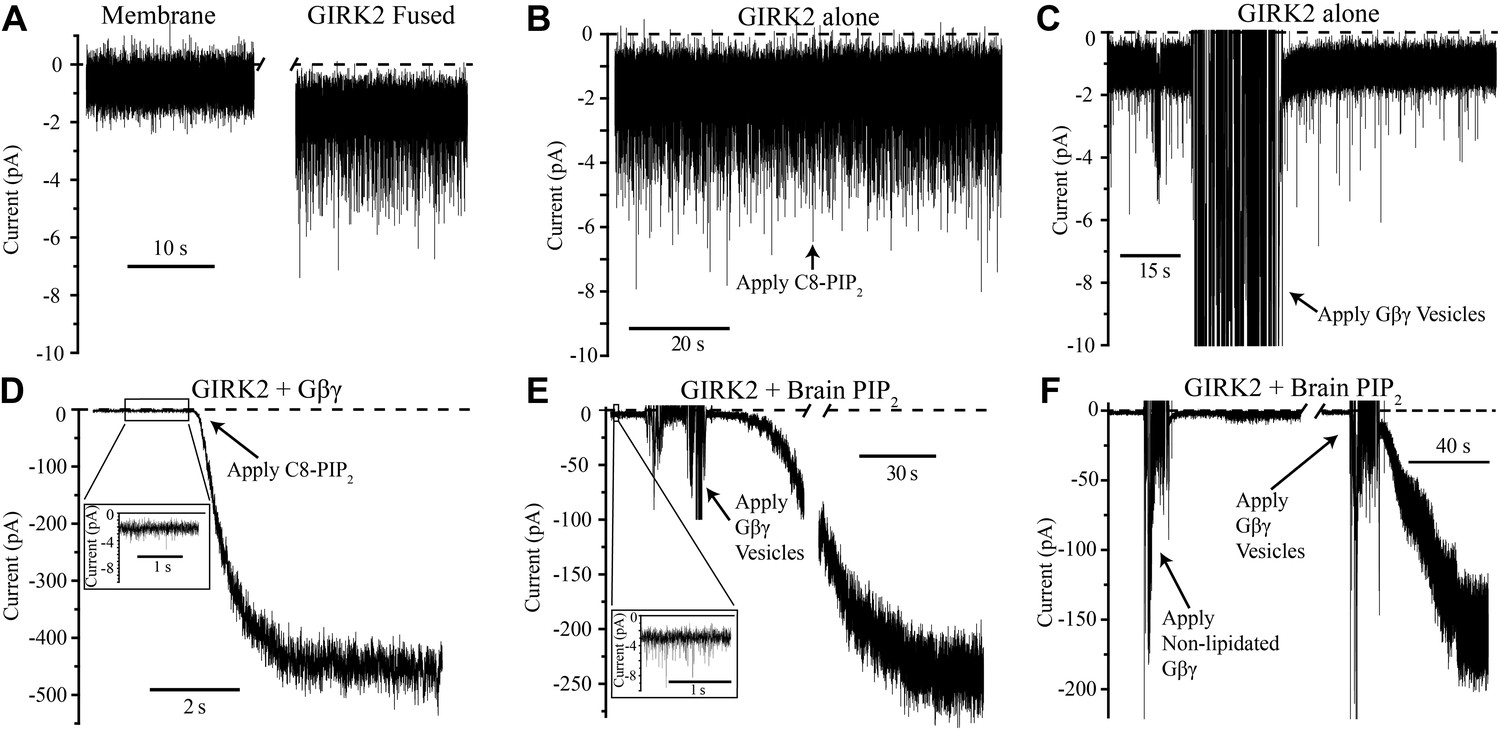
GIRK2 activation requires both Gβγ and PIP2.
Currents are plotted according to electrophysiology convention such that negative values represent inward current with respect to channel orientation. The same buffer containing 150 mM KCl was used in both chambers and the membranes were held at −50 mV (eliciting inward channel current). Initial compositions of each bilayer are indicated above each panel. Fusion of lipid vesicles was done manually and induced significant noise during application. This noise did not interfere with subsequent recording of current change. (A) Current spikes were observed after fusing GIRK2 vesicles into the lipid bilayer. (B and D) Gβγ is necessary for PIP2 activation of GIRK2. Currents were recorded from a bilayer containing either GIRK2 alone (B) or GIRK2+Gβγ (D) before and after application of 32 μM C8-PIP2 (indicated with arrow). Only when Gβγ was present (D) did application of PIP2 increase current through GIRK2. (C and E) PIP2 is necessary for Gβγ activation of GIRK2. Currents were recorded from a bilayer containing either GIRK2 alone (C) or GIRK2 and 2% brain PIP2 (E) before and after application of Gβγ vesicles (indicated with arrow). The amplifier gain was adjusted during the gap in the recording in (E). Insets in (D and E) show spontaneous openings of GIRK2 before application of Gβγ (compare to B and C). (F) Current recorded from a bilayer with GIRK2 and PIP2 before and after application of non-lipidated Gβγ (left side of recording) followed by application of lipidated Gβγ vesicles (right side of recording). Lipidated Gβγ (∼15 μM) robustly activated GIRK2 while high concentrations (∼116 μM) of non-lipidated Gβγ only slightly increased channel activity.
Figure 3
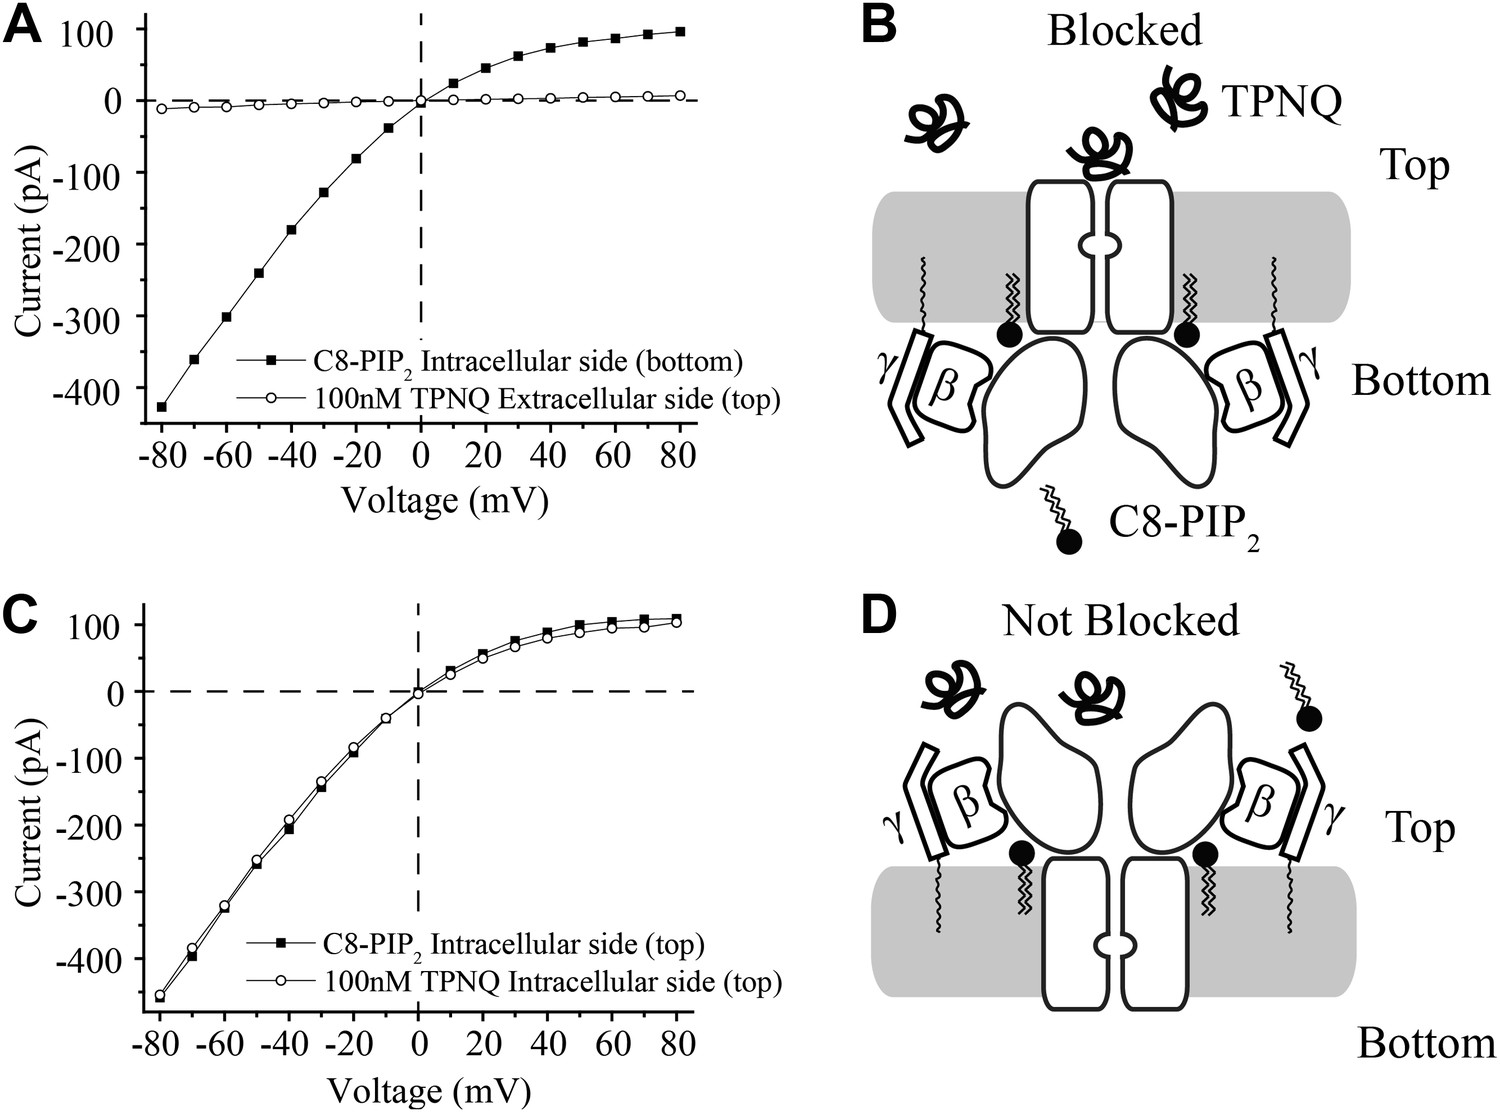
Activation of GIRK2 by C8-PIP2 is sided.
(A) Representative current–voltage relationship recorded from a bilayer containing GIRK2 and Gβγ. Robust current was recorded upon addition of C8-PIP2 to the bottom side of the bilayer (black squares) that is blocked by application of TPNQ to the top side (white circles). (B) Schematic of molecular interactions that explain the data in (A). (C and D) Analagous to (A and B), except that C8-PIP2 and TPNQ were applied to the same side of the bilayer. GIRK2 channels that are activated by C8-PIP2 ‘cytoplasmically’ can only be blocked by ‘extracellular’ TPNQ.
Figure 4
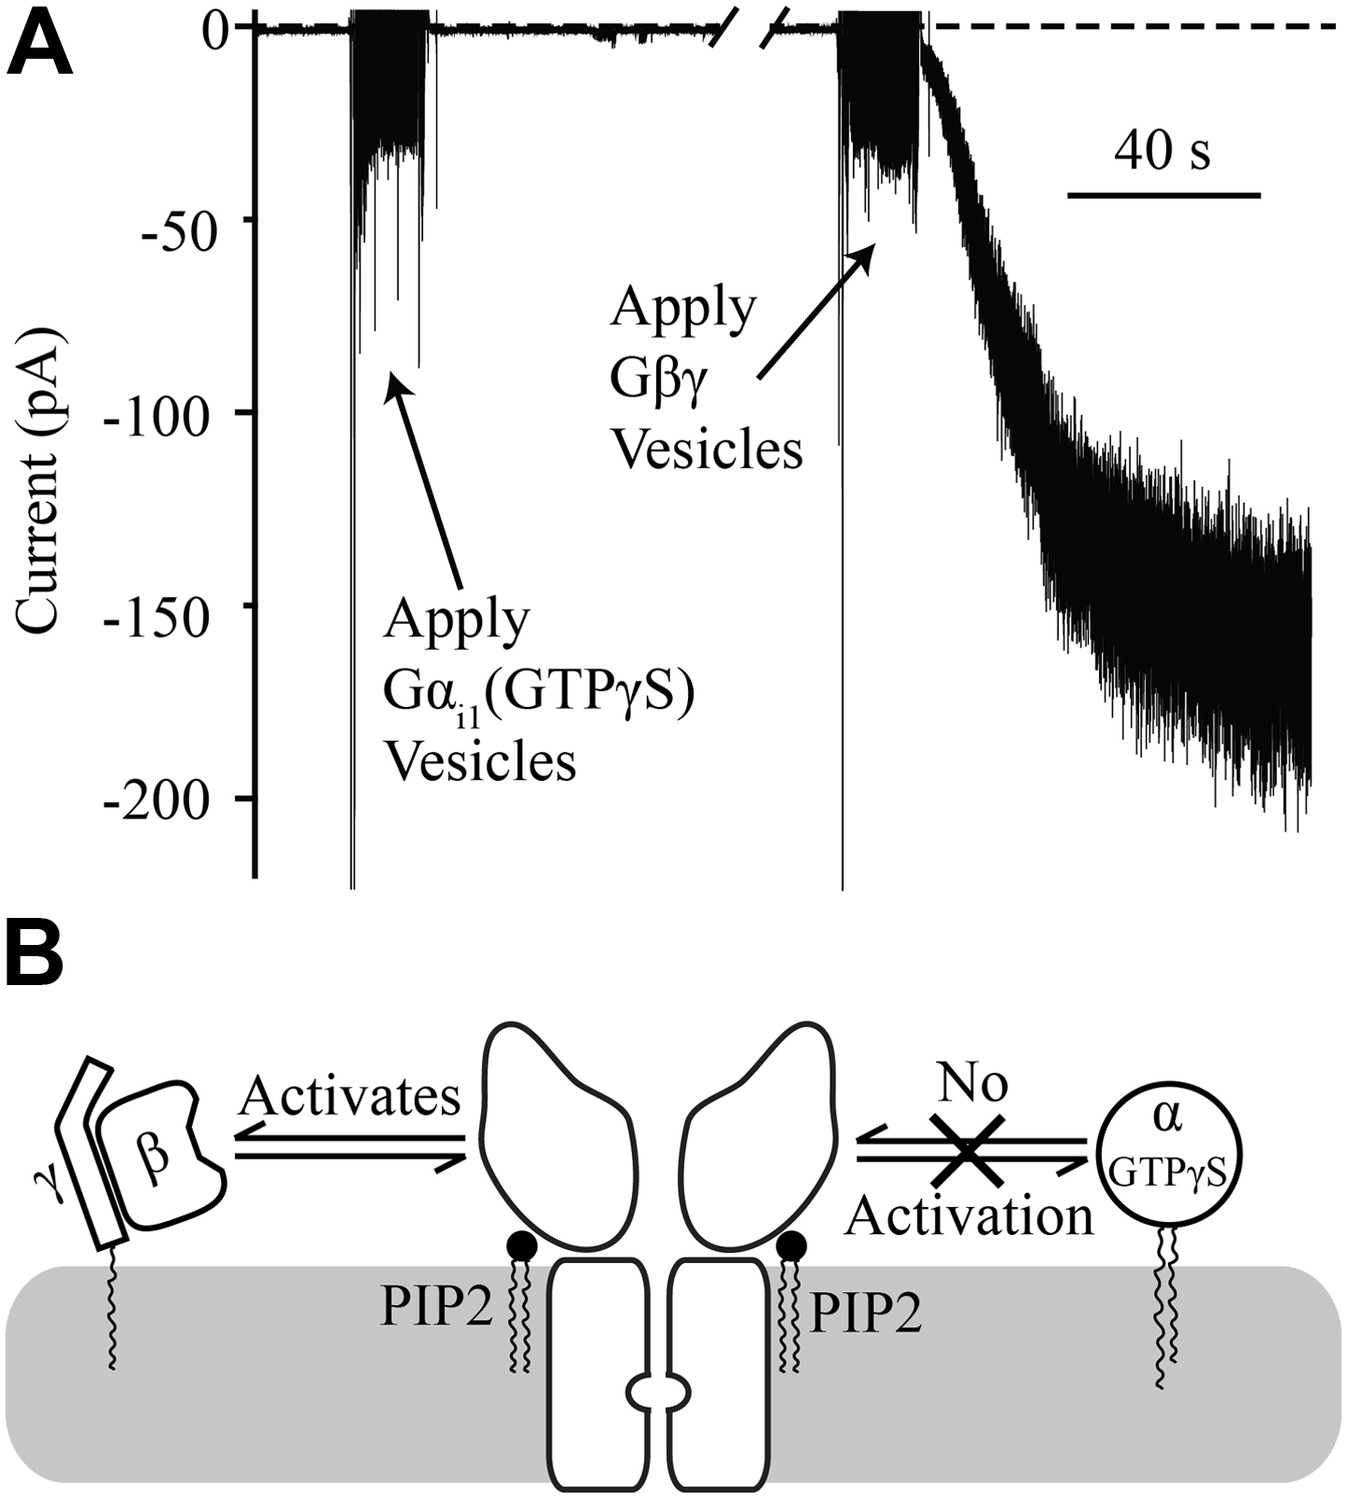
Gαi1(GTPγS) does not activate GIRK2.
Recordings were performed as in Figure 2. The increased signal during application of vesicles resulted from opening the chamber for electromagnetic shielding. (A) Current recorded from a bilayer with GIRK2 and 1% brain PIP2 before and after application of Gαi1(GTPγS) (left) followed by application of Gβγ (right). (B) Schematic of molecular interactions that explain the data in (A). Activation by Gβγ but not Gαi1(GTPγS) confirmed the presence of GIRK2 channels in the bilayer and their insensitivity to applied Gαi1.
Figure 5
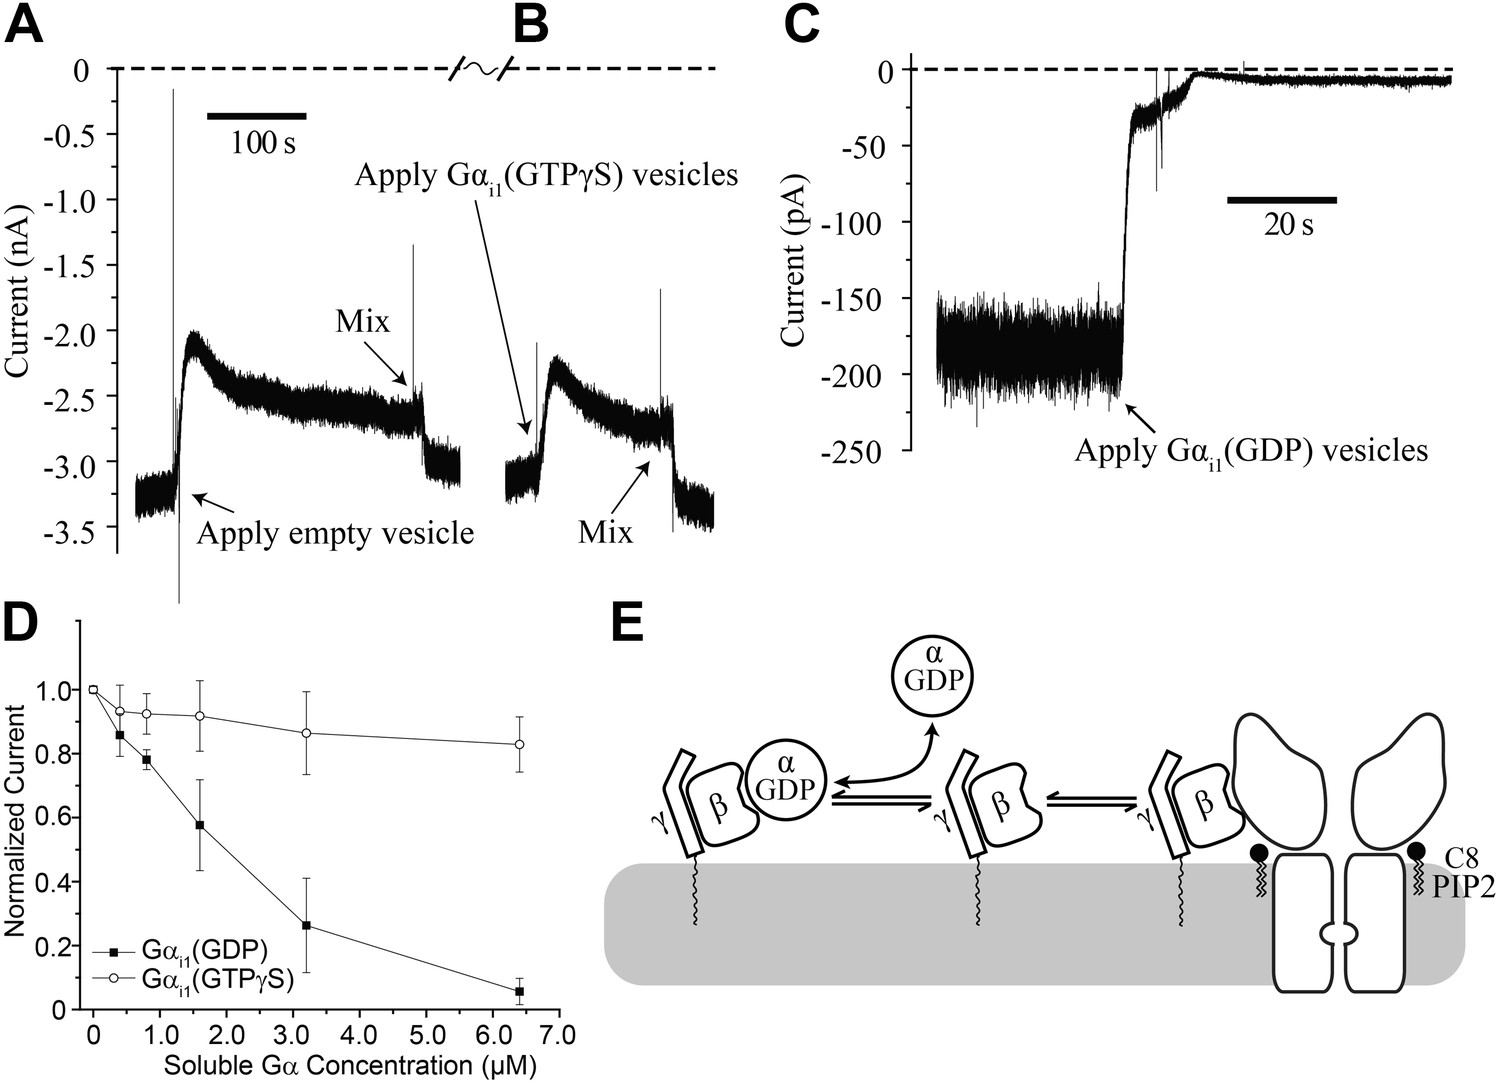
Gαi1(GDP) but not Gα i1(GTPγS) deactivates GIRK2 by sequestering Gβγ.
Recordings were performed as in Figure 2. (A and B) Current recording from a bilayer with GIRK2 and Gβγ activated by 32 μM C8-PIP2 before and after (A) addition of empty vesicles followed by (B) addition of Gαi1(GTPγS) vesicles (vesicle additions indicated by arrows). Note that the high salt concentration of the vesicle solution (750 mM KCl) used to facilitate fusion to the bilayer caused a similar transient reduction in K+ current in both (A) and (B). In both cases, current level returned to near pre-vesicle application levels after thorough mixing. (C) Current recording from a bilayer with GIRK2 and Gβγ activated by C8-PIP2 before and after application of vesicles containing Gαi1(GDP) (indicated by arrow). (D) Comparison of the effects of non-lipidated (soluble) Gαi1(GDP) and Gαi1(GTPγS) on activated GIRK2. Current at −50 mV holding potential (normalized to the value before addition of Gαi1) recorded from bilayers (±SEM, n = 3 bilayers) with GIRK2 and Gβγ activated by C8-PIP2 vs concentration of added Gαi1 species is plotted. The lines connecting data points have no theoretical meaning. (E) Illustration of molecular interactions that explain data in (A–D).
Figure 6
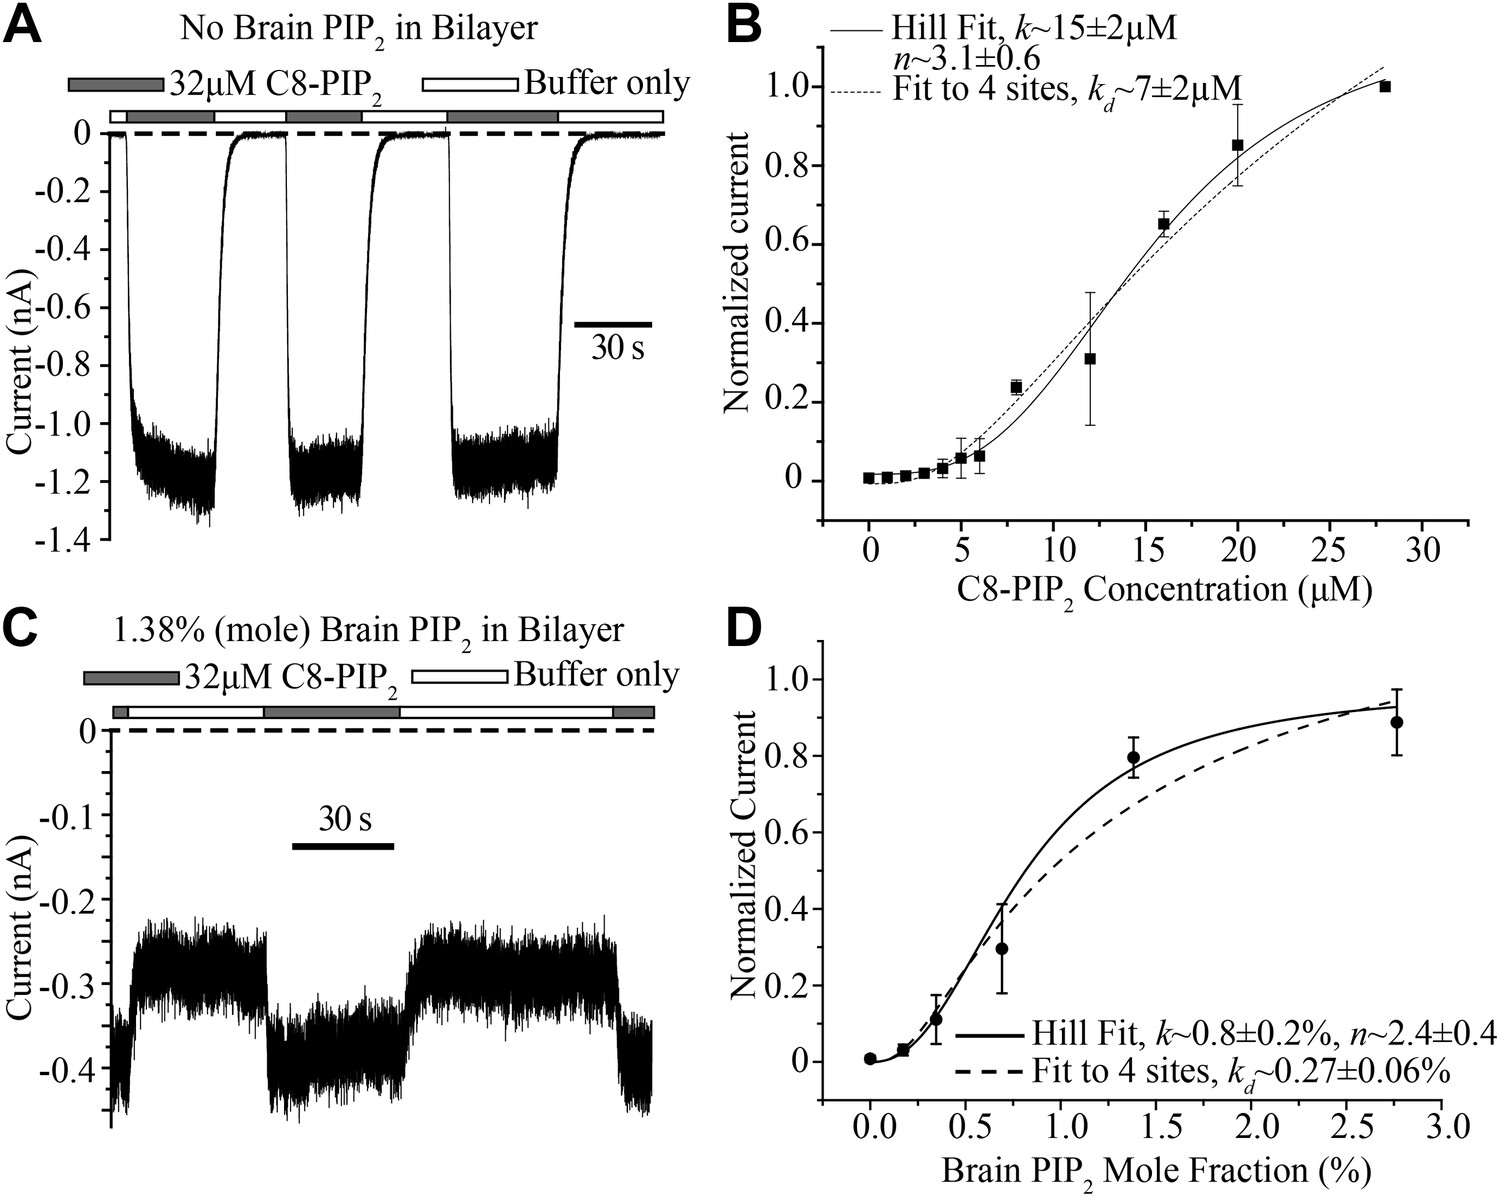
Concentration dependence of GIRK2 activation by C8- and brain-PIP2.
(A) Current recorded from a bilayer containing GIRK2 and Gβγ during local perfusion of C8-PIP2 (black bars above recording) or buffer (white bars above recording). (B) Plot of current recorded from bilayers with GIRK2 and Gβγ (normalized to current at 28 μM C8-PIP2, mean ± SEM, n = 3 bilayers) vs concentration of C8-PIP2. Hill fit (solid line) gives an apparent dissociation constant of ∼15 μM and a Hill coefficient of ∼3.1. Fit to a non-cooperative model (‘Materials and methods’) in which simultaneous binding of 4 PIP2 molecules to one channel is required for channel opening is also shown (dotted line). (C) Current recorded from a bilayer with GIRK2, Gβγ and 1.38% (mole fraction) brain PIP2 during local perfusion of 32 μM C8-PIP2 (black bars above recording) or buffer (white bars above recording). Channels oriented with their extracellular side facing the PIP2 perfusion chamber were blocked with 100 nM TPNQ in perfusion buffers. As a way to normalize channel numbers in different membranes, the current value during perfusion of buffer was normalized to the current level during perfusion of 32 μM C8-PIP2. (D) Plot of current recorded from bilayers with GIRK2 and Gβγ (mean ± SEM, n = 3 bilayers) vs concentration of brain PIP2 in the membrane. Regression to Hill equation (solid line) resulted in an apparent dissociation constant of ∼0.8% mole fraction brain PIP2 and a Hill coefficient of ∼2.4. The dashed line shows regression to the same non-cooperative four sites model as in (B).
Figure 7

Interdependence of PIP2 and Na+ activation.
Channel activity is normalized to that at the condition in which 28 μM of PIP2 and 32 mM of Na+ is present. (A) A 3-D representation of the activation landscape of PIP2 and Na+. The surface is gradient colored according to activation. (B) Plot of percentage activity of GIRK2 channels in membranes with saturating Gβγ vs added C8-PIP2 concentration in the absence (red, n = 3) and presence (black, n = 3) of 32 mM Na+. PIP2 activated GIRK2 currents were ∼2.5-fold higher (at 28 μM) in the presence of 32 mM Na+. Hill fitting resulted in apparent dissociation constants of ∼15 μM and ∼12 μM and Hill coefficients of ∼3.1 and ∼1.5 in the absence and presence of Na+, respectively. (C) Plot of percentage activity of GIRK2 channels in membranes with saturating Gβγ vs concentration of added Na+ in the absence (red, n = 3) and presence (black, n = 3) of 28 μM C8-PIP2. The titration data were fit to a simple 1:1 dose response model with an apparent dissociation constant of ∼9 mM.
Download links
A two-part list of links to download the article, or parts of the article, in various formats.
Downloads (link to download the article as PDF)
Open citations (links to open the citations from this article in various online reference manager services)
Cite this article (links to download the citations from this article in formats compatible with various reference manager tools)
Quantitative analysis of mammalian GIRK2 channel regulation by G proteins, the signaling lipid PIP2 and Na+ in a reconstituted system
eLife 3:e03671.
https://doi.org/10.7554/eLife.03671


