Activity and Ca2+ regulate the mobility of TRPV1 channels in the plasma membrane of sensory neurons
- University of Washington, United States
Figures
Figure 1 with 3 supplements
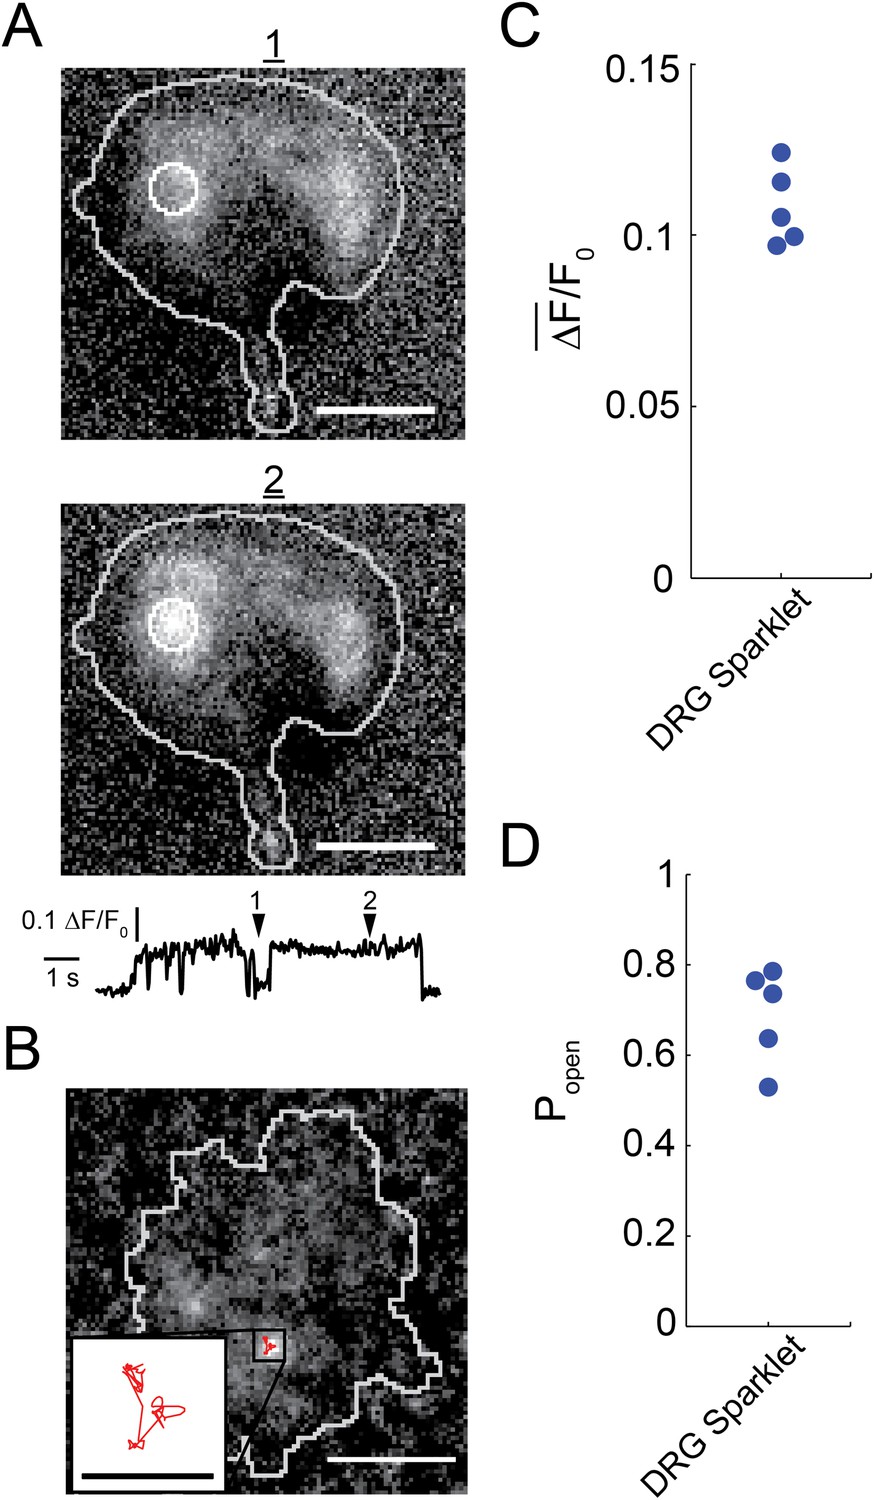
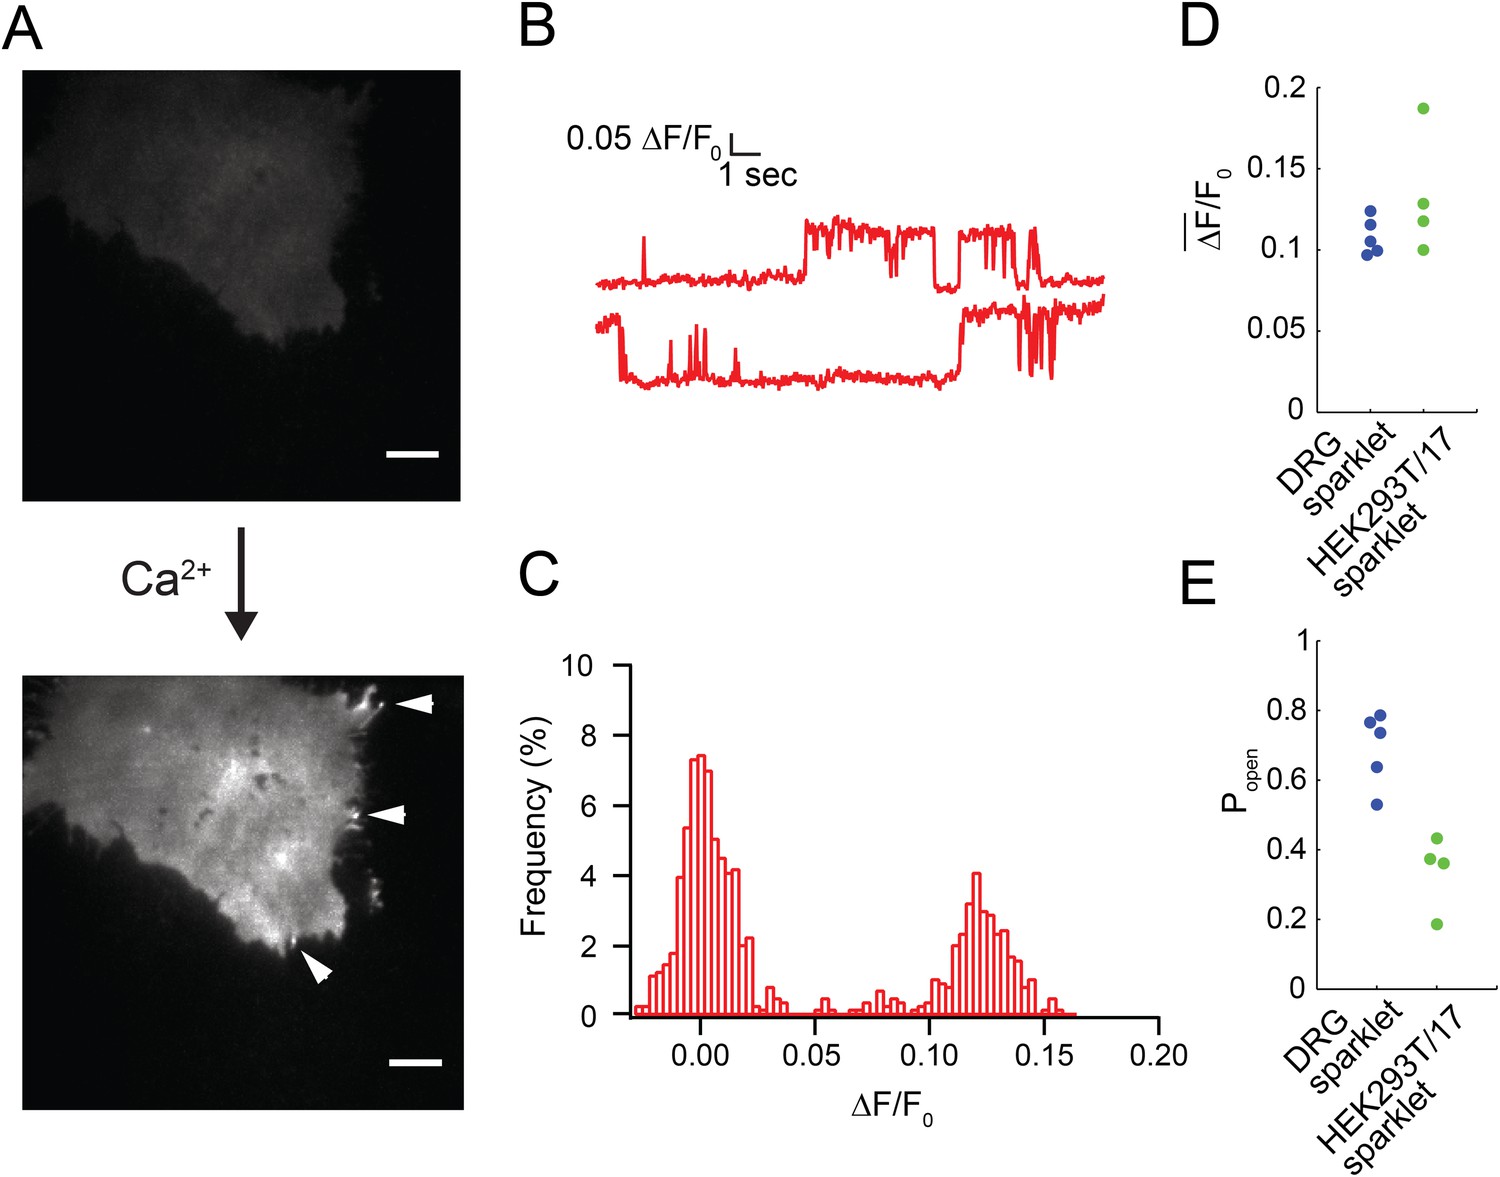
Capsaicin induced sparklets in whole-cell voltage clamped dorsal root ganglion cells loaded with Fluo-4.
(A) Images of immobile sparklet (white circle) in dorsal root ganglion cell at time points when inactive (1) and active (2) with corresponding intensity trace below (see Video 1). (B) Moving sparklet recorded for 5.6 s in dorsal root ganglion cell (see Video 2). Inset is of sparklet trace magnified fivefold. Inset scale bar is 1 µm. All other scale bars are 5 µm. (C) Mean fluorescence intensity () and (D) open probability (Popen) of dorsal root ganglion sparklets (N = 5; 3 cells) in Figure 1—figure supplement 1 A–E. Cut-off for ‘open’ is when intensity (ΔF/F0) exceeds 0.05.
Figure 1—figure supplement 1
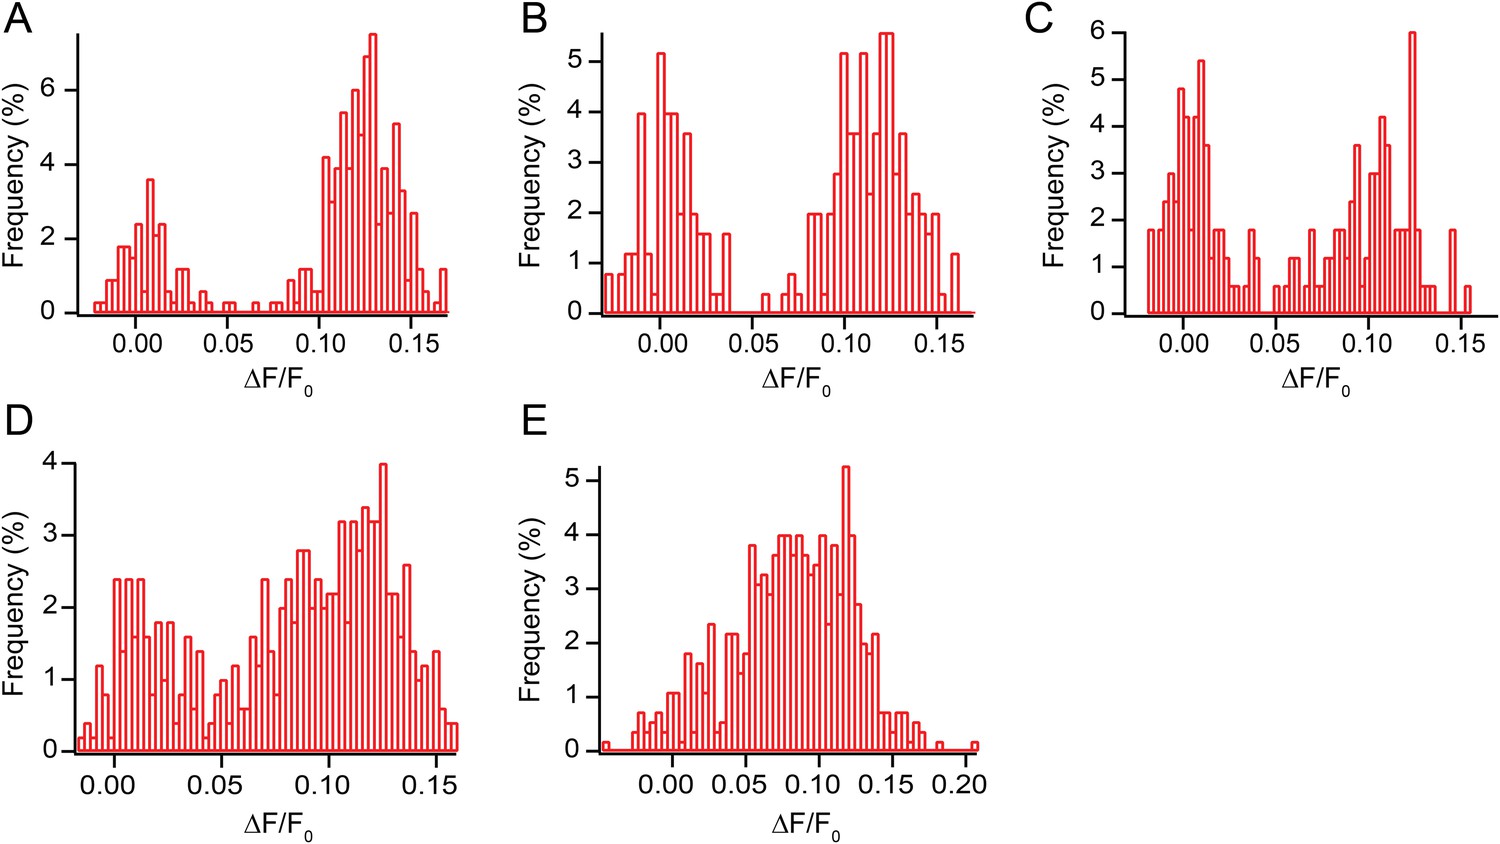
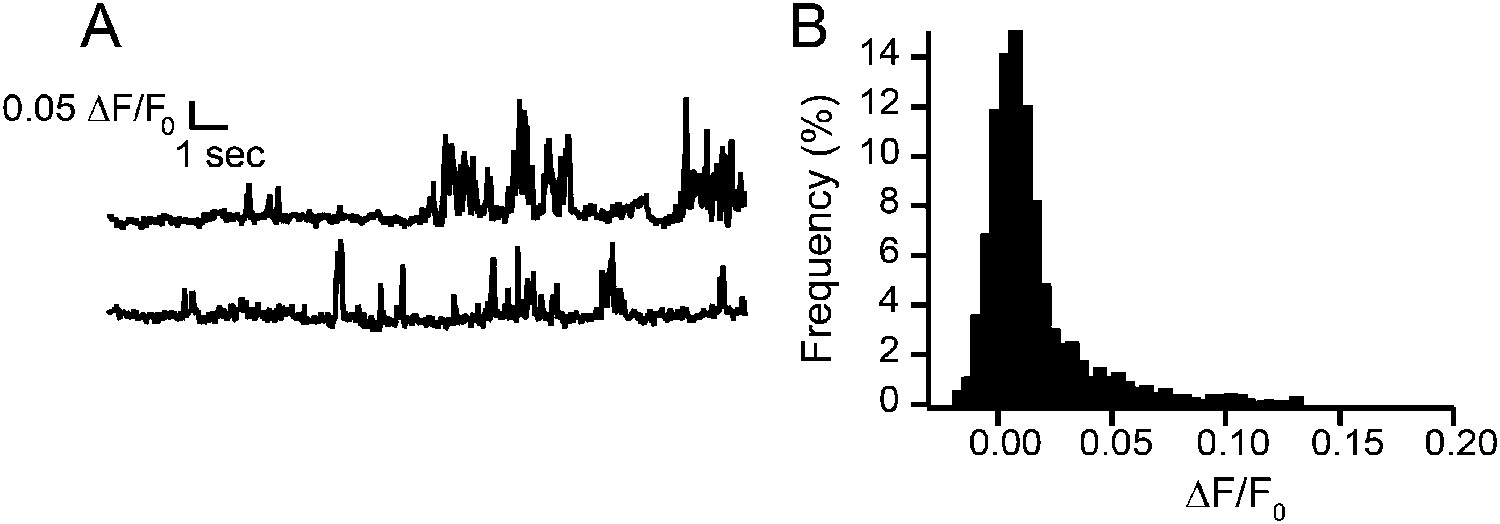
All points histogram of immobile sparklets in dorsal root ganglion cells (N = 5).
(A) Histogram of sparklet intensity trace shown in inset of Figure 1A (corresponding Video 1). (B, C) Histograms of two separate sparklets observed in a cell (see Video 3). (D, E) Histograms of two additional, separate sparklets in one cell.
Figure 1—figure supplement 2
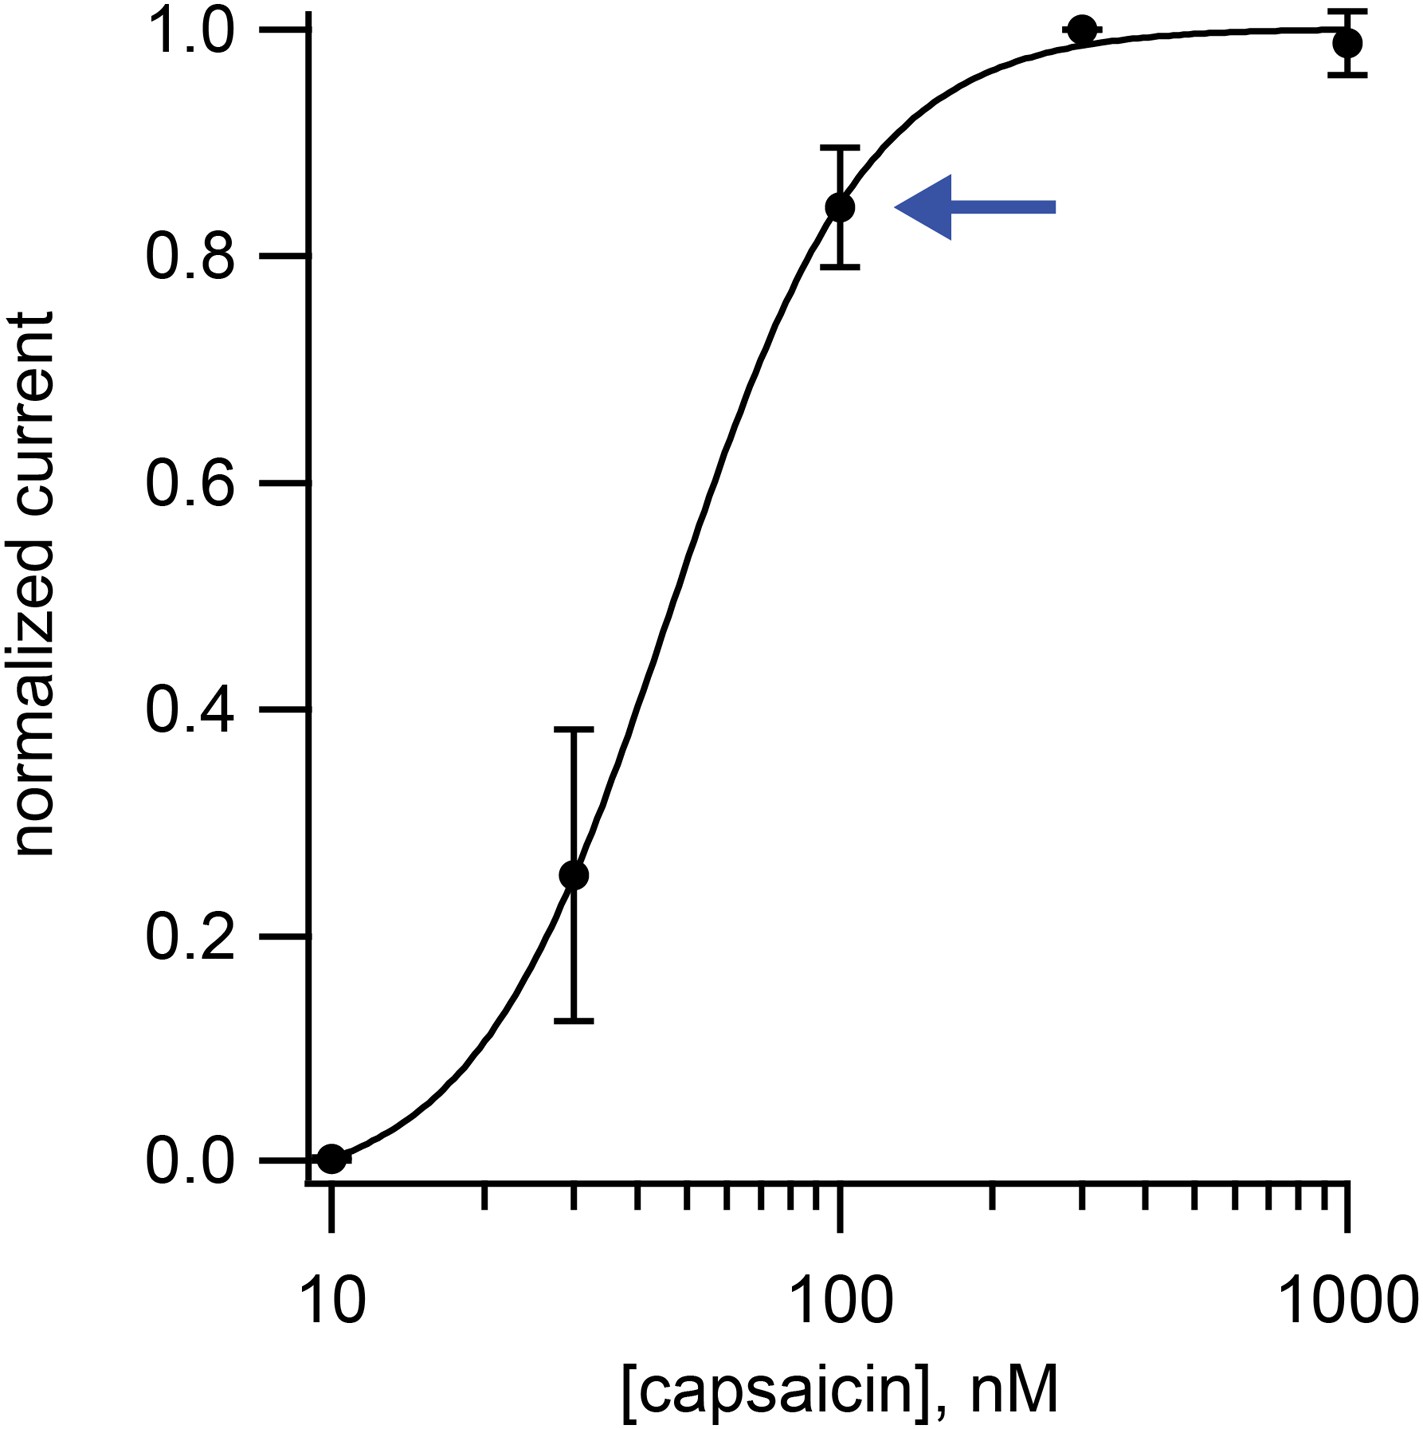
Dose-response relation for activation TRPV1 channels in isolated dorsal root ganglion neurons by capsaicin.
Points are the means from four cells, and the currents for each cell were normalized by the current measured at 300 nM capsaicin. Error bars are standard error of the mean. Data is fitted to a Hill curve with Hill coefficient of 2.2. Blue arrow indicates the data point for 100 nM capsaicin.
Figure 1—figure supplement 3
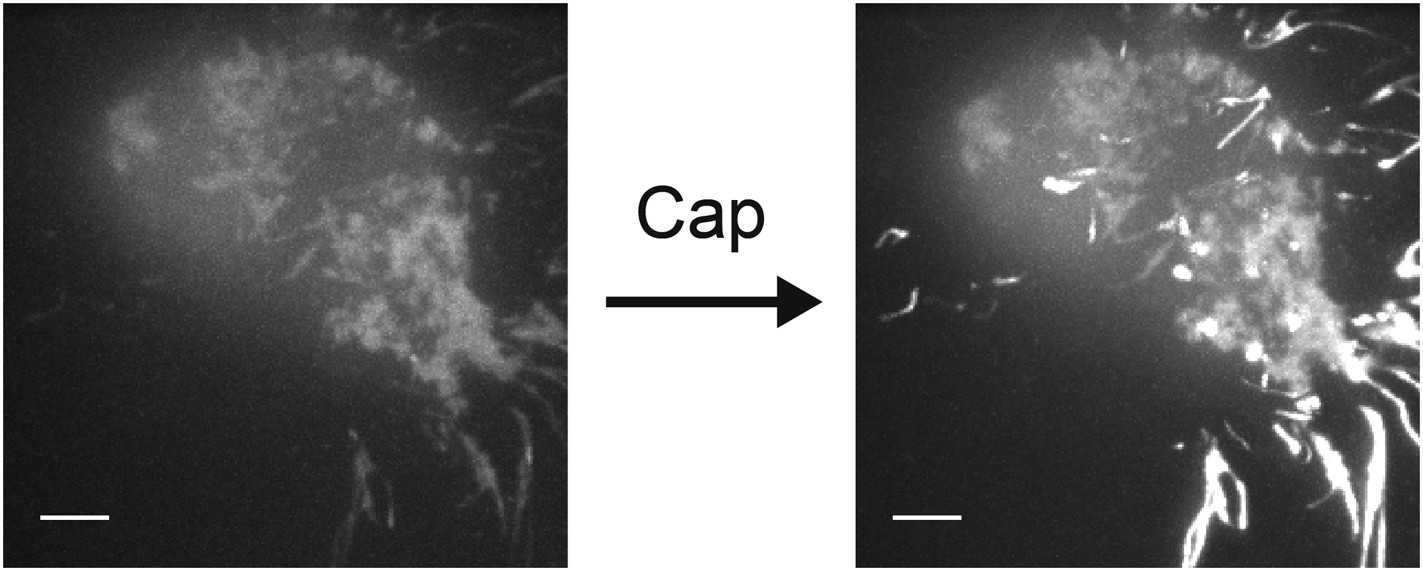
Increase in fluorescence intensity due to Ca2+ influx into F11 cell transfected with TRPV1-tagRFP, with Fluo-4 introduced via the whole-cell patch pipette.
The two images of the F11 cell are a projection of bright pixels in a set of images before capsaicin was added (left) followed by a projection of bright pixels in a set of images after capsaicin was added (right) (see Video 5). Scale bars are 5 µm.
Figure 2 with 1 supplement
Fluorescence intensity traces of immobile sparklet sites in cells loaded with Fluo-5F and extracellular buffer containing 20 mM Ca2+ and voltage-clamped as described in ‘Materials and methods’.
(A) Without Ca2+ in the extracellular buffer very little green fluorescence was observed in the capsaicin-treated (100 nM) HEK293T/17 cell that was transiently transfected with TRPV1-tagRFP. The image in the top panel was acquired after a 30 s exposure to capsaicin. Addition of 20 mM Ca2+ to the extracellular buffer increased the fluorescence of the cell footprint dramatically and individual sparklet sites could be observed (indicated with white arrowheads in bottom panel). TIRF images have matching lookup table (LUT) values and have not been otherwise altered. Scale bar is 5 µm. (B) Representative trace of sparklet from TRPV1-tagRFP expressing HEK293T/17 cell. (C) All points histogram of trace in (B). (D) Mean fluorescence intensity (ΔF/F0) and (E) open probability (Popen) of dorsal root ganglion sparklets (Blue; same data as in Figure 1C,D) and TRPV1-tagRFP sparklets in HEK293T/17 cells (green; N = 4). Cut-off for ‘open’ is when intensity (ΔF/F0) exceeded 0.05. See Video 7.
Figure 2—figure supplement 1
Fluorescence intensity traces of TRPV1-independent Ca2+ events in HEK293T/17 cells loaded with Fluo-5F, with extracellular buffer containing 20 mM Ca2+, and studied with whole-cell voltage clamp as described in ‘Materials and methods’.
(A) Representative trace of Ca2+ events in an untransfected cell. (B) All points histogram of trace in (A).
Figure 3

Photobleachstep analysis of TRPV1-GFP in fixed HEK293T/17 cells.
(A) Fluorescence time traces of six representative TRPV1-GFP features. Arrowheads indicate individual photobleach steps (B) Histogram of TRPV1-GFP bleach steps in fixed HEK293T/17 cells. TRPV1-GFP fluorescence is characterized as having 1–4 bleaching steps (blue). A zero-truncated binomial distribution fit by maximum likelihood estimate with n = 4 to give a probability of 0.45 (red) (χ2 goodness-of-fit is 0.1712 and the model is acceptable). (C) Fits to zero-truncated binomial distributions with n = 5 (cyan) or n = 8 (green) by maximum likelihood estimate gave probabilities of 0.35 and 0.21, respectively. Chi-squared goodness-of-fit tests were done with n = 5 and n = 8 models, yielding χ2 values of 4.0717 and 16.386, respectively.
Figure 4 with 1 supplement
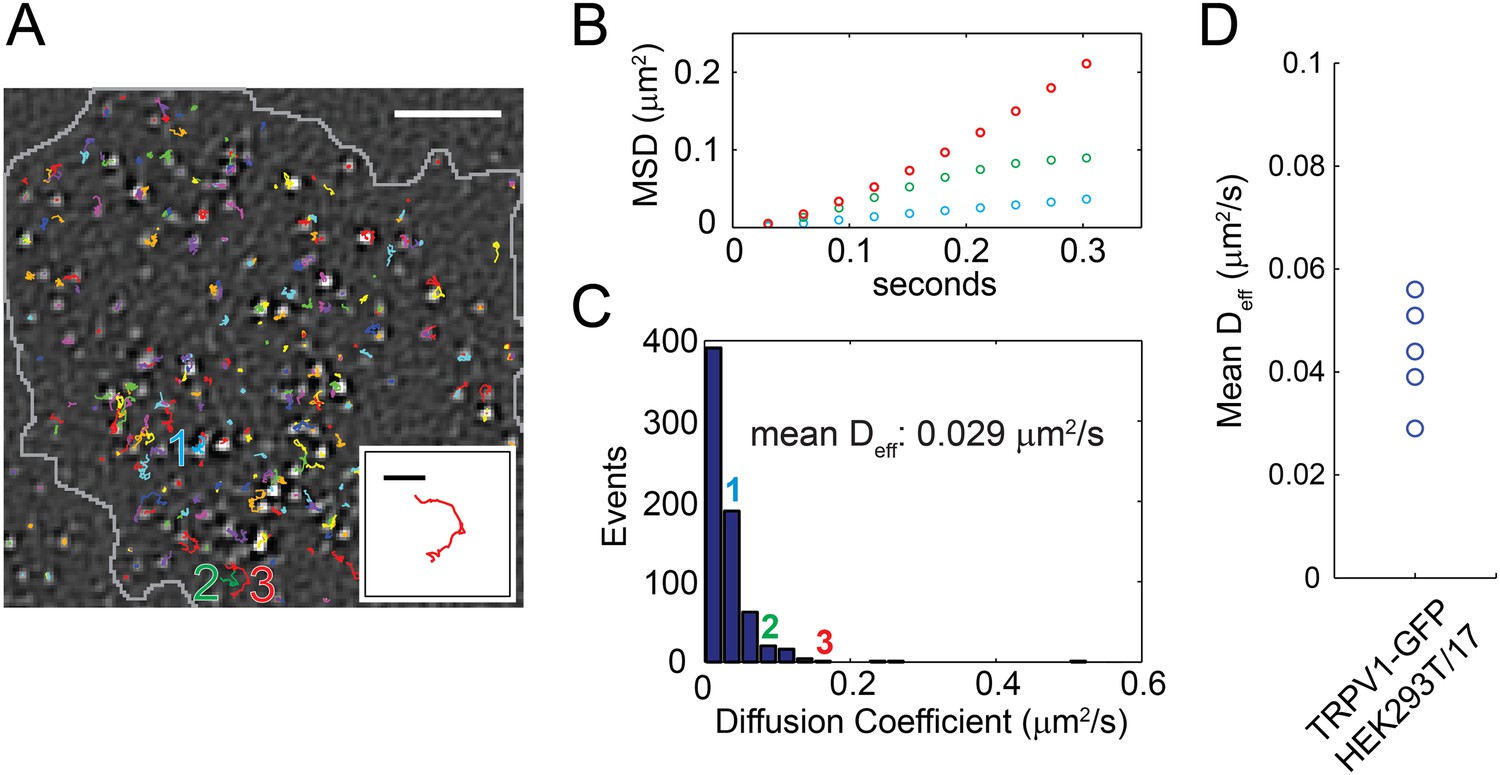
Distribution of TRPV1-GFP mobility in HEK293T/17 cell (not voltage-clamped; see ‘Materials and methods’).
(A) TRPV1-GFP channel tracks in a 200 frame video (33 frames per second). Tracks are identified with the u-track algorithm (see ‘Materials and methods’) and are overlaid on the final image of the series (See Video 8). Extent of cell body is shown in grey. The inset is an isolated track from the bottom center of the larger panel labeled ‘3’. (B) Mean square displacements (MSD) at different time lags of three tracks identified as 1 (blue), 2 (green), and 3 (red) in (A). (C) A Histogram of effective diffusion coefficients derived from tracks in the full 15 s video for the cell shown in (A). Tracks identified as 1, 2, and 3 in (A) are indicated over their assigned bins. (D) Mean effective diffusion coefficients calculated from TRPV1-GFP tracks in HEK293T/17 cells (N = 5). Scale bar of image in (A) is 5 µm and inset scale bar is 1 µm.
Figure 4—figure supplement 1
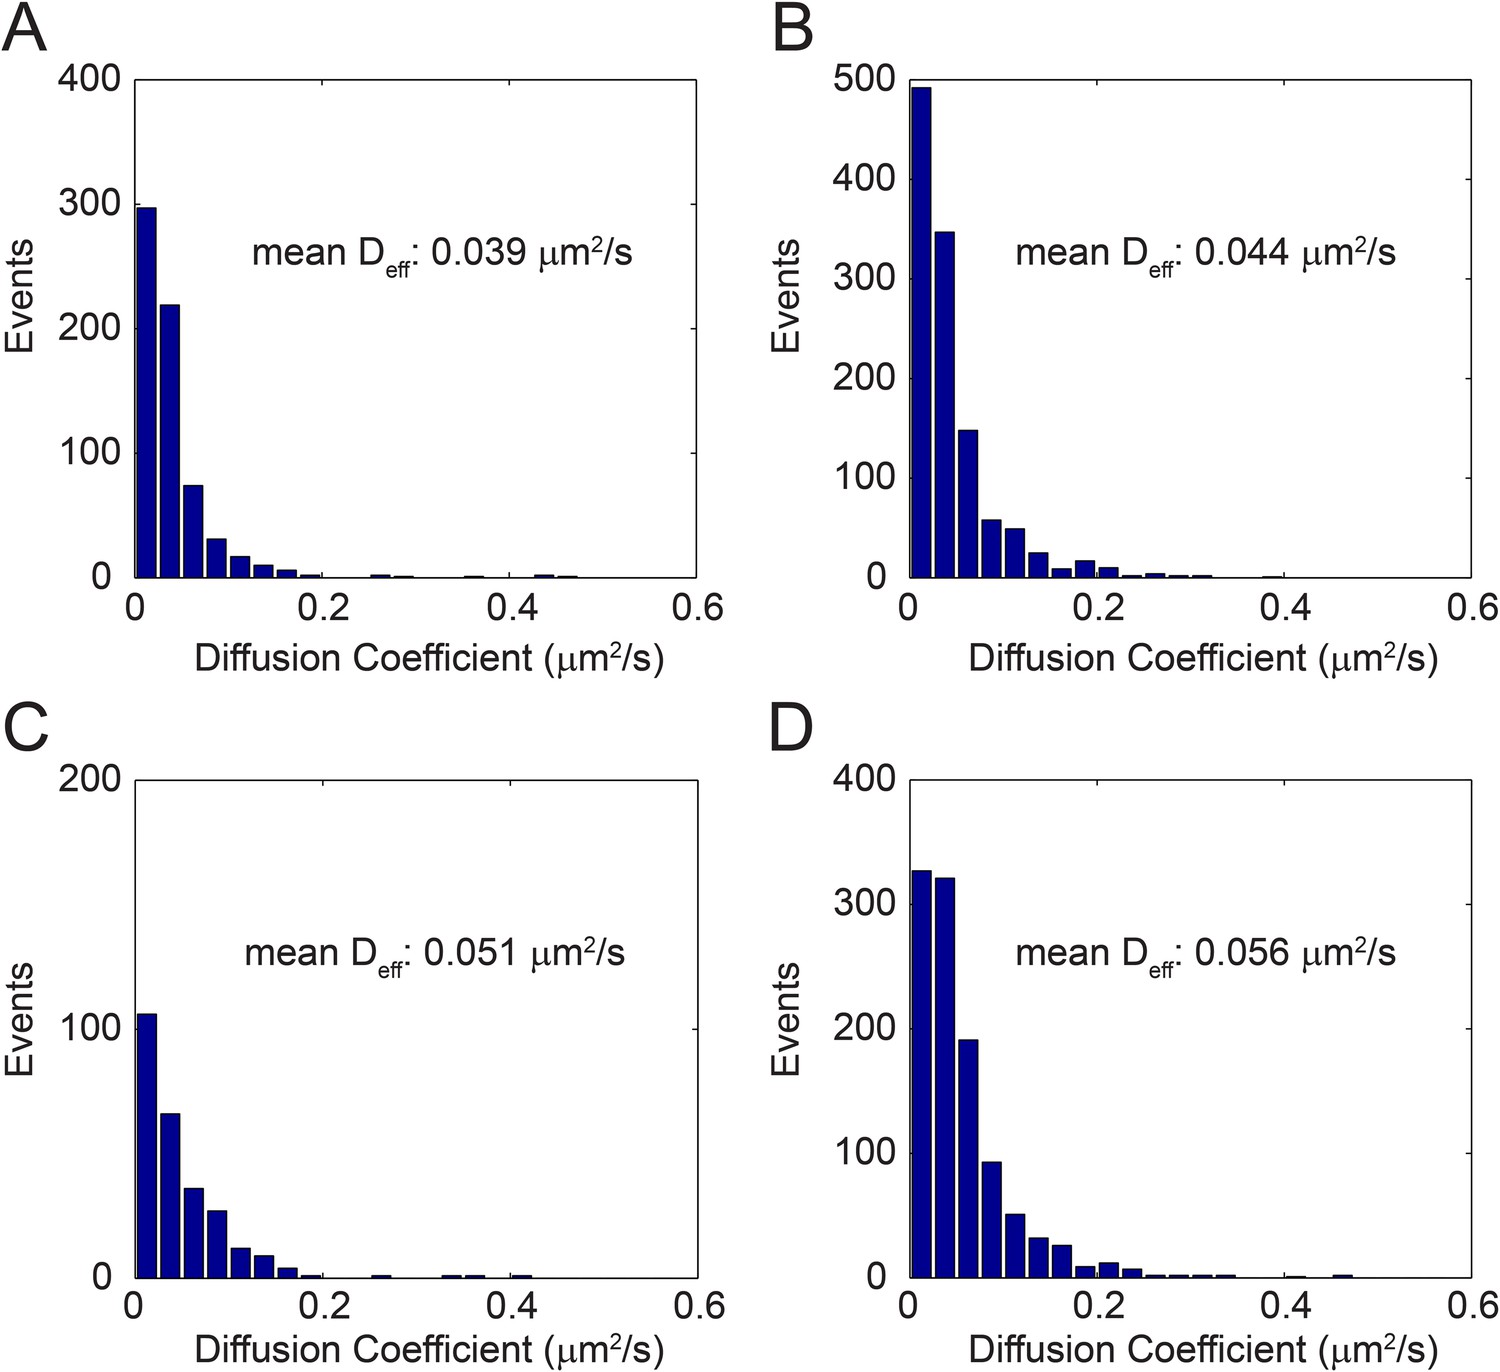
Distribution of effective diffusion coefficient (Deff) in different cells (A–D).
Each event accounts for the effective diffusion coefficient (Deff) calculated from a time lag of 1–10 frames in a single TRPV1-GFP track (See ‘Materials and methods’).
Figure 5
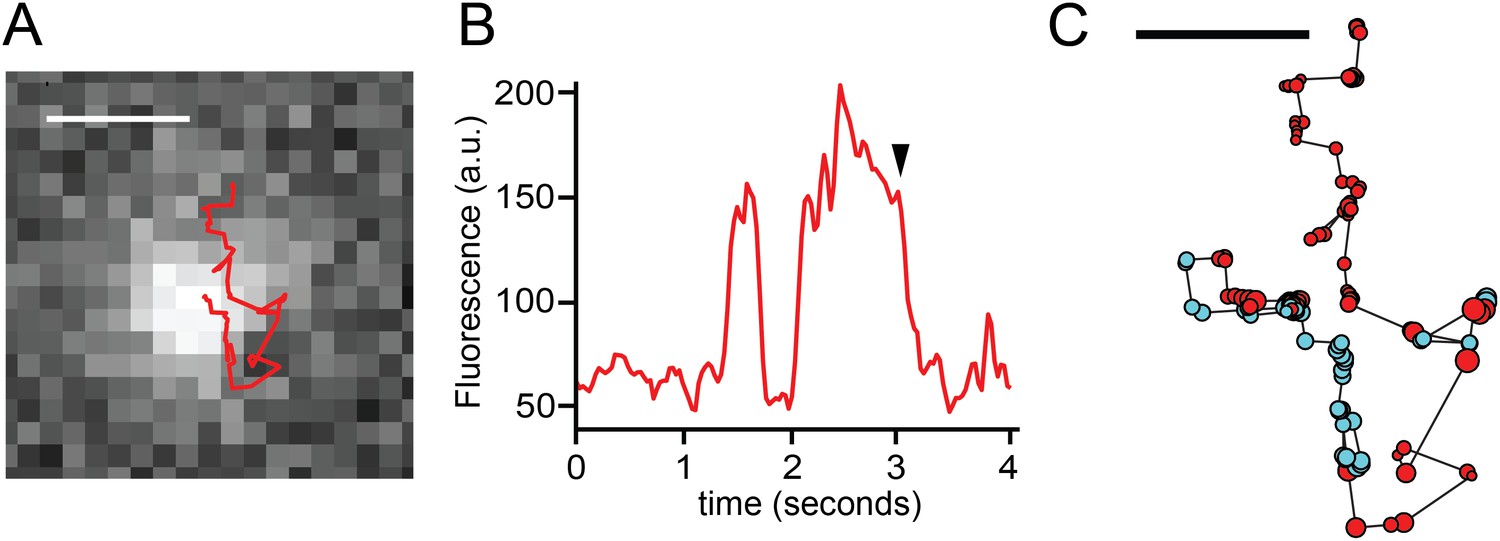
TRPV1-GFP and sparklet observed in a moving channel in a voltage-clamped HEK293T/17 cell.
(A) Track of TRPV1-GFP with increased sparklet intensity. Scale bar is 1 μm. (B) Fluorescence intensity trace of mobile TRPV1-GFP channel in (A) with sustained higher levels of fluorescence due to sparklet activity. The background image in (A) corresponds to the time annotated with an arrowhead in panel (B). (C) TRPV1-GFP and sparklet positions are shown as filled circles. Red circles are positions assigned to TRPV1-GFP and cyan circles are sparklet positions. Each circle's radius is 1/10 of the standard deviation attributed to the 2-D bivariate Gaussian fitted to the fluorescence feature at that position. Scale bar is 0.5 μm. See Videos 9 and 10.
Figure 6 with 2 supplements

Mobility change in TRPV1-GFP channels after capsaicin treatment in cells not subject to voltage clamp.
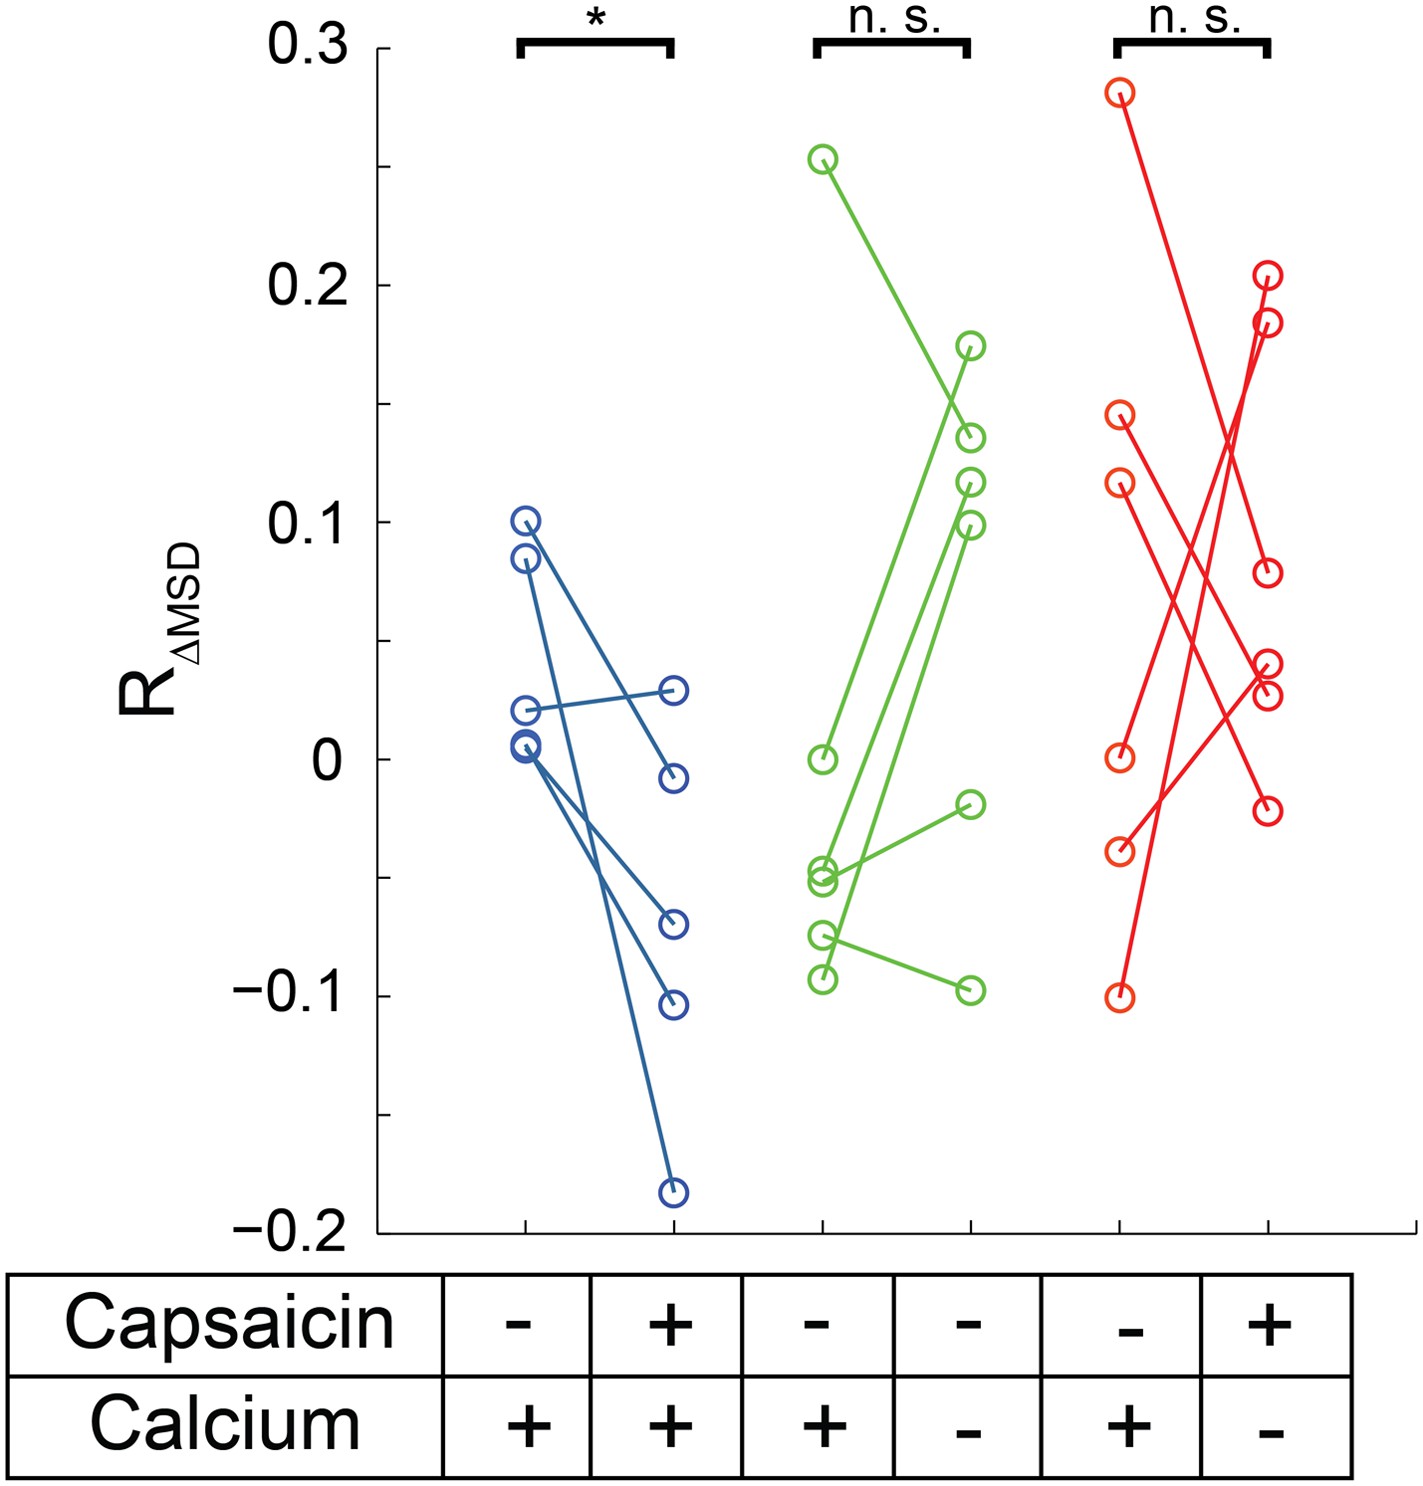
(A) HEK293T/17 cells expressing low numbers of TRPV1-GFP are initially imaged for 15 s and then a second 15 s video follows perfusion with a 1 μM capsaicin solution (described in ‘Materials and methods’). All three treatment conditions begin in HBSS (containing Ca2+) with no capsaicin. Average MSD (time lag of 90 msec) for all tracks shows no significant change in mobility from before to after capsaicin. (B) Using the same source data, we characterize mobility with the MSD difference ratio (RΔMSD, described in ‘Materials and methods’ and Figure 6—figure supplement 1). With the switch from no capsaicin to 1 μM capsaicin but maintaining the Ca2+ concentration at 1.8 mM, the RΔMSD drops a significant amount from the initial condition (N = 5, blue data points) as determined by a one-tailed paired t-test (p < 0.01). This significant drop in RΔMSD from the initial video to the second video is not observed under conditions where the second solution contains no capsaicin and no added Ca2+ (N = 6 cells, green data points; n.s.: not significant) nor is it seen when the second solution contains capsaicin (1 μM) but no added Ca2+ (N = 6 cells, red data points).
Figure 6—figure supplement 1
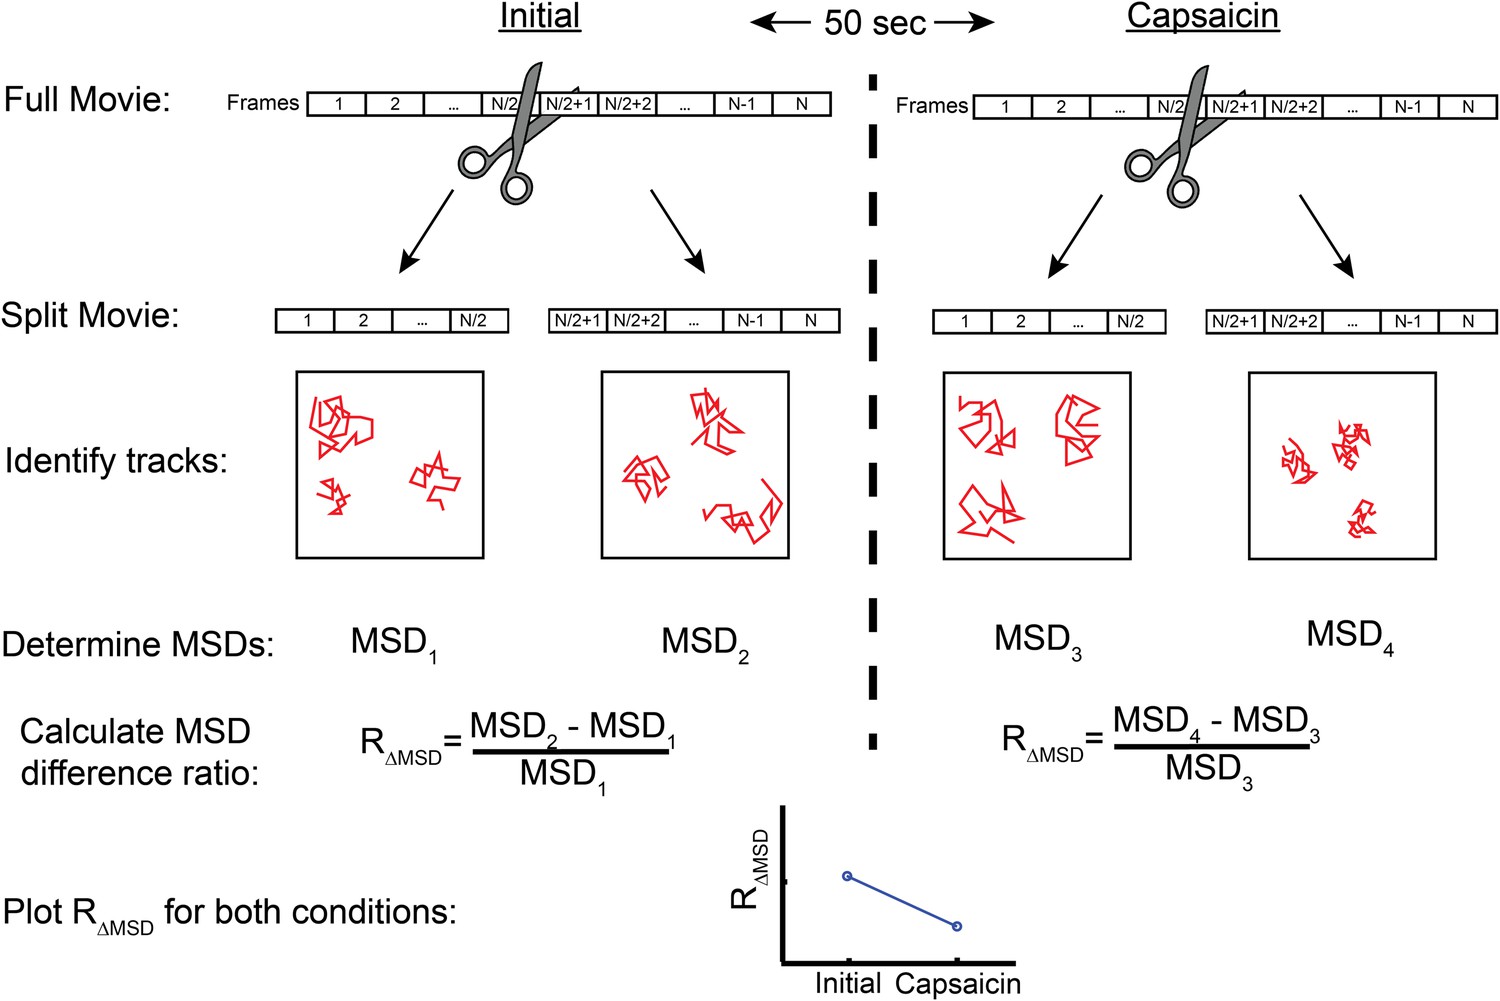
Flow diagram detailing MSD difference ratio (RΔMSD) calculation from top to bottom.
Videos taken initially or after treatment (beginning 50 s after end of first video) are split into two parts. Each part has the MSD calculated for each trajectory with the time lag set to 90 or 120 msec (3 or 4 frames, respectively for Figure 6 or Figure 6—figure supplement 2) before averaging these to acquire a mean for the set of trajectories, giving MSD1, MSD2, MSD3, and MSD4. The MSD difference ratio is expressed as the difference between the first part MSD and the second part MSD (i.e. MSD2-MSD1 in initial video) divided by the first part (MSD1 in initial video).
Figure 6—figure supplement 2
Mobility change in MSD calculated for 120 msec with TRPV1-GFP channels after capsaicin treatment.
Using the same source data as in Figure 6 but with the time lag set to 120 msec (4 frames), we characterized mobility with the MSD difference ratio (RΔMSD, described in ‘Materials and methods’ and Figure 6—figure supplement 1). With the switch from no capsaicin to 1 μM capsaicin but maintaining the Ca2+ concentration at 1.8 mM, the RΔMSD drops a significant amount from the initial condition (N = 5, blue data points) as determined by a one-tailed paired t-test (p < 0.05). This significant drop in RΔMSD from the initial video to the later video is not observed under conditions where the second solution contains no capsaicin and no added Ca2+ (N = 6 cells, green data points; n.s.: not significant) nor is it seen when the second solution contains capsaicin (1 μM) but no Ca2+ (N = 6 cells, red data points).
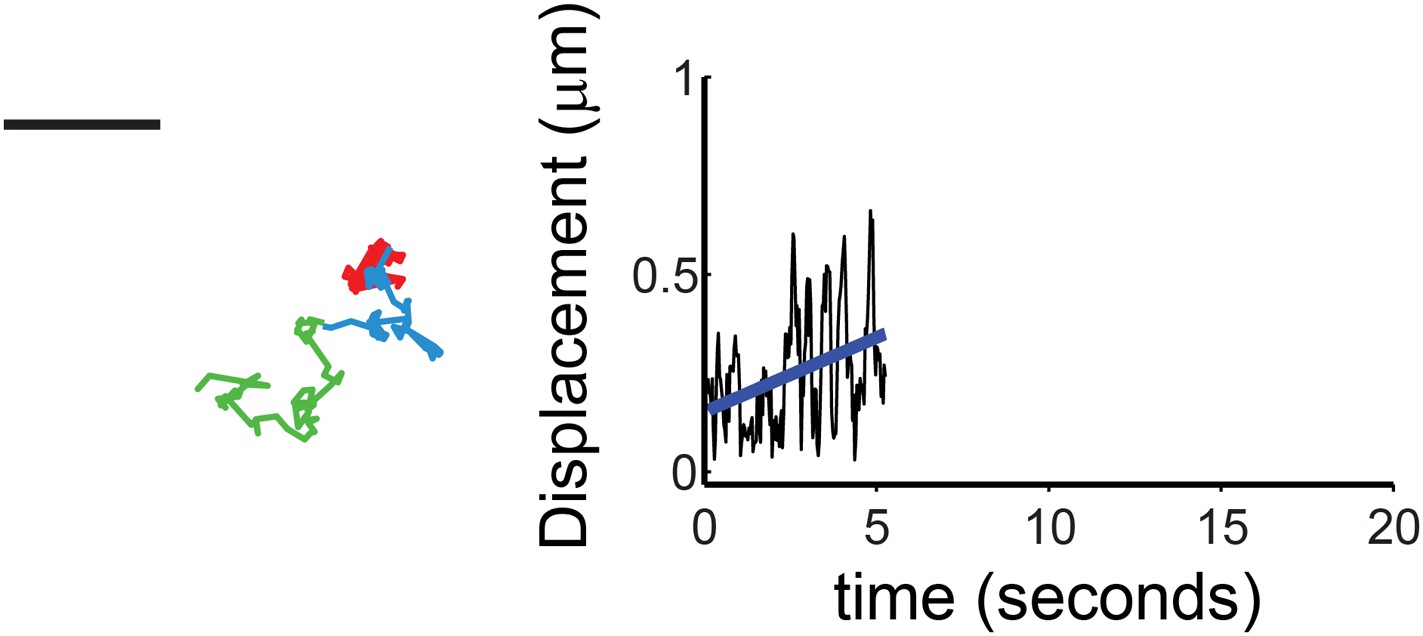
Figure 7 with 1 supplement
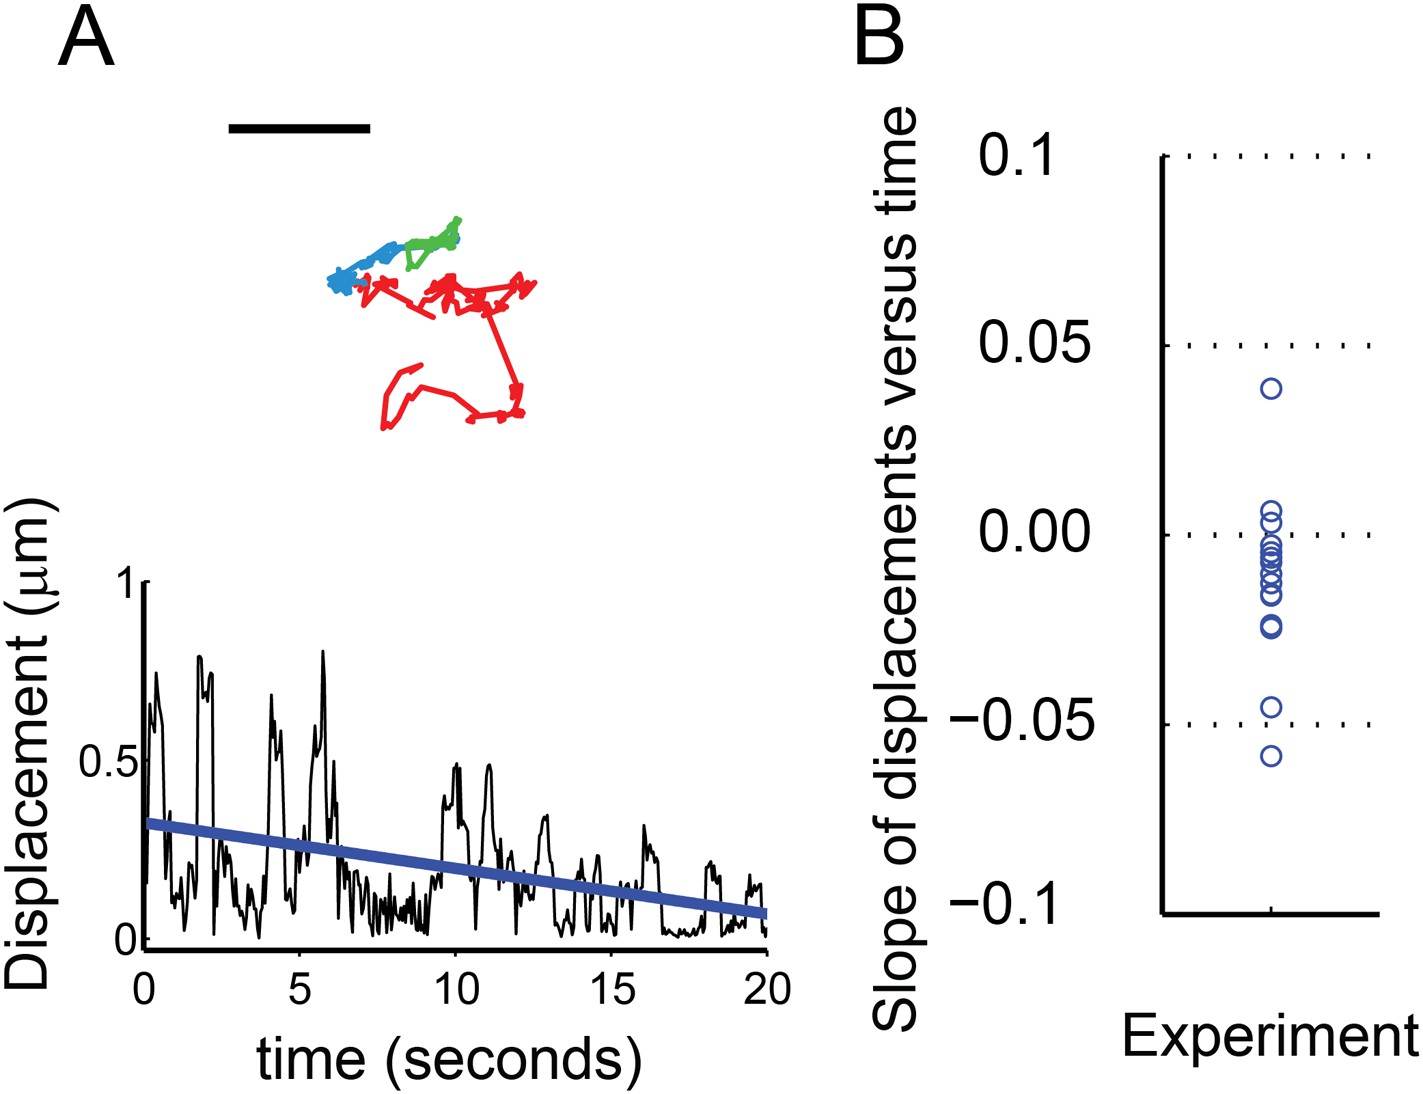
Characterization of mobile TRPV1 sparklets in voltage-clamped HEK293T/17 cells.
(A) Trajectory of sparklet with decreasing mobility. The total steps of the trajectory are divided into three equal parts representing the first third (red), the second third (blue) and the last third (green) of each track. Scale bar is 1 μm. Displacement (see ‘Materials and methods’) plot of sparklet in (A) is shown below. The blue line is the slope used to characterize the change in displacements over time. (B) Slopes corresponding to the change in displacements of mobile sparklets (N = 16) in density plot with the center of the distribution located below 0.0.
Figure 7—figure supplement 1
Characterization of mobile TRPV1 sparklets in voltage-clamped HEK293T/17 cells.
(Left) A representative trajectory of sparklet with increasing mobility is shown with the same color coding for the track as in Figure 7. Scale bar is 1 μm. Displacement (see ‘Materials and methods’) plot of sparklet is shown to the right. The blue line is the slope used to characterize the change in displacements over time.
Videos
Video 1
Immobile sparklet (white circle) in dorsal root ganglion cell with fluorescence recording on the right elicited by capsaicin (100 nM).
Scale bar is 5 μm.
Video 2
Moving sparklet observed in whole cell patch clamped dorsal root ganglion cell after addition of capsaicin (100 nM).
Fluo-4 is loaded into cell as an indicator for Ca2+ influx. Track of sparklet is super-imposed in red. Scale bar is 5 μm.
Video 3
Numerous mobile sparklets in whole cell patch clamped dorsal root ganglion cell after addition of capsaicin (100 nM).
Scale bar is 5 μm.
Video 4
Immobile and mobile sparklets in TRPV1-tagRFP transfected F11 cell after addition of capsaicin (100 nM).
Arrow indicates the site where a moving sparklet appears in a process at 7.75 s. This video is an exception in that the frame rate is 20 Hz. Scale bar is 5 µm.
Video 5
Sparklets occurring in TRPV1-tagRFP transfected F11 cell after addition of capsaicin (100 nM).
Pinpoint accuracy of sparklets is complicated by the uneven cell footprint within the TIRF evanescent field. Scale bar is 5 µm. See Figure 1—figure supplement 2.
Video 6
Immobile and mobile sparklets in TRPV1-GFP transfected HEK293T/17 cell after addition of capsaicin (100 nM).
TRPV1-GFP fluorescence is observed in the first part of the video, and fluorescent sparklets become the dominant signal in second half of video with both mobile (bottom middle) and immobile sparklets present. Scale bar is 5 μm.
Video 7
Immobile sparklet used to analyze TRPV1-tagRFP sparklet intensity levels (See Figure 2B).
Scale bar is 5 μm.
Video 8
Video of TRPV1-GFP tracks in transfected HEK293T/17 cell (See Figure 4).
Scale bar is 5 μm.
Video 9
The TRPV1-GFP channel in the left video can be followed as a GFP feature as of 0.0 s with intermittent sparklet activity and at 6.33 s is a sparklet feature for the majority of the time.
Scale is 6.25 pixels per 1 μm.
Video 10
Video with expanded view of Figure 5A and Video 9.
This video shows the highly dynamic pool of TRPV1-GFP features before capsaicin (100 nM) opens the channels and the GFP signal is overwhelmed by sparklet activity and background Ca2+ levels. Box indicates the approximate location of the ROI used for Figure 5 and Video 9. Scale bar is 5 μm.
Download links
A two-part list of links to download the article, or parts of the article, in various formats.
Downloads (link to download the article as PDF)
Open citations (links to open the citations from this article in various online reference manager services)
Cite this article (links to download the citations from this article in formats compatible with various reference manager tools)
Activity and Ca2+ regulate the mobility of TRPV1 channels in the plasma membrane of sensory neurons
eLife 4:e03819.
https://doi.org/10.7554/eLife.03819


